The Impact of Compulsory Licensing on Foreign Direct Investment: A ...
Compulsory Licensing Evidence from the Trading with the Enemy Act∗
∗ We thank Andrea Pozzi, Giacomo De Giorgi, Eric Hilt, and seminar participants at Arizona, Chicago, and the Stanford Junior Faculty lunch for helpful comments. We owe special thanks to Ryan Lampe for helping us to collect the U.S. patent data and Kathryn Steen for sharing her copies of archival records from the Chemical Foundation that are no longer publicly available. Adam Tarhouni, Emily Rains, Leah Carlin, Luke Brennan, Marina Kutyavina, and Stephanie Lee provided excellent research assistance. We thank the NBER’s Group on Innovation Policy and the Economy and the Kauffman Foundation for financial support.
Petra Moser, Stanford University and NBER, and Alessandra Voena, Stanford University
February 3, 2009
Compulsory licensing, which is permissible under the Trade Related Intellectual Property Rights (TRIPS) agreement, allows domestic firms to produce inventions that are patented by foreign nationals, without the consent of patent owners. As an emergency measure, compulsory licensing offers obvious benefits: It helps to deliver life-saving drugs to millions of patients. The long run effects of compulsory licensing, however, are unclear. This paper uses an exogenous change in compulsory licensing as a result of World War I to measure the long-run effects of compulsory licensing. Specifically, the analysis compares changes in patents by domestic inventors across technologies that were differentially affected by compulsory licensing under the Trading with the Enemy Act (TWEA). Our data suggest that compulsory licensing has a large positive effect on domestic invention. This effect increases with the number and with the novelty of licensed patents. Our data also show that the full effects of compulsory licensing take up to ten years to materialize, suggesting that they will be missed in analyses of contemporary data.
1
Compulsory licensing has been advanced (and used) as a policy tool to deliver life-saving
drugs to millions of patients in developing countries (Kremer 2002, Galvão 2002, Gostin
2006). Under this policy, which is permissible under the Trade Related Intellectual
Property Rights (TRIPS) agreement and WTO’s Doha Round,1
The long run effects of compulsory licensing, however, are unclear.
Pharmaceutical companies, especially in the United States and Europe, have argued that it
reduces their incentives to invest in R&D, and may thereby reduce long-term access of
patients in developing countries to new drugs. For example, Merck declared in response to
Brazil’s compulsory license that “expropriation of intellectual property sends a chilling
signal to research-based companies about the attractiveness of undertaking risky research
on diseases that affect the developing world, potentially hurting patients who may require
new and innovative life-saving therapies” (Intellectual Property Watch, May 7, 2007). On
the other hand, compulsory licensing may promote invention as it enables a new set of
firms to gain experience with producing the invention, which creates opportunities for
learning by doing (e.g., Arrow 1962, Irwin and Klenow 1994) and strengthens incentives
to invest in scientific training and other skills that encourage invention.
governments grant
domestic firms the right to produce inventions that are patented by foreign nationals,
without the consent of patent owners.
As an emergency measure, compulsory licensing offers clear short-term benefits: It
provides quick access to medicines and other essential inventions that have been invented
abroad. For example, Thailand and Brazil have been able to supply hundreds of thousands
of HIV patients with a generic version of Merck’s HIV drug efavirenz after they allowed
compulsory licensing of this effective, but expensive drug.
2
1 In general, TRIPS Art.31 allows compulsory licenses after negotiations for voluntary licenses have failed. In cases of emergency, TRIPS allows governments to grant compulsory licenses without first trying to negotiate. The World Trade Organization (WTO) Doha Declaration of 2001 emphasized developing countries’ rights to issue compulsory licenses: “Each member has the right to grant compulsory licenses and the freedom to determine the grounds upon which such licenses are granted.” (WT/MIN(01)/DEC/1, Art. 5.b) 2 Previous work has focused on compulsory licensing as a mechanism to address anti-competitive patenting behavior in domestic markets. In such settings, the policy is thought to be primarily welfare-enhancing. Thus compulsory licenses can increase overall welfare by encouraging the optimal trade-off between incentives for R&D and the dead weight loss of long-lived patents (Tandon 1982, Gilbert and Shapiro 1990). Case studies suggest that court-ordered compulsory licenses lower neither the research efforts (as measured in R&D dollars) nor the number of inventions (as measured in patents) of firms whose patents were subjected to compulsory licensing (Chien 2003).
2
This paper uses an exogenous event of compulsory licensing as a result of World
War I to identify the long run effects of compulsory licensing. Specifically, we examine
changes in the number of domestic inventors across technologies that were differentially
affected by the Trading with the Enemy Act (TWEA). Passed by Congress in November
1917, section 10 of this Act permitted U.S. firms to violate enemy-owned patents if they
contributed to the war effort. As the war dragged on, the Act became more and more
punitive (Steen 2001, p. 99). One week before the Armistice at Compiègne on November
11, 1918, Congress passed an amendment to the TWEA, confiscating all enemy-owned
patents, and by February 1919, German-owned patents were systematically licensed to
U.S. firms.
To measure the policy’s effects, it is necessary to control for other factors that may
also encourage domestic invention. Most importantly, improvements in education and in
scientific training, as well as changes increases in the demand for domestically produced
chemicals may also have increased encouraged domestic rates of invention. To address
this issue, our empirical strategy relies on a differences-in-differences estimation, which
compares changes in the number of domestic inventors across USPTO subclasses that were
differentially affected by the TWEA. Inventions in all of these subclasses were affected by
demand shocks and other factors that influenced invention, while only some subclasses
were affected by compulsory licensing.
We extend the basic difference-in-differences estimates to account for differences
in the intensity of treatment. Specifically, we repeat all tests using alternative measures of
treatment which control for variation in the number of licenses that were granted in a given
subclass and in the remaining lifetime of all patents that were licensed in that subclass.
To measure the intensity of treatment we have collected detailed information on
699 enemy-owned chemical patents that were licensed to U.S. firms. We use the
distribution of these licenses across USPTO classes, along with the distribution of the total
remaining years of patent life for all licensed patents across subclasses to construct three
alternative measures of treatment.
Our outcome variable consists of nearly 170,000 chemical patents between 1875
and 1939. To construct these data, we have collected information on all USPTO (main)
classes of organic chemicals that contained at least one license under the TWEA. Twenty-
3
one main classes were affected by the TWEA; they produced a total of 165,400 patents
between 1875 and 1939, which covered 8,422 subclasses; 336 of these subclasses where
affected by compulsory licensing. Our estimation use differences in the number of
domestic patentees across treated and untreated subclasses to identify the effects of
compulsory licensing.
OLS regressions indicate that compulsory licensing lead to a large increase in the
number of patents by domestic inventors. After 1919, when the average subclass had
about 0.7 patents per year, subclasses that were affected by compulsory licensing generated
an average of 0.12 additional domestic patents per year. Controlling for the intensity of
treatment shows that each additional license increased the number of domestic patents by
about one eleventh per year; adding ten years of patent life to the licensed patents in a
subclass increased domestic patents by 0.7 patents every ten years.
Our historical analysis has the additional benefit that it examines a much longer
time series than is available to contemporary studies. We use these data to examine the
timing of a potential effect of compulsory licensing on domestic invention. This analysis
reveals that the full effects of compulsory licensing on domestic invention set in only after
about 10 years, even though we observe some effects as early as 5 years after compulsory
licensing occurs. This result is robust to controlling for the intensity of treatment:
subclasses that received a larger number of licenses or a larger total number of remaining
years of patent life on their licenses experienced a larger and statistically significant
increase in patenting.
Although surprising, the lag between licensing and further invention are intuitive.
Compulsory licensing allows domestic firms to produce foreign technologies, but the
ability to invent new technologies is developed only gradually. First, technical
information in patent documents is rarely complete enough to replicate an invention. Not
unlike modern-day inventors, early 20th-century German inventors appear to have
intentionally omitted or scrambled information that was necessary to reconstruct what they
had done. Similar to inventors in developing countries today, early 20th-century U.S.
inventors also often simply did not have the skills that would have been necessary to
implement and extend the foreign inventions. Such skills took several years to acquire,
even as compulsory licensing granted access to foreign inventions. Thus, our historical
4
results suggest that it may take developing countries a decade or more to build their
inventive capacity under such circumstances.
Although our results suggest a significant long-run effect of compulsory licensing,
they may be compromised if not all aspects of the TWEA were exogenous. The timing of
the TWEA was caused by World War I, which is exogenous to our outcome variable.
Which technologies were confiscated is also exogenous, because the United States
confiscated all enemy-owned property. Which technologies were licensed, however, may
not be exogenous. For example, U.S. inventors may have been more likely to license
technologies in technological fields where the domestic capacity for invention was low. If
these classes experience a weaker increase in invention after the TWEA, because domestic
inventors first had to bridge the knowledge gap that separated them from inventors in other
countries, OLS will underestimate the effects of compulsory licensing. If on the other
hand, invention grew more quickly in these classes, because demand for domestic
inventions was great, OLS will overestimate the effects of compulsory licensing.
We address this issue by a triple differences estimation. Specifically, we account
for unobservable characteristics that may have encouraged patenting by all non-German
inventors by comparing patents by U.S. and foreign (non-German) inventors across more
or less treated subclasses before and after the TWEA. Results from triple differences
estimation suggest a slightly smaller positive effect on domestic invention, but they
confirm that the TWEA lead to a substantial increase in patenting by domestic inventors,
and that this effect took about a decade to fully materialize.
Our results are robust to a broad range of alternative robustness checks. First, we
control for subclass-specific time trends and find that the results are robust to including
such trends. Second, to address the potential of serial correlation in the outcome variable
patents within subclasses, we perform a block bootstrap; it confirms that the estimation
coefficients are highly significant. Third, we restrict our sample to primary subclasses,
excluding all secondary subclasses, which the USPTO adds to cross-reference inventions
across related fields; restricting the sample to primary subclasses has no significant effect
on the coefficients. Fourth, to control for a potential shift in demand as a result of World
War I, we examine variation across treated and untreated subclasses within a specific
chemical - indigo - that was most affected by a shock in demand. Even with a strong
5
demand shock, patenting by domestic inventors increased substantially more in subclasses
that were (more) affected by compulsory licensing. Finally, to check whether our results
might be due to random variation, we repeat the estimation with a variety of placebo
treatments; none of the placebos replicate the observed increase in domestic patents.
The remainder of this paper is structured as follows. Section I describes why the
TWEA offers a useful experiment to examine the effects of compulsory licensing, section
II presents our empirical strategy. Section III details our data collection and discusses
potential sources of bias. Section IV presents our results, Section V presents robustness
checks, and Section VI concludes.
I. The TWEA as a Natural Experiment of Compulsory Licensing
Created by an act of Congress on October 6, 1917, the TWEA was intended to
“dislodge(e) the hostile Hun within our gates” (Alien Property Custodian 1919, p.17) to
destroy “Germany’s great industrial army on American soil”, its “spy centers”, and “nests
of sedition” (Alien Property Custodian 1919, p.14). To this end, the TWEA placed all
enemy property “beyond the control of influence of its former owners, where it can not
eventually yield aid or comfort to the enemy” (Alien Property Custodian 1919, p. 13). 3
By February 22, 1919, Mitchell Palmer, the Alien Property Custodian and
President of the Bureau of Investigation felt comfortable to say that “practically all known
On March 28, 1918, the TWEA was amended to give the Custodian the power to
sell enemy property, including all enemy-owned patents “as though he were the owner
thereof” (Alien Property Custodian 1919, p.22). Thus, the Alien Property Custodian began
to take over any patent owned by “enemy persons” and corporations doing business in
Germany, Austria-Hungary, Bulgaria, and Turkey, as well as the occupied parts of
Belgium, France, Russia, and the Balkans (Alien Property Custodian 1919 p.7),
administering these properties as a trust.
3 The destruction of German property was also intended to prevent Germany from starting another war: “…the great overshadowing result which has come from this war is the assurance of peace almost everlasting amongst the peoples of the earth. I would help to make that an absolute certainty by refusing to permit Germany to prosecute a war after the war. The military arm of her war machine has been palsied by the tremendous hammering of the allied powers. But her territory was not invaded, and if she can get out of the war with her home territory intact, rebuild a stable government and still have her foreign markets subject to her exploitation, by means no less foul and unfair than those which she has employed on the field of battle, we shall not be safe from future onslaughts different in methods, but with the same purpose that moved her on that fateful day in July when she set out to conquer the world.” (Alien Property Custodian, 1919, p.16)
6
enemy property in the United States has been taken over by me and is administered
according to the provisions of the trading with the enemy act” (Alien Property Custodian
1919, p.7). At that time, 35,400 reports of alien property had been received, and 32,296
trusts had been created, with a total value exceeding $500 million in 1919, equivalent to
4.7 billion in 2008 (Alien Property Custodian 1919, p.9).4
Our empirical strategy compares changes in invention by U.S. nationals across
chemicals that were differentially affected by the TWEA. Our unit of observation is the
number of patents by U.S. inventors in a USPTO subclass for each year between 1875 and
1939.
We focus our analysis on the early 20th century U.S. chemical industry, because
this industry closely resembles modern-day settings of compulsory licensing. Even though
the United States was one of the most developed economies of the early 20th century, its
chemical industry was immature. In the early 1910s, Germany produced three quarters of
the world’s supply of coal-tar dyes (USTC, 1918). Large companies like Badische, Bayer
and Hoechst captured most of this market. Between 1900 and 1910, 70 percent of all U.S.
patents for synthetic organics compounds were granted to German firms (USTC 1918,
Haynes 1945 p.214, Steen 2001). Imports from Germany provided up to 90 percent of
dyes for the flourishing U.S. textile industry (Haynes, 1945 p.214).
Compulsory licensing under the TWEA allowed the U.S. government to grant U.S.
firms access to German patents. By 1919, the Chemical Foundation began to license
enemy-owned patents to U.S. firms. In 1921 the foundation possessed 4,764 patents, 874
trademarks, and 492 copyrights. From 1919 to 1922, from which it licensed 103
manufacturers to use its patents; about half of the licensees were manufacturers of
synthetic organic chemicals. The foundation collected an income of $700,000, primarily
from royalties (Steen 2001, p.100).
II. Empirical Strategy
5
4 Using the GDP deflator as a conservative measure. Using the relative share of GDP, the 2008 equivalent would be 88 billion dollars (Williamson 2008)
This yields a basic regression equation of the following form:
5 The USPTO classifies patents according to technology fields. A (main) class generally distinguishes one technology from another. Subclasses, which are uniquely defined by alphanumeric symbols, differentiate technologies more finely according to specific characteristics and functional features. Each patent is assigned to one primary subclass and can be assigned to one or more secondary subclasses, which serve to
7
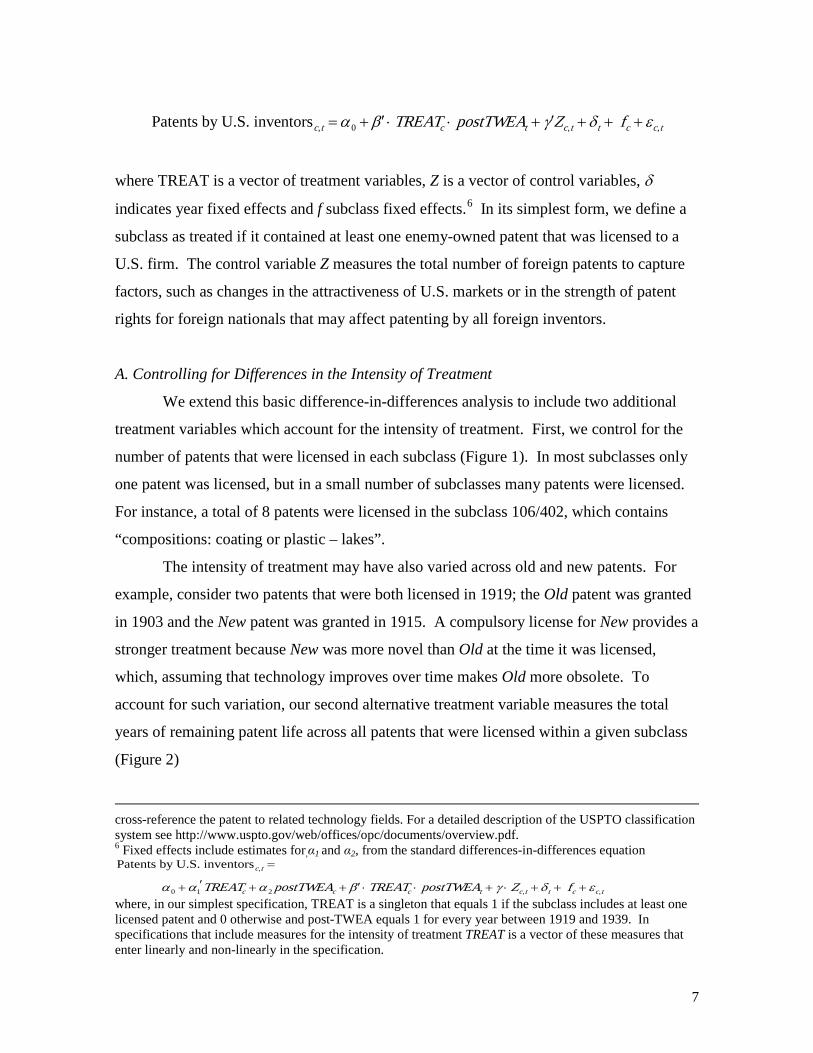
Patents by U.S. inventorsc,t = α0 + ′ β ⋅ TREATc ⋅ postTWEAt + ′ γ Zc,t + δt + fc + εc,t
where TREAT is a vector of treatment variables, Z is a vector of control variables, δ
indicates year fixed effects and f subclass fixed effects.6
cross-reference the patent to related technology fields. For a detailed description of the USPTO classification system see http://www.uspto.gov/web/offices/opc/documents/overview.pdf. 6 Fixed effects include estimates for,α1 and α2, from the standard differences-in-differences equation
In its simplest form, we define a
subclass as treated if it contained at least one enemy-owned patent that was licensed to a
U.S. firm. The control variable Z measures the total number of foreign patents to capture
factors, such as changes in the attractiveness of U.S. markets or in the strength of patent
rights for foreign nationals that may affect patenting by all foreign inventors.
A. Controlling for Differences in the Intensity of Treatment
We extend this basic difference-in-differences analysis to include two additional
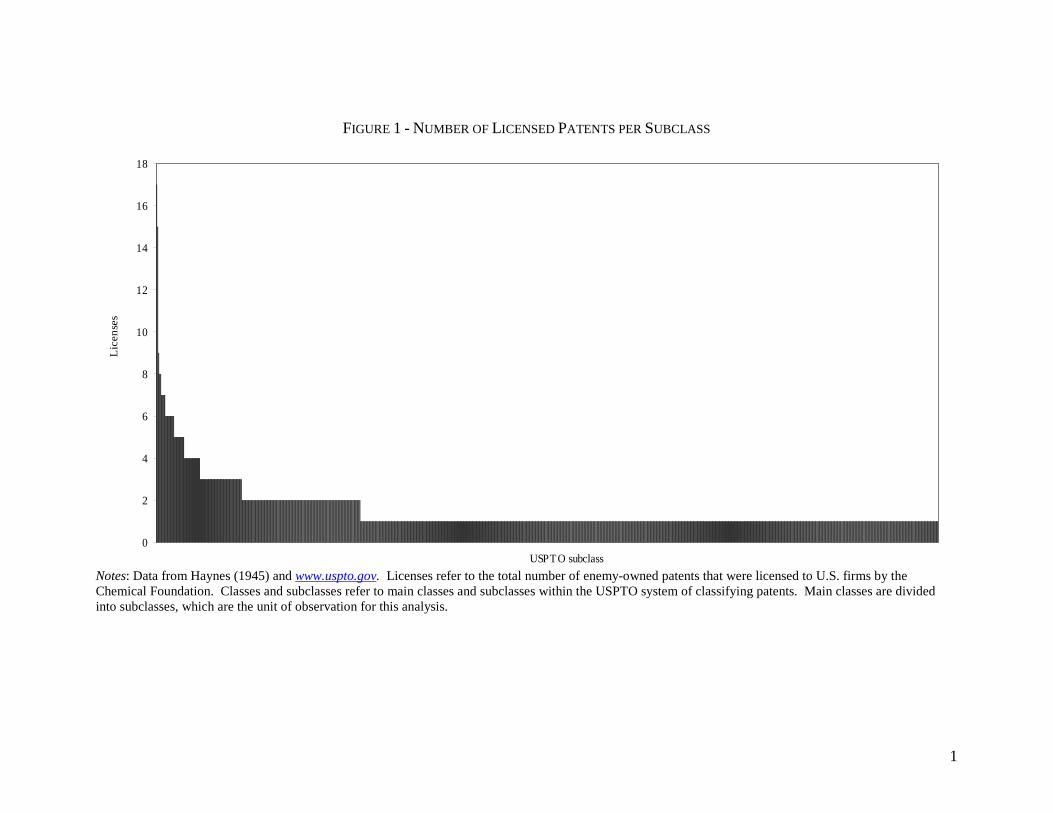
treatment variables which account for the intensity of treatment. First, we control for the
number of patents that were licensed in each subclass (Figure 1). In most subclasses only
one patent was licensed, but in a small number of subclasses many patents were licensed.
For instance, a total of 8 patents were licensed in the subclass 106/402, which contains
“compositions: coating or plastic – lakes”.
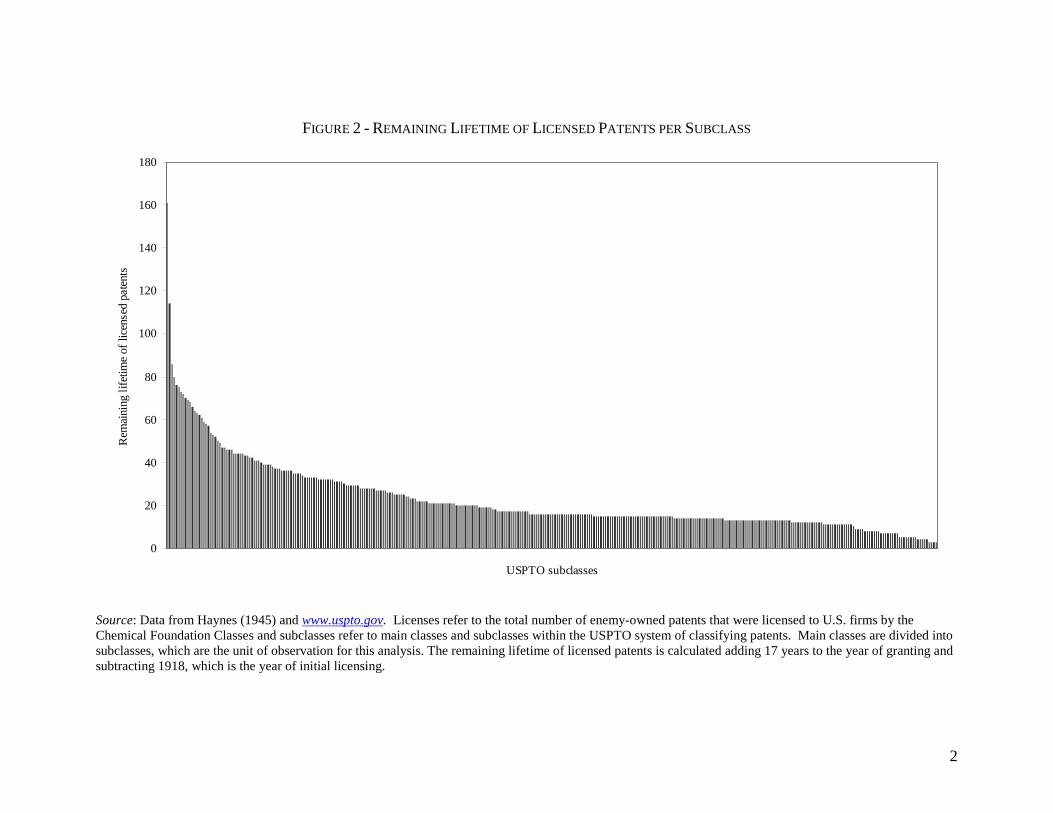
The intensity of treatment may have also varied across old and new patents. For
example, consider two patents that were both licensed in 1919; the Old patent was granted
in 1903 and the New patent was granted in 1915. A compulsory license for New provides a
stronger treatment because New was more novel than Old at the time it was licensed,
which, assuming that technology improves over time makes Old more obsolete. To
account for such variation, our second alternative treatment variable measures the total
years of remaining patent life across all patents that were licensed within a given subclass
(Figure 2)
Patents by U.S. inventorsc,t =
α0 + α1′TREATc + α2 postTWEAc + ′ β ⋅ TREATc ⋅ postTWEAt + γ ⋅ Zc,t + δt + fc + εc,t
where, in our simplest specification, TREAT is a singleton that equals 1 if the subclass includes at least one licensed patent and 0 otherwise and post-TWEA equals 1 for every year between 1919 and 1939. In specifications that include measures for the intensity of treatment TREAT is a vector of these measures that enter linearly and non-linearly in the specification.
8
(years of life of patent i in class c in 1918)i=1
I
∑ .
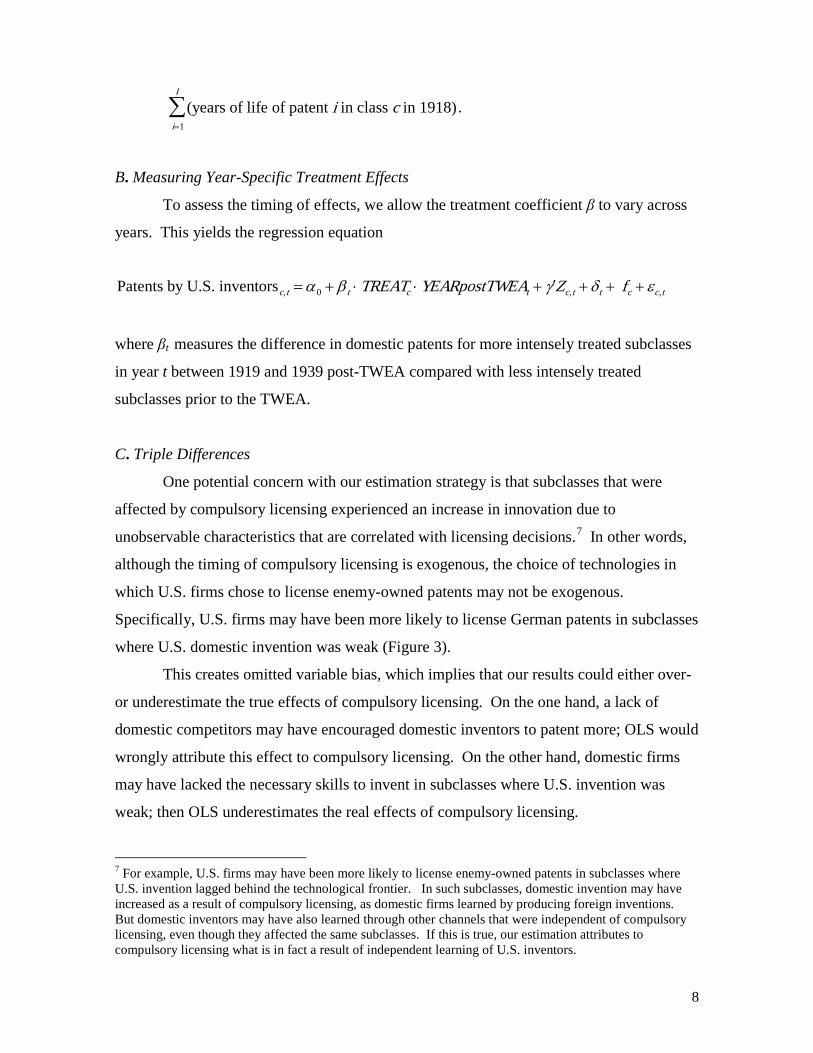
B. Measuring Year-Specific Treatment Effects
To assess the timing of effects, we allow the treatment coefficient β to vary across
years. This yields the regression equation
Patents by U.S. inventorsc,t = α0 + β t ⋅ TREATc ⋅YEARpostTWEAt + ′ γ Zc,t + δt + fc + εc,t
where βt measures the difference in domestic patents for more intensely treated subclasses
in year t between 1919 and 1939 post-TWEA compared with less intensely treated
subclasses prior to the TWEA.
C. Triple Differences
One potential concern with our estimation strategy is that subclasses that were
affected by compulsory licensing experienced an increase in innovation due to
unobservable characteristics that are correlated with licensing decisions.7
7 For example, U.S. firms may have been more likely to license enemy-owned patents in subclasses where U.S. invention lagged behind the technological frontier. In such subclasses, domestic invention may have increased as a result of compulsory licensing, as domestic firms learned by producing foreign inventions. But domestic inventors may have also learned through other channels that were independent of compulsory licensing, even though they affected the same subclasses. If this is true, our estimation attributes to compulsory licensing what is in fact a result of independent learning of U.S. inventors.
In other words,
although the timing of compulsory licensing is exogenous, the choice of technologies in
which U.S. firms chose to license enemy-owned patents may not be exogenous.
Specifically, U.S. firms may have been more likely to license German patents in subclasses
where U.S. domestic invention was weak (Figure 3).
This creates omitted variable bias, which implies that our results could either over-
or underestimate the true effects of compulsory licensing. On the one hand, a lack of
domestic competitors may have encouraged domestic inventors to patent more; OLS would
wrongly attribute this effect to compulsory licensing. On the other hand, domestic firms
may have lacked the necessary skills to invent in subclasses where U.S. invention was
weak; then OLS underestimates the real effects of compulsory licensing.
9
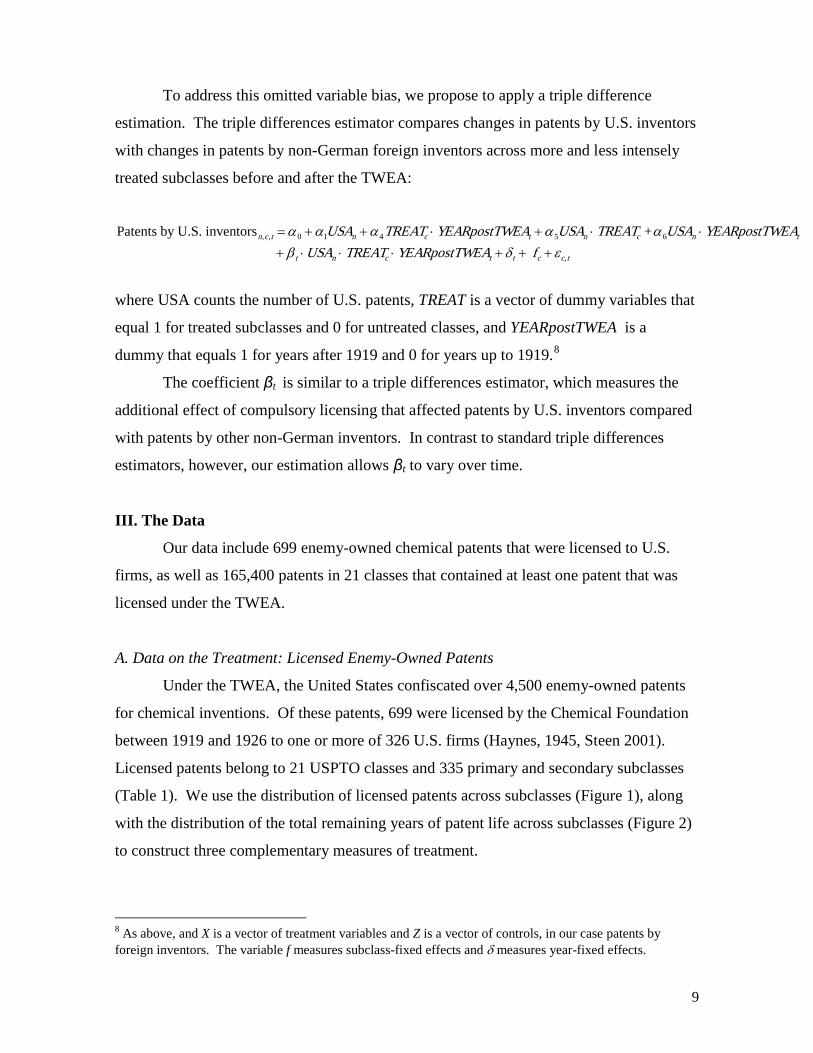
To address this omitted variable bias, we propose to apply a triple difference
estimation. The triple differences estimator compares changes in patents by U.S. inventors
with changes in patents by non-German foreign inventors across more and less intensely
treated subclasses before and after the TWEA:
Patents by U.S. inventorsn,c,t = α0 + α1USAn + α4TREATc ⋅YEARpostTWEAt + α5USAn ⋅ TREATc +α6USAn ⋅YEARpostTWEAt
+ βt ⋅ USAn ⋅ TREATc ⋅YEARpostTWEAt + δt + fc + εc,t
where USA counts the number of U.S. patents, TREAT is a vector of dummy variables that
equal 1 for treated subclasses and 0 for untreated classes, and YEARpostTWEA is a
dummy that equals 1 for years after 1919 and 0 for years up to 1919.8
8 As above, and X is a vector of treatment variables and Z is a vector of controls, in our case patents by foreign inventors. The variable f measures subclass-fixed effects and δ measures year-fixed effects.
The coefficient βt is similar to a triple differences estimator, which measures the
additional effect of compulsory licensing that affected patents by U.S. inventors compared
with patents by other non-German inventors. In contrast to standard triple differences
estimators, however, our estimation allows βt to vary over time.
III. The Data
Our data include 699 enemy-owned chemical patents that were licensed to U.S.
firms, as well as 165,400 patents in 21 classes that contained at least one patent that was
licensed under the TWEA.
A. Data on the Treatment: Licensed Enemy-Owned Patents
Under the TWEA, the United States confiscated over 4,500 enemy-owned patents
for chemical inventions. Of these patents, 699 were licensed by the Chemical Foundation
between 1919 and 1926 to one or more of 326 U.S. firms (Haynes, 1945, Steen 2001).
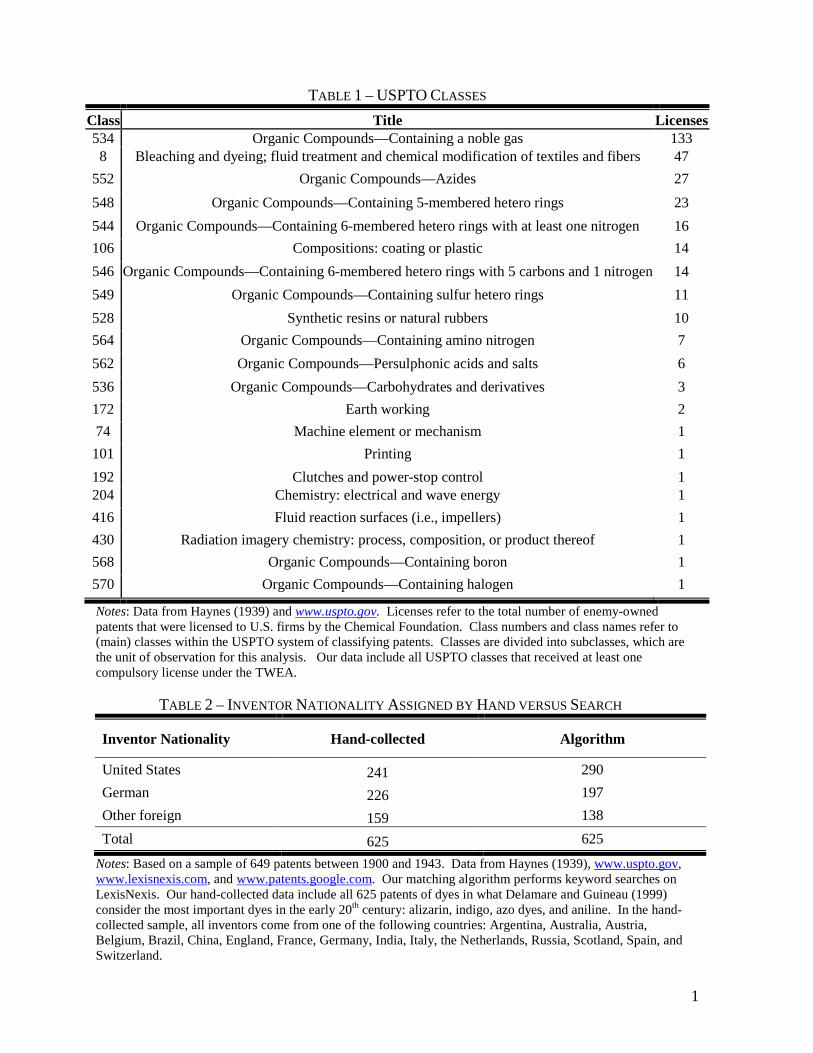
Licensed patents belong to 21 USPTO classes and 335 primary and secondary subclasses
(Table 1). We use the distribution of licensed patents across subclasses (Figure 1), along
with the distribution of the total remaining years of patent life across subclasses (Figure 2)
to construct three complementary measures of treatment.
10
B. Data on the Outcome: U.S. Patents 1875-1945
Our outcome variable is the number of patents by domestic inventors per subclass
and year. We have collected these data for all 21 USPTO main classes of chemicals that
included at least one patent that was licensed under the TWEA. Between 1875 and 1945,
these 21 classes included 165,400 patents, which we collect from the USPTO’s official
website (www.uspto.gov). These patents covered 8,422 subclasses of chemical inventions,
of which 336 were affected by the TWEA.
To be consistent with the literature, we measure patents at their grant instead of
application dates. Granted patents are a better measure of inventions because they exclude
patent applications that are denied by patent examiners, for example because the
application duplicates an invention that has already been patented. We are, nevertheless,
interested in the average lag between applications application and grant because we would
like to know when inventions that benefitted from compulsory licensing were made.
To estimate the average lag between application and grant dates, we have
constructed a sample of 493 patents between 1930 and 1933 that contain the word “dye.”
In this sample, the average patent is granted 3 years after the application date, with a 25
percentile of 2, a mode of 3, and a 75th percentile 4 years.9
9 To construct this sample, we searched
This implies that the average
invention that was granted a patent in 1932 was made approximately 3 years earlier, in
1929.
Patents by domestic inventors are measured as the difference between all patents
and foreign patents in a subclass. Foreign patents are U.S. patents by inventors that reside
in Argentina, Australia, Austria, Belgium, Brazil, China, England, France, Germany, India,
Italy, the Netherlands, Russia, Scotland, Spain and Switzerland. This list includes the
nationalities of all inventors that we found by hand-checking 625 patents of alizarin,
indigo, azo dyes, and aniline, which Delamare and Guineau (1999) consider the most
important dyes in the early 20th century. Inventors’ country of origins are identified
through keyword searches for country names in the Lexis Nexis Chronological Patent
Files, 1790-1970. For example, we assign a patent to be of a German inventor if it
contains the word “Germany” anywhere in title or in the description of the invention.
www.patents.google.com for patents that contain the word “dye” anywhere in the patent. Google caps the result of this search at 600 patents and records application dates for 536 patents; 493 of the 536 patents with application dates belong to our sample.
11
C. Measurement Error
Our data may be subject to measurement error in the way we assign patents to
inventor nationalities. Specifically, our matching may overestimate the number of
domestic inventors because we miss inventors from any country that is not included in our
search. Another type of measurement error results from using Optical Character
Recognition (OCR) to identify patents by foreign inventors. OCR is worse at recognizing
misspelled names or untidy script than the human eye, which will also lead us to
overestimate the number of U.S. inventors.10
Another type of measurement error results from our use of the USPTO system of
classification, which offers an independent mechanism of classifying patents.. The range
(or breadth) of patents that are included in a USPTO subclass may, however, vary across
subclasses, which will lead us to underestimate patenting in subclasses that are narrowly
defined. Moreover, inventors’ propensity to patent may vary across subclasses and
There is however, no reason to believe that these errors vary systematically across
treated and untreated subclasses. To check for systematic errors, we hand-collected
inventor nationalities 625 patents of alizarin, indigo, azo dyes and aniline that were granted
between 1900 and 1943. For these patents we identify the inventor’s nationality by
carefully reading the full text of each patent. A comparison of the hand-collected and
machine-collected data reveals no significant differences in inventor nationalities across
subclasses (Table 2 and Figure 5). Improvements in the quality of OCR will be captured
by annual fixed effects.
Our data are also subject to some measurement error regarding the timing of the
licensing. Publicly available archival records do not specify the exact date of licensing,
and the archival records of the Chemical Foundation are not currently available. The
Chemical Foundation continued to license enemy-owned patents until 1926, though the
majority of licenses were granted between 1919 and 1921 (Steen 2001, p.100).
10 To identify as many foreign inventors as possible, we search for the name of a foreign country anywhere in the document. This overestimates the number of foreign inventors, if patent applications use the country name in a different context. For example, we wrongly assign USPTO patent 1,674,085 to Great Britain, because its inventors (who came from Massachusetts) also applied for a patent in Britain and mentioned this in their patent document. Several cross-checks of our data, however, indicate that such errors are rare.
12
technology fields (Lerner 1995, Moser 2007), which could also bias our results. We
address these issues by using class-subclass-specific fixed effects in all regressions.
D. Attenuation Bias
Most importantly, the USPTO classification system may cause us to underestimate
the true effects of compulsory licensing. Specifically, our estimation approach assumes
that the effects of compulsory licensing are limited to inventors in the same subclass.
Given the relatively narrow definition of USPTO subclasses, however, it is likely that
licensing in one subclass may also affect inventors in other classes.11 Then treatment
could also affect our control group, which will lead us to underestimate the true effects of
licensing.12
Patents by U.S. inventorsc,t = α0 + ′ β ⋅ TREATc ⋅ postTWEAt + ′ γ Zc,t + δt + fc + εc,t
IV. Results
A. Least Squares with Subclass- and Year- Fixed Effects
Preliminary results of for our most basic equation
11 More formally, our estimation violates the stable unit treatment value assumption (SUTVA) because there is some interference between treated and untreated units (Rubin 1990, p. 282). If SUTVA were satisfied, our empirical estimation would measure the difference between a world where some subclasses are treated by compulsory licensing and another where compulsory licensing does not exist. Even though this would be a cleaner test, its implications are far less interesting and relevant than what we can do with our data. Our estimation measures a causal effect as the difference in the actual number of domestic inventors in a treated subclass and the counterfactual number of domestic inventors in that subclass if it had not been treated by compulsory licensing. Thus the estimated effect is the difference between the observed number of domestic inventors for every treated subclass and the number of domestic inventors that would have been observed in each subclass without compulsory licensing. We define the average effect for the treated (ATT) to be the average of these estimated subclass-level effects. It is important to keep in mind, however, that this ATT does not measure the average difference in potential outcomes that would have been observed if all selected subclasses had been subject to compulsory licensing and all others had not (as it would under SUTVA). Most importantly, our empirical strategy requires additional assumptions about how subclasses are assigned to treatment, which we describe in more detail in the text. 12 We could capture some of these spillover effects by combining subclasses that cover similar technologies, which would, however, be subjective. Instead, we plan to measure spillovers across subclasses by matching our data set of licensed patents with the NBER Patent Citation Data File (Hall, Jaffe, and Trajtenberg 2001), which includes all citations to U.S. patents that were granted between 1975 and 2002. If the subclasses of citing patents differ from the subclasses of licensed patents, our analysis underestimates the effect of compulsory licensing.

13
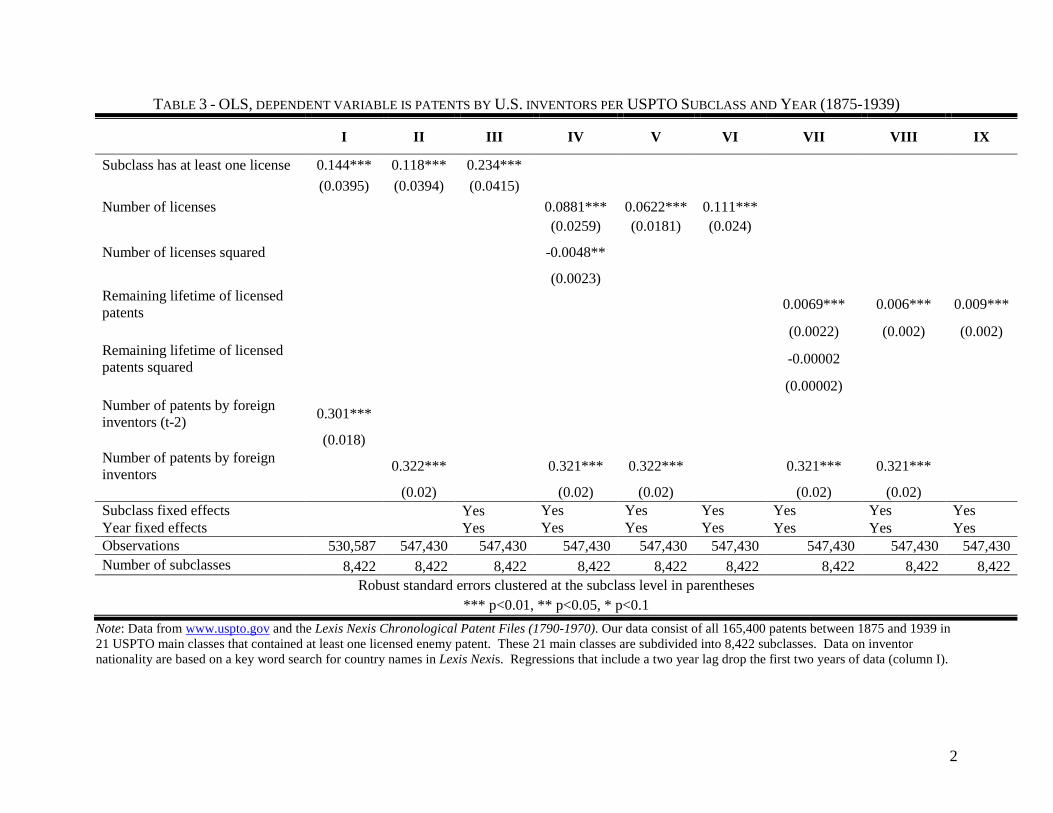
show that the correlation between compulsory licensing and patenting by domestic
inventors is high and statistically significant (Table 4).13
Controlling for the intensity of treatment confirms that compulsory licensing
encourages domestic invention. An additional license raises the annual number of patents
by domestic inventors by an average of 0.06 to 0.1 patents per year (Table 4, column V-
VI).
In treated subclasses, which
received at least one license under the TWEA, U.S. inventors produced on average 0.1 to
0.2 patents more per year between 1918 and 1939 (columns I to III). Controlling for the
number of patents by all foreign inventors has a measurable influence on the treatment
coefficient; these results are robust to alternative lag structures. This is a substantial
increase, especially compared with the average number of patents per subclasses and year,
which is 0.68 between 1918 and 1939. All effects are significant at the 1 percent level.
B. Controlling for the Intensity of Treatment
14 An additional year of patent life raises the number of annual patents in the treated
subclass by 0.006 ot 0.01 patents per year (column VIII-IX). This implies that licensing a
new patent in 1918, which had 17 years of life left, increases patenting by nearly 0.102
patents per year, while an older patent, which had just one year of life left, only increase
patenting by 0.006 patents per year. Again all effects are significant at the 1 percent
level.15
We take advantage of the long run nature of our historical data to identify the
timing of the impact of compulsory licensing. Specifically, we estimate year-specific
B. Year-Specific Treatment Effects
13 As above, X is a vector of treatment variables and Z is a vector of controls, here contemporary and lagged patents obtained by foreign inventors. The variable f indicates subclass fixed effects, δ year fixed effects. Standard errors are clustered at the level of subclasses. 14 Consistent with a learning process where the marginal effect of additional knowledge is positive but decreasing, OLS results indicate that the marginal effect of additional patents is decreasing. A negative coefficient on the squared number of licensed patents suggests that the effect of additional patents may become negative when more than 18 patents are licensed in a subclass (compared with an average of 0.7 annual patents per subclass). This effect, however, is dependent on the functional form of our estimation equation. Moreover, none of more than 8,000 subclasses had more than 15 licensed patents. 15 Marginal effects are decreasing both for additional licenses and for additional patent years. The effect of an additional year of remaining patent life becomes negative when more than 187 years of patent life are added to the remaining lifetime of all licensed patents in a subclass. This number corresponds to roughly 11 new patents in 1918, consistent with the results when treatment is defined as the number of licensed patents. These results are robust to the inclusion of linear and quadratic subclass-specific time trends.
14
treatment effects, where βt measures the effect of compulsory licensing on patents by
domestic inventors in year t
Patents by U.S. inventorsc,t = α0 + β t ⋅ TREATc ⋅YEARpostTWEAt + ′ γ Zc,t + δt + fc + εc,t
Regressions with year-specific treatment effects suggest that the effect of
compulsory licensing on domestic inventors may take up to 10 years to fully materialize.
For treated subclasses, the effect of licensing on the number of patents by domestic
inventors becomes statistically significant around 1932 (at 5 percent, Figure 7).
Accounting for an average lag between patent applications and grants of three years, these
results implied that U.S. nationals began to patent significantly more in treated subclasses
in 1929, approximately 10 years after the TWEA, and 8 to 9 years after most patents had
been granted. Regression results also suggest that a small effect was already present in the
late 1920s; the year-specific treatment coefficient βt is first significant in 1927.
The data also show that the effect on compulsory licensing is persistent throughout
the 1930s. After 1932, treated subclasses produce between 0.4 and 0.6 additional patents
per year. At the end of our sampling period, in 1939, subclasses that were affected by
compulsory licensing continue to generate approximately 0.5 additional patents per year
compared with untreated subclasses.
Adjusting for the intensity of treatment through the number of licenses per subclass
confirms that the full effects of compulsory licensing materialized in the early 1930s,
although year-specific treatment effects are positive and statistically significant as early as
1927. Point estimates suggest that an additional license under the TWEA generates
between 0.2 and 0.3 additional domestic patents in the early 1930s compared with 0.05 in
second half of the 1920s (Figure 8). Adjusting for the intensity of treatment by accounting
for years of remaining patent life also confirms that the full effect of licensing occur in the
early 1930s; a less precisely estimated effect already occurs in the late 1920s (Figure 9).16
16 We have repeated these regressions including both the simplest specification of treatment (where TREAT = 1 if a subclass receives at least one license) and one of the two intensity-adjusted specifications. Specifically, we include controls for the number of licenses per subclass (in addition to our simplest measure of treatment that a subclass was affected by compulsory licensing), which yields the estimation equation
15
C. Triple Differences
Triple differences account for omitted variables that affect all non-German
inventors by comparing changes in treated and untreated classes before and after the
TWEA across U.S. and other non-German inventors. Triple difference estimates confirm
that compulsory licensing had a significant positive effect on domestic invention (Figure
10). Subclasses that received at least one license during the TWEA began to produce more
patents by domestic inventors around 1927, and had consistently larger number of
domestic invention in the 1930s. Compared with patents by other non-German inventors,
U.S. inventors produced 0.2 to 0.4 more patents in the 1930s (significant at 5 percent since
1933, Figure 10) in subclasses that were affected by the TWEA. This effect is especially
significant compared with the average 0.7 patents per subclass and year. Equivalent
regressions for intensity-adjusted measures of treatment (number of licenses and remaining
patent years for all licensed patents).yield similar results.17
This section presents a series of robustness checks for our results, including
controls for subclass-specific time trends, a block bootstrap to account for serial
V. Robustness checks
Patents by U.S. inventorsc,t =
α0 + α1TREATc + α2 postTWEAc + β ⋅ (Dummyc =1if subclass received at least one license)⋅ postTWEAt
+ ξ tNumber of licensesc ⋅YEARpostTWEAt + γ ⋅ Zc,t + δt + fc + εc,t
The equivalent regression with our second intensity-adjusted treatment variable as a control (remaining lifetime of all licensed patents) yields the equation
Patents by U.S. inventorsc,t =
α0 + α1TREATc + α2 postTWEAc + β ⋅ (Dummyc =1if subclass received at least one license)⋅ postTWEAt
+ ξ tRemaining lifetime of all licensed patentsc ⋅YEARpostTWEAt + γ ⋅ Zc,t + δt + fc + εc,t
Estimating time-varying treatment coefficients confirms that patenting was responsive to the intensity of treatment and that the effect of compulsory licensing was particularly large in the early 1930s. 17 In evaluating this coefficient it is important to keep in mind that British inventors, which contributed the second larges number of foreign patents, may have been affected by compulsory licensing in the same way as U.S. inventors. Britain had passed an early version of its TWEA in September 1914 forbidding all transactions “that would improve the financial or commercial position of a person trading or residing in an enemy country.” (House of Commons Debate 08 August 1916 vol. 85 column 871). In parallel with the American TWEA, the British Act was extended in 1919 to allow for compulsory licensing. The amended Act required “the Comptroller to grant a compulsory license under a food or medicine patent to anyone who seemed competent to work the invention” (Davenport 1979, p.81). This implies that triple differences estimate a lower bound for the true effect of compulsory licensing.
16
correlation, an analysis of compulsory licensing at the level of primary subclasses, and at
the level of an individual dye (indigo), and several tests of placebo treatments.
A. Controlling for Subclass-Specific Time Trends
One potential problem with difference-in-differences is that it they may confound
the dynamic effects of compulsory licensing with pre-existing differences in time trends
across treated and untreated subclasses. In other words, subclasses that were affected by
compulsory licensing may have experienced an increase in domestic patenting after the
TWEA due to differences in time trends that preceded the TWEA. To address this issue,
we extend our regressions to include subclass-specific linear and quadratic time trends:
Patents by U.S. inventorsc,t = α0 + β t ⋅ TREATc ⋅YEARpostTWEAt + ′ γ Zc,t + δt + fc + φ1c ⋅ t + φ2c ⋅ t 2 + εc,t
where βt measures treatment effects in year t and δt captures year fixed effect controlling
for subclass-specific time trends φ1c • t and φ2c • t2. 18
18 This methodology follows Wolfers (2007), who uses it to separate the dynamic effects of a shift towards no-fault divorce on divorce rates from pre-existing differences in time trends in divorce rates across states.
Given the large number of subclasses, we cannot estimate the expanded regression
for the entire data set; this would require to estimate about 20,000 coefficients, including
8,422 class fixed effects, 8,422 linear time trends, and 8,422 quadratic time trends in
addition to time dummies, treatment variables, and controls. To address this issue, we
restrict the sample to subclasses in two main classes that include the largest number of
licenses (classes 8 and 534, Table 1). These two (main) classes span a total of 776
subclasses.
Results show that even after controlling for subclass-specific time trends, the
number of domestic patents increased significantly more in treated subclasses than in
untreated subclasses after the TWEA. Year-specific treatment coefficients are significant
at the 5 percent or 1 percent level between 1919 and 1939.
To repeat this test on the entire data set, we introduce treatment-specific time
trends. Specifically, we re-estimate the above equation that includes subclass-specific time
trends, allowing time trends to vary only between treated and untreated classes, estimating
a single time trend for all treated classes.
17
Patents by U.S. inventorsc,t =
α0 + ′ β t ⋅ TREATc ⋅YEARpostTWEAt + γ ⋅ Zc,t + δt + fc + φ ⋅ TREATc ⋅ t + εc,t
Even controlling for treatment-specific time trends, year-specific treatment coefficients βt
are significant at the 1 percent level (Figure 11).19
Given the long time series of our data we also want to account for serial correlation
in the outcome variable (the number of patents by domestic inventors per subclass and
year), which could lead us to understate the standard error of the treatment coefficient β.
In estimations with a large number of groups a block bootstrap, which maintains the
autocorrelation structure within groups by keeping observations in the same group
together, has been shown to perform best (Bertrand, Duflo, Mullainathan 2004).
B. Block Bootstrap to Account for Serial Correlation
20
β̂
Applied
to our specific case, the block bootstrap maintains the structure of correlations at the level
of subclasses, as it samples subclasses instead of observations (the number of patents per
subclass and year). Specifically, we randomly draw subclasses with replacement, estimate
OLS on each boot-strapped sample, and record coefficients and standard errors to compute
the absolute t-statistic tr = abs ( r - β̂ )/SE( β̂ r ). We draw a large number (79)
bootstrapped samples, and reject the hypothesis that β = 0 at a 99 percent confidence
interval if the 99 percent of the tr are smaller than the t-statistic of our original regression.21
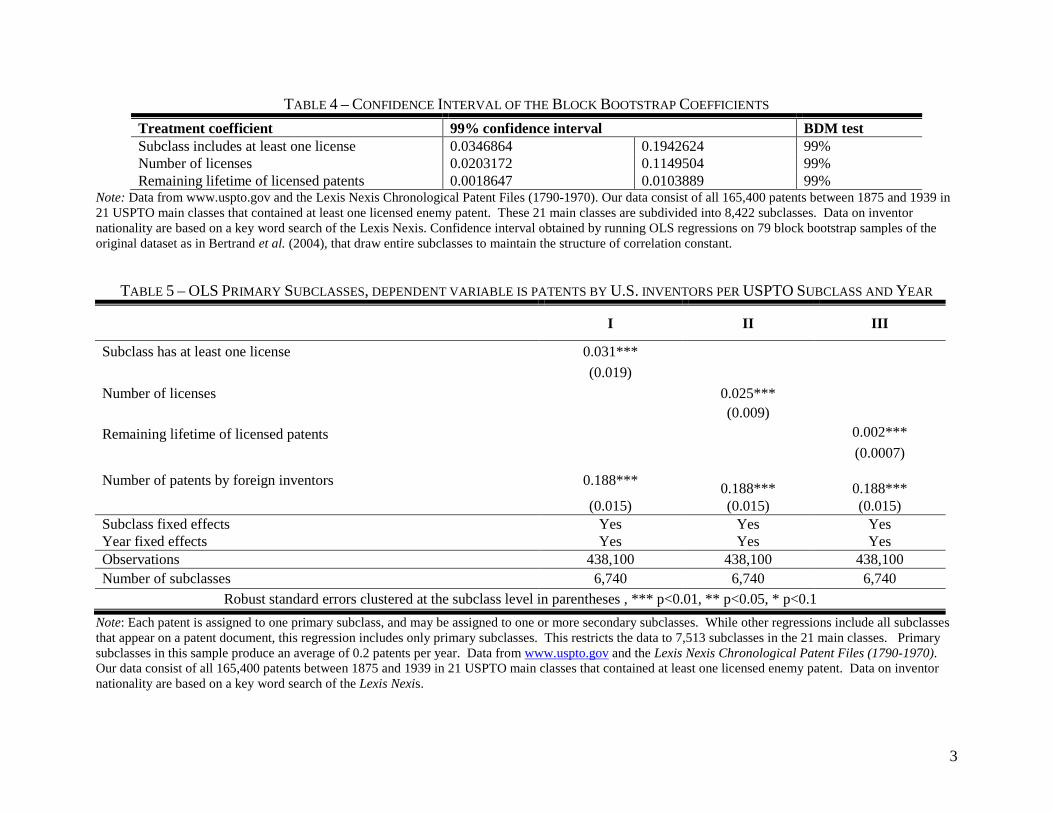
The results of this block bootstrap estimation confirm that all treatment coefficients are
significant at the 1 percent level (Table 4).
19 We have estimated this equation with and without quadratic time trends. Specifications without quadratic time trends fit the data better, but the year-specific treatment coefficients βt are very similar with and without quadratic time trends, although standard errors are smaller without the quadratic trends. 20 With low standard errors due to serial correlation in the dependent variables, OLS could lead to significant differences-in-differences estimates of a treatment effect, even if the treatment is artificial and assigned as a placebo. Even when standard errors are clustered at the level of groups, serial correlation may produce significant coefficients with placebo treatments. This problem seems to be less severe when the number of groups is large (as is true in our case). In simulations, the block bootstrap is least likely to produce significant coefficients for placebo treatments (Bertrand, Duflo, and Mullainathan (2004), which is why we perform the block bootstrap sampling as a robustness check. 21 79 repetitions were set at random when our computer crashed. The sampling distribution of tr is random and changing in N (the number of subclasses). As the number of groups increases, the difference between the distribution of tr and the distribution of the t-statistic for the original regression tend to zero.
18
C. Restricting the Sample to Primary Subclasses
We also check our regressions by restricting the sample to primary subclasses. As
described in the data section, patents may be assigned to one or more secondary
subclasses, in addition to their primary subclass. Because a compulsory license affects
both primary and secondary subclasses, we include secondary subclasses in all tests. As a
robustness check, however, we restrict our sample to primary subclasses. If including
secondary subclasses puts a lot of weight on patents that belong to many subclasses, the
coefficients from this restricted sample (which includes 6,740 subclasses instead of 8,422)
should differ substantially from the coefficients of the full sample.22
Results from the restricted sample of primary subclasses confirm results from the
full sample. In primary subclasses that received at least one license under the TWEA,
patenting increased by about 0.03 patents per year after the TWEA (Table 5, column I),
compared with an average of 0.2 annual patents per primary subclass. Controlling for the
intensity of treatment suggests that an additional license generated an additional 0.025
patents per treated primary subclass and year (Table 5, column II). An additional year of
patent life generated 0.002 additional patents per primary subclass and year. These results
are significant at the 1 percent level.
23
Another potential concern with our identification strategy is that the increase in
domestic invention may be caused by an increase in the demand for domestically produced
D. Controlling for a Demand Shock in a Subsample of Indigo Patents
22 Eliminating secondary subclasses - which cross-reference related technology areas - may also reduce correlation across subclasses; this is important because both clustering at the level of subclasses and the block bootstrap at the level of subclasses assume that the number of patents is independent across subclasses. 23 As an additional robustness check we have also re-estimated our main equations separately for each of the 21 USPTO (main) classes in our sample. Each of these classes is affected by compulsory licensing, but they may be differentially affected by unobservable factors that are unrelated to compulsory licensing. To compare treatment effects across main classes we estimate the following equation for each of the 21 classes:
Patents by U.S. inventors in class Ac,t =
α0 + ′ δ t ⋅ TREATc ⋅ YEARpostTWEAt + ϑ t ⋅UNTREATc ⋅ YEARpostTWEAt + γ ⋅ Zc,t + δt + fc + εc,t
and compare changes in the coefficients δt and θt across classes. Results of class-specific regressions confirm that patenting in treated compared with untreated subclasses increased significantly after the TWEA. Year-specific treatment effects also confirm the timing of the effect of compulsory licensing in the late 1920s and early 1930s. Four of 21 classes were affected by at least 20 licenses: class 534 (organic compounds containing a noble gas, Table 1), class 8 (bleaching and dyeing: fluid treatments and chemical modifications of textiles and fibers), class 522 (organic compounds – azides), and class 548 (organic compounds containing 5 membered hetero rings). In classes 534 and 548, the most significant treatment effect occurred in the early 1930s; in classes 8 and 552, year-specific treatment effects are largest in the late 1920s.
19
chemicals as a result of World War I (e.g., Genesove 2006). Moreover, the United States
government imposed tariffs to protect domestic dye producers. The timing of both tariffs
and the demand shock, however, is inconsistent with the long and gradual increase in
patenting. The Emergency Tariff Act was passed in 1916, but no significant tariffs were
passed after 1922. Moreover, although the price of imported chemicals increased sharply
during the war, prices had recovered by 1919 (Figure 12). A comparison of the wholesale
price of chemicals with the general price index between 1890 and 1939 reveals that prices
for chemicals responded significantly more strongly than other prices to the war. Chemical
prices began to increase relative to the general price index in 1915, and the distance peaked
in 1916. By the end of the war, however, chemical prices had recovered.
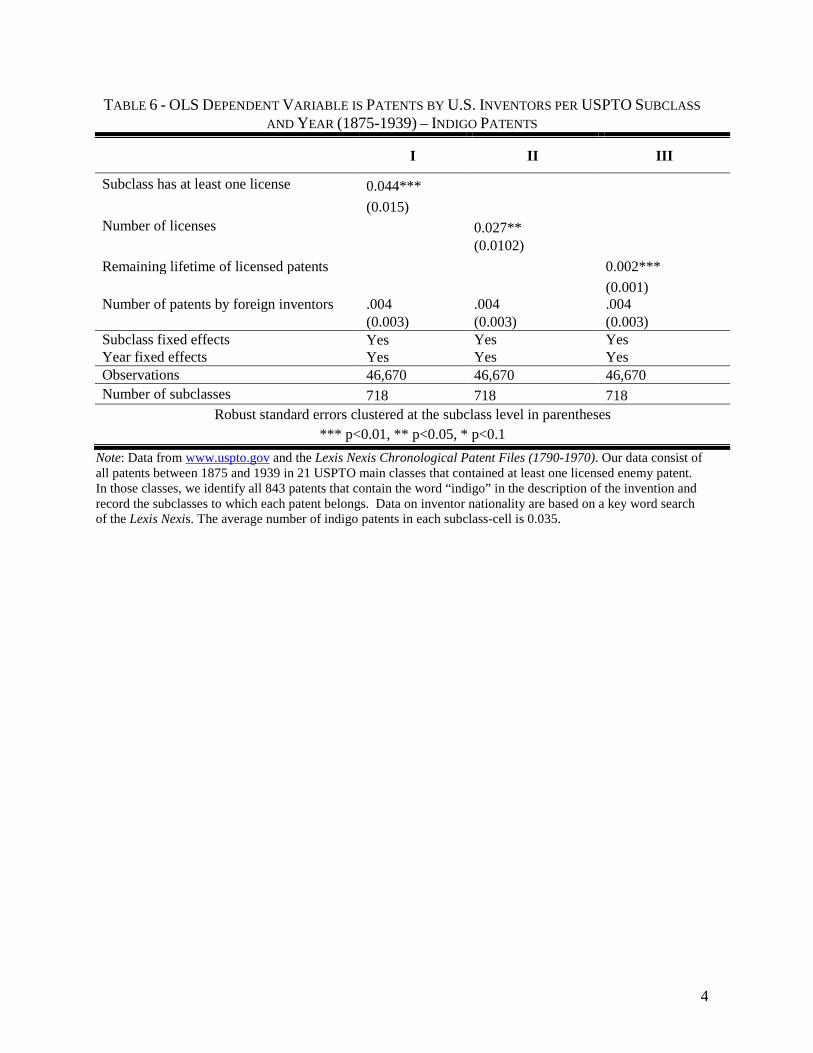
To assess the potential effects of a demand shock empirically, we examine
inventions for indigo, which was one of the most affected products. Given the narrow
definition of subclasses, it is not unreasonable to assume that the demand shock affected
both treated and untreated subclasses within indigo; we examine such variation as a
robustness check.
World War I greatly increased demand for domestically produces indigo, which
was needed to create the blue shade of Navy uniforms (e.g., Navy Department, 1917).
Already before the war the United States had consumed 8 million pounds of indigo per
year; 90 percent of which were imported from Germany.24 In 1915, Britain’s naval
blockade cut U.S. markets off from German imports so effectively, that the last shipment
of German dyes arrived in March 1915 (Haynes 1945, Haber 1971, p.185). As a result, the
price of indigo increased from less than 20 cents per pound (in real prices) before World
War I to almost 70 cents in 1917.25
To create a subsample of indigo patents, we first identified all U.S. patents of
indigo between 1875 and 1939. In practice, this meant searching Lexis Nexis
Chronological Patent Files, 1790-1970 for the keyword “indigo.” Merging this list with
our data set on U.S. patents yields 749 patents of indigo between 1875 and 1940; these
indigo patents cover a total of 718 subclasses.
By 1919, the price of indigo had dropped back to
approximately 40 cents (Haynes 1945, p. 231).
24The remaining 10 percent of U.S. indigo consumption were imported from Switzerland, England and India. 25 Once the British blockade prevented imports from Germany, the U.S. sourced its indigo from China (52 percent), Japan, Hong Kong, British India (21 percent) and the U.K (20 percent); total imports, however dropped to 6,600,000 in 1916 (Haynes 1945, p. 231).
20
OLS regressions of the indigo sample confirm that treated subclasses were
significantly more likely to experience an increase in domestic patents (Table 6). Analyses
of year-specific treatment effect show that year-specific treatment effects become stable
and statistically significant around 1931, even though there are positive and statistically
significant effect in the late 1920s (Figure 13). Partly because of the small number of
observations in this subsample, the treatment effect ceases to be statistically significant in
the late 1930s.
E. Placebo Treatments
Another potential shortcoming of empirical strategy is that our results may be
driven by random correlation between other explanatory variables and actually be
independent of the treatment. To address this issue, we create a placebo treatment which
randomly assigns subclasses to be “treated” (e.g., Di Giorgi 2007). The share of
subclasses that are randomly assigned to the placebo treatment is equal to the share of
subclasses that are treated under the TWEA (3.65 percent). We re-estimate our most basic
regression equation 50 times with a randomly selected placebo treatment. In these tests,
the hypothesis that the placebo treatment is significant is rejected for 45 of 50 placebos at
the 5 percent level.
An alternative placebo treatment predates the “treatment” by a random number of
years. In this case, we artificially predate the treatment by 10 years, to 1905. If the
increase in patenting by domestic inventors in treated classes is due to pre-existing trends
this test will show a significant effect of the TWEA before it actually occurs. More
formally, we estimate
Patents by U.S. inventorsc,t = α0 + β t ⋅YEARt ⋅ TREATc ⋅ post1905t + ′ γ Zc,t + δt + fc + εc,t
This specification allows for year-specific treatment effects beginning in 1905 (β t for t =
1905,…, 1939) instead of 1919 in the other specifications. Thus, between 1905 and 1918,
coefficients β t between 1905 and 1918 create a placebo treatment. For years between
1919 and 1945, treatment continues to be measured by coefficients β t.
Regression results indicate that the pre-TWEA placebo treatment had no effect
prior to the TWEA. Estimates of δt for untreated subclasses and δt + β t for treated classes
21
suggest that there is no difference in domestic patenting for treated and untreated classes
prior to the TWEA (Figure 14).
An additional robustness check, repeats the TWEA placebo treatment for patents by
French inventors. Similar to the United States, France did not have a strong presence in
organic chemistry. Thus, French inventors may have benefitted from the absence of
German inventors during the war. In our data, 3,000 patents, approximately 1.7 percent,
were granted to French inventors. Estimating year-specific treatment effects as in the
equation
Patents by French inventorsc,t = α0 + β t ⋅ YEARt ⋅ TREATc ⋅ postTWEAt + ′ γ Zc,t + δt + fc + εc,t
shows no clear effect of this pre-TWEA placebo treatment on patenting by French
inventors (Figure 15).
VII. Conclusions
This paper has used the TWEA as a natural experiment to examine whether
compulsory licensing encourages invention by nationals in nascent industries. Data on
chemical patents by U.S. inventors after the TWEA indicates that compulsory licensing
has a strong and persistent positive effect on domestic invention. In USPTO subclasses,
where at least one enemy-owned patent was licensed to a domestic firm under the TWEA,
U.S. inventors produced an average of 0.3 additional patents per year after the TWEA
(compared with subclasses that were not affected). These results are robust to controlling
for the intensity of treatment by accounting for the number of licenses that were granted
and by accounting for the novelty of licensed patents. Results are also robust to a variety
of alternative tests, including triple differences (comparing changes in the number of
patents by U.S. inventors before and after the TWEA with changes in the number of
patents by other, non-German inventors); they are also robust to controlling for subclass-
and treatment-specific time trends, and a series of alternative tests.
The long-run nature of the analysis allows us to examine the timing of effects on
domestic invention. Estimates of annual treatment effects suggest that the full effects of
compulsory licensing set took up to 10 years to materialize. This lag is intuitive; in
nascent industries, a country’s domestic capacity to invent is limited. Compulsory

22
licensing enables domestic firms to produce inventions that were invented abroad (and are
in fact owned by foreign nationals). This creates opportunities for learning-by-doing, but
learning occurs gradually; in the case of the U.S. chemical industry, up to a decade. Such
long-term effects will be missed in most analyses of contemporary data.
A key factor in determining the lag between licensing and the increase in domestic
invention lies in incomplete patent specifications. In the early 20th century United States,
domestic firms struggled for many years to decipher patent specifications that German
firms had, perhaps intentionally, left unclear. For example, “Acting under a license issued
under the Trading-with-the-Enemy Act, Du Pont wrestled with the obscure descriptions in
the German patents to work out a practical process (to produce indigo) only after long
experimentation” (Haynes 1945, p.245). Incomplete patent specifications are likely to
delay the benefits of compulsory licensing for domestic firms.26
Finally, the delays that U.S. firms experienced with using foreign-owned patents
suggest that human capital and tacit knowledge are essential to rapid technology transfers
across countries. World War II provides an opportunity to measure the importance of
human capital as a complement to patent grants. Only 14 years after the TWEA, on April
Interestingly, the development of the U.S. chemical industry after the TWEA
closely mirrors current experiences with compulsory licensing. India, for example
permitted the compulsory of pharmaceuticals under its Patent Act of 1970. Under this Act,
domestic firms were able to produce generic versions of foreign-owned pharmaceuticals
until January 1, 2005, when India complied with the WTO requirements to respect foreign
patents. Thus, Indian firms enjoyed a 35 year period of compulsory licensing. Although
there has been no systematic study of the effects of compulsory licensing in India,
anecdotal evidence is suggestive. Today, India ranks fourth in the production of
pharmaceuticals and is the world’s leading supplier of generic medicines, with two thirds
of its exports going to developing countries.
26 See Haynes (1945) for other example of how incomplete patent specifications slowed production. For example, Mark Weisberg, owner of the Providence, RI, Textile Chemical Company remembers: “…in the early days we purified alpha-naphthol by following the book, dissolving it in caustic soda and filtering. The filtration was arduous….Yields were poor…and the resultant compound was not entirely satisfactory…To remove this isomer, a problem that was not mentioned in the German patents, a concentrated solution of caustic potash was used. The above serve to illustrate the know-how, not in the patent literature, that was required to make success in the dyestuff field” (Haynes 1948, p. 230). Alpha-napthol is an isomeric form of naphthol, C10H7OH; it typically takes the form of colorless or yellow prisms. In addition to making dyes, alpha-napthol is used to make perfumes and in organic synthesis.
23
7th, 1933, the Nazi’s “Law for the Restoration of the Professional Civil Service” led to the
dismissal of 1,100 professors from German universities (Harthorne, 1937). Many of these
scientists moved to the United States, and although they arrived after compulsory licensing
increased domestic invention, their effects on domestic invention deserve further study.
References Arrow, Kenneth. “The Economic Implications of Learning by Doing.” Review of Economic
Studies 29.3 (1962): 155-173. Branstetter, Lee, Ray Fisman, and Fritz Foley. "Do Stronger Intellectual Property Rights
Increase International Technology Transfer? Empirical Evidence from U.S. Firm-Level Panel Data." Quarterly Journal of Economics 121.1 (2006): 321-349.
Chien, Colleen. “Cheap Drugs at What Price to Innovation: Does the Compulsory
Licensing of Pharmaceuticals Hurt Innovation?” Berkeley Technology Law Journal (2003).
Davenport, A. Neil. The United Kingdom Patent System, Homewell, UK: Kenneth Mason,
1979. De Giorgi, Giacomo, Michele Pellizzari and Silvia Radaelli, “Be as Careful of the Books
You Read as of the Company You Keep. Evidence on Peer Effects in Educational Choices”, IZA discussion paper No. 2833, 2007
Deichmann, Ute, Flüchten, Mitmachen, Vergessen. Chemiker und Biochemiker im
Nationalsozialismus, Weinheim: Wiley, 2001. Delamare François and Bernard Guineau, “Colors – The Story of Dyes and Pigments”,
Harry N. Adams Inc., 1999 Galvão, J. “Access to Antiretroviral Drugs in Brazil.” The Lancet 360.9348 (2002): 1862-
1865. Genesove, David ,”The Dye Famine and its Aftermath: Knowledge Diffusion and Entry”
(October 2006). CEPR Discussion Paper No. 5890. Gilbert, Richard, and Carl Shapiro. “Optimal Patent Length and Breadth.” RAND Journal
of Economics 21.1 (1990): 106-112. Gostin, Lawrence O. “Medical Countermeasures for Pandemic Influenza: Ethics and the
Law.” Journal of the American Medical Association 295.5 (2006): 554-556.
24
Haber Ludwig Fritz, "The Chemical Industry, 1900-1930: International Growth and Technological Change", Clarendon Press, 1979.
Hall, Bronwyn H., Adam B. Jaffe, and Manuel Tratjenberg (2001). "The NBER Patent
Citation Data File: Lessons, Insights and Methodological Tools." NBER Working Paper 8498.
Hartshorne, Edward Yarnall, The German Universities and National Socialism,
Cambridge, Harvard University Press, 1937. Haynes Williams, “American Chemical Industry – The World War I Period 1912-1922”,
Vol.III, D. Van Nostrand Company, 1945 Helpman, Elhanan. “Innovation, Imitation, and Intellectual Property Rights.”
Econometrica 61.6 (1993): 1247-1280. House of Commons, The Official Report, (5th Series) Vol 1 (Jan 1909) to Vol 1000
(March 1981). Irwin, Douglas A & Klenow, Peter J., "Learning-by-Doing Spillovers in the
Semiconductor Industry," Journal of Political Economy, 102.6 (December 1994), pp. 1200-1227.
Kremer, Michael. “Pharmaceuticals and the Developing World.” Journal of Economic
Perspectives 16.4 (2002): 67-90. Lampe, Ryan, and Petra Moser. “Do Patent Pools Encourage Innovation? Evidence from
the 19th-century Sewing Machine Industry”, SSRN Working Paper. Available at http://ssrn.com/abstract=1308997
Landau, Ralph and Rosenberg, Nathan 1992 “Successful Commercialization in the Chemical Process Industries. In Technology and the Wealth of Nations, eds. N. Rosenberg, R. Landau, and D. C. Mowery, Stanford: Stanford University Press, pp. 73-120.
Lerner, Joshua. “100 Years of Patent Protection.” American Economic Review Papers and
Proceedings, 92 (May 2002) 221-225. Lerner, Joshua, “Patenting in the Shadow of Competitors” Journal of Law and Economics,
38.2 (October1995): 463-95.
Lexis Nexis Chronological Patent Files, 1790-1970. Available at www.lexisnexis.com Mansfield, Edwin. “Intellectual Property Protection, Direct Investment, and Technology
Transfer: Germany, Japan, and the United States.” International Journal of Technology Management 19.1 (2000): 3-21.
25
Moser, Petra. “Why Don’t Inventors Patent?” NBER Working Paper No. W13294, August
2007. Available at http://ssrn.com/abstract=930241 Moser, Petra. “How Do Patent Laws Influence Innovation? Evidence from Nineteenth-
Century World Fairs”, The American Economic Review, Volume 95, Number 4, September 2005, pp. 1214-1236.
Navy Department, Uniform Regulations, United States Navy, Together with Regulations
Together with Regulations Common to Both Navy and Marine Corps, Washington, DC: Government Printing Office, 1917.
Oppenheim, Lassa and Ronal Roxburgh, International Law: A Treatise, The Lawbook
Exchange, Ltd., 2005. Rubin, Donald B. Formal Modes of Statistical Inference For Causal Effects. Journal of
Statistical Planning and Inference. 25 (1990), 279-292. Ruggles, Steven, Matthew Sobek, Trent Alexander, Catherine A. Fitch, Ronald Goeken,
Patricia Kelly Hall, Miriam King, and Chad Ronnander. Integrated Public Use Microdata Series: Version 4.0. Minneapolis, MN: Minnesota Population Center, 2008.
Steen, Kathryn. “Patents, Patriotism, and "Skilled in the Art" USA v. The Chemical
Foundation, Inc., 1923-1926”, Isis, 92.1 (2001): 91-122. Steinbrock, Robert, “Thailand and the Compulsory Licensing of Efavirenz”, New England
Journal of Medicine, 356.7 (2001): 544-546. United States, and Thomas H. Norton. 1916. Artificial dyestuffs used in the United States.
Washington: Government Printing Office. Tandon, Pankaj. “Optimal Patents with Compulsory Licensing.” Journal of Political
Economy 90.3 (1982): 470-486. United States Tariff Commission,, “Census of Dyes and Coal-tar Chemicals”, several
years, Tariff Information Series No.11, Government Printing Office, Washington, 1918-1923.
Yang, Guifang, and Keith E. Maskus. “Intellectual Property Rights, Licensing, and
Innovation in an Endogenous Product-Cycle Model.” Journal of International Economics 53.1 (2001): 169-187.
Waldinger, Fabian, “Peer Effects in Science. Evidence from the Dismissal of Scientists in
Nazi Germany”, Working Paper LSE, 2009.
26
Williamson, Samuel H. "Five Ways to Compute the Relative Value of a U.S. Dollar Amount, 1790 to Present," MeasuringWorth, 2008.
Wolfers Justin, 2006, “Did Unilateral Divorce Raise Divorce Rates? A Reconciliation and
New Result”, American Economic Review, 96(5), December, pp.1802-1820. World Trade Organization, Ministerial Declaration, November, 20, 2001,
WT/MIN(01)/DEC/1
1
TABLE 1 – USPTO CLASSES Class Title Licenses 534 Organic Compounds—Containing a noble gas 133
8 Bleaching and dyeing; fluid treatment and chemical modification of textiles and fibers 47 552 Organic Compounds—Azides 27 548 Organic Compounds—Containing 5-membered hetero rings 23 544 Organic Compounds—Containing 6-membered hetero rings with at least one nitrogen 16 106 Compositions: coating or plastic 14 546 Organic Compounds—Containing 6-membered hetero rings with 5 carbons and 1 nitrogen 14 549 Organic Compounds—Containing sulfur hetero rings 11 528 Synthetic resins or natural rubbers 10 564 Organic Compounds—Containing amino nitrogen 7 562 Organic Compounds—Persulphonic acids and salts 6 536 Organic Compounds—Carbohydrates and derivatives 3 172 Earth working 2 74 Machine element or mechanism 1
101 Printing 1 192 Clutches and power-stop control 1 204 Chemistry: electrical and wave energy 1 416 Fluid reaction surfaces (i.e., impellers) 1 430 Radiation imagery chemistry: process, composition, or product thereof 1 568 Organic Compounds—Containing boron 1 570 Organic Compounds—Containing halogen 1
Notes: Data from Haynes (1939) and www.uspto.gov. Licenses refer to the total number of enemy-owned patents that were licensed to U.S. firms by the Chemical Foundation. Class numbers and class names refer to (main) classes within the USPTO system of classifying patents. Classes are divided into subclasses, which are the unit of observation for this analysis. Our data include all USPTO classes that received at least one compulsory license under the TWEA. TABLE 2 – INVENTOR NATIONALITY ASSIGNED BY HAND VERSUS SEARCH
Inventor Nationality Hand-collected Algorithm
United States 241 290 German 226 197 Other foreign 159 138 Total 625 625
Notes: Based on a sample of 649 patents between 1900 and 1943. Data from Haynes (1939), www.uspto.gov, www.lexisnexis.com, and www.patents.google.com. Our matching algorithm performs keyword searches on LexisNexis. Our hand-collected data include all 625 patents of dyes in what Delamare and Guineau (1999) consider the most important dyes in the early 20th century: alizarin, indigo, azo dyes, and aniline. In the hand-collected sample, all inventors come from one of the following countries: Argentina, Australia, Austria, Belgium, Brazil, China, England, France, Germany, India, Italy, the Netherlands, Russia, Scotland, Spain, and Switzerland.
2
TABLE 3 - OLS, DEPENDENT VARIABLE IS PATENTS BY U.S. INVENTORS PER USPTO SUBCLASS AND YEAR (1875-1939)
I II III IV V VI VII VIII IX
Subclass has at least one license 0.144*** 0.118*** 0.234*** (0.0395) (0.0394) (0.0415) Number of licenses 0.0881*** 0.0622*** 0.111*** (0.0259) (0.0181) (0.024)
Number of licenses squared -0.0048**
(0.0023) Remaining lifetime of licensed patents 0.0069*** 0.006*** 0.009***
(0.0022) (0.002) (0.002) Remaining lifetime of licensed patents squared -0.00002
(0.00002) Number of patents by foreign inventors (t-2) 0.301***
(0.018) Number of patents by foreign inventors 0.322*** 0.321*** 0.322*** 0.321*** 0.321***
(0.02) (0.02) (0.02) (0.02) (0.02) Subclass fixed effects Yes Yes Yes Yes Yes Yes Yes Year fixed effects Yes Yes Yes Yes Yes Yes Yes Observations 530,587 547,430 547,430 547,430 547,430 547,430 547,430 547,430 547,430 Number of subclasses 8,422 8,422 8,422 8,422 8,422 8,422 8,422 8,422 8,422
Robust standard errors clustered at the subclass level in parentheses *** p<0.01, ** p<0.05, * p<0.1
Note: Data from www.uspto.gov and the Lexis Nexis Chronological Patent Files (1790-1970). Our data consist of all 165,400 patents between 1875 and 1939 in 21 USPTO main classes that contained at least one licensed enemy patent. These 21 main classes are subdivided into 8,422 subclasses. Data on inventor nationality are based on a key word search for country names in Lexis Nexis. Regressions that include a two year lag drop the first two years of data (column I).
3
TABLE 4 – CONFIDENCE INTERVAL OF THE BLOCK BOOTSTRAP COEFFICIENTS Treatment coefficient 99% confidence interval BDM test Subclass includes at least one license 0.0346864 0.1942624 99% Number of licenses 0.0203172 0.1149504 99% Remaining lifetime of licensed patents 0.0018647 0.0103889 99%
Note: Data from www.uspto.gov and the Lexis Nexis Chronological Patent Files (1790-1970). Our data consist of all 165,400 patents between 1875 and 1939 in 21 USPTO main classes that contained at least one licensed enemy patent. These 21 main classes are subdivided into 8,422 subclasses. Data on inventor nationality are based on a key word search of the Lexis Nexis. Confidence interval obtained by running OLS regressions on 79 block bootstrap samples of the original dataset as in Bertrand et al. (2004), that draw entire subclasses to maintain the structure of correlation constant.
TABLE 5 – OLS PRIMARY SUBCLASSES, DEPENDENT VARIABLE IS PATENTS BY U.S. INVENTORS PER USPTO SUBCLASS AND YEAR
I II III
Subclass has at least one license 0.031*** (0.019) Number of licenses 0.025*** (0.009) Remaining lifetime of licensed patents 0.002*** (0.0007)
Number of patents by foreign inventors 0.188*** 0.188***
0.188***
(0.015) (0.015) (0.015) Subclass fixed effects Yes Yes Yes Year fixed effects Yes Yes Yes Observations 438,100 438,100 438,100 Number of subclasses 6,740 6,740 6,740
Robust standard errors clustered at the subclass level in parentheses , *** p<0.01, ** p<0.05, * p<0.1 Note: Each patent is assigned to one primary subclass, and may be assigned to one or more secondary subclasses. While other regressions include all subclasses that appear on a patent document, this regression includes only primary subclasses. This restricts the data to 7,513 subclasses in the 21 main classes. Primary subclasses in this sample produce an average of 0.2 patents per year. Data from www.uspto.gov and the Lexis Nexis Chronological Patent Files (1790-1970). Our data consist of all 165,400 patents between 1875 and 1939 in 21 USPTO main classes that contained at least one licensed enemy patent. Data on inventor nationality are based on a key word search of the Lexis Nexis.
4
TABLE 6 - OLS DEPENDENT VARIABLE IS PATENTS BY U.S. INVENTORS PER USPTO SUBCLASS AND YEAR (1875-1939) – INDIGO PATENTS
I II III
Subclass has at least one license 0.044*** (0.015) Number of licenses 0.027** (0.0102) Remaining lifetime of licensed patents 0.002*** (0.001) Number of patents by foreign inventors .004 .004 .004 (0.003) (0.003) (0.003) Subclass fixed effects Yes Yes Yes Year fixed effects Yes Yes Yes Observations 46,670 46,670 46,670 Number of subclasses 718 718 718
Robust standard errors clustered at the subclass level in parentheses *** p<0.01, ** p<0.05, * p<0.1
Note: Data from www.uspto.gov and the Lexis Nexis Chronological Patent Files (1790-1970). Our data consist of all patents between 1875 and 1939 in 21 USPTO main classes that contained at least one licensed enemy patent. In those classes, we identify all 843 patents that contain the word “indigo” in the description of the invention and record the subclasses to which each patent belongs. Data on inventor nationality are based on a key word search of the Lexis Nexis. The average number of indigo patents in each subclass-cell is 0.035.
1
FIGURE 1 - NUMBER OF LICENSED PATENTS PER SUBCLASS
0
2
4
6
8
10
12
14
16
18
Lic
ense
s
USPTO subclass Notes: Data from Haynes (1945) and www.uspto.gov. Licenses refer to the total number of enemy-owned patents that were licensed to U.S. firms by the Chemical Foundation. Classes and subclasses refer to main classes and subclasses within the USPTO system of classifying patents. Main classes are divided into subclasses, which are the unit of observation for this analysis.
2
FIGURE 2 - REMAINING LIFETIME OF LICENSED PATENTS PER SUBCLASS
0
20
40
60
80
100
120
140
160
180
USPTO subclasses
Rem
aini
ng li
fetim
e of
lice
nsed
pat
ents
Source: Data from Haynes (1945) and www.uspto.gov. Licenses refer to the total number of enemy-owned patents that were licensed to U.S. firms by the Chemical Foundation Classes and subclasses refer to main classes and subclasses within the USPTO system of classifying patents. Main classes are divided into subclasses, which are the unit of observation for this analysis. The remaining lifetime of licensed patents is calculated adding 17 years to the year of granting and subtracting 1918, which is the year of initial licensing.
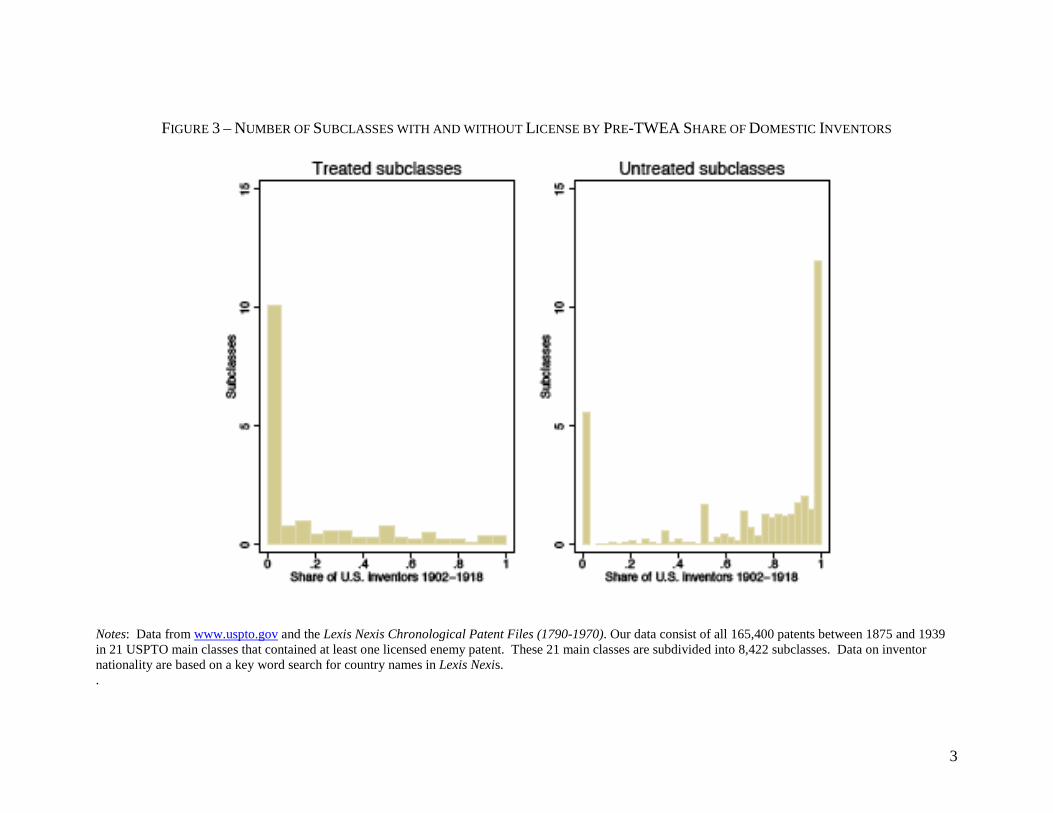
3
FIGURE 3 – NUMBER OF SUBCLASSES WITH AND WITHOUT LICENSE BY PRE-TWEA SHARE OF DOMESTIC INVENTORS
Notes: Data from www.uspto.gov and the Lexis Nexis Chronological Patent Files (1790-1970). Our data consist of all 165,400 patents between 1875 and 1939 in 21 USPTO main classes that contained at least one licensed enemy patent. These 21 main classes are subdivided into 8,422 subclasses. Data on inventor nationality are based on a key word search for country names in Lexis Nexis. .
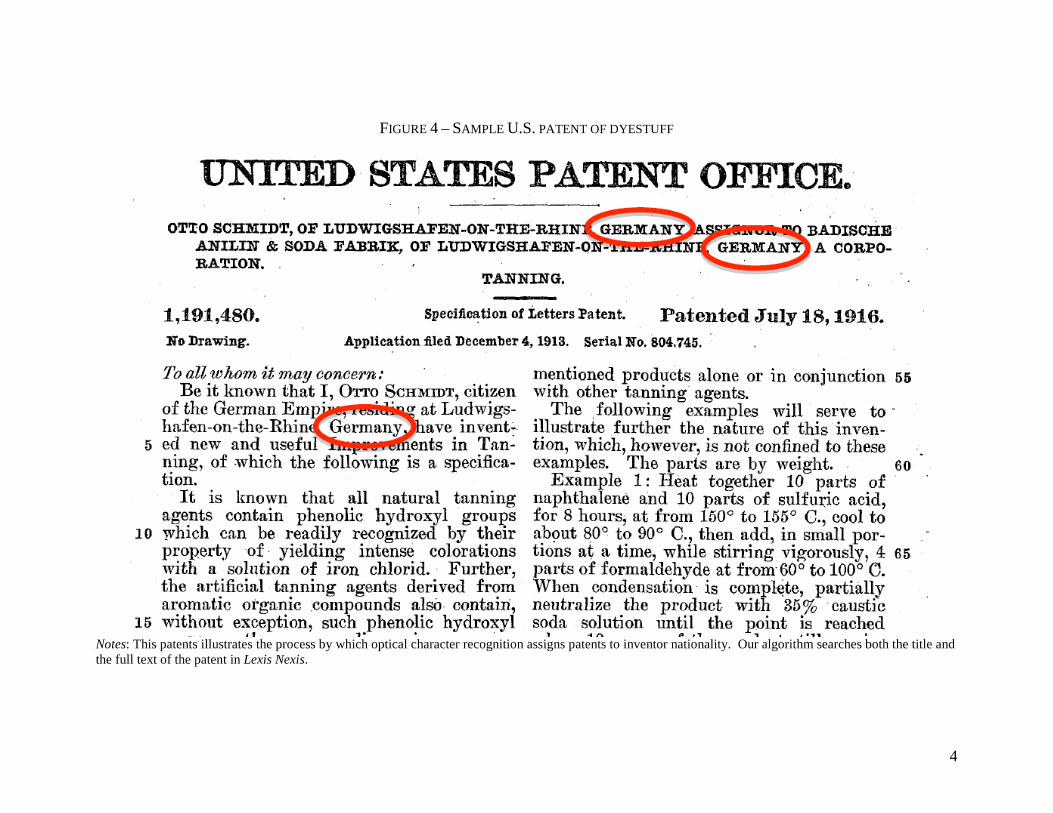
4
FIGURE 4 – SAMPLE U.S. PATENT OF DYESTUFF
Notes: This patents illustrates the process by which optical character recognition assigns patents to inventor nationality. Our algorithm searches both the title and the full text of the patent in Lexis Nexis.

5
FIGURE 5 – HAND-CHECKED AND ALGORITM ASSIGNED NATIONALITES BY USPTO CLASS (1900-1943)
0%
10%
20%
30%
40%
50%
60%
70%
80%
90%
100%
8 101 106 204 430 528 534 536 544 546 548 549 552 562 564 568 570
USPTO main class
Inve
ntor
s by
cou
ntry
Germany .U.S Other country
Hand-collected sample Machine-collected sample
Notes: Data from Haynes (1945), www.uspto.gov and www.lexisnexis.com. To collect data on inventor nationality, we create an algorithm that performs keyword searches on LexisNexis. This algorithm relies on Optical Character Recognition (OCR), which is worse at recognizing misspelled names or untidy script than the human eye. To check for measurement error, we hand-collected an alternative data set that includes all 625 patents for the most important dyes of the early 20th-century (Delamare and Guineau, 1999): alizarin, indigo, azo dyes, and aniline. In the hand-collected sample, inventors come from Argentina, Australia, Austria, Belgium, Brazil, China, England, France, Germany, India, Italy, the Netherlands, Russia, Scotland, Spain, Switzerland, and the United States.
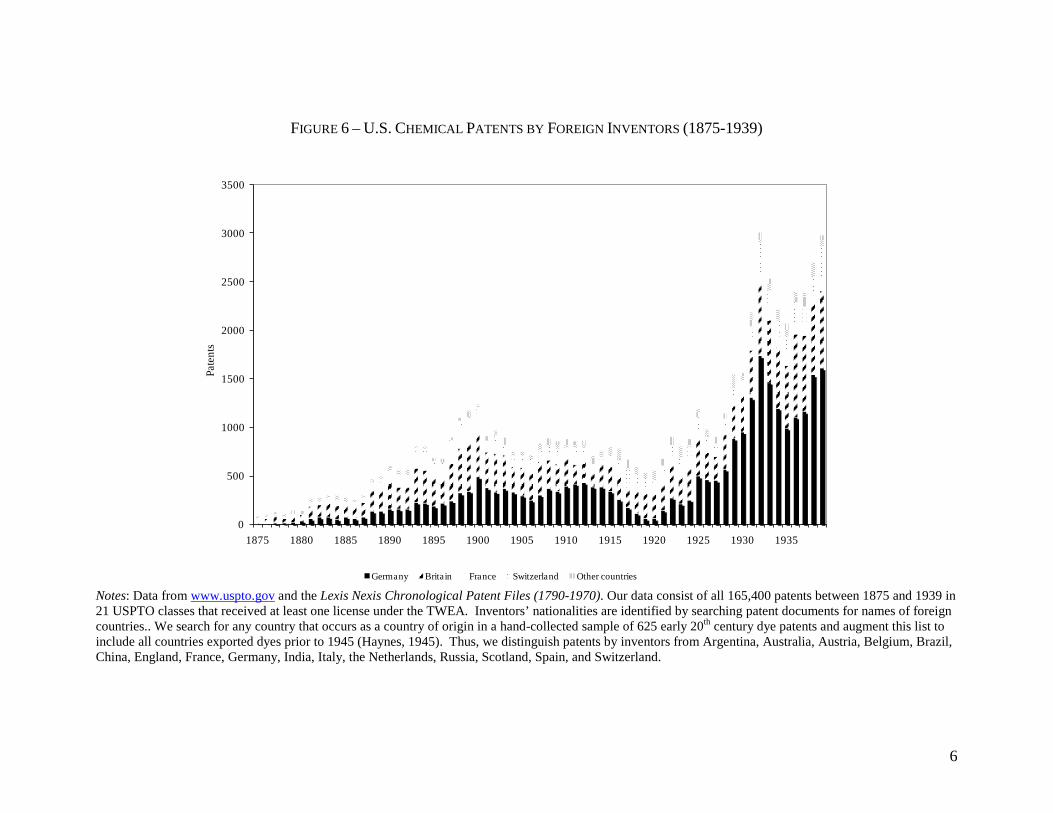
6
FIGURE 6 – U.S. CHEMICAL PATENTS BY FOREIGN INVENTORS (1875-1939)
0
500
1000
1500
2000
2500
3000
3500
1875 1880 1885 1890 1895 1900 1905 1910 1915 1920 1925 1930 1935
Pate
nts
Germany Britain France Switzerland Other countries Notes: Data from www.uspto.gov and the Lexis Nexis Chronological Patent Files (1790-1970). Our data consist of all 165,400 patents between 1875 and 1939 in 21 USPTO classes that received at least one license under the TWEA. Inventors’ nationalities are identified by searching patent documents for names of foreign countries.. We search for any country that occurs as a country of origin in a hand-collected sample of 625 early 20th century dye patents and augment this list to include all countries exported dyes prior to 1945 (Haynes, 1945). Thus, we distinguish patents by inventors from Argentina, Australia, Austria, Belgium, Brazil, China, England, France, Germany, India, Italy, the Netherlands, Russia, Scotland, Spain, and Switzerland.

7
FIGURE 7 – YEAR-SPECIFIC TREATMENT EFFECT (1919-1939), DIFFERENCE-IN-DIFFERENCES ESTIMATION
Notes: For a 95-percent confidence interval. Data from www.uspto.gov and www.lexisnexis.com. The data include all 165,400 patents between 1875 and 1939 in 21 USPTO main classes that received at least one license under the TWEA; data cover 8,422 subclasses, including 336 treated subclasses.
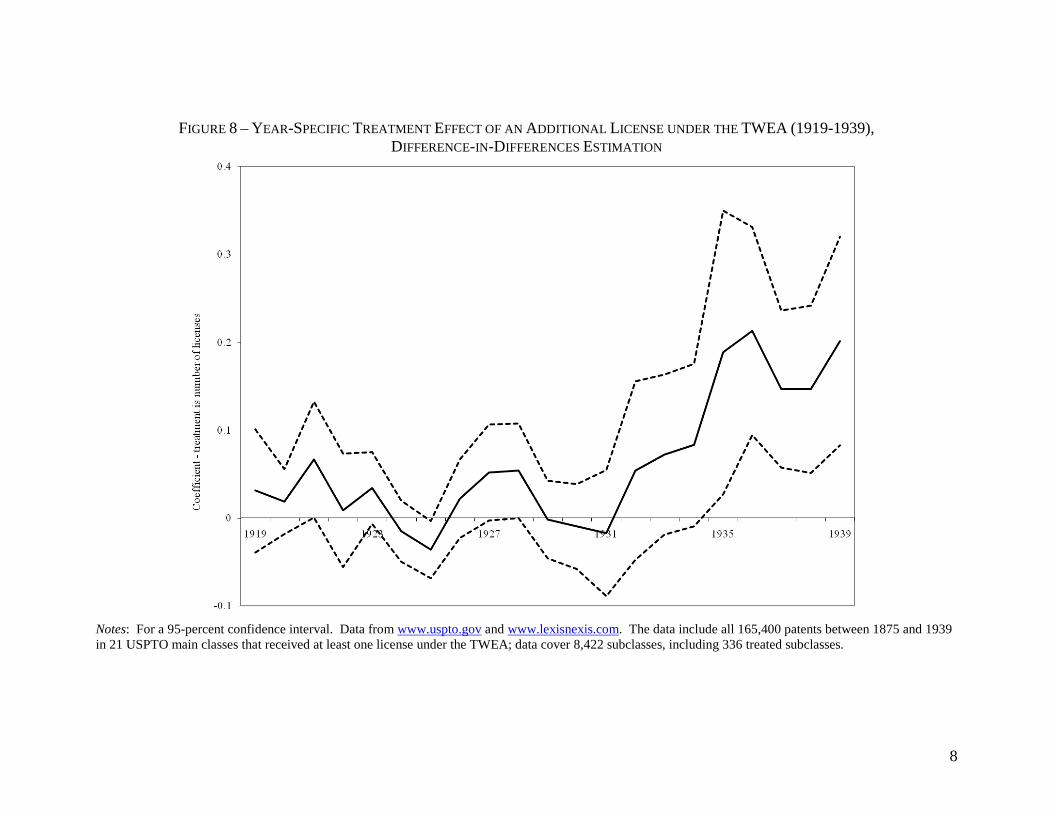
8
FIGURE 8 – YEAR-SPECIFIC TREATMENT EFFECT OF AN ADDITIONAL LICENSE UNDER THE TWEA (1919-1939), DIFFERENCE-IN-DIFFERENCES ESTIMATION
Notes: For a 95-percent confidence interval. Data from www.uspto.gov and www.lexisnexis.com. The data include all 165,400 patents between 1875 and 1939 in 21 USPTO main classes that received at least one license under the TWEA; data cover 8,422 subclasses, including 336 treated subclasses.
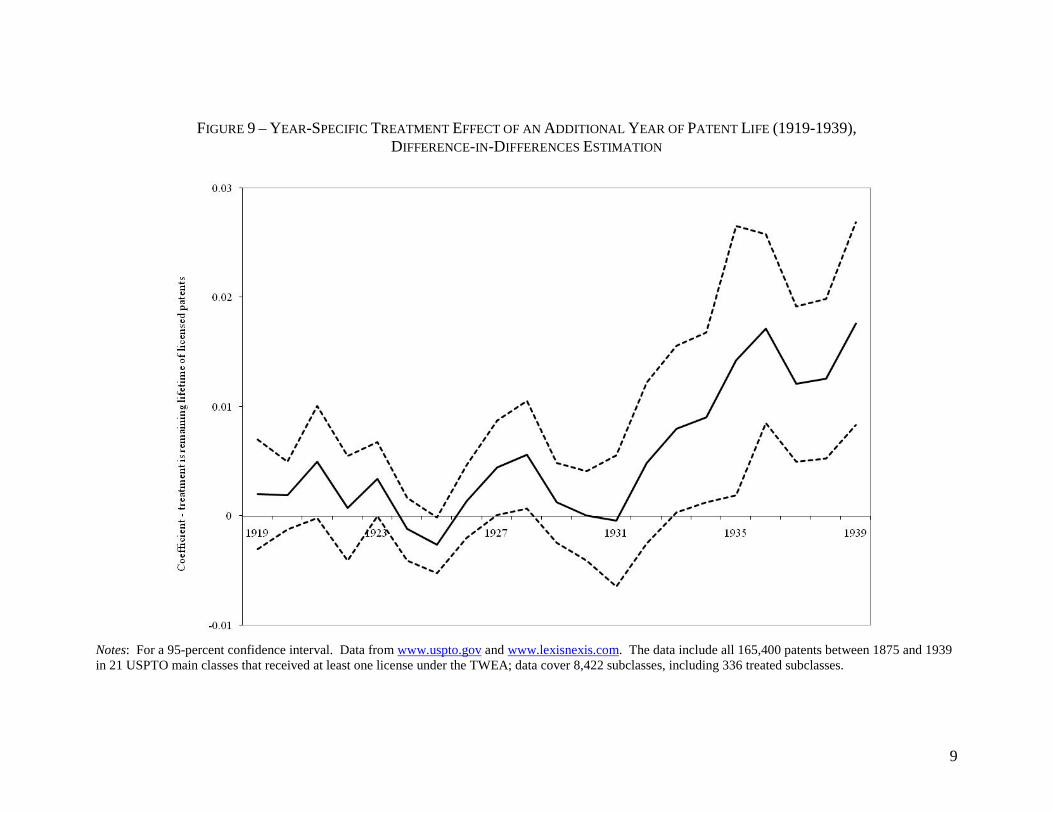
9
FIGURE 9 – YEAR-SPECIFIC TREATMENT EFFECT OF AN ADDITIONAL YEAR OF PATENT LIFE (1919-1939), DIFFERENCE-IN-DIFFERENCES ESTIMATION
Notes: For a 95-percent confidence interval. Data from www.uspto.gov and www.lexisnexis.com. The data include all 165,400 patents between 1875 and 1939 in 21 USPTO main classes that received at least one license under the TWEA; data cover 8,422 subclasses, including 336 treated subclasses.
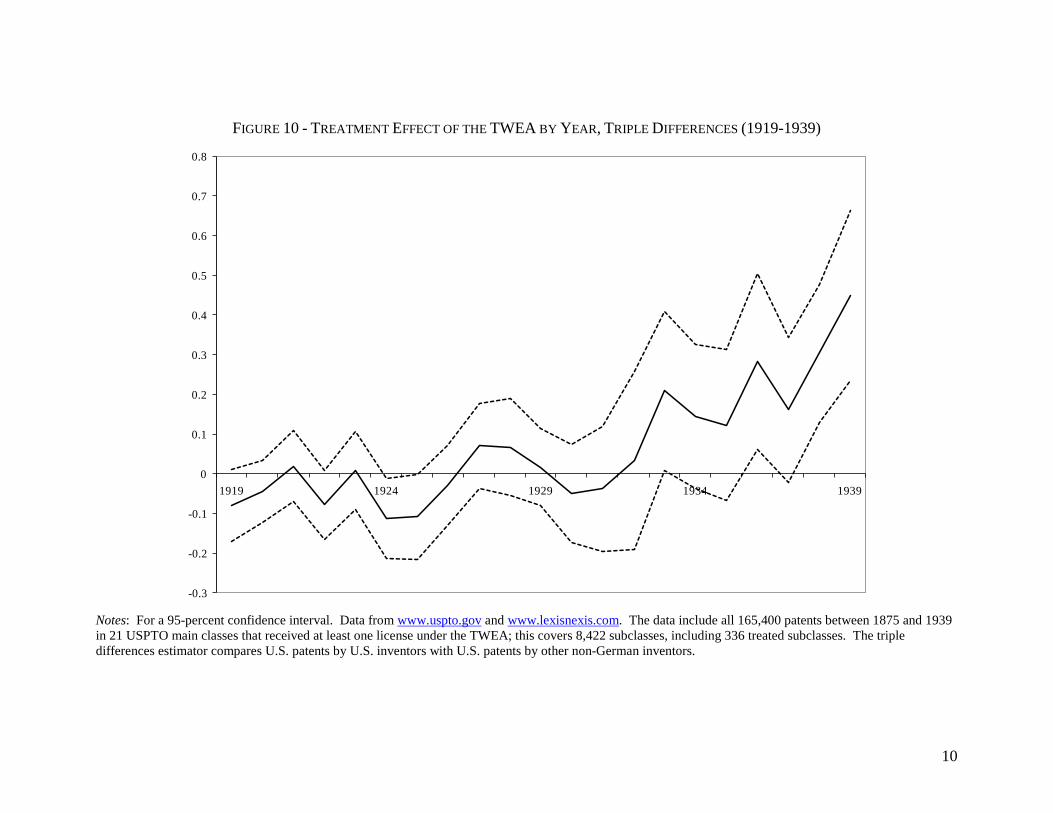
10
FIGURE 10 - TREATMENT EFFECT OF THE TWEA BY YEAR, TRIPLE DIFFERENCES (1919-1939)
-0.3
-0.2
-0.1
0
0.1
0.2
0.3
0.4
0.5
0.6
0.7
0.8
1919 1924 1929 1934 1939
Notes: For a 95-percent confidence interval. Data from www.uspto.gov and www.lexisnexis.com. The data include all 165,400 patents between 1875 and 1939 in 21 USPTO main classes that received at least one license under the TWEA; this covers 8,422 subclasses, including 336 treated subclasses. The triple differences estimator compares U.S. patents by U.S. inventors with U.S. patents by other non-German inventors.
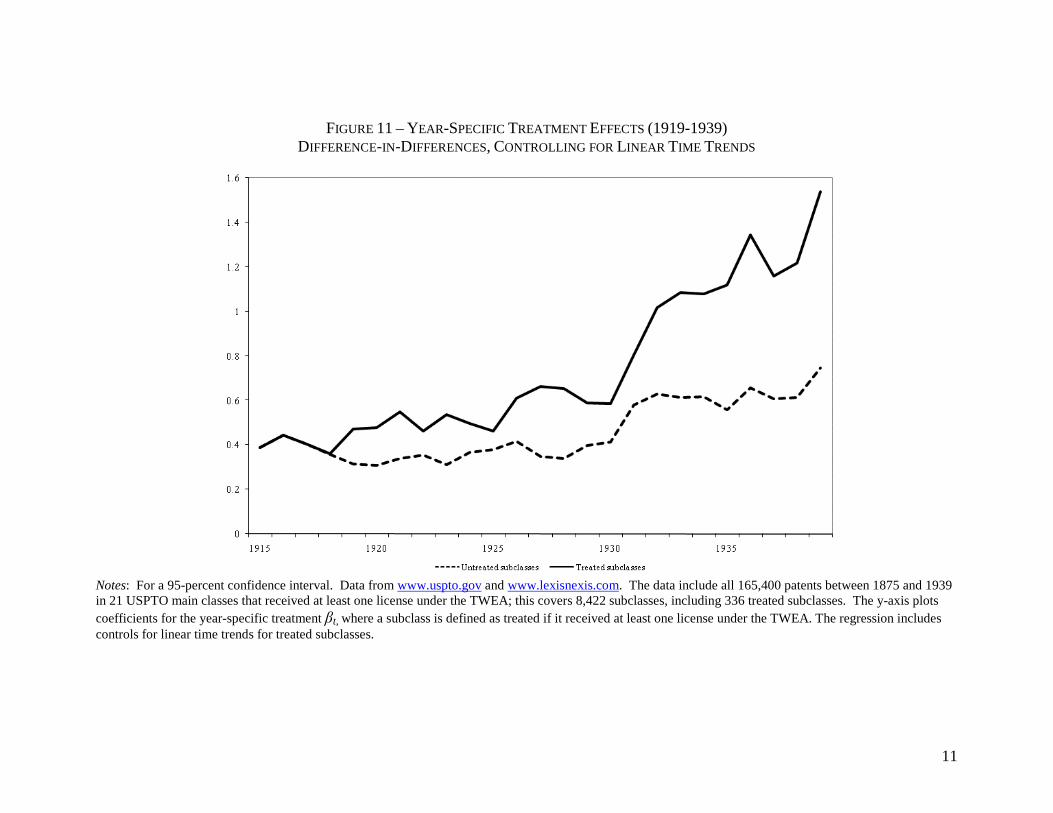
11
FIGURE 11 – YEAR-SPECIFIC TREATMENT EFFECTS (1919-1939) DIFFERENCE-IN-DIFFERENCES, CONTROLLING FOR LINEAR TIME TRENDS
Notes: For a 95-percent confidence interval. Data from www.uspto.gov and www.lexisnexis.com. The data include all 165,400 patents between 1875 and 1939 in 21 USPTO main classes that received at least one license under the TWEA; this covers 8,422 subclasses, including 336 treated subclasses. The y-axis plots coefficients for the year-specific treatment βt, where a subclass is defined as treated if it received at least one license under the TWEA. The regression includes controls for linear time trends for treated subclasses.
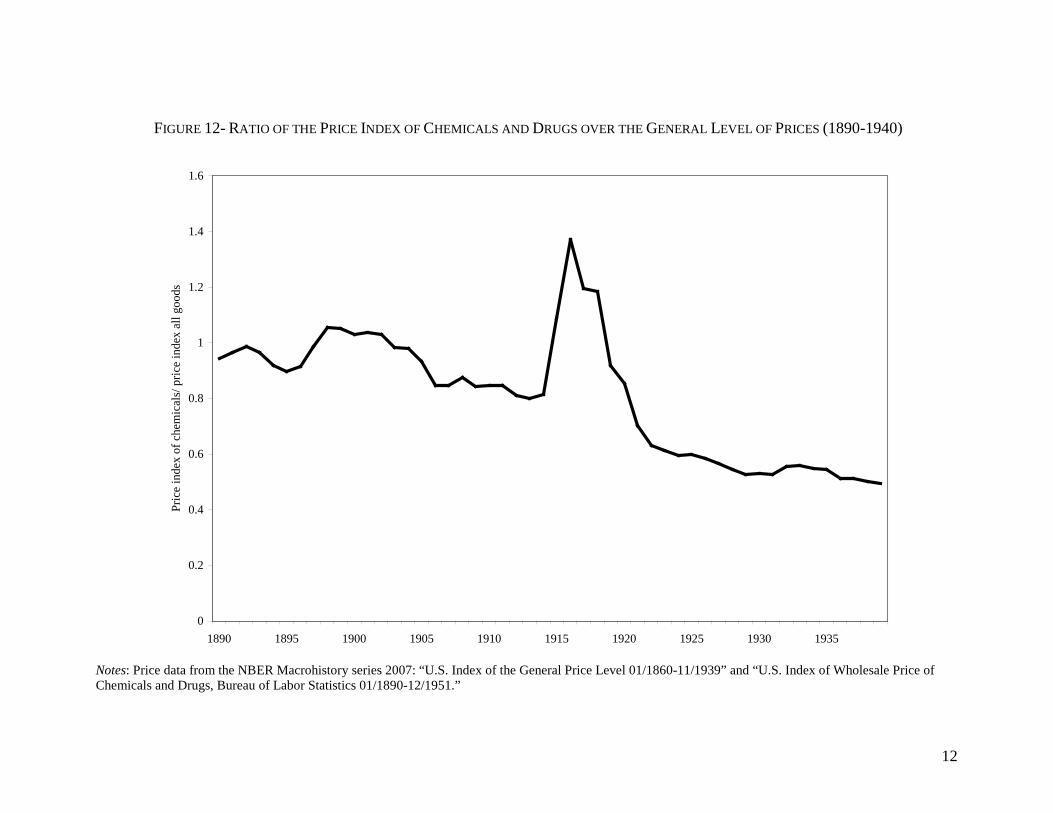
12
FIGURE 12- RATIO OF THE PRICE INDEX OF CHEMICALS AND DRUGS OVER THE GENERAL LEVEL OF PRICES (1890-1940)
0
0.2
0.4
0.6
0.8
1
1.2
1.4
1.6
1890 1895 1900 1905 1910 1915 1920 1925 1930 1935
Pric
e in
dex
of c
hem
ical
s/ p
rice
inde
x al
l goo
ds
Notes: Price data from the NBER Macrohistory series 2007: “U.S. Index of the General Price Level 01/1860-11/1939” and “U.S. Index of Wholesale Price of Chemicals and Drugs, Bureau of Labor Statistics 01/1890-12/1951.”
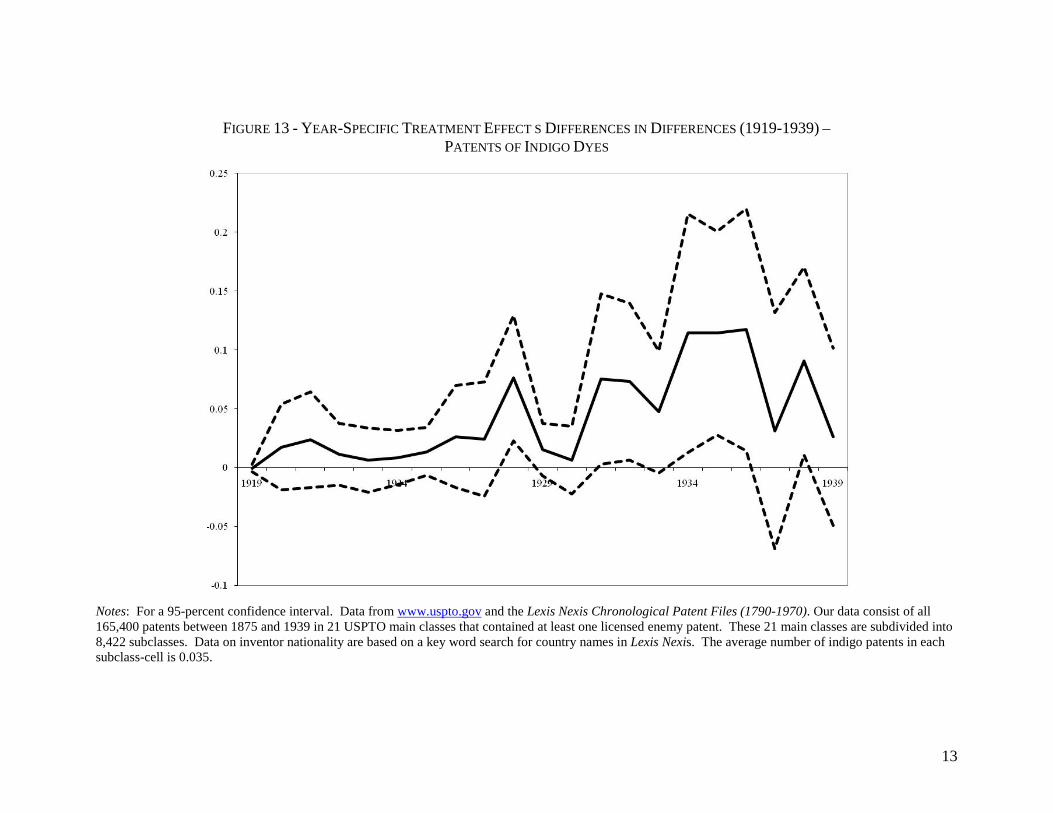
13
FIGURE 13 - YEAR-SPECIFIC TREATMENT EFFECT S DIFFERENCES IN DIFFERENCES (1919-1939) – PATENTS OF INDIGO DYES
Notes: For a 95-percent confidence interval. Data from www.uspto.gov and the Lexis Nexis Chronological Patent Files (1790-1970). Our data consist of all 165,400 patents between 1875 and 1939 in 21 USPTO main classes that contained at least one licensed enemy patent. These 21 main classes are subdivided into 8,422 subclasses. Data on inventor nationality are based on a key word search for country names in Lexis Nexis. The average number of indigo patents in each subclass-cell is 0.035.
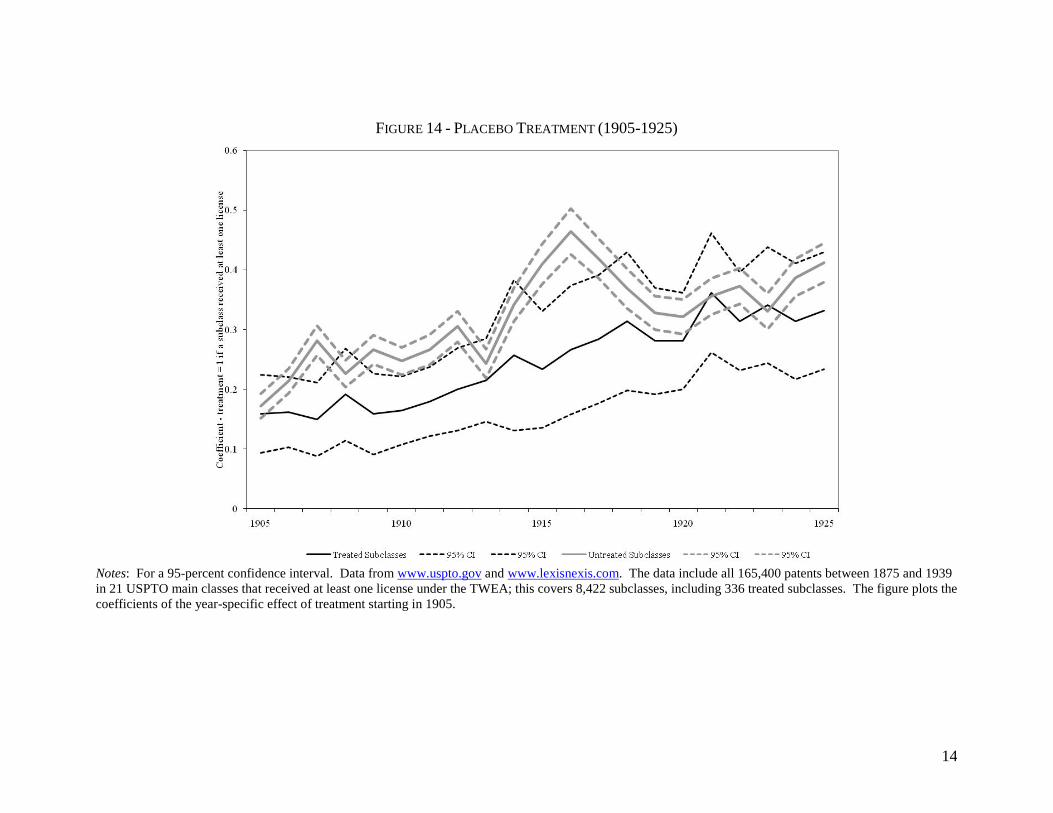
14
FIGURE 14 - PLACEBO TREATMENT (1905-1925)
Notes: For a 95-percent confidence interval. Data from www.uspto.gov and www.lexisnexis.com. The data include all 165,400 patents between 1875 and 1939 in 21 USPTO main classes that received at least one license under the TWEA; this covers 8,422 subclasses, including 336 treated subclasses. The figure plots the coefficients of the year-specific effect of treatment starting in 1905.
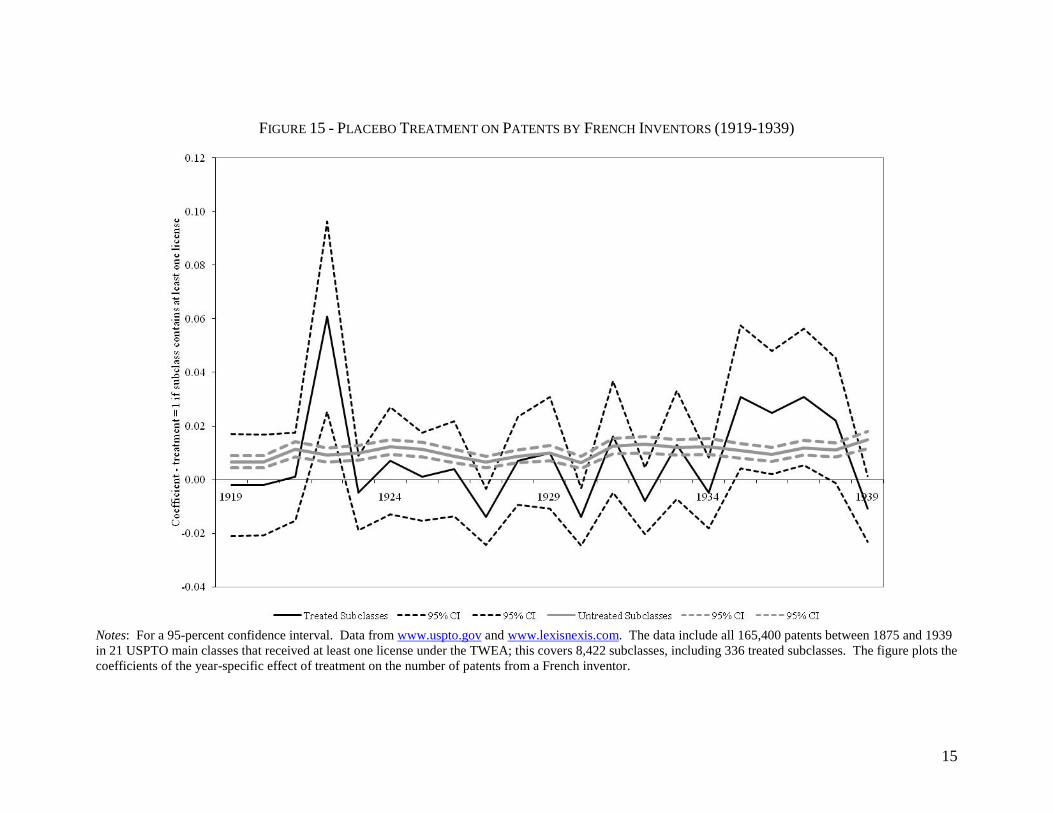
15
FIGURE 15 - PLACEBO TREATMENT ON PATENTS BY FRENCH INVENTORS (1919-1939)
Notes: For a 95-percent confidence interval. Data from www.uspto.gov and www.lexisnexis.com. The data include all 165,400 patents between 1875 and 1939 in 21 USPTO main classes that received at least one license under the TWEA; this covers 8,422 subclasses, including 336 treated subclasses. The figure plots the coefficients of the year-specific effect of treatment on the number of patents from a French inventor.