Comprehensive Marketing 'tools' review March 14, 2015
35
Page 1 of 35 How to Grow Your Business A Conversation with … Dr. Dennis R Wubbena Evangel University [email protected] ….. a comprehensive “marketing tools” review …it is a value creating process …without it, you are not a business …without more of it , you won’t stay in business …to make it happen, you must rethink your marketing strategy … often While not all the topics will apply to every business, most will lead you to valuable discussion of your strategic growth opportunities… UNDERSTANDING YOUR MARKET… is a critical first step… potential ... served ... penetrated ALL GROWTH OPPORTUNITES… are not equal ALL MARKETING INVOLVES … Segmentation – Targeting – Positioning MARKETS & PRODUCTS CHANGE OVER TIME… and so must your market strategy MARKETING IS… more than a simple business function INTEGRAGED MARKETING COMMUNICATIONS…going,” where the ducks are flying” …and learning how to speak ‘ duck.’ CUSTOMERS HAVE THE FINAL SAY GROWTH REQUIRES CUSTOMER-ORIENTED THINKING … Everyone wants to know how to grow their business… The Question is…”Can you help them?” Trust the ability of your experience and God’s touch in your life. The CORE of marketing is… E X H A G E IT REQUIRES… …two or more parties …freedom to reject or accept the offer …each has something of value & desire to deal …communication & delivery are both present …there is confidence in the promise …expectations are met The Goal of Holistic Marketing is the Creation of Customer Equity …a composite of Value Equity + Brand Equity+ Relationship Equity Growth is more than production efficiencies; more than product quality; more than the art of selling…. It is all about creating VALUE from the customer’s perspective
-
Upload
denny-wubbena -
Category
Documents
-
view
158 -
download
2
Transcript of Comprehensive Marketing 'tools' review March 14, 2015

Page 1 of 35
How to Grow Your Business A Conversation with … Dr. Dennis R Wubbena
Evangel University
….. a comprehensive “marketing tools” review
…it is a value creating process
…without it, you are not a business
…without more of it, you won’t stay in business
…to make it happen, you must rethink your marketing strategy … often
While not all the topics will apply to every business, most will lead you to valuable discussion of your strategic growth opportunities…
UNDERSTANDING YOUR MARKET… is a critical first step… potential ... served ... penetrated
ALL GROWTH OPPORTUNITES… are not equal
ALL MARKETING INVOLVES … Segmentation – Targeting – Positioning
MARKETS & PRODUCTS CHANGE OVER TIME… and so must your market strategy
MARKETING IS… more than a simple business function
INTEGRAGED MARKETING COMMUNICATIONS…going,” where the ducks are flying”
…and learning how to speak ‘ duck.’
CUSTOMERS HAVE THE FINAL SAY GROWTH REQUIRES
CUSTOMER-ORIENTED THINKING …
Everyone wants to know how to grow their business…
The Question is…”Can you help them?”
Trust the ability of your experience and God’s touch in your life.
The CORE of marketing is…
E X H A G E
IT REQUIRES… …two or more parties
…freedom to reject or accept the offer
…each has something of value & desire to deal
…communication & delivery are both present
…there is confidence in the promise
…expectations are met
The Goal of Holistic Marketing is the Creation of Customer Equity …a composite
of Value Equity + Brand Equity+ Relationship Equity Growth is more than production efficiencies;
more than product quality; more than the art of
selling…. It is all about creating VALUE from the
customer’s perspective

Page 2 of 35
….. a comprehensive “marketing tools” review
A Conversation with … Dr. Dennis R Wubbena
Evangel University
Growth Strategy….Intended
Likely/Beneficial
Minor Issue
List of items to ‘scan’ on a regular basis
Minor Issue
Likely/Severe
Minor Issue
Likely/Beneficial
Likely/Severe
Minor Issue
T
O
S
W Weakness
Strength
Opportunity
Threat
Where Opportunities and Strengths Meet
Currently – from your
point of view, what is
your GREATEST
need…in support of
helping you grow?
Strategic Window
Page 3 of 35
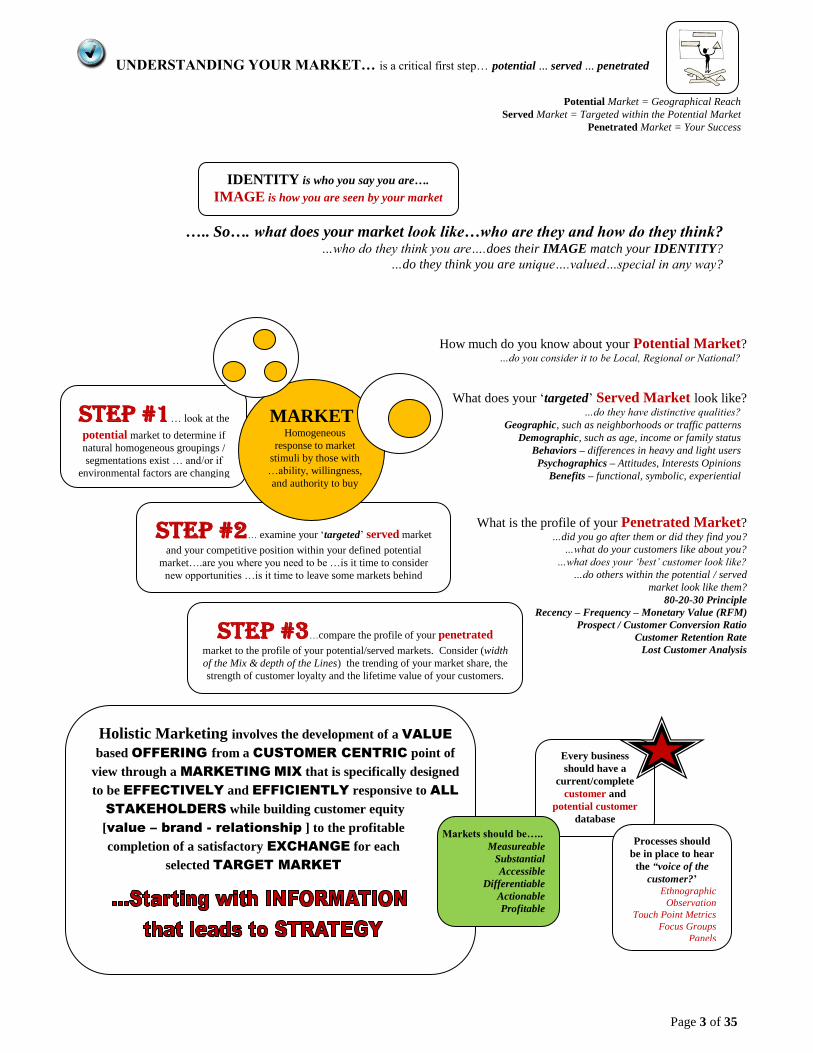
UNDERSTANDING YOUR MARKET… is a critical first step… potential ... served ... penetrated
Potential Market = Geographical Reach
Served Market = Targeted within the Potential Market
Penetrated Market = Your Success
….. So…. what does your market look like…who are they and how do they think? …who do they think you are….does their IMAGE match your IDENTITY?
…do they think you are unique….valued…special in any way?
How much do you know about your Potential Market? …do you consider it to be Local, Regional or National?
What does your ‘targeted’ Served Market look like? …do they have distinctive qualities?
Geographic, such as neighborhoods or traffic patterns
Demographic, such as age, income or family status
Behaviors – differences in heavy and light users
Psychographics – Attitudes, Interests Opinions
Benefits – functional, symbolic, experiential
What is the profile of your Penetrated Market? …did you go after them or did they find you?
…what do your customers like about you?
…what does your ‘best’ customer look like?
…do others within the potential / served
market look like them?
80-20-30 Principle
Recency – Frequency – Monetary Value (RFM)
Prospect / Customer Conversion Ratio
Customer Retention Rate
Lost Customer Analysis
IDENTITY is who you say you are….
IMAGE is how you are seen by your market
Holistic Marketing involves the development of a VALUE
based OFFERING from a CUSTOMER CENTRIC point of
view through a MARKETING MIX that is specifically designed
to be EFFECTIVELY and EFFICIENTLY responsive to ALL
STAKEHOLDERS while building customer equity
[value – brand - relationship ] to the profitable
completion of a satisfactory EXCHANGE for each
selected TARGET MARKET
Every business
should have a
current/complete
customer and
potential customer
database
Processes should
be in place to hear
the “voice of the
customer?’ Ethnographic
Observation
Touch Point Metrics
Focus Groups
Panels
Markets should be…..
Measureable
Substantial
Accessible
Differentiable
Actionable
Profitable
Step #2… examine your ‘targeted’ served market
and your competitive position within your defined potential
market….are you where you need to be …is it time to consider
new opportunities …is it time to leave some markets behind
Step #3…compare the profile of your penetrated
market to the profile of your potential/served markets. Consider (width
of the Mix & depth of the Lines) the trending of your market share, the
strength of customer loyalty and the lifetime value of your customers.
Step #1… look at the
potential market to determine if
natural homogeneous groupings /
segmentations exist … and/or if
environmental factors are changing
MARKET Homogeneous
response to market
stimuli by those with
…ability, willingness,
and authority to buy
Page 4 of 35
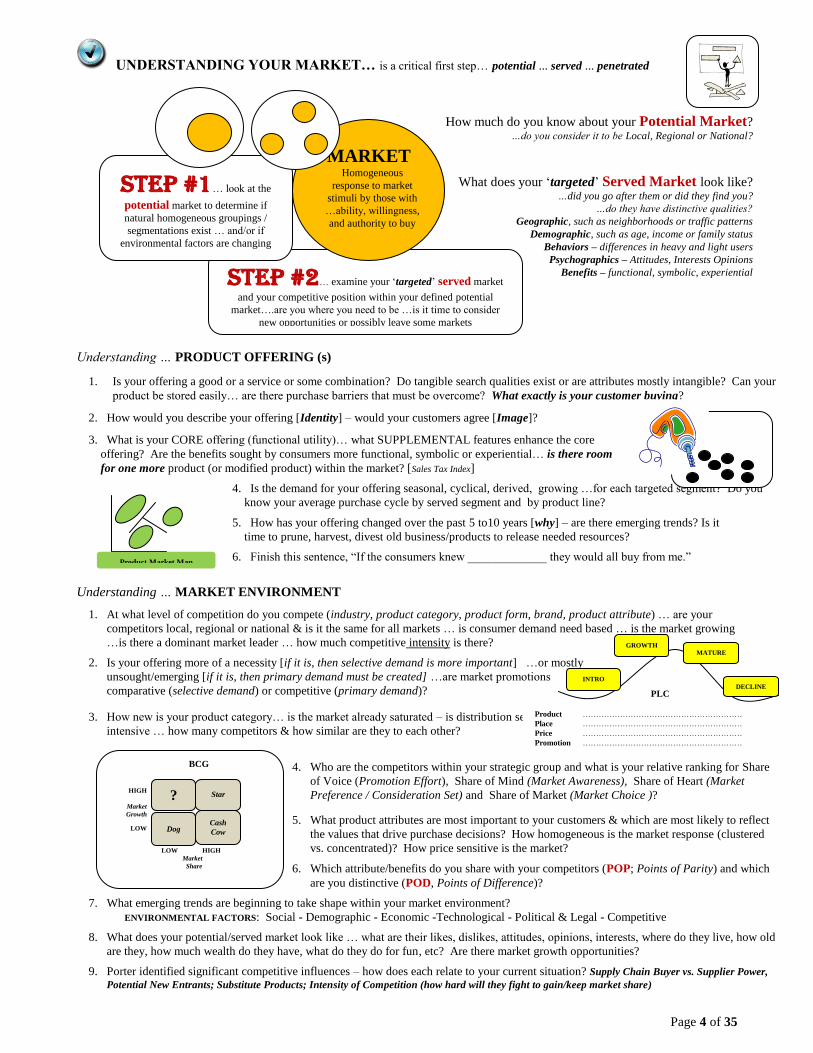
UNDERSTANDING YOUR MARKET… is a critical first step… potential ... served ... penetrated
How much do you know about your Potential Market? …do you consider it to be Local, Regional or National?
What does your ‘targeted’ Served Market look like? …did you go after them or did they find you?
…do they have distinctive qualities? Geographic, such as neighborhoods or traffic patterns
Demographic, such as age, income or family status
Behaviors – differences in heavy and light users
Psychographics – Attitudes, Interests Opinions
Benefits – functional, symbolic, experiential
Understanding … PRODUCT OFFERING (s)
1. Is your offering a good or a service or some combination? Do tangible search qualities exist or are attributes mostly intangible? Can your
product be stored easily… are there purchase barriers that must be overcome? What exactly is your customer buying?
2. How would you describe your offering [Identity] – would your customers agree [Image]?
3. What is your CORE offering (functional utility)… what SUPPLEMENTAL features enhance the core
offering? Are the benefits sought by consumers more functional, symbolic or experiential… is there room
for one more product (or modified product) within the market? [Sales Tax Index]
4. Is the demand for your offering seasonal, cyclical, derived, growing …for each targeted segment? Do you
know your average purchase cycle by served segment and by product line?
5. How has your offering changed over the past 5 to10 years [why] – are there emerging trends? Is it
time to prune, harvest, divest old business/products to release needed resources?
6. Finish this sentence, “If the consumers knew _____________ they would all buy from me.”
Understanding … MARKET ENVIRONMENT
1. At what level of competition do you compete (industry, product category, product form, brand, product attribute) … are your
competitors local, regional or national & is it the same for all markets … is consumer demand need based … is the market growing
…is there a dominant market leader … how much competitive intensity is there?
2. Is your offering more of a necessity [if it is, then selective demand is more important] …or mostly
unsought/emerging [if it is, then primary demand must be created] …are market promotions
comparative (selective demand) or competitive (primary demand)?
3. How new is your product category… is the market already saturated – is distribution selective or
intensive … how many competitors & how similar are they to each other?
4. Who are the competitors within your strategic group and what is your relative ranking for Share
of Voice (Promotion Effort), Share of Mind (Market Awareness), Share of Heart (Market
Preference / Consideration Set) and Share of Market (Market Choice )?
5. What product attributes are most important to your customers & which are most likely to reflect
the values that drive purchase decisions? How homogeneous is the market response (clustered
vs. concentrated)? How price sensitive is the market?
6. Which attribute/benefits do you share with your competitors (POP; Points of Parity) and which
are you distinctive (POD, Points of Difference)?
7. What emerging trends are beginning to take shape within your market environment?
ENVIRONMENTAL FACTORS: Social - Demographic - Economic -Technological - Political & Legal - Competitive
8. What does your potential/served market look like … what are their likes, dislikes, attitudes, opinions, interests, where do they live, how old
are they, how much wealth do they have, what do they do for fun, etc? Are there market growth opportunities?
9. Porter identified significant competitive influences – how does each relate to your current situation? Supply Chain Buyer vs. Supplier Power,
Potential New Entrants; Substitute Products; Intensity of Competition (how hard will they fight to gain/keep market share)
INTRO
DECLINE
MATURE GROWTH
Product ……………………………………………………
Place ……………………………………………………
Price ……………………………………………………
Promotion ……………………………………………………
?
Star
Dog
LOW HIGH
Market
Share
HIGH
Market
Growth
LOW Cash
Cow
BCG
PLC
Step #2… examine your ‘targeted’ served market
and your competitive position within your defined potential
market….are you where you need to be …is it time to consider
new opportunities or possibly leave some markets
Step #1… look at the
potential market to determine if
natural homogeneous groupings /
segmentations exist … and/or if
environmental factors are changing
MARKET Homogeneous
response to market
stimuli by those with
…ability, willingness,
and authority to buy
Product Market Map
Page 5 of 35
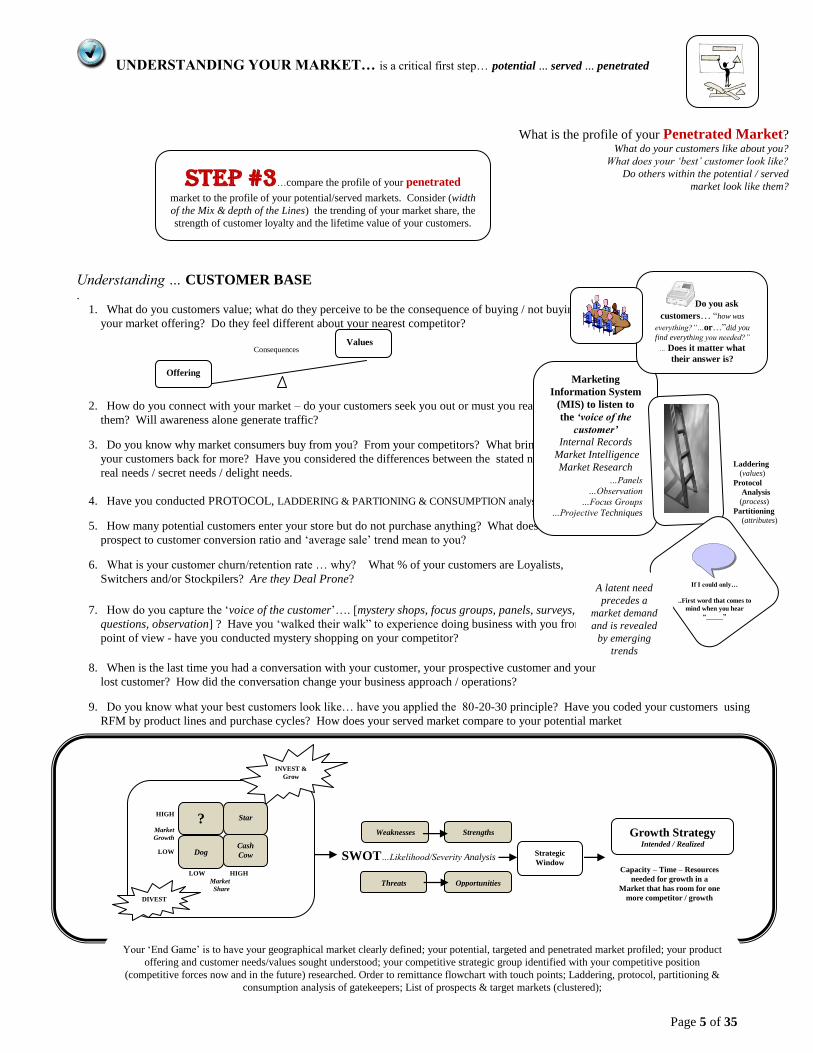
UNDERSTANDING YOUR MARKET… is a critical first step… potential ... served ... penetrated
What is the profile of your Penetrated Market? What do your customers like about you?
What does your ‘best’ customer look like?
Do others within the potential / served
market look like them?
Understanding … CUSTOMER BASE .
1. What do you customers value; what do they perceive to be the consequence of buying / not buying
your market offering? Do they feel different about your nearest competitor?
2. How do you connect with your market – do your customers seek you out or must you reach out to
them? Will awareness alone generate traffic?
3. Do you know why market consumers buy from you? From your competitors? What brings
your customers back for more? Have you considered the differences between the stated needs /
real needs / secret needs / delight needs.
4. Have you conducted PROTOCOL, LADDERING & PARTIONING & CONSUMPTION analysis?
5. How many potential customers enter your store but do not purchase anything? What does your
prospect to customer conversion ratio and ‘average sale’ trend mean to you?
6. What is your customer churn/retention rate … why? What % of your customers are Loyalists,
Switchers and/or Stockpilers? Are they Deal Prone?
7. How do you capture the ‘voice of the customer’…. [mystery shops, focus groups, panels, surveys, cashier
questions, observation] ? Have you ‘walked their walk” to experience doing business with you from their
point of view - have you conducted mystery shopping on your competitor?
8. When is the last time you had a conversation with your customer, your prospective customer and your
lost customer? How did the conversation change your business approach / operations?
9. Do you know what your best customers look like… have you applied the 80-20-30 principle? Have you coded your customers using
RFM by product lines and purchase cycles? How does your served market compare to your potential market
Marketing
Information System
(MIS) to listen to
the ‘voice of the
customer’
Internal Records
Market Intelligence
Market Research
…Panels
…Observation
…Focus Groups
…Projective Techniques
If I could only…
..First word that comes to
mind when you hear
“_____”
Laddering
(values)
Protocol
Analysis
(process)
Partitioning
(attributes)
Do you ask
customers… “how was
everything?”…or…”did you
find everything you needed?”
… Does it matter what
their answer is?
A latent need
precedes a
market demand
and is revealed
by emerging
trends
Values
Offering
Consequences
Step #3…compare the profile of your penetrated
market to the profile of your potential/served markets. Consider (width
of the Mix & depth of the Lines) the trending of your market share, the
strength of customer loyalty and the lifetime value of your customers.
Weaknesses
Threats Opportunities
Strengths
SWOT…Likelihood/Severity Analysis Strategic
Window Capacity – Time – Resources
needed for growth in a
Market that has room for one
more competitor / growth
INVEST &
Grow
DIVEST
?
Star
Dog
LOW HIGH
Market
Share
HIGH
Market
Growth
LOW Cash
Cow
Growth Strategy Intended / Realized
Your ‘End Game’ is to have your geographical market clearly defined; your potential, targeted and penetrated market profiled; your product
offering and customer needs/values sought understood; your competitive strategic group identified with your competitive position
(competitive forces now and in the future) researched. Order to remittance flowchart with touch points; Laddering, protocol, partitioning &
consumption analysis of gatekeepers; List of prospects & target markets (clustered);
Page 6 of 35
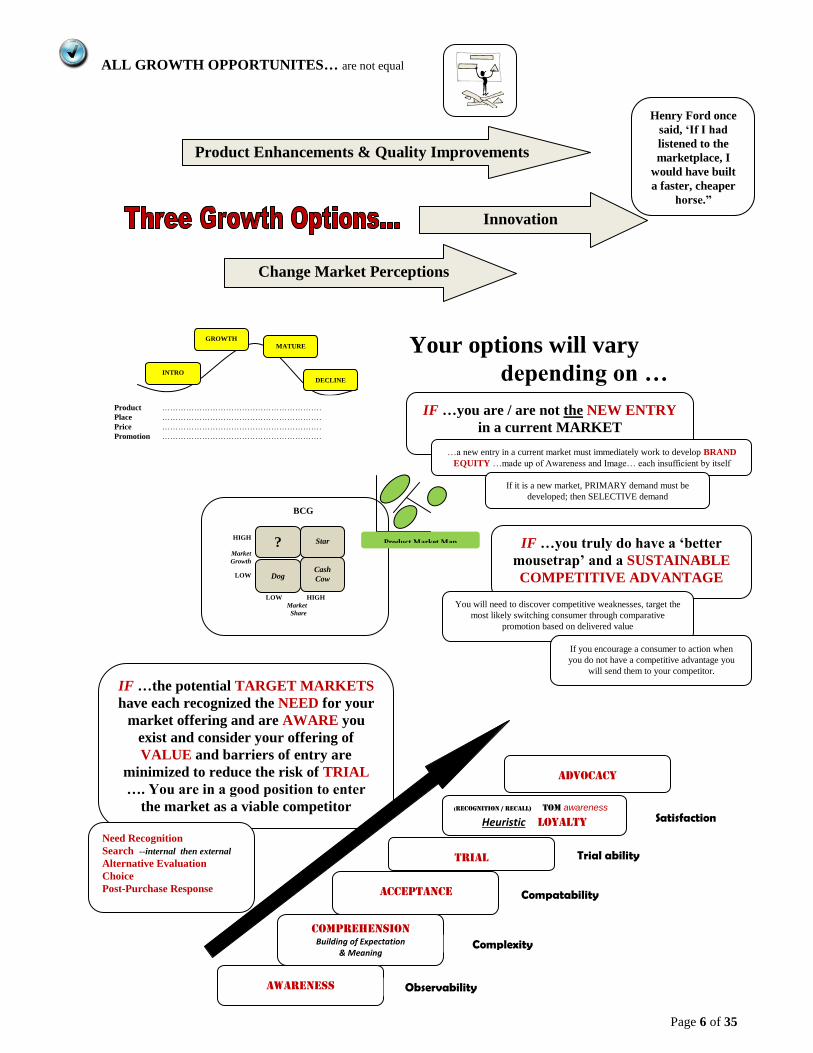
ALL GROWTH OPPORTUNITES… are not equal
Innovation
Product Enhancements & Quality Improvements
Change Market Perceptions
INTRO
DECLINE
MATURE
GROWTH
Product ……………………………………………………
Place ……………………………………………………
Price ……………………………………………………
Promotion ……………………………………………………
?
Star
Dog
LOW HIGH
Market
Share
HIGH
Market
Growth
LOW Cash
Cow
BCG
Product Market Map
Your options will vary
depending on …
IF …you are / are not the NEW ENTRY
in a current MARKET
IF …you truly do have a ‘better
mousetrap’ and a SUSTAINABLE
COMPETITIVE ADVANTAGE
You will need to discover competitive weaknesses, target the
most likely switching consumer through comparative
promotion based on delivered value
Compatability
Trial ability
Acceptance
Advocacy
Trial
(Recognition / recall) TOM awareness
Heuristic loyalty
Comprehension
Building of Expectation & Meaning
Awareness
Complexity
Observability
Satisfaction
IF …the potential TARGET MARKETS
have each recognized the NEED for your
market offering and are AWARE you
exist and consider your offering of
VALUE and barriers of entry are
minimized to reduce the risk of TRIAL
…. You are in a good position to enter
the market as a viable competitor
Need Recognition
Search --internal then external
Alternative Evaluation
Choice
Post-Purchase Response
If you encourage a consumer to action when
you do not have a competitive advantage you
will send them to your competitor.
…a new entry in a current market must immediately work to develop BRAND
EQUITY …made up of Awareness and Image… each insufficient by itself
If it is a new market, PRIMARY demand must be
developed; then SELECTIVE demand
Henry Ford once
said, ‘If I had
listened to the
marketplace, I
would have built
a faster, cheaper
horse.”

Page 7 of 35
ALL GROWTH OPPORTUNITES… are not equal
80-20-30 Principle
Recency – Frequency – Monetary Value (RFM)
Prospect / Customer Conversion Ratio
Customer Retention Rate/ Lifetime Value
Lost Customer Analysis
C ur A vg C ur A vg C ur A vg C ur A vg C ur A vg C ur A vg C ur A vg C ur A vg C ur A vg C ur A vg C ur A vg C ur A vg C ur A vg C ur A vg C ur A vg C ur A vg C ur A vg # % # %
Aug 160 230 8.0 5.9 9.0 3.2 4.0 2.6 15.0 6.3 4.0 2.0 5.0 2.9 2.0 1.3 1.0 1.5 3.0 2.4 1.0 1.5 1.0 1.6 3.0 2.4 2.0 1.6 2.0 1.2 5.0 1.7 8.0 4.0 73 46% 42 18%
Sep 237 225 12.0 5.7 7.0 2.3 19.0 6.5 4.0 1.9 8.0 2.3 5.0 1.3 2.0 1.5 4.0 2.4 0.0 1.5 3.0 1.5 4.0 1.2 5.0 2.7 6.0 1.6 2.0 1.2 11.0 4.3 1.0 1.6 93 39% 40 18%
Oct 236 243 15.0 7.2 15.0 6.9 3.0 2.5 12.0 3.4 4.0 1.9 5.0 1.9 4.0 2.3 6.0 1.6 2.0 1.6 3.0 1.9 2.0 1.7 7.0 2.3 6.0 2.0 9.0 4.5 3.0 1.1 5.0 1.8 101 43% 45 18%
Nov 251 288 17.0 14.1 5.0 3.4 4.0 3.5 3.0 2.3 3.0 2.8 5.0 3.3 2.0 2.2 2.0 2.0 2.0 2.1 1.0 1.7 2.0 1.9 11.0 3.5 12.0 7.2 1.0 1.6 2.0 3.1 3.0 1.8 75 30% 57 20%
D ec 1346 1216 38.0 5.2 18.0 3.8 10.0 1.6 8.0 1.5 4.0 2.4 5.0 1.6 2.0 1.6 12.0 1.3 10.0 1.2 6.0 1.2 7.0 1.6 88.0 8.4 6.0 1.4 15.0 2.4 5.0 1.1 1.1 234 17% 37 3%
18.0 7.6 10.8 3.9 8.0 3.3 8.4 3.1 4.6 2.3 5.0 2.2 2.4 1.8 5.0 1.8 3.4 1.8 2.8 1.6 3.2 1.6 22.8 3.9 6.4 2.8 5.8 2.2 5.2 2.3 4.3 2.1 25.8% Avg. 10.0% Avg.
90.0 38.1 54.0 19.6 40.0 16.7 42.0 15.4 23.0 11.4 25.0 11.0 12.0 8.9 25.0 8.8 17.0 8.8 14.0 7.8 16.0 8.0 114.0 19.3 32.0 13.8 29.0 10.9 26.0 11.3 17.0 10.3
10th M onth Current
C urrent
compared
t o
B enchmark
15th M onth 17th M onth16th M onth11th M onth 14th M onth7th M onth 8th M onth 9th M onth2xxx
5 Month Tot #
Benchmark
17 Month Response
Pattern
2nd M onth 5th M onth
Benchmark = Avg = 10 year average from 1995 - 2005 - includes lay aways
5 Month Avg
3rd M onth 4th M onth 13th M onth12th M onth6th M onth
258.4%231.8%
increase
200%
increase
590.6%
increase
201.7%
increase
227.2%
increase
New Customer -(Segment A) - In State (MO) - Responses From (August 1, 2xxx - July 31, 2xxx)
236.2%
increase
239.5%
increase
275.5%
increase
Page 1 of 2
134.8%
increase
284.1%
increase
272.7%
increase
266.1%
increase
230.1%
increase
165.1%
increase
239.5%
increase
179.4%
increase
Penetrate
Current
Market
Current
Product
Your #1 … Opportunity
…is doing more of what you
already do….better!
Build Primary Demand … especially if you are in the
growth stage of the PLC and if you are the market
leader with a competitive advantage
Build loyalty & Selective Demand …make sure
IMAGE matches IDENTITY … look for market GAPS
…understand how demand elasticity impacts your
sales …know your best customer profile and find
others just like them……consider a “beneficial”
frequency / loyalty program
Be Distinctively Better …increase the value your
customers receive and reduce their cost of doing
business with you. …it turns customers into advocates
and reduces price sensitivity
Improve RFM …create campaigns to increase usage
and up-sell current customers, increase average sale,
improve retention
Conduct Lost Customer Analysis
Listen to your customers – walk in their shoes!
MOST businesses are existing businesses within a
mature market … so that is where will start…..
ULTIMATELY, we want to grow our business by growing market
share – in most cases, this will come from our
competitors…. We
would do well to remember that they have
the same goal!
An important question to ask
is….are your current
customers ‘loyalists’
‘switchers’ ‘stockpilers’
Page 8 of 35
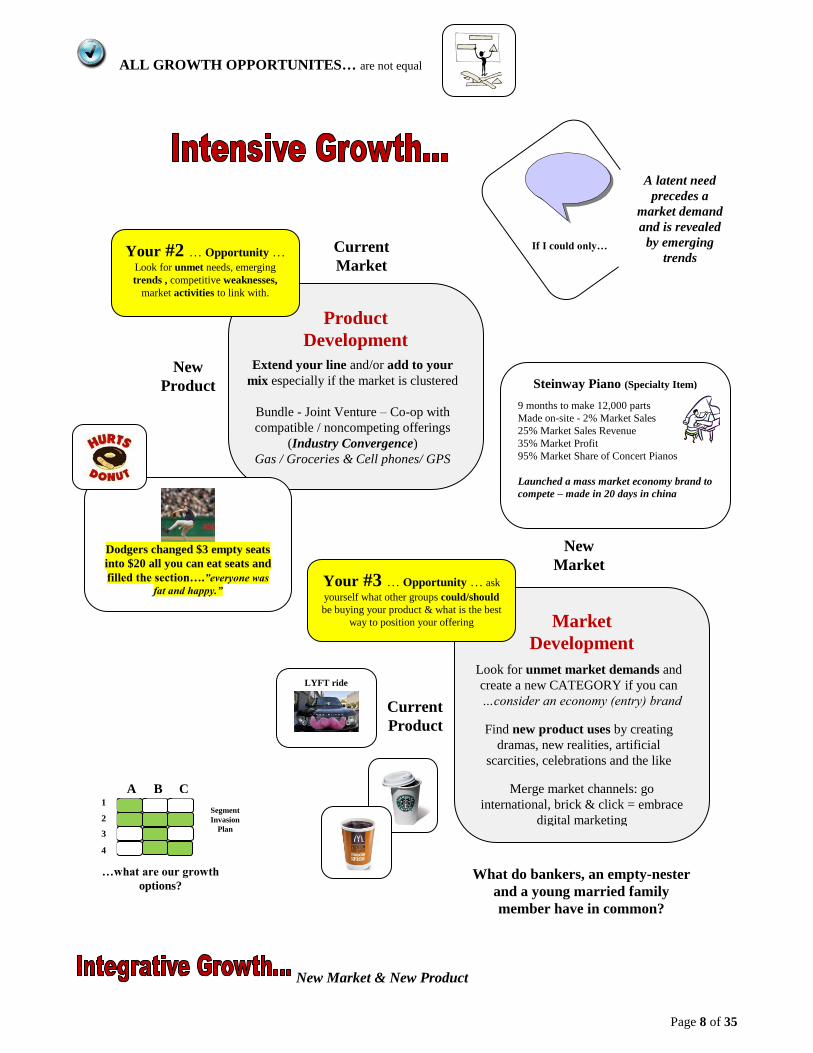
ALL GROWTH OPPORTUNITES… are not equal
New Market & New Product
Market
Development
Look for unmet market demands and
create a new CATEGORY if you can
…consider an economy (entry) brand
Find new product uses by creating
dramas, new realities, artificial
scarcities, celebrations and the like
Merge market channels: go
international, brick & click = embrace
digital marketing
Look for Niche opportunities
What do bankers, an empty-nester
and a young married family
member have in common?
Product
Development
Extend your line and/or add to your
mix especially if the market is clustered
Bundle - Joint Venture – Co-op with
compatible / noncompeting offerings
(Industry Convergence)
Gas / Groceries & Cell phones/ GPS
Your #2 … Opportunity …
Look for unmet needs, emerging
trends , competitive weaknesses,
market activities to link with.
Steinway Piano (Specialty Item)
9 months to make 12,000 parts
Made on-site - 2% Market Sales
25% Market Sales Revenue
35% Market Profit
95% Market Share of Concert Pianos
Launched a mass market economy brand to
compete – made in 20 days in china
Your #3 … Opportunity … ask
yourself what other groups could/should
be buying your product & what is the best
way to position your offering
Current
Market
New
Product
New
Market
Current
Product
If I could only…
A latent need
precedes a
market demand
and is revealed
by emerging
trends
Dodgers changed $3 empty seats
into $20 all you can eat seats and
filled the section….”everyone was
fat and happy.”
LYFT ride
Segment
Invasion
Plan
A B C 1
2
3
4
…what are our growth
options?
Page 9 of 35
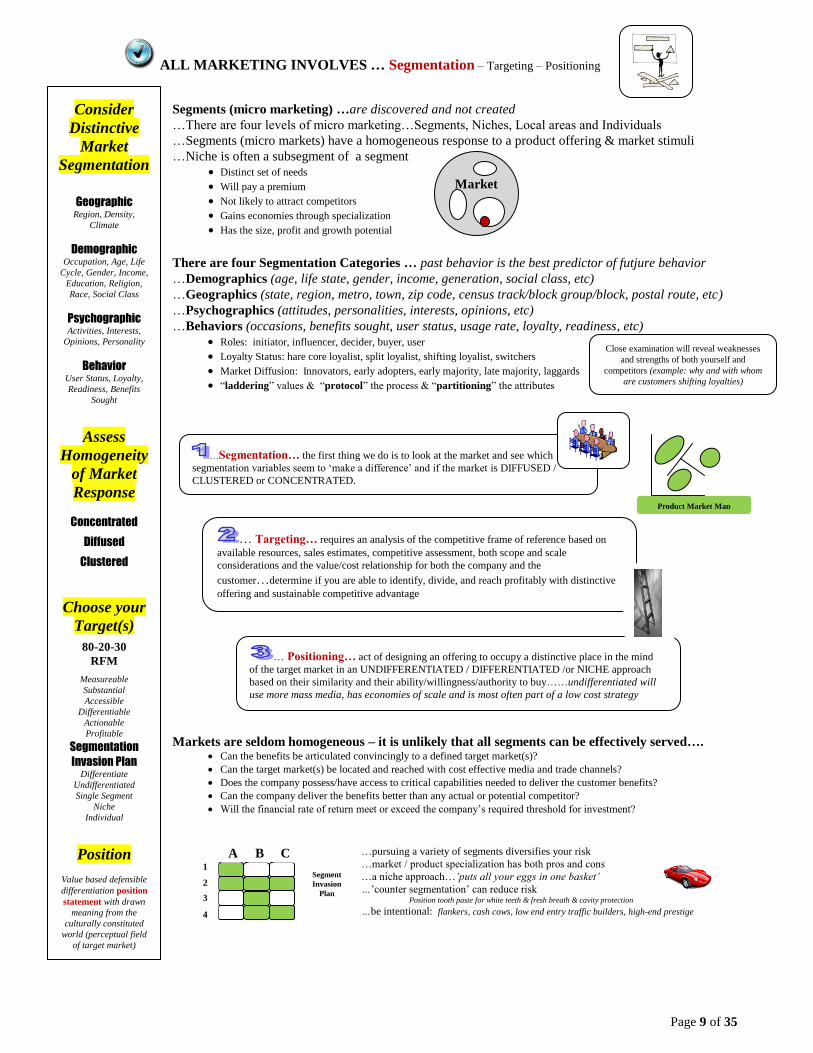
ALL MARKETING INVOLVES … Segmentation – Targeting – Positioning
Segments (micro marketing) …are discovered and not created
…There are four levels of micro marketing…Segments, Niches, Local areas and Individuals
…Segments (micro markets) have a homogeneous response to a product offering & market stimuli
…Niche is often a subsegment of a segment
Distinct set of needs
Will pay a premium
Not likely to attract competitors
Gains economies through specialization
Has the size, profit and growth potential
There are four Segmentation Categories … past behavior is the best predictor of futjure behavior
…Demographics (age, life state, gender, income, generation, social class, etc)
…Geographics (state, region, metro, town, zip code, census track/block group/block, postal route, etc)
…Psychographics (attitudes, personalities, interests, opinions, etc)
…Behaviors (occasions, benefits sought, user status, usage rate, loyalty, readiness, etc)
Roles: initiator, influencer, decider, buyer, user
Loyalty Status: hare core loyalist, split loyalist, shifting loyalist, switchers
Market Diffusion: Innovators, early adopters, early majority, late majority, laggards
“laddering” values & “protocol” the process & “partitioning” the attributes
Markets are seldom homogeneous – it is unlikely that all segments can be effectively served…. Can the benefits be articulated convincingly to a defined target market(s)?
Can the target market(s) be located and reached with cost effective media and trade channels?
Does the company possess/have access to critical capabilities needed to deliver the customer benefits?
Can the company deliver the benefits better than any actual or potential competitor?
Will the financial rate of return meet or exceed the company’s required threshold for investment?
Consider
Distinctive
Market
Segmentation
Geographic Region, Density,
Climate
Demographic Occupation, Age, Life
Cycle, Gender, Income,
Education, Religion,
Race, Social Class
Psychographic Activities, Interests,
Opinions, Personality
Behavior User Status, Loyalty,
Readiness, Benefits
Sought
Assess
Homogeneity
of Market
Response
Concentrated
Diffused
Clustered
Choose your
Target(s)
80-20-30
RFM
Measureable
Substantial
Accessible
Differentiable
Actionable
Profitable
Segmentation
Invasion Plan Differentiate
Undifferentiated
Single Segment
Niche
Individual
Position
Value based defensible
differentiation position
statement with drawn
meaning from the
culturally constituted
world (perceptual field
of target market)
…Segmentation… the first thing we do is to look at the market and see which
segmentation variables seem to ‘make a difference’ and if the market is DIFFUSED /
CLUSTERED or CONCENTRATED.
Close examination will reveal weaknesses
and strengths of both yourself and
competitors (example: why and with whom
are customers shifting loyalties)
Market
… Positioning… act of designing an offering to occupy a distinctive place in the mind
of the target market in an UNDIFFERENTIATED / DIFFERENTIATED /or NICHE approach
based on their similarity and their ability/willingness/authority to buy……undifferentiated will
use more mass media, has economies of scale and is most often part of a low cost strategy
Product Market Map
… Targeting… requires an analysis of the competitive frame of reference based on
available resources, sales estimates, competitive assessment, both scope and scale
considerations and the value/cost relationship for both the company and the
customer…determine if you are able to identify, divide, and reach profitably with distinctive
offering and sustainable competitive advantage
Segment
Invasion
Plan
A B C 1
2
3
4
…pursuing a variety of segments diversifies your risk
…market / product specialization has both pros and cons
…a niche approach…’puts all your eggs in one basket’
…’counter segmentation’ can reduce risk Position tooth paste for white teeth & fresh breath & cavity protection
…be intentional: flankers, cash cows, low end entry traffic builders, high-end prestige

Page 10 of 35
ALL MARKETING INVOLVES … Segmentation – Targeting – Positioning
- - - - - - - - - - - - - - - - - - - - - - - - - - - - - - - - - - - - - - - - -
Springfield
MSA
Springfield
MSA
Census Tracts
Springfield
MSA
Census Tract 26
(4) Block Groups

Page 11 of 35
ALL MARKETING INVOLVES … Segmentation – Targeting – Positioning
--------------------------------------------------------------------------------------------------------------------
Mosaics – PRIZM - Demographics Now – Tapestry - Simmons
http://guides.business-strategies.co.uk/mosaicusa2011/html/animation.htm - http://thelibrary.org/
--------------------------------------------------------------------------------------------------------------------
IS / has … [100 Index = Average / ‘normal’]
46 years of age (median)… compared to 35.6 years of age for
the Springfield Market as a whole… one Block Group is 51
More likely to have a club membership (136 Index)
More likely attend a Performing Arts event (136 Index)
A higher Household Net Worth (147 Index)
More likely to give to a Religious cause (140 Index)
More likely to give $250+ to a worthy cause (148 Index)
Credit Card usage in $451-$700 range (158 Index)
3-9 Investment Transactions / month (177 Index)
Any Mutual Funds (166 Index)
$2,000+ spent on clothing / year (149 Index)
$1,000 - $1,499 spent on fine jewelry / year (161 Index)
Bought a Rolex watch last year (165 Index)
$3,000+ spent on television / year (169 Index)
Used house cleaning 2 – 3 / year (220 Index)
Prefers Radio TALK Format (156 Index)
Visited Bed, Bath & Beyond / last 3 months (162 Index)
More likely to use dry cleaners (172 Index)
Not likely to wear clothes over 1 year old (177 Index)
72 % are “Thriving Boomers” (10.2%)or “Booming with
Confidence”(12%) or “Autumn Years” (33.7%) or
“Golden Guardians”(16.4%)
DO / are NOT …
Campers (88 Index)
Bowlers (96 Index)
Listen to COUNTRY Radio Format (71 Index)
Influenced by Billboard Ads (90 Index)
Consider foreign cars prestigious (66 Index)
Spend $100+ in a convenience store (85 Index)
Visit Silver Dollar City (51 Index)… however, the
index for visiting any amusement park is 104
Pay attention to movie theater ads (88 Index)
Consider specialty store brands to be of value (83
Index)… nor do they consider the quality of
specialty stores to be of value (85 Index)
Do not agree with the statement, “I buy what I
want, when I want it and price is not an issue.”
(92 Index)
One Census TraCT… within the Springfield Market
Census Tract = 29077002600 There are over 12,000 profiling descriptors
available
… within the Springfield Market
Census Tract …has 4 Block Groups
Average Household Income = $74,911 (138 Index)
Median Household Income = $57,326 (131 Index)
Overall Leisure Score = 169 Index

Page 12 of 35
Block Groups 6001 6002 6003 6004 Block Groups 6001 6002 6003 6004
2000 Median Age 49 49 46 46 Gave money to religious
organization 99.3 74.58 95.27 137.93
2010 Median Age 46 44 42 51 Very Likely - remodel bathroom 98.21 67.03 81.06 130.95
Population 1168 904 1201 1531 HH owning $$ CD's 95.2 69.3 86.9 131.3
Autumn Years 43.04 39.42 27.68 28.65 Very Likely - remodel kitchen 94.60 66.77 81.61 122.42
Booming with Confidence 12.84 17.20 3.29 16.17 Downhill Skiing 91.55 82.39 79.34 134.27
Thriving Boomers 12.84 7.41 7.41 12.06 Weekend Newspaper VERY USEFUL 89.79 64.48 87.81 120.25
Golden Year Guardians 12.30 14.29 20.26 17.45 Wallgreens (last 6 months) 88.61 64.15 88.61 119.94
INDEX INDEX - based on Springfield
MSA
Somewhat Conservative Politically 88.32 65.12 86.69 122.51
Leisure Score 189.22 177.63 185.84 170.39 Adult Education Course (last year)
86.34 65.03 84.21 118.32
Perform Arts/Movies HH Exp 185.2 148.6 112.0 187.4
Used YP to find Florest (last year) 85.14 65.58 87.44 120.80
Social / Rec Club Mbrship HH Exp
178.5 143.2 107.2 180.7 "I decide what I want before I
shop" 84.47 71.25 76.64 137.85
Health Score 163.21 174.02 168.85 159.22 Very willing to pay more for
electronics 83.95 61.01 83.58 111.94
Average HH Income 163.0 128.8 95.6 158.0
$100+ spent on Baby Furniture 82.84 53.25 82.84 88.76
Gave gifts of jewelry (last year) 152.61 116.35 97.32 151.28
$150+ spent weekly - Groceries 82.66 61.85 78.65 112.25
HH Net Worth 150.9 162.6 88.5 184.0
LOTTERY past 12 months 80.93 57.29 79.90 104.05
"I buy what I want, price not an issue."
148.93 18.62 31.91 66.48 Incentives Influence my car
purchase 80.85 56.67 82.19 107.17
Dinner Out HH Exp 143.8 121.3 97.4 140.6
I plan to buy a car 80.76 59.07 83.37 111.04
Pharmacy/ Drug Store HH Exp 142.9 120.1 97.8 141.3
Applebees (last 6 months) 80.01 57.65 81.89 103.71
House Cleaning 2-3 times 141.09 123.46 123.46 246.91
Wood Working (last year) 79.03 54.08 74.88 101.22
Presc Drugs HH Exp 137.4 119.9 98.9 135.4
Discounts influence my hotel choices
77.86 55.94 81.64 104.31
"I avoid TV commercials." 125.98 58.49 35.99 89.98 Fast Food Drive-Thru (last 6
months) 76.31 54.35 77.98 101.03
"I prefer speciatly stores/ knowledge."
123.98 48.32 51.69 112.37 "I prefer speciatly stores / quality." 75.00 46.43 59.52 59.52
Bought a Rolex watch (last year)
123.46 61.73 123.46 185.19 Follow advice of my mechanic
74.81 52.35 77.66 99.64
3-9 Investment Transactions (last year)
122.54 96.28 111.6 183.81 Fast Food Restaruant
74.6 50.3 78.1 84.8
Quality of Life Score 119.03 122.98 124.36 120.81 Visited a Theme Park 73.78 56.04 70.96 102.00
$ Spent for Drycleaning 118.39 95.99 104.95 179.18
Restless Leg Syndrome 72.39 48.91 76.31 90.00
Own any mutual funds 117.86 90.86 105 167.57
Bowling 69.86 46.57 69.86 93.15
Economic Score 115.92 121.11 120.37 119.07 Any Camping
65.04 44.60 65.04 82.69
Televistion Sets Big Ticket $3,000+
114.85 91.88 114.85 168.45 "Foreign Cars are more
Prestigious." 64.90 50.87 66.65 8.77
Bed bath & Beyond (last 3 months)
111.76 89.41 106.93 162.51 Billboards are of Considerable
Interest 64.57 44.53 71.25 82.39
Avg Monthly CC charge = $451-700
111.2 88.03 109.65 151.35 Family Restaurant / Steak House
63.2 52.4 85.3 98.6
"I do not wear clothes over 1 yr old"
111.10 55.55 30.30 315.62 $100+ spent Convenience Stores
61.60 41.65 65.12 78.03
Radio - Talk Format 110.91 83.18 98.58 163.28
"Vitamins/ Nutrients make a difference."
57.96 79.89 75.38 116.83
"I prefer speciatly stores - brands."
110.03 46.76 34.39 57.08 "Branded prescriptions are better" 55.12 61.93 68.74 108.32
Spent $1,000 = $1,499 fine jueelry
108.58 86.86 97.72 162.87 Education Contributions (last
year) 49.1 65.1 185.02 71.95
Belong to any auto club 107.35 81.75 102.99 149.83
"I pay attention to movie theater ads."
40.77 35.04 85.36 94.92
Prof Exterminators (last year) 103.93 76.91 97.69 149.66 Visited Silver Dollar City 40.32 26.88 53.76 40.32
Travel Magazine 101.29 76.26 95.33 152.53
Financial service ads are interesting 34.79 69.05 51.66 146.54
$2,000 + spent on clothing 100.97 82.94 93.76 158.67
Radio - Country Format 29.20 19.11 29.97 37.00
Green = >130 Index
Red = < 60 Index

Page 13 of 35
ALL MARKETING INVOLVES … Segmentation – Targeting – Positioning
Tapestry Segmentation Area Profile – Springfield, MO http://thelibrary.org/research/business.cfm?lid=46
Households U.S. Households
Cumulative Cumulative
Rank Tapestry Segment Percent Percent Percent Percent Index
1 53. Home Town 16.1% 16.1% 1.4% 1.4% 1,150
2 48. Great Expectations 14.3% 30.4% 1.7% 3.1% 841
3 33. Midlife Junction 13.3% 43.7% 2.6% 5.7% 512
4 55. College Towns 12.0% 55.7% 0.9% 6.6% 1,333
5 36. Old and Newcomers 7.5% 63.2% 2.0% 8.6% 375
Subtotal 63.2% 8.6%
6 57. Simple Living 6.0% 69.2% 1.4% 10.0% 429
7 14. Prosperous Empty Nesters 5.5% 74.7% 2.1% 12.1% 262
8 30. Retirement Communities 3.9% 78.6% 1.6% 13.7% 244
9 29. Rustbelt Retirees 3.7% 82.3% 2.0% 15.7% 185
10 07. Exurbanites 3.1% 85.4% 2.5% 18.2% 124
Subtotal 22.2% 9.6%
11 63. Dorms to Diplomas 2.8% 88.2% 0.5% 18.7% 560
12 60. City Dimensions 1.8% 90.0% 0.9% 19.6% 200
13 65. Social Security Set 1.7% 91.7% 0.7% 20.3% 243
14 13. In Style 1.6% 93.3% 2.3% 22.6% 69
15 52. Inner City Tenants 1.2% 94.5% 1.4% 24.0% 86
16 50. Heartland Communities 1.1% 95.6% 2.0% 26.0% 55
17 22. Metropolitans 1.0% 96.6% 1.4% 27.4% 71
18 41. Crossroads 0.9% 97.5% 1.4% 28.8% 64
19 19. Milk and Cookies 0.8% 98.3% 2.2% 31.0% 36
20 03. Connoisseurs 0.7% 99.0% 1.3% 32.3% 54
Total 99.0% 32.3%
306
Index “trend” Reviews
…Sales tax by SIC
…UPC syndicated data
Page 14 of 35
ALL MARKETING INVOLVES … Segmentation – Targeting – Positioning
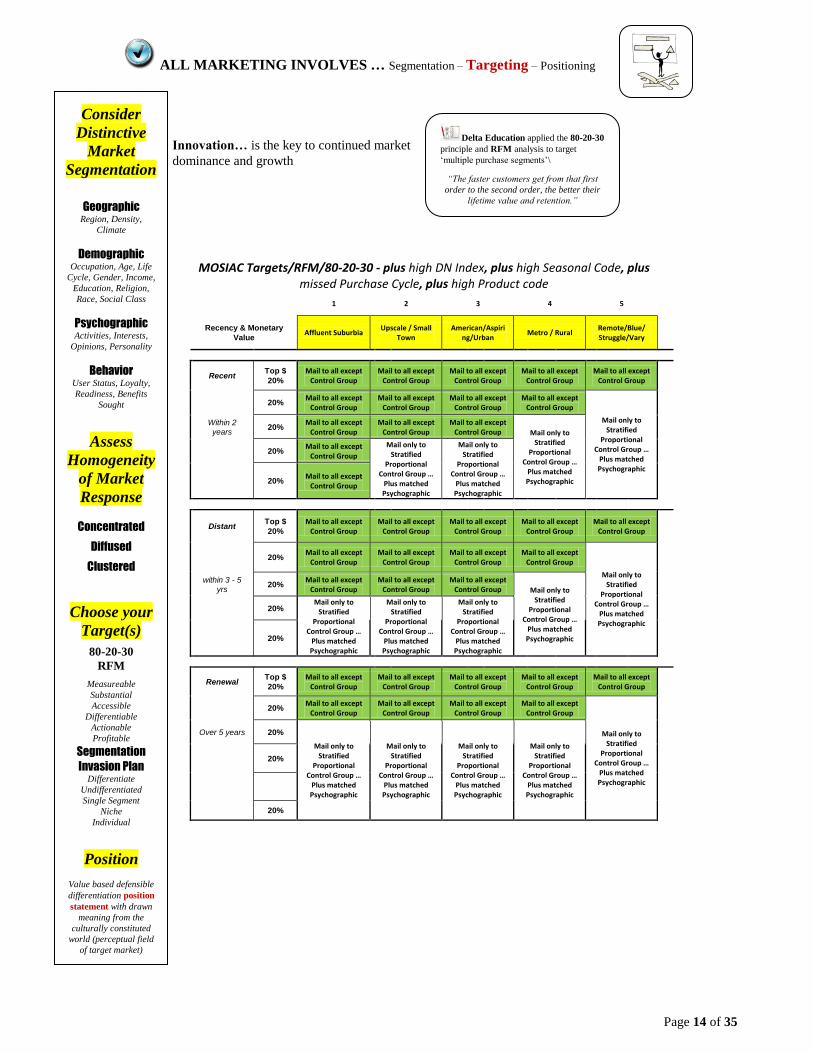
Innovation… is the key to continued market
dominance and growth
MOSIAC Targets/RFM/80-20-30 - plus high DN Index, plus high Seasonal Code, plus missed Purchase Cycle, plus high Product code
1 2 3 4 5
Recency & Monetary
Value Affluent Suburbia
Upscale / Small Town
American/Aspiring/Urban
Metro / Rural Remote/Blue/ Struggle/Vary
Recent Top $
20%
Mail to all except Control Group
Mail to all except Control Group
Mail to all except Control Group
Mail to all except Control Group
Mail to all except Control Group
20% Mail to all except
Control Group Mail to all except
Control Group Mail to all except
Control Group Mail to all except
Control Group
Mail only to Stratified
Proportional Control Group …
Plus matched Psychographic
Within 2
years 20%
Mail to all except Control Group
Mail to all except Control Group
Mail to all except Control Group Mail only to
Stratified Proportional
Control Group … Plus matched Psychographic
20% Mail to all except
Control Group
Mail only to Stratified
Proportional Control Group …
Plus matched Psychographic
Mail only to Stratified
Proportional Control Group …
Plus matched Psychographic
20% Mail to all except
Control Group
Distant Top $
20%
Mail to all except Control Group
Mail to all except Control Group
Mail to all except Control Group
Mail to all except Control Group
Mail to all except Control Group
20% Mail to all except
Control Group Mail to all except
Control Group Mail to all except
Control Group Mail to all except
Control Group
Mail only to Stratified
Proportional Control Group …
Plus matched Psychographic
within 3 - 5
yrs 20%
Mail to all except Control Group
Mail to all except Control Group
Mail to all except Control Group Mail only to
Stratified Proportional
Control Group … Plus matched Psychographic
20% Mail only to
Stratified Proportional
Control Group … Plus matched Psychographic
Mail only to Stratified
Proportional Control Group …
Plus matched Psychographic
Mail only to Stratified
Proportional Control Group …
Plus matched Psychographic
20%
Renewal Top $
20%
Mail to all except Control Group
Mail to all except Control Group
Mail to all except Control Group
Mail to all except Control Group
Mail to all except Control Group
20% Mail to all except
Control Group Mail to all except
Control Group Mail to all except
Control Group Mail to all except
Control Group
Mail only to Stratified
Proportional Control Group …
Plus matched Psychographic
Over 5 years 20%
Mail only to Stratified
Proportional Control Group …
Plus matched Psychographic
Mail only to Stratified
Proportional Control Group …
Plus matched Psychographic
Mail only to Stratified
Proportional Control Group …
Plus matched Psychographic
Mail only to Stratified
Proportional Control Group …
Plus matched Psychographic
20%
20%
Consider
Distinctive
Market
Segmentation
Geographic Region, Density,
Climate
Demographic Occupation, Age, Life
Cycle, Gender, Income,
Education, Religion,
Race, Social Class
Psychographic Activities, Interests,
Opinions, Personality
Behavior User Status, Loyalty,
Readiness, Benefits
Sought
Assess
Homogeneity
of Market
Response
Concentrated
Diffused
Clustered
Choose your
Target(s)
80-20-30
RFM
Measureable
Substantial
Accessible
Differentiable
Actionable
Profitable
Segmentation
Invasion Plan Differentiate
Undifferentiated
Single Segment
Niche
Individual
Position
Value based defensible
differentiation position
statement with drawn
meaning from the
culturally constituted
world (perceptual field
of target market)
Delta Education applied the 80-20-30
principle and RFM analysis to target
‘multiple purchase segments’\
“The faster customers get from that first
order to the second order, the better their
lifetime value and retention.”

Page 15 of 35
ALL MARKETING INVOLVES … Segmentation – Targeting – Positioning
SEMIOTICS
Study of signs and nature of
meaning producing events
MEANING IS A CONSTRUCTIVE PROCESS…
SOMETHING PERCEIVED
THAT SIGNIFIES SOMETHING (REFERENT)
TO SOMEBODY (INTERPRETER) IN SOME CONTEXT……..
S H A P I N G
From the Book The 22 Immutable Laws of Marketing by Al Ries & Jack Trout
Marketing is a battle of perception, not product. It's an illusion, there is no objective reality, there are no facts, there are no best
products, and all that exists in the world of marketing are perceptions in the minds of the prospect/customer. Therefore, the mind
takes precedence over the marketplace. Being first in the mind is everything in marketing. Once the consumer mind is made up, it
is like going head-to-head against an entrenched enemy. If you want to make a big impression on another person, you cannot
worm your way into their mind and then slowly build up a favorable opinion over a period of time - you have to blast your way into
the mind. When you have an open mind to work with, even a small amount of promotion money can go a long way. -A Honda in
New York is a car, a Honda in Japan is a motorcycle; -Why is Campbell’s' soup No. 1 in US and nowhere in the United Kingdom;
Why is Heinz number 1 in the United Kingdom and a failure in the US; -Coke "proved" that New Coke is No 1 in taste (200,000
taste tests), so why is it number 3 in sales and Coca-Cola Classic number one in sales and "proven" to taste worst?; -In 1986, CBS
broadcast a "60 minutes report" that Audis had "unintended acceleration" and American sales fell from 60,000 in 1986 to 12,000 in
1991. Reality is that every single automobile expert who has tested the car has failed to duplicate the complaint reported by CBS.
Which is truth ?
Marketing is often a search for the obvious. Since it is difficult to change a mind once its made up, your marketing efforts have to
be devoted to using ideas and concepts already installed in the brain. You have to use your marketing programs to "rub it in."
The marketing arena can be viewed as an ever-expanding sea of categories. A category starts off as a single entity. Computer, for example, went
from mainframes to minicomputers to workstations to personal computers to laptops to notebooks, etc. Each time subdividing into new categories to be
first in. Each is a separate, distinct entity & has its own reason for existence and its own leader.
The basic issue in marketing is creating a category you can be first in. It's the law of leadership. It's better to be first than it is to be better. It's
much easier to get into the mind first than to try to convince someone you have a better product than the one who got there first. There are many ways
to be first. When launching a new product, the first question should be "First What," not "How is this product better than the competitors." Think
categories - and promote the category when you are the first in a new category. Your strategy will depend on how soon you get into the mind. The
mind is selective in that prospects use their "ladders" in deciding which information to accept and which information to reject. In general, a mind
accepts only new data that is consistent with its product ladder in that category. The stage of growth will impact the value of the third position for a
given brand - eventually, most categories become a two brand category, therefore, if you are in the introductory stage, penetrate and gain market share
and if you are in the mature stage, start looking for new avenues/categories. If you have a small market share and you have to do battle with larger,
better-financed competitors, then your marketing strategy is probably faulty in the first place. -Chrysler introduced the first minivan and today has 50%
of the minivan market. -Order of introduction matches market share (Advil = 51%, Nuprin = 10% Medipren = 1%). -Burger King (after research
indicated that fast was the most important attribute) attempted to position themselves as Fast . What was overlooked was that McDonald's was already
perceived as being the fastest hamburger chain in the country. Burger King launched its campaign with the slogan, "Fast food for fast
times"....consequently, Herb, the advertising agency and management was fired.
The leader owns the word that stands for the category. The "word" must be available in the category, must have a narrow focus and must be an
important attribute. If you are not the leader, do not go up against the leaders "word," rather, narrow the focus on an idea that is opposite the leader (be
a pro-business candidate since there will be those who support the other side; pro-life is a focused powerful word with an opposite proponent). -Scope
labeled Listerine as the "medicine breath" so they could be the "good tasting mouthwash that kills germs.
Leaders in one category should not simply extend their brand to enter a new category. The best approach is to enter with a different brand name
Line extensions and coupons/premiums increase activity in the short run, however, they neutralize the differential advantage of the brand in the category
over the long run -GM at first did this with Oldsmobile, Pontiac, etc., became too much alike and now the Oldsmobile is gone. There have been two
strong moves against GM, the Japanese came at the low end with small cars and the Germans came at the high end. Under pressure to commit
resources in an attempt to shore up the bottom and the top of its lines (saving money and maintaining profits) GM made the fateful decision to build
many of its midrange cars using the same body style and suddenly, no one could tell a Chevrolet from a Pontiac. The look-alike cars weakened GM in
the middle and opened up a move for Ford as it broke through with the Taurus and Sable. Now we have Toyota, Honda, Taurus, Sable, Mercedes,
BMW's and GM is weak across the board. -Honda introduced Acura and set up separate dealerships to avoid confusion. -A-1 is a steak sauce (by
perception), therefore, even after an $18 million advertising budget, the A-1 poultry launch was a dismal failure. Marketing is a battle of perception, not
product. -The generalist is often weak. Take Kraft, for example. Everybody thinks Kraft is a strong brand name. In jellies and jams, Kraft
has 9% of the market and Smucker's has 35% (Smucker's is only jellies and jams); In mayonnaise, Kraft has 18% of the market and Hellmann's has
42%. Kraft does have a leading brand in terms of market share; however its name isn't Kraft, its Philadelphia cream cheese with 70% of the market.
22 Immutable Laws …marketing is a battle of perception.
Exposure / Awareness is necessary but
insuffivient for communication of
meaning…. Consumers analyze first
with feature analysis then contextually
by active synbthesis, based on what
they bring to the occasion (their
perceptual field)
VIVA MARKETING!! An inter-0ffice
softball game was held every year
between the marketing and support staff.
The support staff whipped the marketing
department soundly.
Memo Posted on the Bulletin …
”The Marketing Department is pleased to
announce that for the 2000 softball season,
we came in 2nd
place, having lost but one
game all year. The Support Department,
however, had a rather dismal season,
winning only one game.”
Consider
Distinctive
Market
Segmentation
Geographic Region, Density,
Climate
Demographic Occupation, Age, Life
Cycle, Gender, Income,
Education, Religion,
Race, Social Class
Psychographic Activities, Interests,
Opinions, Personality
Behavior User Status, Loyalty,
Readiness, Benefits
Sought
Assess
Homogeneity
of Market
Response
Concentrated
Diffused
Clustered
Choose your
Target(s)
80-20-30
RFM
Measureable
Substantial
Accessible
Differentiable
Actionable
Profitable
Segmentation
Invasion Plan Differentiate
Undifferentiated
Single Segment
Niche
Individual
Position
Value based defensible
differentiation position
statement with drawn
meaning from the
culturally constituted
world (perceptual field
of target market)
SIGN Stimuli used to evoke an intended meaning – anything
that is perceived by the senses and has the potential to
communicate meaning (internal response people hold for the
external stimuli)

Page 16 of 35
ALL MARKETING INVOLVES … Segmentation – Targeting – Positioning
Positioning is the act of designing an offering to occupy a distinctive place in the mind of the target market
A brand without equity is a commodity…Brand Equity = awareness plus a distinctive meaningful relative image Brand Awareness is necessary but insufficient; image drives brand equity – Top of Mind awareness is ideal with
recall second best and then recognition
Brand Image = A Value Driven customer perception of the offering based on a contextually constituted perceptual field
Brand Identity = A Value Based position statement offering the company’s distinctive market differentiation
Drivers of brand equity include Signs/Logos, market positioning and all associations (internal to
the customer and external by the company)
A brand must be…memorable, meaningful, likeable, adaptable over time, transferable to extensions, legally protectable
Marketing advantages of strong brands… Improved perception of product performance quality & conformance quality
Greater loyalty with relative market advantage
Less vulnerability to competitive marketing actions
Better margins and less elastic consumer response to price increases
A greater elastic demand response to price decreases
Better trade cooperation and support
Brand equity requires meaningful attribute differentiation… Points-of-Difference (POD) that give you distinction from your competitors must be relevant and believable (credible)
Points-of-Parity (POP) serve two purposes (1) provides category membership (2) designed to negate competitors POD’s
Sometimes attributes / benefits are negatively correlated and require separate positioning efforts (low calories / good taste;
fights dandruff/good for hair)
When it is not easy to differentiate by product attribute… add valued services, etc Atlantic group furniture can deliver
in 1 day - because of up-to-minute industry information, committed out sourcing partners, responsive
manufacturing, and extremely dedicated employees
Differentiation strategies could involve qualities/attributes/benefits/values such as…
Product Service Personnel Channel Identity Form Order Ease Competence Coverage Symbols
Feature bundles Delivery Courtesy Expertise Media
Performance Qlty Installation Credibility Performance Atmosphere
Conformance Qlty Cust. Tng. Reliability Events
Durability Consulting Responsiveness
Reliability Maintenance/repair Communication
Order Ease
Reparability
Style More Variables = Greater Differentiation Opportunity
Design (totality) Differentiate on 1, maybe 2, most 3 product variables
Strengthen your own position - Grab an unoccupied position - Deposition / reposition the competitor - Create image
of an exclusive club - Redesign - Alter beliefs - Alter importance weights – call attention to neglected attributes
Your market position will have a direct impact on your positioning strategy… For each category membership you hold, there will be a group of competitors – called a Strategic Group
Competitor Myopia is when you focus on only current competitors and not emerging ones. Watch for…
o Shifting degrees of differentiation and market position
o Entry – mobility – exit barriers (make it easy for competitors to exit)
o Cost structure differences – for some it is raw materials, others distribution costs, labor, etc
Share Metrics are important to monitor – Share of Voice, Mind, Heart, Market and Wallet Each category will face five competitive forces… in varying degrees
o Mobility threat of New Entrants into the category
o Emergence of new market substitutes for your offering – both consumer perception and reality
o Increased buyer leverage – Buyer Power
o Increased supplier leverage – Supplier Power
o Intensity of competitive rivalry – especially as market begins to shrink and competitors seek growth
Consider
Distinctive
Market
Segmentation
Geographic Region, Density,
Climate
Demographic Occupation, Age, Life
Cycle, Gender, Income,
Education, Religion,
Race, Social Class
Psychographic Activities, Interests,
Opinions, Personality
Behavior User Status, Loyalty,
Readiness, Benefits
Sought
Assess
Homogeneity
of Market
Response
Concentrated
Diffused
Clustered
Choose your
Target(s)
80-20-30
RFM
Measureable
Substantial
Accessible
Differentiable
Actionable
Profitable
Segmentation
Invasion Plan Differentiate
Undifferentiated
Single Segment
Niche
Individual
Position
Value based defensible
differentiation position
statement with drawn
meaning from the
culturally constituted
world (perceptual field
of target market)
..First word that
comes to mind when you
hear “____” KEY is to take all associations into account – not
making the same mistake as Coca Cola
% ImpProd
A
Prod
B
Prod
C
100%
100%
100%
100%
100% 100% 100%
Att
rib
ute
s
Mind Share
Heart Share
Market Share
Constant
Sum
Analysis
Product Market Map
Customer Equity = [value equity + brand equity + relationship equity]

Page 17 of 35
MARKETS & PRODUCTS CHANGE OVER TIME… and so must your market strategy
Strategy is impacted by… Product Classification… Specialty – Shopping - Convenience Product Tangibility… Separatability, Variability, Perishability Product Mix vs. Line Decisions…
Lines get deeper, especially if Market Share is a goal
There are economies of scale / scope with a wider mix
Adoption Sequence is Important… Innovators, early adopters, early majority, late majority
and laggards
Opinion leaders & Connectors are critical to adoption
Five characteristics influence adoption
o Compatability
o Complexity
o Trialability
o Communicability
o Relative advantage
There is a reason why the Marketing Mix
elements are called variables!
INTRODUCTION - GROWTH - MATURE - DECLINE Innovators Early adopters Early majority Middle majority Laggards
(4 C’s) 4 P’s of the MKT MIX
(Customer Solution) Product Variety – Quality – Features – Bundling – Warranties – Package Size
Classification Specialty Good Shopping Good Convience Good
Competitive Forces New Entrants / Supplier Power Buyer Power / Substitute Products / Intense Competition
Line / Mix Lines start to deepen and Mix will become wider
# of Substitutes None Few Some Many Few
Low sales & high cost per customer Peak sales and low cost per customer
(Customer Convenience) Place Coverage, Assortments, Inventory, Transportation, Channels
# Outlets Exclusive Selective Dual Distribution Intensive– Mass Distribution Selective
Chain Integration Building Integration Fully Integrated
(Customer Communication) Promotion Sales Promotion, Advertising, Public Relations, Direct Marketing, Personal Selling
Response Hierarchy Focus (PUSH) Awareness - Building Loyalties (PULL) Reminder
Product Demand Efforts Primary Selective Impulse
“Best” theory 3 Exposure Hypothesis (awareness) Shelf Space Model(reminder)
Encourage Trial Increase Brand Switching Minimal
(Customer Cost) Price Time/Money/Energy/Psychic - Discounts, Allowances, Returns, Credit Terms - Break Even Analysis
Elasticity Minimal Some High
Margin High Some Low
Profit Negative Good Low
Most competitive advantages are lost within a short time period – that is why it is always better to differentiate on values & experiences vs. features
Capacity tends to be overbuild during rapid growth and when a cyclical slowdown occurs, margins are driven down and competitive intensity increases
Competitive based Positioning Strategies
o Market-Leader (40+% of market share): expand total market demand; protect current market share (position, flank, preemptive
defense measures); expand market share, innovate
o Market-Challenger: look for market weaknesses and unoccupied positions, innovate
o Market-Follower: become a cloner, and imitator or an adaptor of the market leader – let them innovate
o Market-Nicher
Shake Out
Stage
Markets, not
marketers, determine
the PLC Stage
The reality is that
most products within
a given category are
in the mature stage
and similar;
Therefore, the
marketer is faced
with a double
whammy (slightly
involved consumers
and a me-too brand)
Augmented Product
Expected Product
Core
Product
Product Life
Cycle
Product
& Place… few many few
Promotion … awareness comparative reminder
Price Issues……Skim vs. Penetrate…………………Floor & Ceiling
Growth Stage Monopolistic Competition
Mature Stage Pure Competition
Decline Stage Oligopoly

Page 18 of 35
MARKETS & PRODUCTS CHANGE OVER TIME… and so must your market strategy
GENERIC PLC STRATEGIES
During the Introduction Stage: Work on delays in production, technical problems, distribution networks
and customer loyalties; Use promotion money to induce consumer trial (pull) and secure distribution (push);
Pursue Skimming or Penetration pricing based upon your relative market position and entry barriers; Seek
the Pioneer advantage but plan for the progression of the PLC.
During the Growth Stage: Consider product modifications ( new models, improve quality, add new lines &
flanker products, add features, improve styling, modify product / price gaps; Market modifications ( convert
non-users, enter new markets, steal market share, increase usage & frequency, volume used and new uses);
Increase distribution coverage and intensity and shelf space exposure; Respond to natural changes in the size
of the industry (economic outlook, demographic shifts, etc); Shift moves from building primary demand to
selective demand; Improve market position relative to competitor position (image); Lower prices or add
economy brands to attract next layer of consumers & switchers. Converge two industry trends and introduce
a hybrid product or service – Cell phone manufacturers added digital photo & GPS
During the Mature Stage: Take advantage of natural changes in the External Environment; Find new users
and new uses; Innovative product modifications; Stimulate non users /light users; Increase Occasions for use;
Expand distribution coverage, intensity and exposure; International production and sales – most products are
in the mature stage.
During the Decline Stage: Harvest or Divest or Dominate. Increase investment to buy out competitors to
dominate the market; Lower the exit barriers for competitors Decrease selectively to drop unprofitable
customers.
All of the following are true statements
1. Declining profit margins in late stages can reflect a shift in focus to price rivalry
2. Declining profit margins in early stages, may reflect too intense of capitalization
3. Generally, as a market grows in primary demand, the pioneer benefits most from the growth
4. A marketing strategy should be reformulated several times during a product’s life – expect it and plan for a seamless
progression!
5. A customer value package includes both tangible and intangible benefits – intangible are harder to help your
customer see but easier to defend against competitors
6. Companies should try to reduce exit barriers to help ailing competitors.
7. Not all industries have the same opportunity to differentiate
8. There are diminishing returns when it comes to quality product enhancements
9. Acceptance of the Life Cycle concept asserts that speeding up innovation is essential
10. It is sometimes better to be over budget and introduce to the market sooner than it is to be under budget and
introduce later
11. Rapid growth often leads to over capacity and lower margins
12. Monopolistic competition occurs within a market that is less homogeneous
13. Vertical concentric integration has disadvantages in that once the integration happens, it is more difficult to exit the
market and more likely to result in a fight for market share.
14. Elasticity of demand and overcapacity creates competitive intensity of a market.
15. PLC’s tend to be longer if the product meets a genuine need, is consistent with other trends and satisfies societal
values
16. Price skimming is best used in a market with high differentiation and low competitive rivalry
17. Promotion / sales ratio drops as the market leader moves from growth to mature stage
18. Most products are ‘me too’ products in the mature stage – which is generally the longest stage
19. The company faces a trade-off between higher market share and higher margin in late growth stage
20. The PLC cannot be controlled – it is driven by customer perception and must be monitored
21. “Shake out” begins in the mature stage– it is better if low exit barriers are in place
22. A latent need precedes a market demand and is revealed by emerging trends (trend analysis)
23. Consumer expectations are progressive, therefore, attribute-benefit-value based competition is dynamic (always
changing)
24. Competitor leapfrogging and technological innovation can eliminate pioneer advantage
25. Patterns of “conscious parallelism” are common in capital-intensive, homogeneous-product industries, especially in
the late mature / decline stages
ULTIMATELY,
we want to grow
our business by
growing/ stealing
market share
from our
competitors….
It would be wise
of you to
remember that
they have the
same goal!
Page 19 of 35
MARKETING IS… more than a simple business function
Good Marketing / Marketing Management …is not an accident
…is meeting needs profitably
…is an art and science of choosing target markets and getting, keeping and growing customers
through creating, delivery and communicating superior customer value
…is backed by an effective Marketing Information System (MIS) involving internal records, market
intelligence and market research
Set of procedures and sources managers use to obtain everyday information about developments in the
marketing environment
…is the foundation of effective market demand forecasting (both primary and selective)
Potential Market Demand: Those with sufficient level of interest
Available Market Demand: Those with Interest, Income and Access
Target Market: Those with Interest, Income, Access and are Qualified
Penetrated Market: Those that have purchased
Exchange … is core of marketing
…is a value-creating process because it normally leaves both parties better off
…NEEDS are basic human requirements that become WANTS when deirected to specific objects and
DEMANDS when backed by an ability to pay. … there are Stated Needs (need for a car);
Real Needs (an economical running car vs. low cost car); Unstated Needs (an expectation that
it will be serviced); a Secret Needs (symbolic / experiential values involved); Delight Needs
(something beyond expectation)
Holistic Marketing … has a goal of building Customer Equity [brand equity + value equity + relationship equity]
…is the development, design and implementation of marketing programs, processes and activities that
recognize their breadth and interdependencies
…is mostly concerned with building mutually satisfying, long-term relationships with key
stakeholders to earn and retain their business (profits will follow)
…reaches beyond the cost efficiency focus of the production concept, the ‘better mousetrap’ fallacy
that product quality is all it takes, the selling concept that accompanies the perspective that
all products are unsought … INTO a proactive market orientation based on both customer’s
latent needs [strong need that cannot be satisfied by an existing product] and expressed needs
(reactive marketing)
…is the capturing of Customer Value through …Value Exploration, Value Creation and Value Delivery
Value Exploration: Company identification of new value opportunities based on the
understanding of the customer cognitive space, latent needs and need for participation
Value Creation: Create more promising value offerings to idenify ‘benefits’ from the customer’s
poin to fview, applying core competencies and partner effectively with collaborators
Value Deliver: How a company aligns its resources, capabilities, core competencies to deliver
the value offering more effectively and efficiently…with accountability
meaningful
Holistic Marketing … has a goal of building
Customer Equity = [value equity + brand equity + relationship equity]
The heart of the
inernal records
system is the
order –to-
payment cycle
Data Trends

Page 20 of 35
MARKETING IS… more than a simple business function
MARKETING IS… more than a simple business function
Customer Perceived Value …Benefits (functional, symbolic, experiential) less Costs (time, energy, psychic, monetary) Holistic Marketing is all about increasing customer benefits and reducing customer costs
Customer Satisfaction …both Performance and Conformance quality, based on expectation Holistic Marketing is all about meeting real needs and expectations – stated by companies & perceived by customers
…….defining and delivering quality requires
Identification of customer needs and requirements
Communication of these requirements to product designers
Process & delivery – correct and on time
Customer support
Staying in touch with customers
Obtaining customer & market feedback
Peter Drucker,” The aim of marketing is
to make selling superfluous….that the
product sells itself.”
Marketing is Value Exploration …the
identification of new value opportunities,
requiring an understanding of the customer’s
cognitive space, latent needs and their drive for
participation. It is beyond production
efficiencies, product quality and/or the selling
of unsought goods and all about the relevance
of the product attributes in meeting value
driven needs
Zig Ziglar,”…are you selling
what your customers are
hoping to buy?
Marketing is Value
Delivery … the alignment of
company resources,
processes, policies, training,
performance metrics,
incentives and
accountabilities for the
capturing of Customer
Value. Resources –
Capabilities – Core
Competencies – Competitive
Advantage (sustainable)
Marketing is Value
Creation …to create more
promising value offerings
through an examination of
costs and benefits from the
customer’s point of view
Identity – Value based distinctive
differentiation relative to competitors
Image – Value driven contextual
consumer perception
VALUE Based-
Product
Offering
Consequences
VALUE Driven Needs-
Advantages
& benefits
…functional
…symbolic
…experiential
Page 21 of 35
MARKETING IS… more than a simple business function
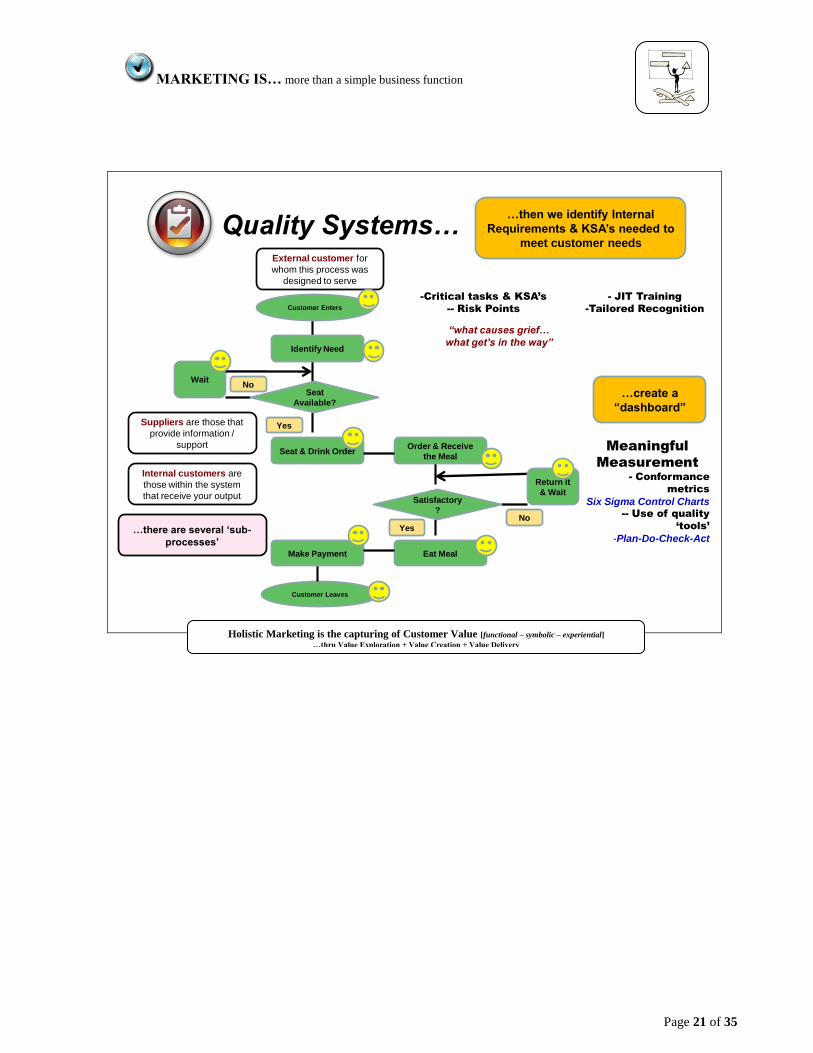
Quality Systems…
Identify Need
Customer Enters
Seat
Available?
Yes
NoWait
Seat & Drink Order
Eat Meal
Satisfactory
?
Yes
No
Customer Leaves
Order & Receive
the Meal
Make Payment
…there are several ‘sub-
processes’
External customer for
whom this process was
designed to serve
Suppliers are those that
provide information /
support
Internal customers are
those within the system
that receive your output
-Critical tasks & KSA’s
-- Risk Points
“what causes grief…
what get’s in the way”
Meaningful
Measurement
- Conformance
metrics
Six Sigma Control Charts-- Use of quality
‘tools’
-Plan-Do-Check-Act
…create a
“dashboard”
…then we identify Internal
Requirements & KSA’s needed to
meet customer needs
- JIT Training
-Tailored Recognition
Return it
& Wait
Holistic Marketing is the capturing of Customer Value [functional – symbolic – experiential]
…thru Value Exploration + Value Creation + Value Delivery
Page 22 of 35
MARKETING IS… more than a simple business function
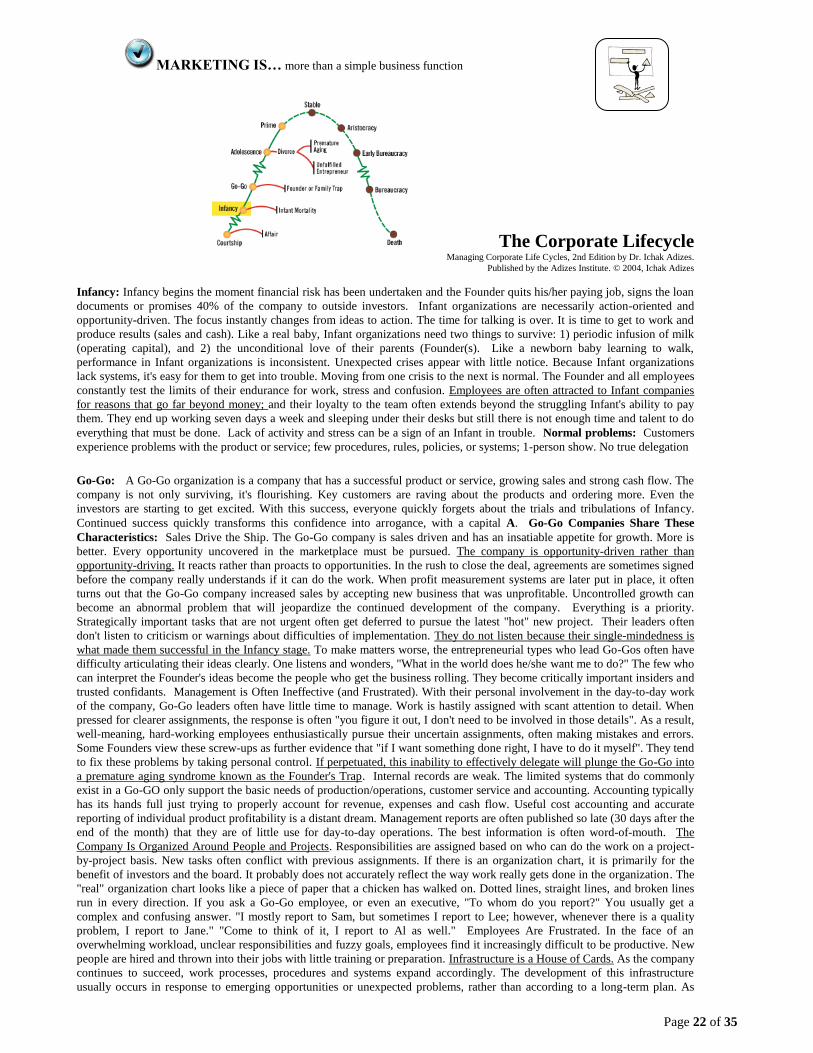
The Corporate Lifecycle Managing Corporate Life Cycles, 2nd Edition by Dr. Ichak Adizes.
Published by the Adizes Institute. © 2004, Ichak Adizes
Infancy: Infancy begins the moment financial risk has been undertaken and the Founder quits his/her paying job, signs the loan
documents or promises 40% of the company to outside investors. Infant organizations are necessarily action-oriented and
opportunity-driven. The focus instantly changes from ideas to action. The time for talking is over. It is time to get to work and
produce results (sales and cash). Like a real baby, Infant organizations need two things to survive: 1) periodic infusion of milk
(operating capital), and 2) the unconditional love of their parents (Founder(s). Like a newborn baby learning to walk,
performance in Infant organizations is inconsistent. Unexpected crises appear with little notice. Because Infant organizations
lack systems, it's easy for them to get into trouble. Moving from one crisis to the next is normal. The Founder and all employees
constantly test the limits of their endurance for work, stress and confusion. Employees are often attracted to Infant companies
for reasons that go far beyond money; and their loyalty to the team often extends beyond the struggling Infant's ability to pay
them. They end up working seven days a week and sleeping under their desks but still there is not enough time and talent to do
everything that must be done. Lack of activity and stress can be a sign of an Infant in trouble. Normal problems: Customers
experience problems with the product or service; few procedures, rules, policies, or systems; 1-person show. No true delegation
Go-Go: A Go-Go organization is a company that has a successful product or service, growing sales and strong cash flow. The
company is not only surviving, it's flourishing. Key customers are raving about the products and ordering more. Even the
investors are starting to get excited. With this success, everyone quickly forgets about the trials and tribulations of Infancy.
Continued success quickly transforms this confidence into arrogance, with a capital A. Go-Go Companies Share These
Characteristics: Sales Drive the Ship. The Go-Go company is sales driven and has an insatiable appetite for growth. More is
better. Every opportunity uncovered in the marketplace must be pursued. The company is opportunity-driven rather than
opportunity-driving. It reacts rather than proacts to opportunities. In the rush to close the deal, agreements are sometimes signed
before the company really understands if it can do the work. When profit measurement systems are later put in place, it often
turns out that the Go-Go company increased sales by accepting new business that was unprofitable. Uncontrolled growth can
become an abnormal problem that will jeopardize the continued development of the company. Everything is a priority.
Strategically important tasks that are not urgent often get deferred to pursue the latest "hot" new project. Their leaders often
don't listen to criticism or warnings about difficulties of implementation. They do not listen because their single-mindedness is
what made them successful in the Infancy stage. To make matters worse, the entrepreneurial types who lead Go-Gos often have
difficulty articulating their ideas clearly. One listens and wonders, "What in the world does he/she want me to do?" The few who
can interpret the Founder's ideas become the people who get the business rolling. They become critically important insiders and
trusted confidants. Management is Often Ineffective (and Frustrated). With their personal involvement in the day-to-day work
of the company, Go-Go leaders often have little time to manage. Work is hastily assigned with scant attention to detail. When
pressed for clearer assignments, the response is often "you figure it out, I don't need to be involved in those details". As a result,
well-meaning, hard-working employees enthusiastically pursue their uncertain assignments, often making mistakes and errors.
Some Founders view these screw-ups as further evidence that "if I want something done right, I have to do it myself". They tend
to fix these problems by taking personal control. If perpetuated, this inability to effectively delegate will plunge the Go-Go into
a premature aging syndrome known as the Founder's Trap. Internal records are weak. The limited systems that do commonly
exist in a Go-GO only support the basic needs of production/operations, customer service and accounting. Accounting typically
has its hands full just trying to properly account for revenue, expenses and cash flow. Useful cost accounting and accurate
reporting of individual product profitability is a distant dream. Management reports are often published so late (30 days after the
end of the month) that they are of little use for day-to-day operations. The best information is often word-of-mouth. The
Company Is Organized Around People and Projects. Responsibilities are assigned based on who can do the work on a project-
by-project basis. New tasks often conflict with previous assignments. If there is an organization chart, it is primarily for the
benefit of investors and the board. It probably does not accurately reflect the way work really gets done in the organization. The
"real" organization chart looks like a piece of paper that a chicken has walked on. Dotted lines, straight lines, and broken lines
run in every direction. If you ask a Go-Go employee, or even an executive, "To whom do you report?" You usually get a
complex and confusing answer. "I mostly report to Sam, but sometimes I report to Lee; however, whenever there is a quality
problem, I report to Jane." "Come to think of it, I report to Al as well." Employees Are Frustrated. In the face of an
overwhelming workload, unclear responsibilities and fuzzy goals, employees find it increasingly difficult to be productive. New
people are hired and thrown into their jobs with little training or preparation. Infrastructure is a House of Cards. As the company
continues to succeed, work processes, procedures and systems expand accordingly. The development of this infrastructure
usually occurs in response to emerging opportunities or unexpected problems, rather than according to a long-term plan. As

Page 23 of 35
things become more complex, it takes longer to fix mistakes and some fixes create new problems because of unexpected side
effects. A Major Crisis Happens. Inevitably disaster strikes the Go-Go. Success finally put enough load on the system that a
fairly catastrophic disaster happens that threatens the loyalty of major clients, or jeopardizes the entire business. When disaster
does strike, no one takes responsibility. With weak control systems, accountability is very unclear. Nobody (except the Founder)
owns the decision that created the disaster. Everyone claims inadequate information, lack of authority, and feels they are the
victims of decisions made by other people. Fingers point in all directions. This frustrates Go-Go leaders. They feel betrayed. No
one warned them of the tricky dangers ahead. Everyone just watched them fail. No one survives unscathed. The Founder's or
Family Trap: The Founder's Trap occurs when a Go-go company is unable to relieve itself from its dependency on the
Founder. The company is trapped by the capabilities and limitations of the bottleneck that is its Founder. This can occur because
the organization is unable to develop the abilities needed to replace the unique skills of the Founder. The slide into the Trap can
also occur because the Founder himself is either unwilling or unable to delegate effectively and decentralize control. Growth
beyond the founder is impossible. If a company is caught in a Founders Trap it means that when the Founder dies, the company
might also die.
Adolescence: During the Adolescent stage of the organizational lifecycle, the company is reborn. This second birth is an
emotional time where the company must find a life apart from that provided by its Founder. This critical transition is much like
the rebirth a teenager goes through to establish independence from their parents. The Adolescent company teeters on the brink
of both success and disaster. So long as the Adolescent company does well, investors and the Board regard the Founder as a
genius with a golden touch. However, when the infrastructure collapses, sales slowdown, costs mushroom or profits decline, the
finger pointing begins in earnest. The Founder, accustomed to the magic of adoration, is instantly transformed into a goat who is
no longer up to the task of leadership. Adolescence is an especially stormy time characterized by internal conflicts and turf
wars. Everyone seems at odds with everything. Sales fall short or exceed production's estimates, quality is not up to customer
expectations, and old timers plot against the new hires, waiting for them to fail (sometimes encouraging it). Emotions are
volatile and organizational morale traces a jagged line: ecstasy in one quarter, depression and dejection in another. Throughout
the organization, people are busy tracking the real and imagined injustices they have suffered, which they nurse with great care.
If these conflicts are not resolved, Adolescent companies can find themselves in Premature Aging that can lead to the early
departure of entrepreneurial leadership, or the professional managers leading to pathologies called Divorce. There are three
principal challenges (1) Effective decentralization of authority with employee empowerment (2) Change in leadership from
entrepreneurship to professional management (3) Goal development with measureable performance metrics & control charts.
Prime: Prime is the optimal position on the lifecycle, where the organization finally achieves a balance between control and
flexibility. Prime is actually not a single point on the lifecycle curve. Instead, it is best represented by a segment of the curve
that includes both growing and aging conditions. This is because flexibility and self-control are incompatible and there is no
stable equilibrium. Sometimes the Prime organization is more flexible than controllable, and sometimes it's not flexible enough.
Problems of Prime: Senior management of companies in Prime engages in a continuous struggle to maintain the delicate
balance between flexibility and control. It takes very little to push a company in either direction. When administrators gain the
upper hand, the company's balance swings in the direction of excessive control, and the company sacrifices flexibility. When
entrepreneurs gain the upper hand, the company grows more flexible but loses control. Prime companies often don't have
enough good people to run all their business units. The other key issue they face is complacency. Once you get there, the
principal leadership challenge is to stay there. " Since everything is fine, why change?" This attitude is the first step into decline.
The greatest problem of Prime is staying in Prime. Characteristics of an organization in Prime (1) The organization is
guided by the vision of its reason for being. There is a clear purpose and people know what they will do, and will not do, "they
walk their talk". (2) The company operates in a focused, energized and predictable manner. (3) Stretch goals are set, aligned and
consistently achieved. (4) There is an enterprise-wide focus on customers and earning their long-term satisfaction. There is a
high degree of customer loyalty. At the same time, the organization knows when and how to say "no" to the market. It is
disciplined enough to protect itself. (5) Priorities are clear. The organization knows what to do, and what not to do. It enjoys a
certain composure and peace of mind when making tough decisions. (6) The entrepreneurial spirit is fully institutionalized.
Evidence of organizational fertility abound. This creativity repeatedly produces controlled, profitable innovation. (7)
Organizational structures work well. Opposing forces are balanced. There is alignment between vision, strategy, structure,
information, resource allocation and rewards. A company in Prime is continuously realigning these subsystems. (8) The
infrastructure provides reliable support. (9) The governance process is institutionalized. People know and understand where and
how decisions are made. (10) Decision-making is done is an environment of healthy, constructive conflict. Points of view are
considered, but there are no hard feelings if one's recommendations are not heeded. Differences of opinion rarely deteriorate
into personality clashes or turf wars. (11) There is intra- and inter-organizational integration and cohesion with clients,
suppliers, investors, and the community. This internal cohesion enables the Prime organization to devote much of its energy
externally. (12) People enjoy working at the company. Few willingly leave and there is a backlog of people applying for
positions at all levels. (13) They embrace change. Prime companies work hard to adapt to changes in markets and technology so
that they can gain share from weaker competitors. (14) They enjoy consistent, above average growth in both sales and profits.
Prescription for Success: The slide into aging is subtle. The emergence of an attitude of complacency is the first step into
decline. Since the company is doing so well, it is easy to slip into a mindset to maintain the status quo. To remain in Prime,
management must be proactively working to refuel momentum by nurturing a portfolio of Infant, Go-Go and Adolescent
business units ensuring that entrepreneurship thrives. When a Prime organization loses its ability to embrace change and nourish
new growth, organizational vitality levels off and aging begins. On the lifecycle curve, Prime is not at the top of the curve. This
is because the curve depicts the vitality of an organization. When a company first starts to age, it is still producing the desired
results as measured by short-term sales and profitability. Aging is having a negative effect on the company, but this effect is not
yet reflected in sales or profitability. Therefore, the lifecycle curve is still rising, however the rate of change is slowing so the
rising curve is starting to level off. If Prime organizations don't refuel their momentum, if they keep harvesting their momentum
rather than nourishing it, the curve will reverse direction and the company moves into aging. After Prime, movement along the

Page 24 of 35
lifecycle is a gradual process of deterioration. Unlike the growing side of the curve, there are no major transitional events in
aging companies. The only differences between the lifecycle positions of Stable, Aristocracy, Early Bureaucracy and
Bureaucracy is a question of the degree to which aging problems pervade the organization.
Dress Code: In an Infant company, if you can do the work, you can wear your clothes inside out. By the time the company is a Go-
Go, people start wearing suits and sport coats with ties, but there is no hard-and-fast dress code. Prime companies require their
people to be professional in the way they look and the way they act. By the time the organization reaches Aristocracy, only the
requirement to look professional remains.
Meeting Rooms: In the boardroom of a typical Aristocracy, you will find a huge, highly polished, dark wood table surrounded by
matching plush chairs. The carpet is thick. Lighting is subdued, and the windows are heavily draped. From the paneled walls, a
larger-than-life portrait of the unsmiling Founder looks down on the room, as if warning everyone to remember his or her place.
When an outsider comes into the room, the dim lights, the uniformly dark suits, the somber portrait of the Founder collectively
scream "Don't make waves!" How can they possibly tell corporate leadership, "Hey, guys, we are losing market share."
How They Address Each Other: People in Infant and Go-Go organizations address one another by first names or nicknames. The
names people use for one another in an Adolescent company are not fit for print. When an organization reaches Prime, both first and
last names are commonly used. By the time the organization has reached Aristocracy, people speak to each other almost exclusively
with last names. It's Mr. Smith and Ms. Jones. They may be Bob and Mary inside their offices, but in meetings, they address each
other formally.
Verbal and Written Communications: In Aristocracy form is more important than content, the medium is the message. People
speak slowly and softly, and overuse visual aids and written handouts. Extensive notes are taken that read like a trial transcript.
During meetings, people hedge, using endless strings of double negatives and qualifiers. "It seems that, under certain circumstances
it may be assumed, however, on the other hand, and not necessarily so, we might conclude that..." One leaves wondering what the
person was really trying to say.
Weak Decision Making: Leaders of Aristocratic organizations, whether in government or business, behave as if they have a great
deal of control over their organizations. In private, they know that they can do very little, but in public they act as if they can do a
lot. The truth is that there are so many committees that need to agree, and so many, many interests that need to be appeased, that it is
almost impossible to implement any significant changes in an Aristocracy. Their leaders are limited to only what politics allow them
to do. As their companies continue to age, this inability to have a real impact gets even worse.
The Silence before the Storm: The product lines of companies in the advanced stages of Aristocracy are out-of-date. The clients
know it, the sales people know it, and even the senior executives know it (privately). Yet the problems of the future are not yet
pressing. The company is still liquid and profitable. Management holds endless meetings discussing the situation but nothing much
happens. Everyone seems to be waiting for someone else to do something. Taking action now means making waves and becoming
embroiled in political fights that may not be necessary. Who knows? Government policies might change, the competition could go
broke, or our customers might change their tastes. Maybe these problems will all go away. It could happen. Desperate over
continually declining market share, revenues, and profits, the Aristocratic organization enters Recrimination. This is not a gradual
transition. It is quick and forceful. The Aristocracy has been covering its problems with price increases and acquisitions for a long
time. The organization has expended all the goodwill it has so painstakingly accumulated from its Infancy. The artificial facelifts
and price increases stop working because they are not a substitute for providing real new value and satisfying new market needs. The
day of reckoning arrives when the financial reports finally reveal the true weakness of the company. The truth spreads rapidly. The
company incurs the scorn of Wall Street. Stock prices drop like a rock, key accounts bolt to the competition and bankers won't return
phone calls. When this happens, the gloves come off. Knives are drawn, and the fight for survival begins.
Early Bureaucracy: When an Aristocracy is unable to reverse its downward spiral and the artificial repairs finally stop
working, management's mutual admiration society abruptly ends. The good-old-buddy days of the Aristocracy are gone, and the
witch-hunts of Recrimination begin. Companies in this stage exhibit the following behaviors: (1) People focus on who caused
the problems, rather than on what to do about the problems. (2) Problems get personalized. Rather than dealing with the
organization's problems, people are involved in interpersonal conflicts, backstabbing, and discrediting each other. (3) Paranoia
freezes the organization. (4) Personal survival and turf wars absorb all available energy leaving precious little to deal with the
needs of customers or the world outside the organization. The Witch Hunt: Everyone is busy trying to find out who caused the
disaster. With blades drawn, it's backstabbing time in the boardroom. Like primitive tribes afflicted by extended drought or
famine, there is a rush to appease the gods. The organization needs a sacrifice. Whom does it sacrifice?
Typically, the management of a company in Recrimination sacrifices its most valuable and scarcest treasure.........the last
vestiges of innovation and creativity. The company fires the EVP of Marketing, explaining, "We're in the wrong market with the
wrong products and our advertising does not work." The heads of Strategic Planning, Business Development and Engineering
are the next to find themselves on the street. "Our strategy does not work. Our acquisitions are not working. Our products and
technology are obsolete." The people who get fired don't feel they are responsible for the company's situation. The Marketing
VP often said that the company ought to change its direction. The strategist has an ulcer worrying about the lack of direction.
Privately, these individuals complained, urged, begged, and threatened, but their efforts were like pushing wet spaghetti up a
hill. Their exodus merely exacerbates the problem because these creative people are the individuals the organization needs most
for survival. In the Aristocratic organization, silence precedes the storm. People smile. They are friendly, handling one another
with kid gloves. In Recrimination, when the bad results are undeniable, managers start fighting each other. The ritual of human
sacrifice is repeated over and over. Someone must take the blame every time there is bad news. Bad news comes every quarter
when they must report results, so every quarter a new scapegoat emerges.
No one is sure who will be the next to get the ax. Paranoia reigns.

Page 25 of 35
INTEGRAGED MARKETING COMMUNICATIONS…going where the are flying from a
media neutral
approach
CHANNEL
SOURCE
ENCODES THE MESSAGE BY TRANSLATING PERCEPTUAL DECODING IN CONTEXT
INTENDED MEANING INTO SYMBOLIC RECEIVER …APPLYING FILTERED MEANING THROUGH FORM (SIGN) = IDENTITY PERCEPTIONS (THOUGHTS) & AFFECTIVE
REACTION (FEELINGS) = IMAGE
20% PRINT ADS ARE MISCOMPREHENDED
33% OF FACE TO FACE CONVERSATION IS MISUNDERSTOOD
We must FRAME our discussion to enhance MOA factors so consumers process the marcom message in a manner that we hope that they do……
M..Motivation: first, involuntary to voluntary attention through …intense/prominent cues and …enhanced relevance/curiosity
O..Opportunity (repetition): “best” time is when the need is experienced with careful selection of both media and message
A..Ability: to access knowledge structures through Framing (verbal, visual, contextual) and Concretizing abstract concepts
FRAMING is used to access existing customer knowledge structures, to reduce processing time, encourage motivation and raise emotional involvement.
When there is imagery, [EXPOSURE to a Perceptually Encoded message in the form of a sign (stimulus that represents an object)] it is involuntarily
perceived by our senses within the context of our perceptual field (culturally constituted world) through SENSORY RECEPTORS (sight, sound, touch, etc)
at which point ATTENTION must be given for it to enter our SENSORY STORE. If attention is not given, it is lost; if attention is given it moves
voluntarily into a SHORT TERM MEMORY with limited information processing capacity. It is quickly comprehended (interpreted first by feature, then
active synthesis in some idiosyncratic manner through a process of contextually dependent decoding) from either a CPM (consumer processing model)
approach that is cognitive, systematic and reasoned or a Hedonic (HEM) approach which is experiential and emotionally driven, depending upon the level of
involvement (engagement) - then rejected or accepted. If accepted, it is moved into LONG TERM MEMORY (virtual storehouse of unlimited information)
where LEARNING (changes in the context within LTM) takes place that either strengthens the linkages of memory concepts or establishes new linkages
within a KNOWLEDGE STRUCTURE and stored for future reference which will be simplified through HEURISTICS
NEILSON STUDY
700 stores – ½ had POP -- % increase in sales due to POP 5% 29% 38% 52% (Guess which one)
MOTION DISPLAY (Place these numbers: 49% - 18% ) Liquor Store Grocery Store
(Olympia beer): Static POP
Motion POP 107% 56%
POPAI BENYLIN STUDY (Place these numbers: 29% - 98% – 139%) Increase -- Feature price on shelf = ___ % -- Feature price on end cap = ___ % -- Feature price in isle display = ___ %
http://www.youtube.com/watch?v=cFdCzN7RYbw ( Science of Persuasion; 12minutes)
Research on purchase decisions…
Super.. Mass M
Specifically Planned 30% 26%
Generally Planned 6% 18%
Substituted 4% 3%
Unplanned 60% 53%
Video screens on grocery carts
Mobile truck in India (25 ft poles)
Live players on an outdoor sign
Huston, TX
…car dealer – Black,
Friday Sale – 200 cars
marked down (3 to $1)
Huge BUZZ mkt
success!
NOISE
Feature – Symbolic – Experiential Value Based Marketing (1) Must be relevant to target market needs
/ demands (2) Value based marketing is progressive in market impact, sustainable competitive advantages
with experiential offering the greatest value. Experiential is more than event marketing.
6 million Benadryl samples given away at 550 “Point of Itch” sites
Experiential is
more than event
marketing
Would an App work to map out your grocery list?
THREE EXPOSURE HYPOTHESIS VS.
SHELF SPACE MODEL APPROACH

Page 26 of 35
INTEGRAGED MARKETING COMMUNICATIONS…going where the are flying from a
media neutral
approach
You have to get noticed before anyone will know you exist.
It is easy if they are looking for you; but if not, then you
need some peripheral cues to draw their attention –
something emotional, humorous, modest fear, noise, etc…
and once you have their attention, you can deliver your
message. However, remember that communication is more
about what they ‘hear’ and not what you ‘say’ ….. Awareness by itself is insufficient / Brand Equity = Awareness + Image
Consumer
Decision Process
NEED RECOGNITION
SEARCH
First Internal then External Inversely related to age & income Related to level of INVOLVEMENT
ALTERNATIVE
EVALUATION
Relative Value Perception
CHOICE
POST-PURCHASE
RESPONSE
Encoded SIGN (Referent in context)
Dual Coding Theory
Media Neutral - 360 degree Brand Equity (awareness & image)
IMAGE… Stored brand association
Engagement… Elaboration… Momentum…
Sensory Store
(Involuntary)
Short Term Memory
Feature Analysis & Active Synthesis
(Attributes & Benefits …Functional, Symbolic
Experiential)
Comprehension
Building of Expectation & Meaning
…Perceptual encoding
Awareness
CPM Cognitive Affective Conative
HEM Affective Cognitive Conative
Long Term Memory
& Learning
(Altered state of Belief & Attitudes)
Observability – Complexity - Compatability
Trial ability
Acceptance
Consideration Set &
Relative Advantage
Advocacy
IDENTITY… Value based defensible differentiation position statement with drawn meaning from the culturally constituted
world (perceptual field of target market)
‘Response Hierarchy’ comparison of
TWO market positions
A B A B A B A B A B A B
REP
EAT
TRIA
L
ACC
EPT
COM
P
AWARETOTAL
Market &
Awareness
Heuristic methods are used to speed up the process of finding a satisfactory
solution via mental shortcuts to ease the cognitive load of making a decision.
Encodes the message by
translating intended meaning
into symbolic form (sign)
Trial
(Recognition / recall) TOM
Heuristic loyalty
The purpose of IMC
is to influence
behavior Advertising (media & vehicle)
Personal Selling
Sales Promotion (Push / Pull)
Social Media
Public Relations
Winner
SUTR
Yes
No
Yes No
Encourage Action?
Do You Have Advantage?
Promote Competition
Ineffective promotion is the
same as no promotion only costs
more
Trial ability is
critical in the process
of changing beliefs /
attitudes toward your
offering

Page 27 of 35
INTEGRAGED MARKETING COMMUNICATIONS…going where the are flying from a
media neutral
approach
Understand the consumer decision process and what you can do to positively influence it
‘Laddering” is a detailed reflection of the behavioral steps and mental processing a consumer goes through when
making the purchase decision for a given product category. Understanding the decision process and the potential
influences is critical to improving the likelihood of a successful exchange.. Your goal is to positively influence the
perception of the Potential Market – those that may have interest to encourage action of the Available Market –
those with interest, income and access and grow the membership of the Penetrated Market, first as a Customer
and ultimately a loyal (Heuristic) Advocate.
Need Recognition: The consumer must recognize there is a need before they will act. Once recognized (problem
comes up, a replacement is necessary, an event occurs, a new situation arises) and if there is a sufficient
consequence, the need becomes a motive, then a want, then a demand… and when accompanied by interest, income
and access, the consumer decision process is initiated.
Sometimes it is necessary to help consumers recognize a need - by creating dramas, new realities,
artificial scarcities, celebrations and the like
An analysis of life stages and segmentation profiles (geo, demo, psycho, behavior) provides significant
insight as to what needs – demands are likely to emerge.
Search: The search process starts internally with a mental review of what the prospect perceives to be
relevant knowledge / ‘truth’ stored in their long term memory. The higher the perceived risk and expected
value gained/lost will directly influence the amount of search effort. If internal memory knowledge sets are
I insufficient, the search process moves to trusted external sources for information and guidance.
A low risk need (social, physical, monetary, effort, psyche, etc) will be filled via a routine consumer
action driven by brand recognition and habitual behaviors – the more frequent the purchase and
lower the price, the more likely it will involve a decision with limited cognitive involvement.
It is possible for a competing product to compare itself to market leaders on important
values/attributes, thereby altering the prospect’s perceived value/risk relationship… however,
AWARENESS, COMPREHENSION and ACCEPTANCE are necessary.
There are significant differences based on product categories (1) As much as 60% of the purchased
staple consumption items (grocery, discount store) are preplanned only by category and not by brand,
(2) There is greater involvement with less frequent, high ticket item purchases with increased joint
decision roles (3) Reduction of the search process is an important goal for marketers!
A measure of the prospect’s perceived Value Triad (quality, service, and price) relative to your
competitor’s offering (strategic group) will determine if you are part of their CONSIDERATION SET.
Alternative Evaluation: You are now part of the review process (consideration set). There is a significant
difference in what it takes to convince your satisfied customer to repurchase vs. convincing a competitor’s satisfied
customer to consider your offering as an acceptable alternative. Your offering / message platform cannot be too
complex, it must be compatible to their current knowledge structure, trial ability (actual, virtual, vicariously) is
critical and it must have a perceived benefit based on the valued EXPECTATION you help create.
AWARENESS is necessary but insufficient; there must be a compelling reason to seriously
consider your offering … perceived value; congruency to existing knowledge sets and
persuasive influence must also be present.
Not all attributes/benefits/advantages are perceived equally across segments, careful analysis
will help you determine if differentiated or undifferentiated approaches are required.
Choice: The decision is made. Often, suspects and prospects will need encouragement with
a premium before they initiate trial of a new/different product.
Tribal opinion leaders and reference groups are important influencers of high involvement decisions
High involvement offerings will lead to counterarguments if the message is not congruent with
existing perceptions and knowledge sets.
TRIAL is necessary for behavior change - trial leads to learning which is then
stored in long term memory for future reference(internal search) … positive or negative
Post Purchase Response: Performance quality reflects a functional product expectation and conformance
quality is relative to the perceived fulfillment of the expectation built by the product offering / message
platform. Both are necessary to achieve relative advantage within the strategic group for the next time a
similar need arises.
When listening to the ‘voice of the customer,’ both performance and conformance quality should be
measured and carefully examined for both importance and satisfaction.
High involvement decisions will result in significant post-purchase cognitive activity to affirm the
wisdom of the choice made – what can you do to remind them of your great product ?
Consumer Decision Process
& Business Response
Hierarchy
NEED
RECOGNITION
Create
Awareness
SEARCH …first Internal then External Selective exposure/ distortion /retention
Comprehension
& Acceptance
ALTERNATIVE
EVALUATION Weighted perceptual value of salient attributes
Build
EXPECTATION
CHOICE
Encourage
TRIAL
POST
PURCHASE
RESPONSE Satisfaction or Cognitive Dissonance Learning (change in thought process)
Reinforce
Attitudes
(Enduring evaluation of behavioral tendencies toward
something
Accomplish
Heuristic
Loyalty
Share of Mind
Awareness Set
Share of Heart
Consideration Set
Share of Market
Choice Set

Page 28 of 35
INTEGRAGED MARKETING COMMUNICATIONS…going where the are flying from a
media neutral
approach
Sample… Heuristic / Promotion Principles
1. Comparative advertisements are of questionable value except when introducing a new product or your market share is small
and you have a distinctive advantage (Points of Difference).
2. Negative ads carry more weight than positive ads - Fear appeal is best with non users when you do not want them to start.
3. First and last points in a message are remembered better (first has primary effect and last has recency)
4. Conclusion drawing in the message makes the message easier to understand and is more likely to result in immediate
action. - The more informed and higher involved the target market, the more likely they will want to draw their own
conclusions from the message.
5. One sided message is better when positive attributes already exist and the audience is less educated - 2-sided arguments in
the message works best if the audience has a negative opinion or is more informed
6. The endorsing celebrity ‘source’ has stopping power (can gain attention) in a cluttered environment and when involvement
is low; it reduces counter-arguing, especially if there are negative opinions toward your offering. “Association” is a critical
celebrity quality when customers have low involvement and ‘Credibility” is more important when the customer is highly
involved/engaged.
7. Markets of low involvement products often rely on creative tactics that emphasize peripheral cues and use high frequency
repetitive advertising to create and maintain attitudes.
8. People who enjoy a commercial are twice as likely to be convinced the brand is best.
9. The less loyalty, the more the promotion should be directed at motivations.
10. Post purchase dissonance is more likely to occur with important decisions that have close alternatives/ substitutes
11. Exposure does not mean attention and comprehension … greater understanding does not equate to acceptance.
12. Non durable staple items are influenced by point of purchase materials & packaging
13. Sales Promotions (coupons) decisively create selective demand when loyalty is minimal
14. The farther away the product is from a necessity, the more likely it is that primary demand must be created
15. If you want to make inroads into competitors markets, the best strategy is to appeal to the wavier & deal prone switchers
16. Much competitive noise requires more exposure
17. Consumers avoid contradictory exposure (selective exposure, selective distortion, selective retention)
18. Deeper and more elaborate information processing is likely when an important need is activated by emotional and complex
message symbolism…. Focus on values.
19. Decisions tend to be automatic when time pressures exist
20. People will believe a statement if they hear it enough and if they have no intrinsic interest in the product message.
21. Personal social pressures and positive reactions of satisfied customers tend to stimulate interest of others
22. When advertising is proportional to market share, successful competitive warfare is less probable
23. Word of mouth is very important when it is difficult to evaluate a product
24. Humor is more commonly used and is typically more effective with low-involvement products.
25. Patterns of “conscious parallelism” are common in capital-intensive, homogeneous-product industries.

Page 29 of 35
CUSTOMERS HAVE THE FINAL SAY GROWTH REQUIRES
CUSTOMER-ORIENTED THINKING …
Defining customer needs from the customer point of view must be done…. When customers ‘fire a
business’ and leave, 15% of the time it is because of inferior products; 15% of the time it is
because the cost is too high for the value received; 20% of the customers leave because of a lack of
personal interaction and 50% leave because they believe their received poor service…
Research tells us… that 96% of customers that are not happy will not tell
you; most will simply stop buying and of those that do complain, 54 - 70%
will buy again if the complaint is resolved, 97% if it is resolved quickly.
Customer defection can be reduced by raising switching barriers and/or delivering greater satisfaction
An average of 10% of your customers will ‘naturally’ defect…..what is your customer churn rate?
Not all customers are worth keeping….80-20-30 principle
Your holistic marketing effort will reflect Lifetime Value of your customer base…. Basic Marketing = to sell the product
Reactive Marketing = to sell the product and encourage the customer to let you know if they have issues
Accountable Marketing = to sell the product and follow-up once with the customer after the sale
Proactive Marketing = to sell the product and follow-up on a regular basis after the sale
Partnership Marketing = continuous interaction with the customer
How did it make you feel when…
1. An employee says ‘hi’ when you walk in but no one is making eye contact and you have no
idea who said it …sometimes, you actually answer only to find out no one is
listening….foolish huh!
2. An employee asks how everything was when you leave a restaurant… your measured
response is, ‘not that good,” and they smile as they ring up your bill with no further
comment.
3. You get to the store 3 minutes before they open – you look inside the glass door, an
employee is right on the other side, makes eye contact, but totally ignores you.
4. You approach the checkout and have to wait for the employee to finish a private
conversation with another person … or your items are run up with no acknowledgement
from the cashier until the bill is due
5. Others….
Customer Equity = [value equity + brand equity + relationship equity]
3M has said that ¾ of all product
improvements have
come from complaints
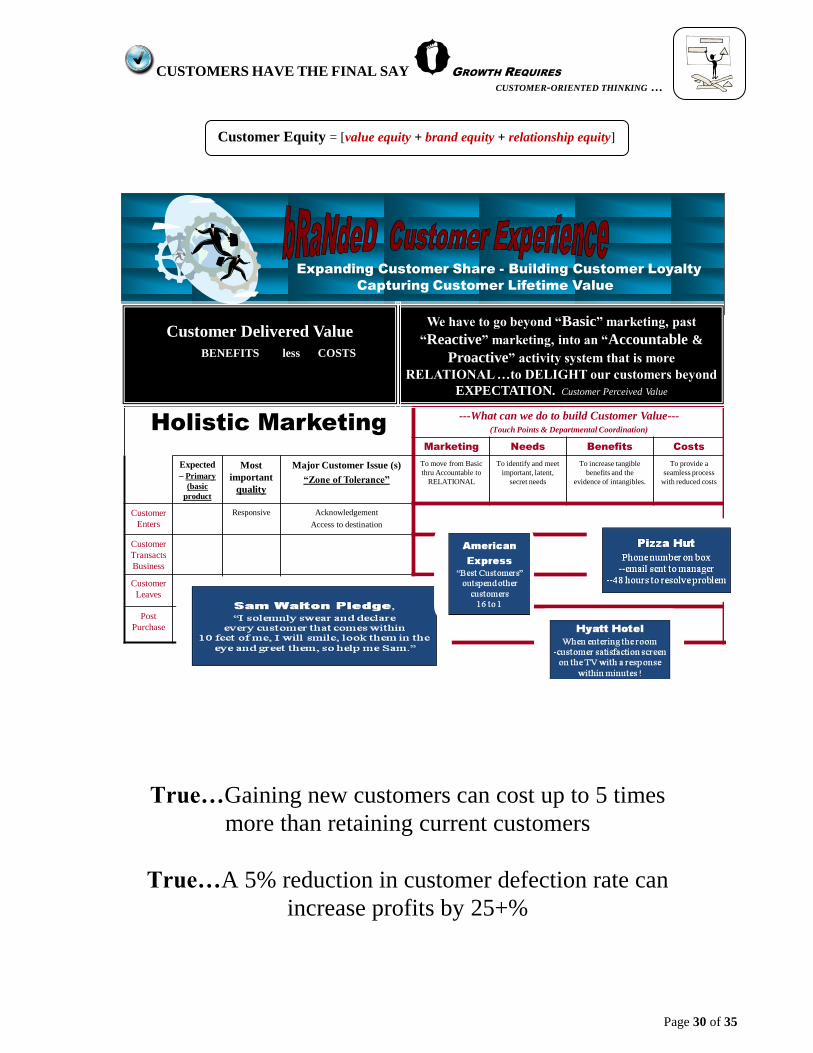
Page 30 of 35
CUSTOMERS HAVE THE FINAL SAY GROWTH REQUIRES
CUSTOMER-ORIENTED THINKING …
Holistic Marketing---What can we do to build Customer Value---
(Touch Points & Departmental Coordination)
Marketing Needs Benefits Costs
Expected
– Primary
(basic
product
Most
important
quality
Major Customer Issue (s)
“Zone of Tolerance”
To move from Basic
thru Accountable to
RELATIONAL
To identify and meet
important, latent,
secret needs
To increase tangible
benefits and the
evidence of intangibles.
To provide a
seamless process
with reduced costs
Customer
Enters
Responsive Acknowledgement
Access to destination
Customer
Transacts
Business
Customer
Leaves
Post
Purchase
Expanding Customer Share - Building Customer Loyalty
Capturing Customer Lifetime Value
-Money
-Time
-Effort
-Opportunity
-Psyche
We have to go beyond “Basic” marketing, past
“Reactive” marketing, into an “Accountable &
Proactive” activity system that is more
RELATIONAL …to DELIGHT our customers beyond
EXPECTATION. Customer Perceived Value
Customer Delivered Value
BENEFITS less COSTS
True…Gaining new customers can cost up to 5 times
more than retaining current customers
True…A 5% reduction in customer defection rate can
increase profits by 25+%
Customer Equity = [value equity + brand equity + relationship equity]
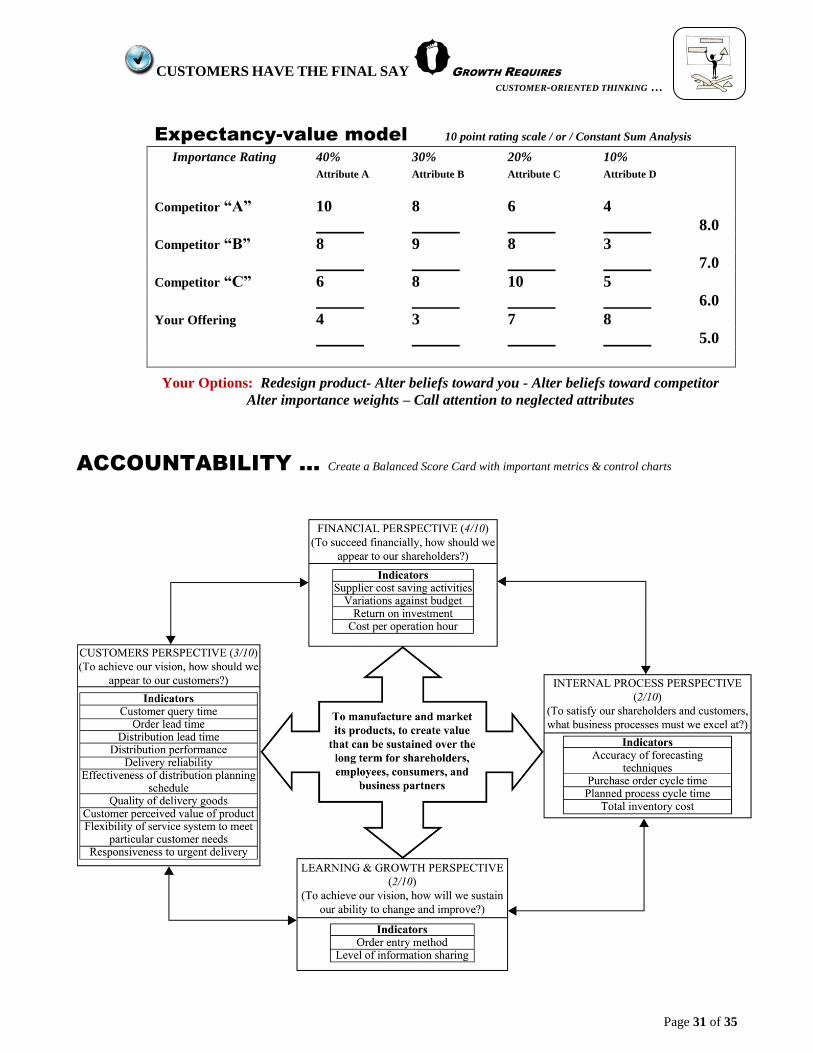
Page 31 of 35
CUSTOMERS HAVE THE FINAL SAY GROWTH REQUIRES
CUSTOMER-ORIENTED THINKING …
Expectancy-value model 10 point rating scale / or / Constant Sum Analysis
Importance Rating 40% 30% 20% 10%
Attribute A Attribute B Attribute C Attribute D
Competitor “A” 10 8 6 4
8.0
Competitor “B” 8 9 8 3
7.0
Competitor “C” 6 8 10 5
6.0
Your Offering 4 3 7 8
5.0
Your Options: Redesign product- Alter beliefs toward you - Alter beliefs toward competitor
Alter importance weights – Call attention to neglected attributes
ACCOUNTABILITY … Create a Balanced Score Card with important metrics & control charts

Page 32 of 35
CUSTOMERS HAVE THE FINAL SAY GROWTH REQUIRES
CUSTOMER-ORIENTED THINKING …
Control Chart
Average
Ask your customer…
What made your ‘worst experience’ bad….
What made your ‘best experience’ good…
Value Based Marketing (1) Must be relevant to
target market needs / demands (2) Is progressive in
market impact, sustainable competitive advantages
with experiential offering the greatest value
Feature – Symbolic –
Experiential Value Based
Marketing … interpreted first
by functional feature, then
active synthesis in some
idiosyncratic manner through a
process of contextually
dependent decoding ….. who
they are, how they think, how
they feel will impact their
response
Page 33 of 35
The Marketing Audit Comes Of Age Philip Kotler, William Gregor and William Rogers
COMPONENTS OF A MARKETING AUDIT
I. Micro-Environment
Economic-Demographic 1. What does the company expect in the way of inflation, material shortages, unemployment, and credit availability in the short
run, intermediate run, and long run?
2. What effect will forecasted trends in the size, age distribution, and regional distribution of population have on the business?
Technology 1. What major changes are occurring in product technology? In process technology?
2. What are the major generic substitutes that might replace this product?
Political-Legal 1. What laws are being proposed that may affect marketing strategy and tactics?
2. What federal, state, and local agency actions should be watched? What is happening in the areas of pollution control, equal
employment opportunity, product safety, advertising, price control etc., that is relevant to marketing planning?
Socio-Cultural 1. What attitudes is the public taking toward business and toward products such as those produced by the company?
2. What changes are occurring in consumer life-styles and values that have a bearing on the company’s target markets and
marketing methods?
II. Task Environment
Markets 1. What is happening to market size, growth, geographical distribution, and profits?
2. What are the market segments? What are their expected rates of growth? Which are high opportunity and low opportunity
segments?
Customers 1. How do current customers and prospects rate the company and its competitors, particularly with respect to reputation,
product quality, service, sales force, and price?
2. How do different classes of customers make their buying decisions?
3. What are the evolving needs and satisfactions being sought by the buyers in this market?
Competitors 1. Who are the major competitors? What are the objectives and strategies of each major competitor? What are their
strengths and weaknesses? What are the sizes and trends in market shares?
2. What trends can be foreseen in future competition and substitutes for this product?
Distributions and Dealers 1. What are the main trade channels bringing products to customers?
2. What are the efficiency levels and growth potentials of the different trade channels?
Suppliers 1. What is the outlook for the availability of different key resources used in production?
2. What trends are occurring among suppliers in their pattern of selling?
Facilitators 1. What is the outlook for the cost and availability of transportation services?
2. What is the outlook for the cost and availability of warehousing facilities?
3. What is the outlook for the cost and availability of financial resources?
4. How effectively is the advertising agency performing? What trends are occurring in advertising agency services?
III. Marketing Strategy Audit
Marketing Objectives 1. Are the corporate objectives clearly stated and do they lead logically to the marketing objectives?
2. Are the marketing objectives stated in clear form to guide marketing planning and subsequent performance measurement?
3. Are the marketing objectives appropriate, given the company’s competitive position, resources, and opportunities? Is the
appropriate strategic objective to build, hold, harvest, or terminate this business?
Strategy 1. What is the core marketing strategy for achieving the objectives? Is it a sound marketing strategy?
2. Are enough resources (or too much resources) budgeted to accomplish the marketing objectives?
3. Are the marketing resources allocated optimally to prime market segments, territories, and products of the organization?
4. Are the marketing resources allocated optimally to the major elements of the marketing mix, i.e. product quality,
service, sales force, advertising, promotion, and distribution?

Page 34 of 35
IV. Marketing Organization Audit
Formal Structure 1. Is there a high-level marketing officer with adequate authority and responsibility over those company activities that
affect the customer’s satisfaction?
2. Are the marketing responsibilities optimally structured along functional product, end user, and territorial lines?
Functional Efficiency 1. Are there good communication and working relations between marketing and sales?
2. Is the product management system working effectively? Are the product managers able to plan profits or only sales volume?
3. Are there any groups in marketing that need more training, motivation, supervision, or evaluation?
Interface Efficiency 1. Are there any problems between marketing and manufacturing that need attention?
2. What about marketing and R & D?
3. What about marketing and financial management?
4. What about marketing and purchasing?
V. Marketing System Audit
Marketing Information System 1. Is the marketing intelligence system producing accurate, sufficient, and timely information about developments in the
marketplace?
2. Is marketing research being adequately used by company decision makers?
Marketing Planning System 1. Is the marketing planning system well conceived and effective?
2. Is sales forecasting and market potential measurement soundly carried out?
3. Are sales quotas set on a proper basis?
Marketing Control System 1. Are the control procedures (monthly, quarterly, etc.) adequate to insure that the annual plan objectives are being achieved?
2. Is provision made to analyze periodically the profitability of different products, markets, territories, and channels of
distribution?
3. Is provision made to examine and validate periodically various marketing costs?
New Product Development System 1. Is the company well-organized to gather, generate, and screen new product ideas?
2. Does the company do adequate concept research and business analysis before investing heavily in a new idea?
3. Does the company carry out adequate product and market testing before launching a new product?
VI. Marketing Productivity Analysis
Profitability Analysis 1. What is the profitability of the company’s different products, served markets, territories, and channels of distribution?
2. Should the company enter, expand, contract, or withdraw from any business segments and what would be the short
and long-run profit consequences?
Cost-Effective Analysis 1. Do any marketing activities seem to have excessive cost? Are these costs valid? Can cost-reducing steps be taken?
VII. Marketing Function Audit
Products 1. What are the product line objectives? Are these objectives sound? Is the current product line meeting these objectives?
2. Are there particular products that should be phased out?
3. Are there new products that are worth adding?
4. Are any products able to benefit from quality, feature, or style improvements?
Price 1. What are the pricing objectives, policies, strategies, and procedures? To what extent are prices set on sound cost,
demand, and competitive criteria?
2. Do the customers see the company’s price as being in line or out of line with the perceived value of its offer?
3. Does the company use price promotions effectively?
Distribution
1. What are the distribution objectives and strategies?
2. Is there adequate market coverage and services?
3. Should the company consider changing its degree of reliance on distributors, sales, reps, and direct selling?

Page 35 of 35
Sales Force 1. What are the organization’s sales force objectives?
2. Is the sales force large enough to accomplish the company’s objectives?
3. Is the sales force organized along the proper principle(s) if specialization (territory, market, product)?
4. Does the sales force show high morale, ability, and effort? Are they sufficiently trained and incentivized?
5. Are the procedures adequate for setting quotas and evaluating performances?
6. How is the company’s sales force perceived in relation to competitors sales forces?
Advertising, Promotion, and Publicity 1. What are the organization’s advertising objectives? Are they sound?
2. Is the right amount being spent in advertising? How is the budget determined?
3. Are the ad theme and copy effective? What do customers and the public thinks about the advertising?
4. Are the advertising media well chosen?
5. Is the sales promotion used effectively?
6. Is there a well-conceived publicity program?