Comprehensive data-driven analysis of the impact of
15
Comprehensive data-driven analysis of the impact of chemoinformatic structure on the genome-wide biological response profiles of cancer cells to 1159 drugs Khan et al. Khan et al. BMC Bioinformatics 2012, 13:112 http://www.biomedcentral.com/1471-2105/13/112
Transcript of Comprehensive data-driven analysis of the impact of

Comprehensive data-driven analysis of theimpact of chemoinformatic structure on thegenome-wide biological response profiles ofcancer cells to 1159 drugsKhan et al.
Khan et al. BMC Bioinformatics 2012, 13:112http://www.biomedcentral.com/1471-2105/13/112

Khan et al. BMC Bioinformatics 2012, 13:112http://www.biomedcentral.com/1471-2105/13/112
RESEARCH ARTICLE Open Access
Comprehensive data-driven analysis of theimpact of chemoinformatic structure on thegenome-wide biological response profiles ofcancer cells to 1159 drugsSuleiman A Khan1*, Ali Faisal1, John Patrick Mpindi2, Juuso A Parkkinen1, Tuomo Kalliokoski3, Antti Poso4,Olli P Kallioniemi2, Krister Wennerberg2 and Samuel Kaski1,5*
Abstract
Background: Detailed and systematic understanding of the biological effects of millions of available compoundson living cells is a significant challenge. As most compounds impact multiple targets and pathways, traditionalmethods for analyzing structure-function relationships are not comprehensive enough. Therefore more advancedintegrative models are needed for predicting biological effects elicited by specific chemical features. As a steptowards creating such computational links we developed a data-driven chemical systems biology approach tocomprehensively study the relationship of 76 structural 3D-descriptors (VolSurf, chemical space) of 1159 drugs withthe microarray gene expression responses (biological space) they elicited in three cancer cell lines. The analysiscovering 11350 genes was based on data from the Connectivity Map. We decomposed the biological responseprofiles into components, each linked to a characteristic chemical descriptor profile.
Results: Integrated analysis of both the chemical and biological space was more informative than either datasetalone in predicting drug similarity as measured by shared protein targets. We identified ten major components thatlink distinct VolSurf chemical features across multiple compounds to specific cellular responses. For example,component 2 (hydrophobic properties) strongly linked to DNA damage response, while component 3 (hydrogenbonding) was associated with metabolic stress. Individual structural and biological features were often linked to onecell line only, such as leukemia cells (HL-60) specifically responding to cardiac glycosides.
Conclusions: In summary, our approach identified several novel links between specific chemical structureproperties and distinct biological responses in cells incubated with these drugs. Importantly, the analysis focusedon chemical-biological properties that emerge across multiple drugs. The decoding of such systematic relationshipsis necessary to build better models of drug effects, including unanticipated types of molecular properties havingstrong biological effects.
* Correspondence: [email protected]; [email protected] Institute for Information Technology HIIT, Department ofInformation and Computer Science, Aalto University, PO Box 15400, Espoo00076, Finland5Helsinki Institute for Information Technology HIIT, Department of ComputerScience, University of Helsinki, PO Box 68, Helsinki 00014, FinlandFull list of author information is available at the end of the article
© 2012 Khan et al.; licensee BioMed Central LtCommons Attribution License (http://creativecreproduction in any medium, provided the or
d. This is an Open Access article distributed under the terms of the Creativeommons.org/licenses/by/2.0), which permits unrestricted use, distribution, andiginal work is properly cited.

Khan et al. BMC Bioinformatics 2012, 13:112 Page 3 of 15http://www.biomedcentral.com/1471-2105/13/112
BackgroundThe mechanism of action of drugs at the biochemicallevel has typically been studied by investigating specificchemical properties of the drug and the biological prop-erties of its specific target [1,2]. This is the standardparadigm in Quantitative Structure Activity Relationship(QSAR) studies, where multivariate mathematical mod-els are used for modeling the relationships between a setof physiochemical or structural properties and biologicalactivity. In previous QSAR studies, such as in the clas-sical 3D-QSAR work by Cramer et al. [3], values of asingle biological activity measure are predicted.However, biological responses at the cellular level are
diverse and each drug typically binds to a multitude oftargets in the cells and elicits a number of other off-target effects. Systems-level approaches are thus neededto get a more comprehensive view of drug effects in liv-ing cells. Genome-wide massively multivariate descrip-tion of the cellular responses caused by the drugs, suchas in the Connectivity Map program (CMap; Lambet al., [4]), requires new kinds of tools for analysis andinterpretation.Chemical systems biology has emerged at the interface
of systems biology and chemical biology with the goal of
Figure 1 Data-driven search for statistical relationships between Chem(gene expression).
constructing a systems-level understanding of drugactions. Systematic analysis of a network of drug effects,i.e. network pharmacology, offers great opportunities fordrug design in the future [5]. Chemical systems biologyhas also been used to predict drug side effects [6] as wellas in other types of toxicological analysis [7].Here, we undertook a complementary approach, by
studying the impact of a host of chemical descriptorsacross a large panel of drugs on the biological responseprofiles measured at a genome-wide scale. We linkedkey structural components of the drug molecules, asdefined by 3D VolSurf descriptors, with the consistentbiological properties, as measured by microarray geneexpression profiles. We developed a data-driven ap-proach to analyze relationships between patterns ofchemical descriptors of the drugs on one hand, andmatching patterns in the cellular responses measured bygenome-wide expression profiles, as shown in Figure 1.As biological response data we used the Connectivity
Map (CMap, [4,8]), which consists of gene expressionmeasurements from three cancer cell lines (MCF7-breast, PC3-prostate and HL60-blood) treated with overa thousand different drug molecules (Figure 1C). Thesedata offer a unique view to the genome-wide responses
ical space (formed of VolSurf features) and Drug response space

Khan et al. BMC Bioinformatics 2012, 13:112 Page 4 of 15http://www.biomedcentral.com/1471-2105/13/112
of the cells to drug treatments and has been used to findnew biological links e.g. between heat shock proteininhibitors, proteasome inhibitors, and topoisomeraseinhibitors [8].Our key assumption is that the chemical structure as
encoded in the 3D descriptors of drugs impacts on thedrug response resulting in specific patterns of gene ex-pression. Furthermore, if there is any statistical relation-ship between the occurrence of patterns in the chemicalspace and the patterns in biological response space,those patterns are informative in forming hypotheses onthe mechanisms of drug action. Given proper controls,the statistical responses can be attributed to the specificfeatures of the chemicals tested out of a diverse drug li-brary. In this paper we used comprehensive but readilyinterpretable models for finding the statistical dependen-cies. We searched for distinct components that correlatethe patterns in the chemical space with the biological re-sponse space. Assuming linear relationships, the taskreduces to Canonical Correlation Analysis (CCA [9]) forsearching for correlated components from the two dataspaces (Figure 1D). We visualized the components in acomprehensive way to facilitate interpretation (Figure 1Eand 1F) and validate them both qualitatively andquantitatively.Canonical Correlation Analysis was recently used for
drug side effect prediction and drug discovery by Atiasand Sharan [10]. They applied CCA to combine knownside effect associations of drugs with (i) 2D structure fin-gerprints and (ii) bioactivity profiles of the chemicals.The CCA results from both combinations were thensuccessfully used to predict side effects for the drugs,suggesting that CCA is effective in finding relevant com-ponents from heterogeneous data sources.Drugs generally act on a multitude of direct and
intended targets as well as on a number of non-specificoff-targets. All these targets and effects together connectto a phenotypic response. As most of these effects arestill poorly understood, modelling of the structure-target-response profiles across a large drug library is animportant, but challenging goal. In this study we mod-elled the structure-response relationships of 1159 drugmolecules directly, with CCA components playing therole of unknown mechanistic processes.The lack of information on all of the possible targets
prompted us to select a particular set of chemicaldescriptors that allows capturing of generic responsepatterns. Many kinds of chemical descriptors are avail-able for characterizing chemical structures in a quantita-tive way. Simple classical 2D fingerprints can be used todetect close analogs, but they would miss most if not allscaffold-hopping situations, where the different chemicalentities give rise to similar pharmacophoric properties.Fingerprints and pure pharmacophoric descriptors require
clearly defined individual targets, which are not known inmany cases. In the present study, we aimed to bridge thechemical and biological space by using a set of VolSurfdescriptors of the drugs ([11]; Figure 1A) that are ideal forcapturing both structural similarities and general chemicalfeatures, such as solubility and permeation properties(ADMET: Absorption, Distribution, Metabolism, Excre-tion and Toxicology properties). Although VolSurfdescriptors are not thought to explain detailed structure-activity relationships, such as the binding to a single tar-get, they offer a good overall interpretation of the molecu-lar shape, hydrogen bonding, lipophilicity, and relatedproperties, which are more conservative than individualbinding cavities. It has also been shown that shape is amajor factor when trying to find compounds with similarbiological activity but dissimilar 2D structures [12].The idea of correlating chemical structures with bio-
logical expression was introduced by Blower et al. in [13].By combining 2D fingerprint data with biological activityprofiles for the chemicals over 60 cancer cell lines (NCI60),and with steady-state gene expression measurements fromthose cell lines before drug treatments, they obtained indir-ect relationships between chemical substructures and thegene targets. In a more recent work, Cheng et al., [14]investigated correlations between the chemical structures,bioactivity profiles, and molecular targets for a set of 37chemicals. This small-scale study demonstrated that combi-nations of biological activity and chemical structure infor-mation can provide insights into drug action mechanismson a molecular level.By using the direct gene expression responses to a
large set of drug treatments from the Connectivity Map,along with comprehensive component-level decompos-ition of response profiles, we are able to make more dir-ect observations on how compounds impact on cells andwhich features of the chemical molecules and the bio-logical responses are correlated.
Results and discussionWe analysed the 1159 drug treatment gene expressionresponses of three cancer cell lines of the ConnectivityMap, with the methods summarized in Figure 1 anddetailed in Methods. The analysis decomposed the rela-tionship between the “chemical space” and the “bio-logical space” into components. The chemical spaceconsists of the selected 76 chemical descriptors of eachdrug and the biological space contains gene expressionresponses of corresponding drugs. Each component relatesa characteristic statistical gene expression pattern with apattern of the drug properties. We will call the components“CCA components” as the core method is Canonical Cor-relation Analysis (CCA). In this section we analyse furtherthe identified components and the statistical relationshipsthey discovered.

Khan et al. BMC Bioinformatics 2012, 13:112 Page 5 of 15http://www.biomedcentral.com/1471-2105/13/112
Quantitative validation of functional similarity of drugcomponentsWe evaluate the biological relevance of the extractedCCA components by studying the functional similarityof drugs associated with each component. In particularwe measure the performance of the component modelin retrieving similar drugs, as indicated by external dataabout their function, and compare it to retrieval basedon either the biological or chemical data separately.Details of the validation procedure are described inMethods. The mean average precision obtained for theretrieval task on the four data sets (CCA components,chemical space, biological space as represented by GSEAand Gene expression) are plotted in Figure 2.The results show that retrieval based on the chemical
space, i.e. VolSurf descriptors, performs clearly betterthan retrieval based on the biological space (activities ofgene sets and genes), indicating that the chemical infor-mation is more relevant for evaluating the functionalsimilarity of the chemicals. The biological space encodedby gene sets performs similarly to the original gene ex-pression, indicating that the gene sets are a sensible en-coding of the biological space; information lost due todimensionality reduction is balanced by introduction ofprior biological knowledge in the form of the sets. Fi-nally, the combined space formed by the CCA compo-nents shows significantly better retrieval performancethan either of the data spaces separately. The results areconsistent over the range of drugs considered in the
Figure 2 Quantitative validation of functional similarity of drugcomponents. The figure shows the mean average precision forretrieving functionally similar chemicals as a function of the numberof top chemicals considered. Results are shown for threerepresentations: CCA (red), Chemical space (green), and Biologicalspace (GSEA: blue, Gene expression: grey). Error bars show onestandard error of the mean precision.
retrieval task. These results show that CCA is able to ex-tract and combine relevant information about the chem-ical structure and biological responses of the drugs,while filtering out biologically irrelevant structural infor-mation and also biological responses unrelated to thechemical characteristics.
Response components and their interpretationsWe next analyze the top ten CCA components havingthe highest significant correlations between the spaces.Figure 3 summarizes the relationships between the Vol-Surf descriptors and the gene sets as captured by thecomponents. Each component is divided into two sub-components ‘A’ and ‘B’, where in the first, the compoundshave positive canonical score and in the second negative(the characteristic response patterns are otherwise thesame, details in Methods). For each CCA-subcomponentthe 20 highest-scoring compounds are listed in the Add-itional file 1: Top_Compounds.xls.VolSurf descriptors, unlike more typically used 2D or
3D fingerprints and pharmacophores, do not have clearstructural counterparts such as fragments or functionalgroups. Therefore, these descriptors are able to grouptogether compounds with very dissimilar chemical struc-tures and yet having the same type of chemical proper-ties. This is especially important in our study since thesame biological activity may not have been created be-cause of the same biological target protein but becauseof another target protein in the same pathway. Within apathway, binding cavity properties may change, but gen-eral descriptors describing the size, lipophilicity, andshape are more conservative. Therefore VolSurf descrip-tors are better suited for classifying these aspects of thecompounds.In the case of the 1st and 2nd components, the selected
VolSurf descriptors are dominated by hydrophobicityrelated descriptors. The 3rd component is connected tohydrogen bonding, polar interactions, and dispersion-related descriptors. Component 4 is also strongly con-nected with hydrophobicity related descriptors, besidesthe component is influenced by the molecular volumeand surface area. Components 5–7 are mainly connectedto “pharmacophoric” descriptors that are describing dis-tribution of strong interaction points over the molecularspace. Components 8 and 9 are both strongly influencedby integy-moments, describing imbalance of eitherhydrophobic or hydrophilic areas over the whole mo-lecular volume. Component 10 is mainly affected byshape and size-related parameters, and also lipophilicintegy moments.On the biological space we observe that the enriched
gene sets in component 1 indicate a mitogenic signalingresponse. Component 8 appears similar but has an add-itional link to cell adhesion signaling. Component 4 in

Figure 3 Relationships decomposed into components. “Eye diagram” showing the top 10 significant CCA components ordered by correlationfrom top to bottom (middle), VolSurf descriptors (left), and top gene sets (right). The CCA components are shown as circles, with numbersindicating the decreasing order of canonical correlation and letters A and B indicating subcomponents (A: positive canonical score, B: negativecanonical score). The widths of the curves from the components to VolSurf descriptors and gene sets indicate the strength of the correspondingassociations. For VolSurf descriptors the subcomponent-specific activity is shown, whereas for the gene sets we show the overall activity in thecomponent. For an example compound, VolSurf fields are illustrated in the top-left corner while three gene sets are listed along with their fivemost significant genes in the top right corner.
Khan et al. BMC Bioinformatics 2012, 13:112 Page 6 of 15http://www.biomedcentral.com/1471-2105/13/112

Khan et al. BMC Bioinformatics 2012, 13:112 Page 7 of 15http://www.biomedcentral.com/1471-2105/13/112
turn very directly connects to cytoskeletal regulation andcell adhesion. While there appears to be a considerableoverlap between compounds in components 2, 3 and 10,the enriched gene sets in component 2 show a stronglink to DNA damage response, 10 is associated withcommon cancer signals, and component 3 is associatedwith an anabolic response. Components 5 and 6 areconnected to different differentiation events. Compo-nent 7 links to gene expression changes seen in GPCRsignaling. Component 9 links to amino acid and nitro-gen metabolism.We further extracted the significant genes in each
component and performed GO enrichment analysis onthem. Additional file 2: Top_GOTerms.xls shows thetop 10 significant GO terms for each component whileAdditional file 3: Top_Genes.xls shows the top 30 sig-nificantly differentially expressed genes for each.Based on the Eye diagram (Figure 3) and lists of sig-
nificant genes, gene sets, GO terms, and the top 20 com-pounds, we summarize the biological and chemicalpatterns in Table 1.
Enrichment of known targetsExisting drug response research relies heavily on targetand pathway-based analysis. Our novel approach attemptsto go beyond known targets and pathways to find drugresponse groups in an entirely data driven way linking
Table 1 Summarized interpretation of top 10 components. Gr
Comp. Biological Interpretation Compounds in Group A Co
1 Classic growth factorsignaling: (MAP andprotein kinasesignaling)
Sulfonamides, antibiotics,carbonic anhydraseinhibitors
Anant
2 DNA damage Contrast agents, antibiotics, DNant
3 Stress response,mitochondrial andanabolic metabolism
DNA damaging agents GPion
4 Cytoskeleton, celladhesion andmigration
GPCR liganda, macrocycliccmpds and contrast agents
Betoth
5 Differentiation, EMT,stemness
NSAIDS, cAMP signalingpromoting compounds
HD
6 Inflammatory anddifferentiation signaling
N/A Proant
7 GPCR andcytokine signaling
N/A Car
8 Growth factor and celladhesion signaling
Cardiac glycosides β-aCa2
9 Amino acid andnitrogen metabolism
Protein synthesis inhibitors An
10 Cancer signaling DNA damaging agents Co
The pharmacophoric enrichment analysis (marked with “*”) was carried out over Vostandard, and measuring enrichment of the list in a component by a hypergeometr
pharmacophoric descriptors to specific gene expressionresponse patterns. Some of the found patterns may ra-tionally be explainable by known targets and next weanalyze the discovered biological process classes (com-ponents), for enriched protein targets.We collected a set of drug-protein target pairs from sev-
eral drug databases (see Methods for details); that containsprotein targets for almost half of the CMap drugs. We thendid enrichment analysis of the compounds sharing com-mon targets in each component (see Methods for details).The common protein targets and component p-values arelisted in Additional file 6: Target_Breakdown.xls.As expected, the analysis shows that only few subcom-
ponents have compounds that significantly share proteintargets (p< 0.05). These are 1B, 2B, 10A and 10B. Sub-component 1B appears to be strongly driven by en-dogenous amine GPCR interactions. Subcomponent 2Band 10A, like 3A, are driven by compounds inducingDNA damage and are discussed below in more detail.Subcomponent 10B is strongly influenced by glucocorti-coids primarily targeting the glucocorticoid receptor, butthe fact that several other ion flux modulating com-pounds (erastin, clofilium tosylate, colforsin, monensinand lasalocid) also link to this subcomponent argues thatthe corticosteroid effects are through the mineralocortic-oid receptor and that the subcomponent response isdriven by a selected ion flux.
oup A and B are the subcomponents of Figure 3
mpounds in Group B VolSurf Interpretation
tipsychotic andihistaminic compounds
High lipophilicity
A damaging agents,imetabolites
Strong lipophilic areas emphasized
CR antagonists,channel blockers
Polar interactions enriched
a adrenergic agonists,er GPCR ligands
N/A
AC Inhibitors, HDAC-like Significantly enriched withpharmacophoric features*
tein synthesis inhibitors,i-diabetics, cardiac glycosides
Pharmacophoric features*
diac glycosides, cephalosporins Pharmacophoric features*
drenergic agonists,+ channel blockers
Integy-moment andsignificant pharmacophoric enriched*
ti-diabetics Integy-moment and significantpharmacophoric enriched*
rticosteroids, ionophores Size shape type descriptors
lSurf features (Additional file 5: VolSurf_Classification.xls) considered as a goldic test.

Khan et al. BMC Bioinformatics 2012, 13:112 Page 8 of 15http://www.biomedcentral.com/1471-2105/13/112
The fact that other subcomponents do not signifi-cantly link to target classes in our target analysis is astrong indicator that the associations between the com-pounds in most components are not restricted to knownprimary target mechanisms and that our method allowsfor discovering novel, but still undefined, mechanism ofaction and target linkages between compounds. Theevaluation of mechanisms of action that cannot beexplained via known protein targets is a challenging re-search direction, which requires uncovering the vast hid-den mechanisms that might make two seemingly non-similar compounds similar. We feel that our approachprovides a step forward towards the goal of understandingdrug associations extracted from the actual measurementdata that could potentially provide hypotheses for unex-plored polypharmacology and both target and off-targetdrug mechanisms.
Components 3/3A – A cell stress componentWe observed that in component 3, the top genes andgene sets indicate mostly mitochondrial and metabolicstress-related processes. Top gene sets associating withthis component include many gene sets connecting tomitochondrial function (Figure 3). Similarly, on the genelevel several known cell stress genes such as PGK1,PGD, and PRMT1 [15-17] are upregulated. A deeperlook into the 3D structures of the top compounds in thiscomponent (Additional file 1: Top_Compounds.xls)reveals a possibility of 4–12 hydrogen bonds in all of thetop compounds of set 3A. Thus, these compounds maybe able to affect proton transportation processes, whichis in agreement with the biological interpretation thatmitochondria act like proton pumps. As an example,Figure 4 shows the hydrogen bond donor and acceptorregions of azacitidine and idarubicin.To help understand how the biological variability
caused by the drugs and the chemical features in com-ponent 3A compares with the intrinsic variability fromone cell type to another, we visualize drug response tran-sitions on MCF7 cells. Thirty different breast cancer cell
Figure 4 Compounds high in hydrogen Bonding. Azacitidine(left) and Idarubicin (right) showing H-bonding areas with blue(hydrogen-bond donor) and red (hydrogen-bond acceptor).
types are used as references in their unperturbed condi-tion (as described in Methods). The MCF7 treatmentsfrom subcomponent 3A and the thirty independentbreast cancer cells are plotted in Figure 5 using a recentmultidimensional scaling method called NeRV [18,19].NeRV shows these different cell instances mapped ontothe 2-dimensional display such that similarities are pre-served as faithfully as possible. Subcomponent 3A con-tains many DNA-damaging agents such as the DNAintercalating and topoisomerase inhibitory camptothe-cin, daunorubicin, and mitoxantrone, the CDK inhibitorsalsterpaullone, GW-8510 and 0175029–0000, the cardiacglycoside lanatoside C, which at high concentrations islikely to inhibit topoisomerases [20] the antimetabolitemethotrexate, as well as rescinnamine, which has beensuggested to induce a DNA damage response without it-self inducing DNA damage [21] and the aromatase in-hibitor letrozole. The NeRV plot based on the topchanged genes in treated and untreated MCF7 cells aswell as a panel of other breast cancer cell lines, showsthat after treatment with these drugs, the gene expres-sion of the luminal, ER-positive MCF7 cells starts to re-semble the basal, ER-negative breast cancer types.Interestingly, while MCF7 cells are relatively chromoso-mally stable, the drug-treatments make them appear likechromosomally unstable and intrinsic high DNA damagecell lines such as HCC1937 or MDA-MB-231. Cell stressis an emerging cancer therapy target and it is interestingthat a) this subcomponent including topoisomerase inhi-bitors, antimetabolites and CDK inhibitors inducesstress-related metabolic responses in MCF7 cells similarto what is seen in a basal level in other, more malignant
Figure 5 3A drug transitions. NeRV visualization showing DrugTreatment Transitions. Lines indicate the transition from PretreatedMCF7 to treated MCF7 cells.
Khan et al. BMC Bioinformatics 2012, 13:112 Page 9 of 15http://www.biomedcentral.com/1471-2105/13/112
and undifferentiated breast cancer cells, and b) it raisesthe hypothesis that the compounds in this subcompo-nent could be combined with cell stress targeting com-pounds. This finding is strengthened by the fact thatmany of the top upregulated genes in the 3A subcompo-nent; ACHY, CDC37, GPI, ME2, PMRT1, P4HB, PGD,and PGK1 are also overexpressed in breast cancers ascompared to normal tissue (Additional file 4: HeatMaps.pdf, Figure A).
Components 2B & 10A – functionally similar but gene-wise different responsesWe observe that component groups 2B, 3A, and 10A shareseveral compounds such as the DNA-intercalating topo-isomerase inhibitors mitoxantrone and irinotecan, thecyclin-dependent kinase (CDK) inhibitors alsterpaullone,GW-8510 and 0175029–0000, and the antimetabolitesmethotrexate and azacitidine, 5 of the top 20 between eachpaired group. Most of the non-overlapping compounds ineach component group are not linked functionally or struc-turally in any obvious way, on the other hand. To verify thatthe components capture different phenomena despite shar-ing several compounds, we compute chemical compositionand biological similarity matrices over all component pairs.
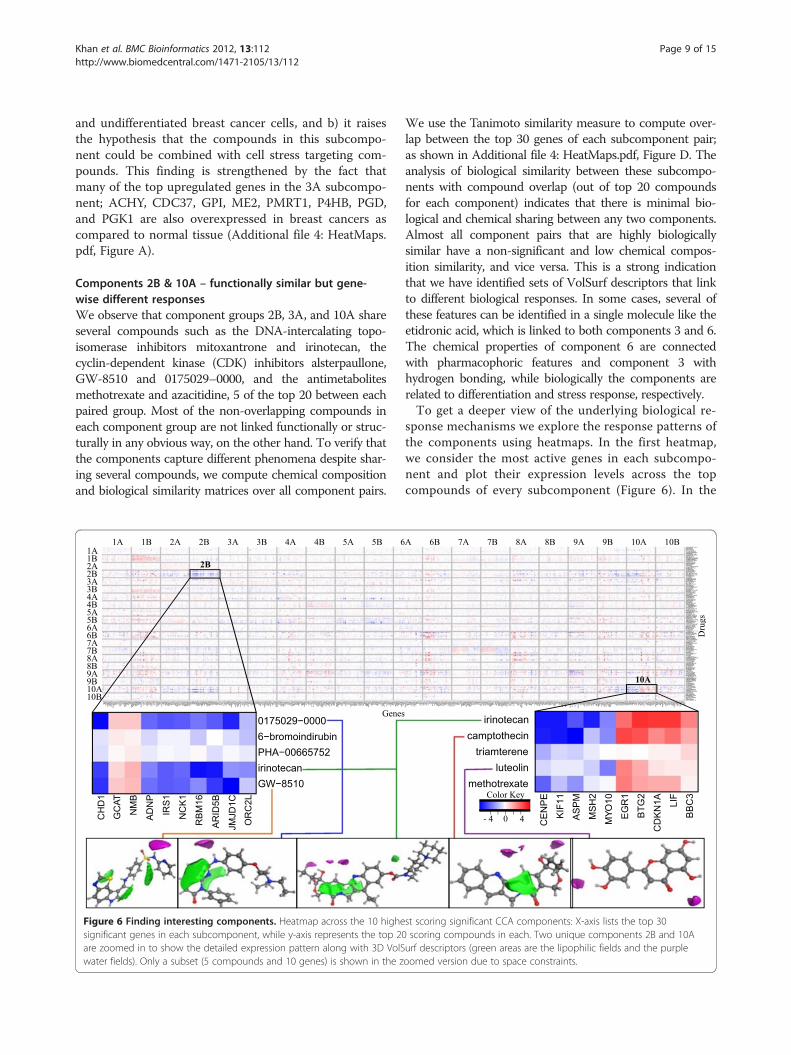
Figure 6 Finding interesting components. Heatmap across the 10 highesignificant genes in each subcomponent, while y-axis represents the top 20are zoomed in to show the detailed expression pattern along with 3D VolSwater fields). Only a subset (5 compounds and 10 genes) is shown in the z
We use the Tanimoto similarity measure to compute over-lap between the top 30 genes of each subcomponent pair;as shown in Additional file 4: HeatMaps.pdf, Figure D. Theanalysis of biological similarity between these subcompo-nents with compound overlap (out of top 20 compoundsfor each component) indicates that there is minimal bio-logical and chemical sharing between any two components.Almost all component pairs that are highly biologicallysimilar have a non-significant and low chemical compos-ition similarity, and vice versa. This is a strong indicationthat we have identified sets of VolSurf descriptors that linkto different biological responses. In some cases, several ofthese features can be identified in a single molecule like theetidronic acid, which is linked to both components 3 and 6.The chemical properties of component 6 are connectedwith pharmacophoric features and component 3 withhydrogen bonding, while biologically the components arerelated to differentiation and stress response, respectively.To get a deeper view of the underlying biological re-
sponse mechanisms we explore the response patterns ofthe components using heatmaps. In the first heatmap,we consider the most active genes in each subcompo-nent and plot their expression levels across the topcompounds of every subcomponent (Figure 6). In the
st scoring significant CCA components: X-axis lists the top 30scoring compounds in each. Two unique components 2B and 10Aurf descriptors (green areas are the lipophilic fields and the purpleoomed version due to space constraints.

Khan et al. BMC Bioinformatics 2012, 13:112 Page 10 of 15http://www.biomedcentral.com/1471-2105/13/112
figure we search for the subcomponents that have aunique expression pattern across other subcomponentsin a column. Components 2B and 10A show a uniquestructure. These seem to represent two separate aspectsof DNA damage response, which are connected to twoseparate molecular features; hydrophobicity in compo-nent 2B and shape-type VolSurf descriptors in compo-nent 10A. The gene expression changes in bothsubcomponents are strongly linked to a DNA damageand mitotic arrest response with many proto-oncogeniccell division and mitogenic signaling genes being downregulated (Figure 6; Additional file 3: Top_Genes.xls).The same genes are commonly seen upregulated in can-cers (Additional file 4: HeatMaps.pdf, Figure B and C)and many of them have been and are pursued as drugtargets. Therefore both the components are similar on alarger biological scale, but do in fact have little gene-wise overlap.To validate these hypotheses, we checked for reported
growth inhibition for the top 20 chemicals in these twosubcomponents in the NCI/DTP in vitro cell line testingdatabase (NCI60 testing program, http://dtp.nci.nih.gov/docs/cancer/cancer_data.html). Four compounds from2B and 10 from 10A were represented in the NCI60datasets (Table 2). Almost all of these compounds wereused in CMap at doses that will very effectively stop thecells from growing or kill them.
Table 2 Growth Inhibition verification of 2B/10ACompounds
Chemical CMap (μM) GI50 (μM) Subcomponent Cell line
berberine 10 25.1 2B MCF7
irinotecan 100 6.3 2B, 10A MCF7
mitoxantrone 7.9 0.004 2B MCF7
amiodarone 6.3 4.0* 2B PC3
8-azaguanine 25.1 0.32 10A HL60
apigenin 15.9 25.1 10A HL60
azacitidine 15.9 0.79 10A PC3
camptothecin 12.6 <0.01** 10A MCF7
chrysin 15.9 15.8*** 10A MCF7
methotrexate 7.9 0.03 10A MCF7
thioguanosine 12.6 0.32 10A MCF7
esculetin 25.1 >100** 10A HL60
fulvestrant 1.0 >100** 10A PC3
GI50 values (drug concentration causing a 50% growth inhibition) from NCI/DTP are shown along with the corresponding concentrations used in theConnectivity Map (CMap) data. By comparing the GI50 and CMap values wecan get an idea of expected cell killing effect of the drug in the CMap data.Drugs that are expected to eventually kill the cells are shown in bold. GI50and CMap concentration values are in μM scales.* GI50 value at the end of the tested range.** Mean of GI50 values from HL60 and MCF7 cell lines.*** Value from HL60 cell line.
Component 7B – A leukemia-specific subcomponentBased on studying the heatmaps, 7B is another interest-ing subcomponent: It has a dominant effect on HL60 ascompared to MCF7 and PC3, indicating that this sub-component and the link between structure and gene ex-pression may be specific for leukemic cells and leukemic-specific molecular targets.Figure 7 shows the activity of most significant genes
(columns) corresponding to the top compounds (rows)across the three cell lines. The top drugs are mainly car-diac glycosides and these drugs are known to have astrong toxic effect on leukemic cells at the concentra-tions used. It is worth noting that FLT3LG (FLT3 ligand)is one of the most significantly up-regulated genes. TheFLT3 receptor, to which FLT3LG binds, is an emergingtarget in leukemia [22].
ConclusionsWe have introduced a chemical systems biology ap-proach for analyzing the complex relationship patternsbetween chemical structures of drug molecules and theirgenome-wide responses in cells. With Canonical Correl-ation Analysis, we are able to find statistical dependenciesbetween the two data spaces in the form of correlatedcomponents. We have demonstrated quantitatively thatthese components are more informative about drug simi-larity than either chemical or biological data separately.Our approach finds the relationships in an entirely
data driven way without being constrained to known tar-get information. Uncovering the detailed mechanisms of
PD
X1
GR
M8
FLT
3LG
LAM
B4
PLC
E1
GP
R3
GP
R63
CC
KA
RA
DR
A1D
BM
PR
1BN
MU
R1
KR
T81
SG
CA
IL3
PR
KX
ER
CC
8A
LG6
DH
DD
SM
AN
1B1
TH
OP
1S
RG
AP
2S
LC37
A4
MG
AT1
TB
RG
4G
MP
PAS
LC29
A1
CLU
AP
1P
IGB
PC
YT
2A
BC
C10
bucladesinemedrysonedigoxinmeclofenoxatemetoprololcefoxitiniopromidecefalotinspectinomycinlanatoside Cbucladesinemedrysonedigoxinmeclofenoxatemetoprololcefoxitiniopromidecefalotinspectinomycinlanatoside Cbucladesinemedrysonedigoxinmeclofenoxatemetoprololcefoxitiniopromidecefalotinspectinomycinlanatoside C
Key
MC
F7
PC
3H
L60
-2 -1 0 1 2
Figure 7 Heatmap for subcomponent 7B. Y-axis lists the top 10active compounds in the component, replicated over the three celllines, while the X-axis lists the most significantly active genes in thecomponent. The genes are clearly activated systematically andexclusively in the HL60 cell line, hence indicating an HL60 specificresponse.

Khan et al. BMC Bioinformatics 2012, 13:112 Page 11 of 15http://www.biomedcentral.com/1471-2105/13/112
actions of a diverse library of drugs, including those nothaving known target classes is a major research goal.Our approach provides the first step, by generating hy-potheses for unexplored polypharmacology and both tar-get and off-target drug mechanisms.In our study, we used gene sets to introduce biological
knowledge into the analysis. Iorio et al. [8] have recentlygot promising results with an alternative method of ana-lyzing gene expression responses. It is an interesting andnon-straightforward research question whether that ap-proach can be generalized to searching for structure-response relationships.We have also demonstrated the use of advanced
visualization methods to facilitate detailed interpretationof the chemical and biological characteristics of thecomponents. Our findings show connections betweenthe biological responses of many known drug groups totheir general chemical properties (Table 1). As an ex-ample of the ability of the model to discover detaileddrug response mechanisms we were able to separate dif-ferent DNA damage responses that appear to be drivenby different chemical features in compound sets havingconsiderable overlap. Subcomponents 2B, 3A, and 10Aall contain classic chemotherapeutic and DNA damagingagents as described in the results section. Strikingly, sub-components 2B and 10A are driven primarily by hydro-phobic/lipophilic descriptors and are more similar intheir biological output. They both connect to the down-regulation of many proto-oncogenic and mitotic genesbut notably still through almost entirely non-overlappinggene sets and genes. Subcomponent 3A, on the otherhand, which is connected to hydrogen bonding andhydrophilic features, connects to a very different cellularresponse: the turning on of many stress-induced“defense” genes. In other words, we document howwithin the same compound or related compounds,hydrophobic and size features drive a mitotic arrest re-sponse while hydrogen bonding and hydrophilic featuresdrive a reparative response. This knowledge, in combin-ation with gene expression data in the solid tumors mayallow us to design and utilize the chemotherapeuticagents with the appropriate balance of hydrophilic, sizeand hydrogen bonding for each cancer patient to hit thecorrect balance between anti-growths to damage re-sponse induction for best possible efficacy.
MethodsGene expression dataWe used the Connectivity Map gene expression profiledata set as biological response profiles to drug treat-ments, forming the biological space. Instead of the rank-based procedure of the original Connectivity Map paper,we used a different preprocessing method since rankingamplifies noise; even small differences in low intensities,
which contain mostly noise are ranked, and this has asignificant impact on the identification of differentiallyexpressed genes. Hence, we downloaded the raw datafiles in original CEL-format, from http://www.broadinsti-tute.org/cmap/, which we RMA-normalized [23] beforecomputing differential expression. We used expressionprofiles from the most abundant microarray platform(HT-HG-U133A) in the data collection and computeddifferential expression with respect to the control mea-surements in each measurement batch. In the case ofmultiple controls per batch, we formed a more robustcontrol by removing as an outlier the control with thehighest Euclidean distance to the other controls, andthen used the mean of the rest as the controls. To fur-ther reduce noise in the expression data, we discarded5% of the genes having the highest variance in the con-trol measurements, that is, genes having high level ofvariation unrelated to chemical responses. As simplemeans of balancing between the varying sample sizes fordifferent chemicals in the CMap data, we chose for eachchemical the cell line instance with strongest affect,measured with the highest norm of response for furtheranalysis. The resulting gene expression data consisted ofprofiles for 1159 compounds over 11,350 genes.To bring in prior knowledge of biological responses,
and to reduce the dimensionality of the gene expressiondata, we performed Gene Set Enrichment Analysis(GSEA). GSEA gives as output for each gene set the dir-ection (positive/negative) and strength of the activity, asmeasured by the false discovery rate (FDR) q-values,ranging from 0 (indicating highest activity) to 1. Wetransformed the q-values for the CCA by first invertingsuch that 1 indicates the highest activity, and then wefurther mirrored the interval for the negatively activatedgene sets with respect to zero to take the sign of activityinto account. This results in a reasonably unimodal dis-tribution of the data around zero, with higher positiveand negative values indicating higher positive andnegative activation of the gene sets, respectively. In theresulting data we have biological activation profilesover 1321 gene sets for 1159 distinct chemicals (seeFigure 1B).As the gene sets, we used the C2 collection (curated gene
sets v2.5) from the Molecular Signatures Database (http://www.broadinstitute.org/gsea/msigdb/). The extensive col-lection of gene sets covered 90% genes in our data and isthus a sensible representation of the biological space. GSEAwas computed with the Java software package version 2–2.05 (http://www.broadinstitute.org/gsea).
Chemical descriptorsThe chemical space was formed by representing eachchemical with a set of descriptors of its structure andfunction. In the analysis, the chemical similarity is

Khan et al. BMC Bioinformatics 2012, 13:112 Page 12 of 15http://www.biomedcentral.com/1471-2105/13/112
dependent on the selected descriptors and thus the selec-tion is of utmost importance. This is especially true whenthe aim is to find small molecules that share targets andbiological functions regardless of structural similarity. Weuse the VolSurf descriptors, calculated using MOE version2009.10 (http://www.chemcomp.com/software.htm). Ori-ginal sdf-files were translated into 3D using Maestro/LigPrep (Maestro version 9.0) since VolSurf descriptorsare based on 3D molecular fields. The resulting data con-tains 76 descriptors for each chemical. Additional file 5:VolSurf_Classification.xls lists these descriptors.
Canonical correlation analysisDrug action mechanisms are indirectly visible in relation-ships between the chemical properties of the drug mole-cules and the biological response profiles. We carry out adata-driven search for such relationships with a methodthat searches for correlated components in the two spaces,as shown in Figure 1.Canonical Correlation Analysis (CCA [9]) is a multivari-
ate statistical model for studying the interrelationships be-tween two sets of variables. CCA explores correlationsbetween the two spaces whose role in the analysis is strictlysymmetric, whereas classical regression approaches likePartial Least Squares [24] typically explain one or possiblyseveral response variables in one space by a set of inde-pendent variables in the other one. The result of the CCAanalysis is an underlying component subspace relatingchemical descriptors with gene sets.Consider two matrices X and Y, of the size of n x p and n
x q, representing the chemical and biological spaces. Therows represent the samples and the columns are the fea-tures (gene set activation values or chemical descriptors). Inthe following we describe the CCA learning algorithm as astepwise process.First, two projection vectors w1 and v1 are sought such
that they maximize the correlation P1 between compo-nents of the data,
P1 ¼ max corw1;v1 Xw1;Yv1ð Þ;
subject to the constraint that the variance of the compo-nents is normalized, i.e.,
var(Xw1) = var(Yv1) = 1.
The resulting linear combinations Xw1 and Yv1 are calledthe first canonical variates or components, and P1 is re-ferred to as the first canonical correlation. The first canon-ical variates explain the maximum possible shared varianceof the two spaces along a single linear pair of projections:w1 and v1.The next canonical variates and correlations can be
found as follows. For each successive step s = 2,3,. . .min
(p,q), the projection vectors (ws,vs), can be found bymaximizing
Ps ¼ max corws;vs Xws;Yvsð Þ;subject to the constraint var(Xws) = var(Yvs) = 1, and witha further constraint of uncorrelatedness between differ-ent components.Let Cxx =XXT and Cyy = YYT denote the scaled sample
covariance matrices for the two input spaces, and Cxy =XYT the sample cross-covariance. Then the first canon-ical correlation is
P1 ¼ wT1 Cxyv1=
ffiffiffiffiffiffiffiffiffiffiffiffiffiffiffiffiffiffiwT1 Cxxw1
q ffiffiffiffiffiffiffiffiffiffiffiffiffiffiffiffivT1 Cyyv1
q:
If Cxx and Cyy are invertible the vectors w1 and v1maximizing the above equation can be found. Generally,in omics data and also in our study, the number ofgenes/gene sets is large compared to the number ofexperiments. In such cases the classical CCA solutionmay not exist or it can be very sensitive to collinearitiesamong the variables. This issue can be addressed byintroducing regularization [25-27], that penalizes thenorms of the associated vectors. Hence, we seek projec-tion vectors that maximize the penalized correlation
P1 ¼ wT1 Cxyv1=
ffiffiffiffiffiffiffiffiffiffiffiffiffiffiffiffiffiffiffiffiffiffiffiffiffiffiffiffiffiffiffiffiffiffiffiffiffiffiwT1 Cxxw1 þ L1‖w1‖
q ffiffiffiffiffiffiffiffiffiffiffiffiffiffiffiffiffiffiffiffiffiffiffiffiffiffiffiffiffiffiffiffiffiffivT1 Cyyv1 þ L2‖v1‖
q :
The regularization coefficients L1 and L2 were esti-mated with a 20-fold cross validation over a grid ofvalues, while maximizing the retrieval performance onknown drug properties. The retrieval procedure andperformance measure are described in the Drug similar-ity validation section below. In each fold, the model wasfirst applied to a training data set, and the test datawere then projected to the obtained components. Esti-mated regularization parameter values were L1 = 100and L2 = 0.001. We used R-package “CCA” [26].
Drug similarity validation procedureTo quantitatively validate the performance of thecomponent model in extracting functionally similardrugs, we carried out the following analysis. For thegiven data set, we first computed pairwise similaritiesof drugs. In practice, we used each chemical in turnas a query, and ranked the other chemicals based ontheir similarity to the query. For the similarity meas-ure, we had three alternatives, similarity in the CCAcomponent space, in the biological space, and in thechemical space. Finally, we computed the average pre-cision of retrieving chemicals that are functionallysimilar to the query, i.e. share at least one knownproperty in an external validation set. We report themean of the average precisions for all chemicals. Werepeat the analysis as a function of the number of the

Khan et al. BMC Bioinformatics 2012, 13:112 Page 13 of 15http://www.biomedcentral.com/1471-2105/13/112
top ranked chemicals used to compute the averageprecision (from 5 to 100).We constructed the external validation set about the
functional similarity of the drugs from their knownprotein targets and ATC (Anatomical TherapeuticChemical, http://www.whocc.no/atc_ddd_index/) codes.Drug target information was obtained from ChEMBL(https://www.ebi.ac.uk/chembl/), DrugBank (http://www.drugbank.ca/), DUD (http://dud.docking.org/), and ZINC(http://zinc.docking.org/). We additionally extracted tar-gets and ATC codes for the CMap chemicals from thesupplementary material provided in [8]. From the ATCcodes we used the fourth level information, indicatingthe chemical/therapeutic/pharmacological subgroup andhence high similarity of drugs. In total we have 4427associations between 821 CMap chemicals and 796 tar-gets or ATC codes.
Visualizing through an “eye diagram”: relationshipbetween gene sets, extracted components, and VolSurfdescriptorsThe CCA components summarize statistical relation-ships between the chemical and biological spaces. Therelationships can be visualized as in Figure 1 and 3; thecomponents in the middle are connected to the chem-ical descriptors that activate them (left) and to the genesets (right) that are differentially expressed when thecomponent is active. We selected the top 10 significantcomponents from the CCA model for the visualizations.The significances of the components were estimated bya permutation test, using the observed correlations as atest statistic. The samples in one of the spaces were ran-domly rearranged removing the relationship with theother space. One thousand such random permutationswere formed and their canonical correlations computed.Component significances were then determined as theproportion of random correlations that are greater thanthe observed correlation.The components were further split into two subcom-
ponents labeled ‘A’ and ‘B’, in A the canonical scores arepositive and in B negative. Compounds in the two sub-components behave in the opposite fashion on the genesets and VolSurf features, such that when one of thesubcomponents activates some biological processes, theother either has no effect or deactivates them. For visualclarity the eye diagram shows only the top 10 correlatedgene sets for each component, out of the 1321 gene setsused. All 76 VolSurf features are shown. The eye dia-gram was originally introduced in [28] for visualizingcomponent models.
Differentially expressed genes and GO enrichmentTo get a comprehensive view of the biology in eachcomponent we extracted the genes and Gene Ontology
classes active in each one of them. For each component,we took the top 20 positively and top 20 negatively cor-related gene sets and listed the genes in them. We thentested the differential expression of these genes in thetop 10 active compounds in a component using a regu-larized t-test [29]. The genes having p-values< 0.05were considered to be significantly activated by thecompounds in the component. This procedure ensuresthat the extracted genes are most representative of thetop correlated gene sets in the component, hence con-tributing the most to the canonical correlation.The component-specific list of significantly differentially
expressed genes was used to compute the correspondingGene Ontology Enrichment for each component. En-richment was computed for Biological Process classesusing GOstats R-package (www.bioconductor.org/help/bioc-views/release/bioc/html/GOstats.html). Additionalfile 2: Top_GOTerms.xls lists the top 10 significant GOterms for each component while Additional file 3: Top_-Genes.xls lists the top 30 significantly differentiallyexpressed genes.
Target enrichment procedureThe target enrichment analysis of each subcomponentwas performed using the known shared targets. Specific-ally, the shared targets of top 20 compounds of each sub-component was compared to target sharing in 1000random draws of the same number of compounds. P-valueis given by the proportion of enriched targets in the ran-dom samples. Additional file 6: Target_Breakdown.xls liststhe common targets and p-values for each subcomponent.Drug Target data was obtained from ChEMBL (https://
www.ebi.ac.uk/chembl/), DrugBank (http://www.drugbank.ca/), DUD (http://dud.docking.org/), and ZINC (http://zinc.docking.org/). We additionally extracted targetsfrom the supplementary material provided in [8]. Intotal 716 CMap chemicals had target information.
Characterizing drug response on breast cancer cellsWe investigated if the components reveal interestingpatterns in the responses to drugs, by plotting the transi-tions caused by each drug in the gene subspace definedby the component. This was done by extracting the 100most significant genes as an effective representative ofchanges caused by treatments in the genome (using theprocedure described in Differentially expressed genesand GO Terms sub-section above). The profiles of 30 in-dependent cell lines in a steady-state, unperturbed con-ditions, were included to act as references for calibratingthe display. These independent breast cancer cell lineswere obtained from ArrayExpress experiment ID E-MTAB-37 (www.ebi.ac.uk/arrayexpress) with replicatesmerged to make a single representation for each of thecell types. All cell lines were annotated as BasalA,

Khan et al. BMC Bioinformatics 2012, 13:112 Page 14 of 15http://www.biomedcentral.com/1471-2105/13/112
BasalB, Luminal, or progenitor using classifications byKuemmerle et al.,[30]. Only MCF7 (breast cancer) treat-ments were used from CMap data.The breast cancer cell line and CMap data come from
different Affymetrix platforms, HG-U133plus_2.0 andHT-HG-U133A, respectively. We therefore normalizedthem separately by computing differential expression asthe expression value divided by the mean of each genewithin the platform. These normalized data were scaledusing log2.Both the CMap-selected instances and breast cancer
cell data were collected into a single matrix. To visualizethe transitions, pairwise correlation similarities werecomputed over this matrix and plotted using the state-of-the-art non-linear dimensionality reduction andvisualization tool; Neighbor Retrieval Visualizer NeRV[18,19]. The result is a mapping of the high-dimensionalexpression profiles to a two-dimensional display for eas-ier visualization, such that if two points are similar inthe visualization, they can be trusted to have been simi-lar before the projections also. NeRV visualization ofcomponent 3A, which is analyzed in the Results, isshown in Figure 5.
Additional files
Additional file 1: Table S1. Top_Compounds.xls. Contains lists of Top20 active compounds in each subcomponent.
Additional file 2: Table S2. Top_GOTerms.xls. Contains lists of Top 10significant GO Terms in each component.
Additional file 3: Table S3. Top_Genes.xls. Contains lists of Top 30significant Genes in each subcomponent.
Additional file 4: Figure S1. HeatMaps.pdf. Contains breast cancerpatient heat maps and chemical/biological composition plot.
Additional file 5: Table S4. VolSurf_Classification.xls. Contains lists of allVolSurf features and their pharmacophoric classification.
Additional file 6: Table S5. Target_Breakdown.xls. Contains list ofcommonly occurring protein targets in each subcomponent.
Authors' contributionsSuK carried out the GSEA, CCA, Gene/GO Enrichment analyses whileparticipating in preprocessing the data, retrieval and NeRV studies andplotting heatmaps. AF worked on model selection and statistical significancetests for the CCA, developed the initial versions for the heatmaps and theEye Diagram, and coordinated the first writing of the manuscript. J-PMparticipated in pre-processing of the Connectivity Map data and the NeRVstudy. JP plotted the Eye Diagram and participated in NeRV and retrievalstudies. TK calculated the VolSurf descriptors used in the study. The PI’s AP,OK, KW and SK supervised the study. All authors participated in planning andwriting, and read and approved the final manuscript.
AcknowledgementsSuK, AF, JP, and SaK belong to the Adaptive Informatics Research Center atAalto University School of Science. This work was supported by theAcademy of Finland [Center of Excellence funding no. 213502(Translational Genome-scale Biology) and funding no. 140057(Computational modeling of the biological effects of chemicals)], thePASCAL2 Network of Excellence, ICT [216886], Sigrid Juselius Foundation,Cancer Society of Finland, the Jane and Aatos Erkko Foundation, the
HBGS graduate school (J-PM), the FICS graduate school (SuK and AF),and the HECSE graduate school (JP).
Author details1Helsinki Institute for Information Technology HIIT, Department ofInformation and Computer Science, Aalto University, PO Box 15400, Espoo00076, Finland. 2Institute for Molecular Medicine Finland FIMM, University ofHelsinki, PO Box 20, Helsinki 00014, Finland. 3CADD, Global DiscoveryChemistry, Novartis Institute for Biomedical Research, Basel CH4002,Switzerland. 4School of Pharmacy, Faculty of Health Sciences, University ofEastern Finland, PO Box 1627, Kuopio 70211, Finland. 5Helsinki Institute forInformation Technology HIIT, Department of Computer Science, University ofHelsinki, PO Box 68, Helsinki 00014, Finland.
Received: 31 August 2011 Accepted: 9 April 2012Published: 30 May 2012
References1. Keiser MJ, Setola V, Irwin JJ, Laggner C, Abbas AI, Hufeisen SJ, Jensen NH,
Kuijer MB, Matos RC, Tran TB, Whaley R, Glennon RA, Hert J, Thomas KL,Edwards DD, Shoichet BK, Roth BL: Predicting new molecular targets forknown drugs. Nature 2009, 462:175–191.
2. Iskar M, Campillos M, Kuhn M, Jensen LJ, Noort VV, Bork P:Drug-Induced Regulation of Target Expression. PLoS ComputationalBiology 2010, 6(9).
3. Cramer RD III, Patterson DE, Bunce JD: Comparative molecular fieldanalysis (CoMFA). Effect of shape on binding of steroids to carrierproteins. J. Am. Chem. Soc. 1988, 110(18).
4. Lamb J, Crawford ED, Peck D, Modell JW, Blat IC, Wrobel MJ, Lerner J,Brunet JP, Subramanian A, Ross KN, Reich M, Hieronymus H, Wei G,Armstrong SA, Haggarty SJ, Clemons PA, Wei R, Carr SA, Lander ES, Golub TR:The Connectivity Map: Using Gene-Expression Signatures to Connect SmallMolecules, Genes, and Disease. Science 2006, 313(5795):1929–1935.
5. Hopkins AL: Network pharmacology: the next paradigm in drugdiscovery. Nature Chemical Biology 2008, 4(11):682–690.
6. Tatonetti NP: Predicting drug side-effects by chemical systems biology.Genome Biology 2009, 10(238).
7. Spicker JS, Brunak S, Frederiksen KS, Toft H: Integration of ClinicalChemistry, Expression, and Metabolite Data Leads to Better ToxicologicalClass Separation. Toxicological Sciences 2008, 102(2):444–454.
8. Iorio F, Bosotti R, Scacheri E, Belcastro V, Mithbaokar P, Ferriero R, Murino L,Tagliaferri R, Brunetti-Pierri N, Isacchi A, di Bernardo D: Discovery of drugmode of action and drug repositioning from transcriptional responses.PNAS 2010, 107(33):14621–14626.
9. Hotelling H: Relations between two sets of variants. Biometrika 1936,28:321–327.
10. Atias N, Sharan R: An Algorithmic Framework for Predicting Side-Effectsof Drugs. Journal of Computational Biology 2011, 18(3):207–218.
11. Cruciani G, Pastora M, Gubab W: VolSurf, a new tool for thepharmacokinetic optimization of lead compounds. Eur. J. Pharm. Sci 2000,11(2):29–39.
12. Naylor E, Arredouani A, Vasudevan SR, Lewis AM, Parkesh R, Mizote A, RosenD, Thomas JM, Izumi M, Ganesan A, Galione A, Churchill GC: Identificationof a chemical probe for NAADP by virtual screening. Nature ChemicalBiology 2009, 5(4):220–226.
13. Blower PE, Yang C, Fligner MA, Verducci JS, Yu L, Richman S, Weinstein J:Pharmacogenomic analysis: correlating molecular substructure classeswith microarray gene expression data. The Pharmacogenomics Journal2002, 2(4):259–271.
14. Cheng T, Wang Y, Bryant SH: Investigating the correlations among thechemical structures, bioactivity profiles and molecular targets of smallmolecules. Bioinformatics 2010, 26(22):2881–2888.
15. Wang J, Wang J, Dai J, Jung Y, Wei CL, Wang Y, Havens AM, Hogg PJ, KellerET, Pienta KJ, Nor JE, Wang CY, Taichman RS: A glycolytic mechanismregulating an angiogenic switch in prostate cancer. Cancer Res. 2007, 67(1):149–59.
16. Gessner T, Vaughan LA, Beehler BC, Bartels CJ, Baker RM: Elevated pentosecycle and glucuronyltransferase in daunorubicin-resistant P388 cells.Cancer Res 1999, 50(13):3921–7.
17. Scoumanne A, Chen X: Protein methylation: a new mechanism of p53tumor suppressor regulation. Histol Histopathol 2008, 23(9):1143–9.

Khan et al. BMC Bioinformatics 2012, 13:112 Page 15 of 15http://www.biomedcentral.com/1471-2105/13/112
18. Venna J, Peltonen J, Nybo K, Aidos H, Kaski S: Information retrievalperspective to nonlinear dimensionality reduction for data visualization.Journal Machine Learning Research 2010, 11:451–490.
19. Venna J, Kaski S: Nonlinear dimensionality reduction as informationretrieval. In Marina Meila and Xiaotong Shen, editors, Proceedings ofAISTATS 2007, the 11th International Conference on Artificial Intelligence andStatistics. Omnipress 2007. JMLR Workshop and Conference Proceedings,Vol. 2: AISTATS 2007.
20. Prassas I, Diamandis EP: Novel therapeutic applications of cardiacglycosides. Nat Rev Drug Discov 2008, 7(11):926–35.
21. Vasilyeva A, Clodfelter JE, Gorczynski MJ, Gerardi AR, King SB, Salsbury F,Scarpinato KD: Parameters of Reserpine Analogs That Induce MSH2/MSH6-Dependent Cytotoxic Response. J Nucleic Acids 2010, 2010(2010):162018 .
22. Sanz M, Burnett A, Lo-Coco F, Löwenberg B: FLT3 inhibition as a targetedtherapy for acute myeloid leukemia. Curr Opin Oncol 2009, 21(6):594–600.
23. Irizarry RA: Summaries of Affymetrix GeneChip probe level data. NucleicAcids Research 2003, 31(4).
24. Wold H: Estimation of principal components and related models by iterativeleast squares. Analysis: Multivariate; 1966:391–420.
25. Leurgans SE, Moyeed RA, Silverman BW: Canonical Correlation Analysiswhen the Data are Curves. Journal of the Royal Statistical Society B 1993, 55(3):725–740.
26. Gonzalez I, Dejean S, CCA: An R Package to extend Canonical CorrelationAnalysis. Journal of Statistical Software 2008, 23(12).
27. Bickel P, Li B: Regularization in Statistics. TEST 2006, 15(2):271–344.28. Caldas J, Gehlenborg N, Faisal A, Brazma A, Kaski S: Probabilistic retrieval
and visualization of biologically relevant microarray experiments.Bioinformatics 2009, 25(12):145–153. ISMB/ECCB.
29. Baldi P, Long AD: A Bayesian framework for the analysis of microarrayexpression data: regularized t -test and statistical inferences of genechanges. Bioinformatics 2001, 17:509–519.
30. Kuemmerle NB, Rysman E, Lombardo PS, Flanagan AJ, Lipe BC, Wells WA,Pettus JR, Froehlich HM, Memoli VA, Morganelli PM, Swinnen JV,Timmerman LA, Chaychi L, Fricano CJ, Eisenberg BL, Coleman WB, KinlawWB: Lipoprotein lipase links dietary fat to solid tumor cell proliferation.Mol Cancer Ther 2011, 10(3):427–436. doi:10.1158/1535-7163.MCT-10-0802.
doi:10.1186/1471-2105-13-112Cite this article as: Khan et al.: Comprehensive data-driven analysis ofthe impact of chemoinformatic structure on the genome-widebiological response profiles of cancer cells to 1159 drugs. BMCBioinformatics 2012 13:112.
Submit your next manuscript to BioMed Centraland take full advantage of:
• Convenient online submission
• Thorough peer review
• No space constraints or color figure charges
• Immediate publication on acceptance
• Inclusion in PubMed, CAS, Scopus and Google Scholar
• Research which is freely available for redistribution
Submit your manuscript at www.biomedcentral.com/submit