
COMPREHENSIVE ANNUAL FINANCIAL REPORT FOR … · Comprehensive Annual Financial Report (CAFR) ......
152
COMPREHENSIVE ANNUAL FINANCIAL REPORT FOR THE YEAR ENDED DECEMBER 31, 2005
Transcript of COMPREHENSIVE ANNUAL FINANCIAL REPORT FOR … · Comprehensive Annual Financial Report (CAFR) ......

COMPREHENSIVE ANNUAL FINANCIAL REPORT FOR THE YEAR ENDED DECEMBER 31, 2005

2005
City of Bloomington, Indiana
Comprehensive Annual Financial Report
(CAFR)
For the Year Ended December 31, 2005
Prepared by: Office of the Controller
P.O. Box 100 Bloomington, IN 47402
(812) 349-3412 (812) 349-3456 (fax)

I. INTRODUCTION PAGE
Mayor's Letter of Transmittal I - 1Controller's Letter of Transmittal I - 2Organizational Chart I - 6Elected Officials I - 7City Boards and Commissions I - 8Acknowledgments I-14
II. FINANCIAL SECTION
Independent Auditors' Opinion on General Purpose Financial XXStatements II- 1Independent Auditor’s Report on Compliance and on Internal ControlXXover Financial Reporting based on an Audit of Financial StatementsXXPerformed in Accordance with Government Auditing Standards II- 2Management's Discussion and Analysis II- 3Basic Financial Statements:
Government-wide Financial Statements:Statement of Net Assets II-13Statement of Activities II-14
Fund Financial Statements:Balance Sheet - Governmental Funds II-15Reconciliation of the Balance Sheet to the Statement of Net Assets II-16Statement of Revenues, Expenditures, and Changes in Fund XXBalances - Governmental Funds II-17Reconciliation of the Statement of Revenues, Expenditures, and XXChanges in Fund Balances to the Statement of Activities II-18Statement of Net Assets - Proprietary Funds II-19Statement of Revenues, Expenses, and Changes in Fund Net Assets XX- Proprietary Funds II-20Statement of Cash Flows - Proprietary Funds II-21Statement of Fiduciary Net Assets II-22Statement of Changes in Fiduciary Net Assets II-23
Notes to the Financial Statements Summary of Significant Accounting Policies II-24
Assets, Liabilities and Net Assets or Equity II-26 Interfund Transactions and Balances II-27
Table of Contents

II. FINANCIAL SECTION (Continued) PAGE Property Taxes II-27 Inventories and Prepaid Items II-27 Restricted Assets II-27 Capital Assets II-27 Compensated Absences II-28 Long-Term Obligations II-28 Fund Equity II-29
Stewardship, Compliance and Accountability II-29 Budget Information II-29
Detailed Notes on All Funds II-29 Deposits and Investments II-29 Capital Assets II-31 Construction Commitments II-35 Interfund Balances and Activity II-35 Leases II-36 Long-Term Liabilities II-37 Other Information II-41 Pension Plans II-43
III. REQUIRED SUPPLEMENTARY INFORMATION
Budgetary Comparison Schedule- General Fund III- 1Budgetary Comparison Schedule- Major Special Revenue Funds III- 2Budget/ GAAP Reconciliation- General Fund and Major Special XXRevenue Funds III- 4Schedule of Funding Progress III- 5Schedule of Contribution From the Employer and Other Contributing XXEntities III- 6Notes to Required Supplementary Information III- 7
IV. SUPPLEMENTARY INFORMATIONMajor Governmental Funds IV- 1
Schedule of Expenditures- Budget and Actual- General Fund IV- 2Non-major Governmental Funds IV- 5Governmental Funds
Combining Sheet Non-major Governmental Funds IV- 9

IV. SUPPLEMENTARY INFORMATION (Continued) PAGECombining Statement of Revenues, Expenditures and Other XXChanges in Fund Balances- Non-major Governmental Funds IV-10
Special Revenue FundsCombining Balance Sheet Non-major Special Revenue Funds IV-11
Combining Statement of Revenues, Expenditures and Other XXChanges in Fund Balances- Non-major Special Revenue Funds IV-18
Debt Service FundsCombining Balance Sheet Non-major Debt Service Funds IV-24Combining Statement of Revenues, Expenditures and Other XXChanges in Fund Balances- Non-major Debt Service Funds IV-25
Capital Projects FundsCombining Balance Sheet Non-major Capital Projects Funds IV-26Combining Statement of Revenues, Expenditures and Other XXChanges in Fund Balances- Non-major Capital Projects Funds IV-30Budgetary Comparison Schedules- Other Non-major Budgeted XXGovernmental Funds IV-34
Proprietary FundsCombining Statement of Net Assets- Non-major Proprietary Funds IV-41Combining Statement of Revenues, Expenditures and other XXChanges in Fund Net Assets- Non-major Proprietary Funds IV-42Combining Statement Of Cash Flows- Non-major Proprietary XXFunds IV-43Budgetary Comparison Schedules- Other Non-major Budgeted XXProprietary Funds IV-44
Fiduciary FundsNon-major Fiduciary Funds IV-45Combining Statement of Net Assets- Non-major Fiduciary Funds IV-46Combining Statement of Revenues, Expenditures and other XXChanges in Fund Net Assets- Non-major Fiduciary Funds IV-47Budgetary Comparison Schedules- Other Non-major Budgeted Fiduciary Funds IV-48

V. STATISTICAL SECTION PAGE
Net Assets By Component - Schedule 1 V - 1 Changes in Net Assets - Schedule 2 V - 2 Fund Balances - Schedule 3 V - 4 Changes in Fund Balances- Schedule 4 V - 5 Assessed and Actual Taxable Property - Schedule 5 V - 7 Direct and Overlapping Tax Rates - Schedule 6 V - 8 City of Bloomington Principal Taxpayers- Schedule 7 V-11 Property Tax Levies and Collections - Schedule 8 V-13 Ratios of Outstanding Debt by Type - Schedule 9 V-16 Ratios of General Bonded Debt Outstanding - Schedule 10 V-17 Direct and Overlapping Govt. Activities Debt- Schedule 11 V-18 Legal Debt Margin Information - Schedule 12 V-19 Pledged Revenue Coverage - Schedule 13 V-22 Demographic and Economic Statistics- Schedule 14 V-24 Principal Employers - Schedule 15 V-25 Full-time Equivalent City Govt. Employees - Schedule 16 V-26 Operating Indicators by Function - Schedule 17 V-27 Capital Asset Statistics by Function/Program - Schedule 18 V-28


Community and Family Resources
Controller's Office
Employee Services
Housing and Neighborhood Development
Planning Parks & RecreationPolice Public WorksFire
Information and
Technology Services
Legal
VOTING RESIDENTSOF THE
CITY OF BLOOMINGTON
MAYOR CLERK
Utilities
Fleet Maintenance
Engineering Services
Parking Enforcement StreetAnimal Care
and Control Sanitation TrafficRisk ManagementHuman Rights
Redevelopment Commission
Plan Commission
Board of Public Safety
Board of Public Works
Board of Parks and Recreation
Utilities Service Board
Industrial Development Commission
Traffic Commission
Telecomm Council
Animal Control Commission
Arts Commission
Bicycle and Pedestrian Safety
Commission
Housing Authority Board
Plat Committee
Board of Zoning Appeals
Environmental Commission
Hearing Officer
Citizens' Advisory Committee
Historic Preservation Commission
Housing Quality Appeals
Housing Trust Fund Board
Dr. Martin Luther King Jr.
Commission
Council for Community Accessibility
Commission on the Status of Black
Males
Commission on the Status of
Women
Community and Family Resourcs
Commission
Tree Commission
Board of Public Transportation
Transit Housing Authority
COMMONCOUNCIL
Office of Economic
Development
Sustainability Commission
Economic Development Commission
Office of Safe and Civil City
City of Bloomington
Volunteer Network
I-6

2005
ELECTED OFFICIALS
MAYOR: Mark Kruzan
CITY CLERK: Regina Moore
COMMON COUNCIL
District 1 Chris Sturbaum, Vice President District 2 Jason R. Banach District 3 Michael Diekhoff District 4 Dave Rollo District 5 L. David Sabbagh District 6 Stephen Volan At Large Tim Mayer, Parliamentarian Chris Gaal Andy Ruff, President
CITY DEPARTMENT HEADS
Deputy Mayor, James McNamara
Corporation Counsel, Kevin Robling Controller, Susan Clark
Council Administrator, Dan Sherman Fire Chief, Jeff Barlow
Housing Authority, Jennifer Osterholt, Director Community and Family Resources, Pete Giordano
Parks and Recreation, Mick Renneisen Employee Services, Daniel Grundmann
Chief Information Officer, Richard Dietz Housing and Neighborhood Development, Susie Johnson
Planning, Tom Micuda Police Chief, Mike Hostetler Public Works, Julio Alonso
Animal Shelter, Laurie Ringquist Manager of Engineering Services, Justin Wykoff
Fleet Shop Foreman, Mike Young Sanitation, Larry Barker
Street Commissioner, Bob Chestnut Transit, Lew May
Utilities, Patrick Murphy
I-7

CITY BOARDS AND COMMISSIONS
Animal Control Commission Theresa Block Sarah DeLone Thomàs Heslin Valerie Pena
Randalyn Shepard (Dec) Shirley Davies (Oct)
Bicycle/Pedestrian Safety Commission
Joe Fish Michael Gavin (Mar)
Lissa Hunt (Dec) Mitch Rice
Jim Rosenbarger Gayle Stuebe (Mar)
Anne Phillips Holahan (Mar)
Bloomington Community Arts Commission George Van Arsdale
Michael S. Cagle (Mar) Margaret Contompasis (Mar)
Kris Floyd Rosemary Fraser
Peter Jacobi Valda Meijers Patricia Pizzo Chris Smith
Commission on the Status of Black Males
Larry Brown Paulette Patterson Dilworth
Cedric Harris William R. Knox (Mar)
David Hummons Genevieve Manset Williams
George Tardy Jr. (Jun)
Community & Family Resources Commission Shaunica Pridgen Jennifer Marcum
Jack Harlow Fran Moore John Zody
I-8

Nancy Rutkowski (Jul) Robert Monroe (May) Jeff McKinney (Oct)
Economic Development Commission
Dick McGarvey (Jan) Joyce Poling Dick Schmalz
Chris Sturbaum Kurt Zorn
Environmental Commission
Deb Backhus Ross Brittain
Kelly Boatman Tim Hanson (Dec)
Kriste Lindberg (Feb) Michael Litwin Isabel Piedmont
Heather Reynolds Laura Trout
Gina Williams (Jul – Dec) Kristen Beecher (Mar) Michael Tosick (Mar)
Historic Preservation Commission
Doug Bruce Jeannine Butler Sandra Clothier
Marjorie Hudgins Rosemary Miller
James Stewart Lois Sabo-Skelton
Marleen Newman (Jul) Advisory Members:
Duncan Campbell Henry Glassie
Matthew Reckard
Housing Authority Tim Ball
Kenneth Carmichael Richard Rampley (Feb)
Tom Risen Lindsey Smith
I-9

Doris Sims Mary Friedman (Mar)
Housing Quality Appeals Board
Kris Floyd Beth Gallman Ben Mitchell
Brent Thompson Sandi Cole (Dec)
Nikki Montembeat (May) Susie Hamilton (May)
Housing Trust Fund Board
Nancy Brinegar Jason Banach Mae Cassady
Susan Dabkowski Iris Kiesling Tim Mayer
Roger Sepanski Steve Wyatt Bob Lewis
Lon Stevens Kurt Zorn
Human Rights Commission
Byron Bangert Emily Bowman
Jeff Harlig Nancy Metz
Carolyn Calloway-Thomas Shaunica Pridgen
Valerie Haughton (Oct)
Industrial Development Advisory Council Rhonda Hinds
Kirk Hobbs Roger Kent Don Moore
Joyce Poling Richard Rampley
Senator Vi Simpson Doris Sims Ron Walker
I-10

Martin Luther King Birthday Commission Wendy Bernstein Barabara Fuqua Gloria Gibson
David F. Hummons Robert Motley (May) Sheldon Gellar (June)
William Vance
Board of Park Commissioners Joe Hoffmann
Mary Catherine Carmichael John Carter Les Coyne
Plan Commission
Scott Burgins Susan Fernandes
Chris Gaal Joseph Hoffmann
Milan Pece Tom Seeber Bill Stuebe
Travis Vencel Pat Williams Jack Baker
Board of Public Safety
Marc Carmichael Viola Tali-ferro (Mar)
Doris Sims Jason Vencel Betsy Walsh
Board of Public Works
Beth Hollingsworth Dr. Frank Hrisomalos, President
Charlotte Zietlow
Redevelopment Commission Michael Gentile
David Walter Paula Gordon
John West Mike Szakaly (Feb)
I-11

Telecommunications Council Duane Busick
Eric Ost Suzanne Owen Jesse Stryker Carl Zager
Traffic Commission
Mike Avila Buff Brown
Jack Davis, Ex-officio Bill Hayden
Jim Rosenbarger Sidney Smith
Jeff Weber Randy Williamson (Police), ex officio
Justin Wykoff (Engineering), ex officio
Tree Commission Tom Coleman
Laurel L. Comell Sean Gorman Gregory Hess
Mia P. Williams George Hegeman (Sep)
Public Transportation Corporation
Ray McConn Kent McDaniel Alex Cartwright Jill Lesh (Mar)
Nancy Obermeyer (Jun)
Urban Enterprise Association Jack Baker Roger Kent Tom Seeber Doris Sims
Senator Vi Simpson Chris Smith
Ron Stanhouse Steve Volan
Jeanne Walters Doug Wissing
Margarette Disque (Aug)
I-12

Danise Alano (Jul)
Utilities Service Board Richard L. Eherenman
Jeff Ehman (Feb) Tim Henke (Feb)
Tom Swafford Samuel Vaught
John Whikehart (Mar) Rachel Tolen (May)
Tom Micuda (Mayor), ex officio Tim Mayer (Council), ex officio
Commisson on Status of Women
Melanie Castillo-Cullather Cathi Crabtree Jillian Kinzie
Dorothy Saltzman Toby Strout
Debra Vance (Jul) Dorothy Granger (Oct)
Board of Zoning Appeals
Sue Aquila Patrick Murray
Milan Pece Tom Seeber
Jim Silberstein
I-13

ACKNOWLEDGMENTS
Our appreciation is extended to the various elected officials, department heads and employees responsible for contributing to the sound financial position of the City of Bloomington. In particular, we would like to acknowledge the efforts of a fine staff in the office of the Controller led by Deputy Controller, Sharon Williams; Alisa Brown, Budget and Research Manager, Brad Underwood, Systems Manager; Jeff McMillian, Accounting and Procurement Manager; Susan Truelock, Accounts Processor; Tamara Mitchner, Accounts Coordinator; and David Mitchel, Research Assistant. Data Processing support is provided by the Department of Information and Technology Services. Appreciation is also due to the audit team of the Indiana State Board of Accounts: Todd Austin, C.P.A., Office Supervisor Kerry Fleming, C.P.A., Field Supervisor Linda Hall, C.P.A., Auditor-in- Charge Kirk Farmer, Field Examiner Jessica Graft, Field Examiner Beth Goss, Field Examiner Hope Burdon, Field Examiner The Controller’s Office alone could not manage the fiscal affairs of the city without the support of those employees charged with the responsibility of overseeing the financial operations of their departments and agencies:
Animal Shelter: Danyale Carpenter Common Council: Dan Sherman City Clerk: Regina Moore Employee Services: Janice Chestnut Engineering: Laurel Waters Fire: Joyce Franklin Fleet Maintenance: Lisa Lazell H.A.N.D.: Janet Roberts Christina Finley Rhonda Helms C.A.F.R.: Edie Hays Legal: Kim Hilker Karen Wells Mayor: Diane Daily Parking Meter: Amy Smith Lori Beasley Parks and Recreation: Renee Langley Judy Seigle
I-14

Planning: Carmen Lillard Jane Weiser Police: Elaine Gresham Jamie Jahnke Public Works: Denise Henderson Penny Myers Risk Management: Renee Rose Street: Danna Workman Traffic: Debbie Vollmer Utilities: Michael Horstman Julie Martindale Michael Trexler Kim Robertson Patrick Stoffers This annual report includes statistical data from a variety of sources. We would like to thank Barbara Clark, Monroe County Auditor, and her staff for their help in collecting much of this data. We would also like to express our appreciation to Indiana University and the Greater Bloomington Chamber of Commerce for their help in collecting this data.
I-15


II-2

Management’s Discussion and Analysis As management of the City of Bloomington (the City), we offer the following discussion as insight into the financial performance of the City for the fiscal year ended December 31, 2005. For a complete understanding of the City’s financial position, this discussion and analysis should be read in conjunction with our letter of transmittal, the basic financial statements, and the notes to the basic financial statements. Financial Highlights
• The City’s total assets at December 31, 2005 were $420.8 million. The assets of the City exceeded its liabilities at the end of 2005 by $264.4 million. Of this amount, $11.3 million is considered unrestricted.
• The City’s total liabilities at December 31, 2005 were $156.4 million. • At the end of 2005, the City’s governmental funds reported a combined ending fund balance of
$33.6 million. The combined governmental funds’ fund balance increased by $378 thousand from the prior year’s ending fund balance. Approximately $14.8 million of the $33.6 million fund balance is considered unreserved at December 31, 2005.
• The City’s total debt increased by $7.1 million (5.1 percent). This includes additions of $14.8
million and reductions of $7.8 million. This increase is due to increases in loans payable, capital leases, a bond anticipation note, net pension obligation and compensated absences.
Using this Annual Report This discussion and analysis is intended to serve as an introduction to the City of Bloomington’s basic financial statements. The City’s basic financial statements are comprised of three components: government-wide financial statements, fund financial statements, and notes to the financial statements. In addition to the basic financial statements this Comprehensive Annual Financial Report (CAFR) includes other supplementary information along with the statistical section. Government-wide financial statements The government-wide financial statements present the financial picture of the City from the economic resources measurement focus using the accrual basis of accounting, in a manner similar to the private-sector. The government-wide financial statements are composed of two statements: the statement of net assets and the statement of activities. The statement of net assets presents information on all of the City’s assets and liabilities, with the difference between them reported as net assets. Net assets are then broken down between governmental and business-type activities. Over time, increases or decreases in net assets will show fluctuation in the City’s financial position. The statement of activities presents information on all of the City’s revenues and expenses, showing how the government’s general expenses less the program revenues equal net expenses for the most recent fiscal year. General revenues are then subtracted from net expenses to get the change in net assets. All of the current year’s revenues and expenses are taken into account regardless of when the cash is received or paid. Thus, revenue and expenses reported in this statement for some items will only result in cash flows in future fiscal periods (e.g., uncollected taxes and earned but unused vacation leave).
II-3

Both of the government-wide financial statements distinguish functions of the City that are principally supported by taxes and intergovernmental revenues (governmental activities) from other functions that are intended to recover all or a significant portion of their costs through user fees and charges (business-type activities). The governmental activities of the City include general government, public safety, highways and streets, sanitation, health and welfare, economic opportunity, economic development, culture and recreation, urban redevelopment and housing, capital outlay, and interest on long-term debt. The business-type activities of the City include a water utility and a wastewater utility. The government-wide financial statements include not only the City itself (primary government), but also the legally separate unit the Public Transportation Corporation for which the City is financially accountable. Financial information for this component unit is reported separately from the financial information presented for the primary government itself. The financial statements of this component unit can be found in their entirety on file in the City Controller’s office at 401 N. Morton Street, Bloomington, Indiana 47404. The government-wide financial statements can be found on pages II-13 through II-14 of this report. Fund financial statements A fund is a fiscal and accounting entity with a self-balancing set of accounts recording cash and other financial resources, with its related liabilities, and corresponding equity balances. Some funds are required to be established by State Law and by bond covenants, while others are adopted to help control monies set aside for a specific purpose. The City of Bloomington, like other state and local governments, uses fund accounting to ensure and demonstrate compliance with finance-related legal requirements. The funds of the City can be divided into three categories: governmental funds, proprietary funds, and fiduciary funds. Governmental funds. Governmental funds are used to account for most of the City’s basic services. These funds generally do not provide enough revenue to completely cover their expenses; therefore, they need taxes, fees, interest or any other intergovernmental revenue to help support them. These funds use the modified accrual method of accounting, which measures cash and all other financial assets that can readily be converted to cash. Governmental fund financial statements focus on near-term inflows and outflows of unrestricted resources, as well as focusing on balances of unrestricted resources available at the end of the fiscal year. Such information may be useful in evaluating a government’s near-term financing requirements. At the government-wide level, these funds are accounted for in the governmental activities column on the financial statements. The differences of results in the governmental fund financial statements to those in the government-wide financial statements are explained in a reconciliation following each governmental fund financial statement. The basic governmental fund financial statements can be found on pages II- 15 through II-18 of this report. Proprietary funds. A fund is classified as a proprietary fund when the City charges a fee to cover the entire cost of an operation, whether to outside customers or to other units of the City. There are two types of proprietary funds: enterprise funds and internal service funds. Enterprise funds are used to report the same functions presented as business-type activities in the government-wide financial statements. These funds are completely self-supported by providing services to outside customers of the City. The City uses enterprise funds to account for its water and wastewater operations. Internal Service funds are used to report activities that provide services and supplies for the other City departments. The City uses internal services funds to account for its risk management, fleet maintenance, and health insurance trust. The internal service funds are reported within the governmental activities section of the government-wide financial statements. The basic proprietary fund financial statements can be found on pages II- 19 through II-21 of this report.
II-4

Fiduciary funds. Fiduciary funds are funds held by a governmental unit as an agent or trustee. They are not reflected in the government-wide statements because the resources of those funds are not available to support the City’s own programs. The City holds two types of fiduciary funds: pension trust funds and a private-purpose trust fund. Pension trust funds are used to account for pension plans held by the City on behalf of its employees. The City uses pension trust funds to report the police pension and the fire pension funds. The private-purpose trust fund is used to account for monies held by the City for an external party, the Howard Young Bicentennial Trust. The basic fiduciary fund financial statement can be found on pages II-22 through II-23 of this report. Notes to the financial statements. The notes are a required part of the basic financial statements that provide necessary information for the understanding of the City’s financial report. The notes to the financial statements can be found on pages II-24 through II- 47of this report. Other information. The City is also required to provide more detailed information about certain issues disclosed in required supplementary information (RSI) schedules. The City’s RSI schedules include: Budgetary Comparison Schedule for General Fund and Budgeted Major Special Revenue Funds, Budget/GAAP Reconciliation for the General Fund and Budgeted Major Special Revenue Funds, the schedule of funding progress, schedule of contributions from the employer and other contributing entities, and the Notes to Required Supplementary Information. The combining financial statements for the non-major governmental funds and the internal service funds are found immediately following the RSI schedules listed above. The RSI schedules can be found on pages III-1 through III-8 of this report.
City of Bloomington Net Assets
(in thousands)
Governmental
Activities Business-type activities Total Component units 2005 2004 2005 2004 2005 2004 2005 2004 Current and other assets $38,086 $37,217 $15,055 $9,410 $53,141 $46,628 $3,433 $2,827 Capital assets 206,713 202,188 160,939 157,086 $367,653 $359,275 $9,644 10,323 Total assets $244,799 $239,406 $175,994 $166,497 $420,793 $405,902 $13,076 $13,150
Long-term liabilities outstanding 66,773 66,315 69,868 68,027 136,642 134,342 - - Other liabilities 8,885 7,490 10,838 5,470 19,722 12,960 279 227 Total liabilities 75,658 73,805 80,706 73,497 156,364 147,302 279 227 Net Assets
Invested in capital assets, net of related debt 161,119 154,445 83,418 85,935 244,538 240,380 9,644 9,168 Restricted 1,367 1,689 7,253 774 8,619 2,463 - - Unrestricted 6,656 9,467 4,617 6,290 11,273 15,758 3,153 3,755
Total Net Assets $169,141 $165,601 $95,288 $92,999 $264,429 $258,600 $12,797 $12,923
Government-wide Financial Analysis The City’s (primary government) net assets totaled $264.4 million at the close of 2005. Of the City’s net assets (total assets less total liabilities), $244.5 million (92.5 percent) reflects its investment in capital assets (e.g., land, construction in progress, buildings, improvements other than buildings, machinery and equipment, infrastructure, utility plant acquisition adjustment, and transportation equipment), less any debt used to acquire these assets that is still outstanding. These assets are designated as invested in capital assets because they are used to provide the everyday services the citizens of the City expect.
II-5

These assets are not liquid and are not available for future spending. The debt associated with these capital assets must be paid from sources other than the capital assets themselves because as stated before they cannot be used as a liquid asset. The remainder of the City’s net assets is designated as either restricted or unrestricted. The restricted portions, $8.6 million (3 percent), are dollars that are subject to an external restriction and cannot be spent on everyday operations. The unrestricted portion, $11.3 million (4 percent), may be used by the City for normal operations of providing services to the citizens of Bloomington. At the end of 2005, the City shows a positive net asset figure as a whole as well as in the governmental and business-type activities sections individually. This shows that the City has been able to make sound financial decisions over the past several years, leaving them with a solid equity base to build on. The City’s total net assets increased by $5.8 million during 2005. There was an increase in the City’s net assets for the business-type activities of $2.3 million and an increase in the governmental activities of $3.5 million. The City’s component unit showed assets exceeding liabilities by $12.8 million at the end of 2005. Of the net assets (total assets less total liabilities), $9.6 million (75 percent), reflects its investment in capital assets. These assets are designated as invested in capital assets because they are used to provide the everyday services to the users of the component units. These net assets are not liquid and are not available for future spending.
II-6

City of Bloomington Changes in Net Assets
(in thousands) Governmental Activities Business-type activities Total Component units 2005 2004 2005 2004 2005 2004 2005 2004 Revenues Program Revenues:
Charges for services 8,323 7,608 23,056 23,418 31,379 31,026 1,062 1,096 Operating grants and
contributions 6,231 5,370 - - 6,231 5,370 1,929 2,104 Capital grants and
contributions 5,165 166 - 351 5,165 517 1,328 175 General Revenues: - - - - - - - -
Property taxes 22,914 22,255 - - 22,914 22,255 812 799 County Option Income Tax 6,596 6,817 - - 6,596 6,817 251 - Excise Tax 1,022 1,471 - - 1,022 1,471 53 - Other taxes 1,093 1,209 - - 1,093 1,209 12 - Grants and contributions not
restricted to specific programs 1,078 11,253 - - 1,078 11,253 - - Unrestricted investment
earnings 879 406 258 78 1,137 484 86 - Other - - - 464 - 464 96 37
Total revenues 53,303 56,555 23,314 24,311 76,617 80,866 5,629 4,211 0 Expenses:
General government 11,393 9,443 - - 11,393 9,443 - - Public safety 19,422 18,477 - - 19,422 18,477 - - Highways and streets 3,321 4,477 - - 3,321 4,477 - - Sanitation 1,766 1,597 - - 1,766 1,597 - - Health and welfare 126 683 - - 126 683 - - Culture and recreation 5,756 7,408 - - 5,756 7,408 - - Urban Redevelopment and
Housing 4,977 2,172 - - 4,977 2,172 - - Interest on long-term debt 3,002 2,459 - - 3,002 2,459 - - Water - - 8,628 9,618 8,628 9,618 - - Wastewater - - 13,143 13,189 13,143 13,189 - - Bloomington Transit - - - - - - 5,712 5,052
Total Expenses 49,763 46,716 21,771 22,807 71,534 69,524 5,712 5,052 Increase in net assets before
transfers 3,540 9,839 1,543 1,504 5,083 11,343 (83) (840) Special items
Change in Accounting Principle - - - (4,138) - (4,138) (43) -
Extraordinary gains - - 923 - 923 - - - Prior Period Adjustment - - (178) - - - - -
Increase in net assets 3,540 9,839 2,289 (2,634) 6,006 7,205 (126) (840) Net assets -- January 1st 165,601 155,762 92,999 95,633 258,600 251,396 12,923 13,763 Net assets -- December 31st 169,141 165,601 95,288 92,999 264,607 258,600 12,797 12,923
Governmental Activities. The net assets increased $3.5 million in governmental activities. As seen in the graph of revenues by source for governmental activities the City’s main source of revenue is its taxes. This next chart compares program revenues and expenses for the individual governmental activities for the current year. As the chart reflects, most governmental activities relied on general revenues to support the function.
II-7

Expenses & Program Revenues - Governmental Activities(Expressed in Thousands)
-
5,000
10,000
15,000
20,000
25,000
Intere
st on
long
-term
debt
Urban r
edev
elopm
ent &
housin
g
Culture
& recre
ation
Health
and w
elfare
Sanita
iton
Highway
s & st
reets
Public
safet
y
Genera
l gove
rnmen
t
RevenuesExpenses
Revenues by Source - Governmental Activities
Unrestricted investment earnings
2%
Capital grants and contributions
10%
Grants and contributions not
restricted to specific programs
2%
Operating grants and contributions
12%
Charges for services16%
Other taxes2%
Excise Tax2%
COIT12%
Property taxes42%
II-8

Business-type Activities. As a result of a prior period adjustment, the 2005 beginning balance for business-type activities of the City net assets decreased by $177,585 as compared to business-type activities of the City net assets originally stated for 12/31/2004. See Note III-G on page II-43. During 2005, net assets for Business–type activities increased by $2.5 million (as compared to the restated beginning balance) to $95.3 million. Business–type activities represent 31 percent of the Primary Government’s revenues and 30 percent of the expenses. This chart compares program revenues to operating expenses by individual business-type activities for the current year.
Operating Expenses & Program Revenues - Business-type Activities(Expressed in Thousands)
-
2,000
4,000
6,000
8,000
10,000
12,000
14,000
16,000
Water Wastew ater
Expenses
Program Revenues
The following chart shows that almost 99 percent of revenues for business-type activities are generated by charges for services and capital grants and contributions.
Revenues by Source - Business-type Activities
Charges for services
99%
Unrestricted Investment Earnings
1%
II-9

Financial Analysis of the Government’s Funds As noted earlier, the City uses fund accounting to ensure and demonstrate compliance with finance-related legal requirements. Governmental funds. The City’s fund financial statements use modified accrual accounting providing information on near-term inflows, outflows, and balances of available resources. This provides the reader with useful information regarding the City’s financial position. The unreserved fund balance on the City’s governmental funds gives good insight into its ability to meet current obligations as well as meet the City’s ongoing service needs. At the end of 2005, the City’s governmental funds reported combined ending fund balances of $33.6 million, an increase of $.4 million in comparison with the prior year. Of that total, about $14.8 million (44 percent) is unreserved fund balance. The remaining $18.8 million (56 percent) is reserved for prior commitments. The reserved amount is for encumbrances ($3.9 million), non-current loans receivable ($4.5 million), debt service ($1.4 million), capital projects ($9 million), the permanent fund ($6,000) and assets held for resale ($78,000). The largest portion of the City’s governmental fund total is made up of the General Fund, the City’s chief operating fund. At the end of 2005, the General Fund had an unreserved fund balance of $3.1 million and a total fund balance of $4.1 million. As a measure of the General fund’s liquidity, you can compare the total fund balance and unreserved fund balance to the total fund expenditures. The General fund expenditures 2005 were $22.7 million. The General Fund also had other financing uses of $435,000. The total fund balance represents 18 percent of General Fund expenditures, while the unreserved fund balance is 14 percent of that same amount. According to the Budgetary Comparison Schedule (Non-GAAP) found on page III-1, General Fund expenditures exceeded revenues by $526,000 including operating transfers. The fund balance of the City’s General Fund increased $1 million from $3.1 million to $4.1 million (34 percent) during fiscal year ended 2005. Revenues exceeded expenditures by $1.5 million, and transfers out netted $434,717. Expenditure reductions established early in 2004, have resulted in the first increase to the General Fund balance since 2002. In addition to the General Fund, the City has three other funds that meet the major fund criteria: Parks, Streets and Roads, and Municipal Improvement. The combined fund balance at the end of 2005 for the other major funds is $4.4 million (Parks $765,000 and Streets and Roads $3.6 million, Municipal Improvement Fund $0) with the Non-major governmental funds having a combined fund balance of $25.2 million. The fund balance of the City’s other major funds decreased by $829,000 during fiscal year ended 2005, and the Non-major funds increased $173,000. Proprietary funds. The City’s proprietary funds use full accrual accounting to report information in their fund financial statements similar to the way things are reported in the government-wide financial statements. Net assets of the City’s major proprietary funds at the end of 2005 were $95.3 million. Of that amount $4.6 million is unrestricted. During 2005, net assets increased a total of $2.3 million. Net assets of the City’s non-major proprietary funds at the end of 2005 were $1.4 million. That total amount is considered unrestricted. This is a total decrease of $642,000.
II-10

General Fund Budgetary Highlights The original adopted budget for 2005 expenditures was $22.9 million, and the final amended budget was $22.9 million including additional appropriations and prior year encumbrances. The General Fund budget increased by $74,000 (or 0.3 percent). Actual expenditures were $850,000 lower than the final amended budget. The original adopted budget for 2005 revenues was $22.9 million, and no adjustments were made during the year. Actual revenues were $904,515 lower than the final amended budget. The General Fund revenue shortfall can be attributed to a late settlement from Monroe County for property taxes, county option income tax and Financial Institution tax. The total amount of taxes received in January of 2006 that would normally have been received in December of 2005 was $2,040,886. If the settlement had been received in December, the General Fund would have increased by $1.1 million (Non-GAAP). Capital Asset and Debt Administration Capital Assets. The City’s Primary Government’s capital assets as of December 31, 2005, equal $367.7 million (net of accumulated depreciation). Capital assets include land, infrastructure, buildings and improvements, machinery and equipment, construction in progress, and transportation equipment. The total increase in the City’s capital assets for the current fiscal year was $8.4 million or 2.3 percent (a 2.2 percent increase for governmental activities and a 2.4 percent increase for business-type activities). Governmental activities. Capital assets for the governmental activities total $278.5 million with an accumulated depreciation figure of $71.8 million for a net book value of $206.7 million. The amount includes $4.1 million in construction in progress reflecting capital projects in various stages of completion. During 2005, approximately $11.9 million was spent on capital projects. The City chose to report its infrastructure assets using the depreciation method. Business-type activities. Capital assets for business-type activities total $243.3 million and have a net book value of $160.9 million. The amount also includes $20.1 million in construction in progress reflecting capital projects in various stages of completion.
Primary Government Capital Assets, net of depreciation
(in thousands) Governmental Activities Business-type activities Total 2005 2004 2005 2004 2005 2004 Land $110,936 $106,359 $1,631 $1,624 $112,567 $107,982 Construction in progress 4,066 1,109 20,149 14,723 24,215 15,833 Buildings 30,851 30,635 20,702 31,483 51,553 62,119 Improvements other than buildings 10,036 10,655 111,071 101,635 121,107 112,290 Machinery and equipment 7,101 7,729 6,729 6,518 13,830 14,247 Infrastructure 43,724 45,701 - - 43,724 45,701 Utility plant acquisition adjustment - - 42 45 42 45 Transportation equipment - - 616 1,059 616 1,059
Total Net Capital Assets $206,714 $202,188 $160,940 $157,087 $367,654 $359,276
Additional information on the City’s capital assets can be found in Note III-C on pages II-31 through II-35 of this report.
II-11

Long-term debt. At the end of the current fiscal year, the City’s Primary Government had total bonded debt outstanding of $47.4 million. Of this amount, $16.7 million is considered to be general obligation bonds. The City is responsible to pay for this debt with general revenues. The remaining $30.6 million is revenue bonds that are paid for from the revenues earned by the business-type fund that is responsible for the debt.
Primary Government Long-term Debt
Governmental Activities Business-type activities Total 2005 2004 2005 2004 2005 2004 General obligation bonds $16,740,000 $17,375,000 $ - $ - $ 16,740,000 $ 17,375,000 Compensated absences payable 665,905 509,683 155,884 152,350 821,789 662,033 Revenue bonds payable - - 30,645,070 32,880,170 30,645,070 32,880,170 Notes and loans payable - - 44,753,257 35,614,989 44,753,257 35,614,989 Capital lease obligations 28,854,387 30,368,296 2,122,295 2,656,173 30,976,682 33,024,469 Net pension obligation 23,174,309 20,457,385 - - 23,174,309 20,457,385 Total $69,434,601 $68,710,364 $77,676,506 $71,303,682 $147,111,107 140,014,046
During 2005, the City’s total debt increased by $7.1 million. This net increase is due to increases in loans payable, a bond anticipation note, net pension obligation and compensated absences. The City of Bloomington currently maintains a AA- rating from Standard & Poor’s, AA from Fitch, and Aa3 from Moody’s. Additional information on the City’s long-term debt can be found in Notes III-E through III-F on pages II-36 through II-41 of this report. Economic Factors and 2006 Budgets and Rates
• The unemployment rate for the City is currently 5.1, which is up from a rate of 4.5 percent a year ago. This is below the state’s average unemployment rate of 5.4 percent, and is equal to the national average of 5.1 percent.
• The City’s prorated share of County Option Income Tax (COIT) dollars will increase due to an acceleration of COIT payments at the state level.
• The City does not anticipate a utility rate increase or significant property tax rate increase to be in effect during 2006.
These factors along with others were considered when preparing the City’s budget for the 2006 fiscal year. Request for Information This financial report is designed to provide a general overview of the City’s finances. Questions concerning any of the information provided in this report or requests for additional information should be directed to the City’s Controller’s Office, 401 N. Morton Street, Bloomington, Indiana, 47404.
II-12

Governmental Business-Type ComponentAssets Activities Activities Total Unit
Cash and cash equivalents 23,306,763$ 5,764,187$ 29,070,950$ 1,718,066$ Cash with fiscal agent 255,000 - 255,000 - Investments 3,644,820 - 3,644,820 - Receivables (net of allowances for uncollectibles):
Interest 58,564 1,665 60,229 6,504 Taxes 4,168,365 - 4,168,365 136,246 Accounts 1,500 701,798 703,298 9,235 Other 169,992 1,944 171,936 - Intergovernmental 1,576,239 - 1,576,239 27,043 Loans 4,586,355 - 4,586,355 - Internal balances 9,150 258,666 267,816 -
Land held for resale 77,650 - 77,650 - Inventories 231,348 620,128 851,476 347,051 Prepaid expense - - - 34,209 Restricted assets:
Cash with fiscal agent - 4,210,175 4,210,175 - Construction - 3,029,192 3,029,192 - Debt service reserve - 13,163 13,163 - Bond and Interest - - - - Capital improvement reserve - - - 1,154,356 Customer deposits - 8,250 8,250 - Deferred debit - 445,689 445,689 -
Capital assets:Land, improvements and construction in progress 115,002,135 21,820,871 136,823,006 - Other capital assets, net of depreciation 91,711,274 139,118,247 230,829,521 9,643,785
Total assets 244,799,155 175,993,975 420,793,130 13,076,495
Liabilities
Current liabilities:Accounts payable 1,777,793 438,833 2,216,626 119,573 Accrued payroll and withholdings payable 1,147,710 349,932 1,497,642 129,943 Compensated absences payable 172,766 52,678 225,444 - Internal balances 267,816 267,816 Taxes payable 31,610 31,610 Accrued interest payable 2,843,315 2,843,315 - Estimated unfiled claims 454,617 - 454,617 - Unearned revenue - 98,839 98,839 29,857 General obligation bonds payable 845,000 845,000 - Capital lease obligations 1,643,359 233,959 1,877,318 - Notes and loans payable - 6,368,646 6,368,646 - Payable from restricted assets:
Customer deposits - 35,750 35,750 - Accrued bond interest - 1,269,783 1,269,783 - Revenue bonds - due within one year - 1,690,000 1,690,000 -
Long term liabilities:General obligation bonds payable 15,895,000 - 15,895,000 - Advances for construction - 536,912 536,912 - Compensated absences payable 493,139 103,206 596,345 - Revenue bonds payable - 28,955,070 28,955,070 - Notes and loans payable - 38,384,608 38,384,608 - Capital lease obligations 27,211,028 1,888,336 29,099,364 - Net pension obligation 23,174,309 - 23,174,309 -
Total liabilities 75,658,036 80,705,978 156,364,014 279,373
Net assets
Invested in capital assets, net of related debt 161,119,022 83,418,499 244,537,521 9,643,785 Restricted for:
Debt service 1,366,554 4,223,338 5,589,892 - Other purposes - 3,029,192 3,029,192 -
Unrestricted 6,655,543 4,616,968 11,272,511 3,153,337
Total net assets 169,141,119$ 95,287,997$ 264,429,116$ 12,797,122$
Primary Government
The notes to the financial statements are an integral part of this statement.
CITY OF BLOOMINGTON, INDIANASTATEMENT OF NET ASSETS
December 31, 2005
II-13

CITY OF BLOOMINGTON, INDIANASTATEMENT OF ACTIVITIES
For the Year Ended December 31, 2005
Operating CapitalCharges for Grants and Grants and Governmental Business-Type Component
Functions/Programs Expenses Services Contributions Contributions Activities Activities Total Units
Primary government:Governmental activities:
General government 11,393,213 137,800 1,070 - (11,254,343) - (11,254,343) - Public safety 19,422,212 4,255,842 461,595 - (14,704,775) - (14,704,775) - Highways and streets 3,321,298 1,915 3,765,223 2,305,327 2,751,167 - 2,751,167 - Sanitation 1,765,785 1,118,605 - - (647,180) - (647,180) - Health and welfare 125,709 - 55,890 - (69,819) - (69,819) - Culture and recreation 5,755,557 2,575,385 296,037 30,000 (2,854,135) - (2,854,135) - Urban redevelopment and housin 4,976,897 233,561 1,651,033 2,830,000 (262,303) - (262,303) - Interest on long-term debt 3,002,086 - - - (3,002,086) - (3,002,086) -
- Total governmental activities 49,762,757 8,323,108 6,230,848 5,165,327 (30,043,474) - (30,043,474) -
Business-type activities:Water 8,627,643 9,565,989 - - - 938,346 938,346 Wastewater 13,143,478 13,490,254 - - - 346,776 346,776 -
Total business-type activities 21,771,121 23,056,243 - - - 1,285,122 1,285,122 -
Total primary government 71,533,878 31,379,351 6,230,848 5,165,327 (30,043,474) 1,285,122 (28,758,352) -
Component units:Bloomington Transit 5,711,832 1,062,151 1,929,448 1,328,432 - - - (1,391,801)
General revenues:Property taxes 22,913,870 - 22,913,870 811,983 County option income tax 6,596,392 - 6,596,392 250,717 Excise tax 1,022,385 - 1,022,385 52,856 Other taxes 1,093,341 - 1,093,341 11,583 Grants and contributions not restricted to specific programs 1,078,461 - 1,078,461 - Unrestricted investment earnings 879,090 257,738 1,136,828 86,132 Other - - - 95,527
Special and extraordinary items:Extraordinary gain (Note G ) - 923,410 923,410 -
Total general revenues, special items, and transfers 33,583,539 1,181,148 34,764,687 1,308,798
Change in net assets 3,540,065 2,466,270 6,006,335 (83,003)
Net assets - beginning, as originally reported 165,601,054 92,999,312 258,600,366 12,923,060 Change in accounting principle (Note G) - - - (42,935) Prior period adjustment (Note G) - (177,585) (177,585) -
Net assets - beginning, restated 165,601,054 92,821,727 258,422,781 12,880,125
Net assets - ending 169,141,119 95,287,997 264,429,116 12,797,122
Program Revenues Net (Expense) Revenue and Changes in Net AssetsPrimary Government
The notes to the financial statements are an integral part of this statement.
II-14

CITY OF BLOOMINGTON, INDIANABALANCE SHEET GOVERNMENTAL FUNDS
December 31, 2005
OtherMunicipal Governmental
Assets General Park Street & Road Improvement Funds Totals
Cash and cash equivalents 3,320,438$ 426,693$ 3,583,976$ -$ 14,895,524$ 22,226,631$ Cash with fiscal agent - - - - 255,000 255,000 Investments - - - - 3,644,820 3,644,820 Receivables (net of allowances for uncollectibles):
Interest 33,729 - - - 24,683 58,412 Taxes 1,583,187 532,204 - - 2,052,974 4,168,365 Accounts - - - - 1,500 1,500 Intergovernmental 1,113,149 94,033 233,269 - 135,788 1,576,239 Loans - - - - 4,586,355 4,586,355 Other 16,309 - - - 153,683 169,992
Interfund receivable 260,567 - - - - 260,567 Land held for resale - - - - 77,650 77,650
Total assets 6,327,379$ 1,052,930$ 3,817,245$ -$ 25,827,977$ 37,025,531$
Liabilities and fund balances
Liabilities:Accounts payable 611,326$ 60,045$ 126,778$ -$ 316,896$ 1,115,045$ Accrued payroll and withholdings payable 1,147,711 - - - - 1,147,711 Interfund payable 14,421 98,609 72,869 - 90,249 276,148 Deferred revenue - Unearned 460,396 129,114 - - 259,491 849,001
Total liabilities 2,233,854 287,768 199,647 - 666,636 3,387,905
Fund balances:Reserved for:
Encumbrances 1,022,243 368,754 1,120,427 - 1,395,128 3,906,552 Land held for resale - - - 77,650 77,650 Noncurrent loans receivable - - - - 4,502,151 4,502,151 Debt service funds - - - - 1,366,554 1,366,554 Capital projects funds - - - - 8,953,057 8,953,057 Permanent fund - - - - 5,870 5,870
Unreserved, reported in:General fund 3,071,282 - - - - 3,071,282 Special revenue funds - 396,408 2,497,171 - 8,844,786 11,738,365 Permanent funds - - - - 16,145 16,145
Total fund balances 4,093,525 765,162 3,617,598 - 25,161,341 33,637,626
Total liabilities and fund balances 6,327,379$ 1,052,930$ 3,817,245$ -$ 25,827,977$ 37,025,531$
The notes to the financial statements are an integral part of this statement.
II-15

CITY OF BLOOMINGTON, INDIANAReconciliation of the Balance Sheet to the Statement of Net Assets
Governmental Funds December 31, 2005
Total fund balances for governmental funds 33,637,626$
Amounts reported for governmental activities in the statement of net assets are different because:
Capital assets used in governmental activities (excluding internal service fund capital assets) are not financialresources and therefore, are not reported in the funds.Those assets consist of:
Land 110,936,206 Infrastructure, net of $43,210,395 accumulated depreciation 43,724,064 Construction in progress 4,065,929 Improvements other than buildings, net of $4,180,485 accumulated depreciation 10,035,842 Buildings, net of $13,812,894 accumulated depreciation 30,850,731 Machinery and equipment, net of $10,181,952 accumulated depreciation 7,055,503 Total capital assets 206,053,605
Internal services funds are used by the City to account for the financing of goods or services provided by onedepartment or agency to other City departments or agencies, generally on a cost reimbursement basis. Theassets and liabilities of the internal service funds are included in governmental activities in the statement of netassets. Internal service fund net assets are: 1,437,492
City collections and expenditures related to 2005 will be collected or expended beyond the 60 day period used torecord revenue and expenditures in the fund statements. Revenue and a corresponding receivable and expenditure and a corresponding payable for this amount are included in the government-wide statements. (574,135)
Property tax collections and state shared revenue appropriated during 2005 will be collected beyond the 60 day periodused to record revenue in the fund statements. Revenue and a corresponding receivable for the amount appropriatedbut not received by December 31, 2005 are included in the government-wide statements. 849,001
Long-term liabilities applicable to the City's governmental activities are not due and payable in the current periodand therefore, are not reported in the funds. Interest on long-term debt is not accrued in governmental funds, but rather is recognized as an expenditure when due. All liabilities, both current and long-term, are reported in the statement of net assets. Also, during the year the City entered into new capital leases. Balances at December 31, 2005 are: Bonds payable 16,740,000 Bond interest payable 769,704 Leases payable 28,854,387 Lease interest payable 2,073,611 Compensated absences payable 650,459 Total long-term liabilities (49,088,161)
Net pension obligations, including the 1925 Police Officers' Pension Plan and the 1937 Firefighters' PensionPlan are not due and payable in the current period and therefore, are not reported in the funds, but are includedin the government-wide statements. (23,174,309)
Total net assets of governmental activities 169,141,119$
The notes to the financial statements are an integral part of this statement.
II-16
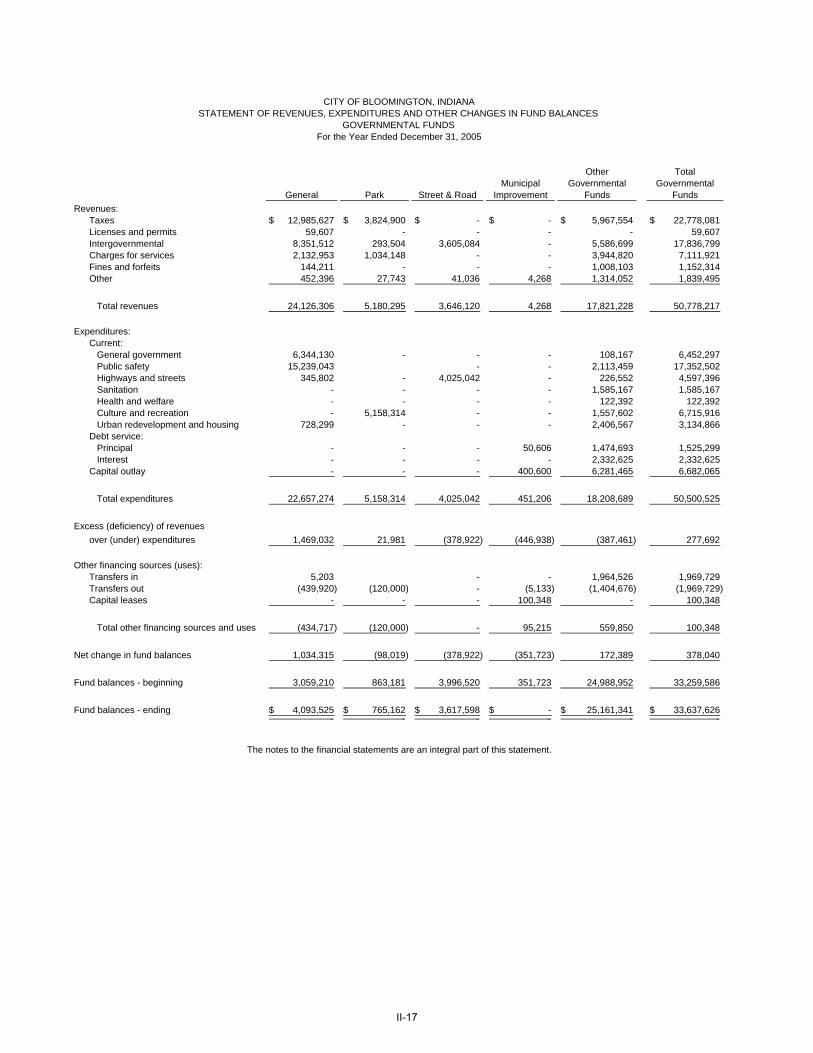
CITY OF BLOOMINGTON, INDIANASTATEMENT OF REVENUES, EXPENDITURES AND OTHER CHANGES IN FUND BALANCES
GOVERNMENTAL FUNDSFor the Year Ended December 31, 2005
Other TotalMunicipal Governmental Governmental
General Park Street & Road Improvement Funds FundsRevenues:
Taxes 12,985,627$ 3,824,900$ -$ -$ 5,967,554$ 22,778,081$ Licenses and permits 59,607 - - - - 59,607 Intergovernmental 8,351,512 293,504 3,605,084 - 5,586,699 17,836,799 Charges for services 2,132,953 1,034,148 - - 3,944,820 7,111,921 Fines and forfeits 144,211 - - - 1,008,103 1,152,314 Other 452,396 27,743 41,036 4,268 1,314,052 1,839,495
Total revenues 24,126,306 5,180,295 3,646,120 4,268 17,821,228 50,778,217
Expenditures:Current:
General government 6,344,130 - - - 108,167 6,452,297 Public safety 15,239,043 - - 2,113,459 17,352,502 Highways and streets 345,802 - 4,025,042 - 226,552 4,597,396 Sanitation - - - - 1,585,167 1,585,167 Health and welfare - - - - 122,392 122,392 Culture and recreation - 5,158,314 - - 1,557,602 6,715,916 Urban redevelopment and housing 728,299 - - - 2,406,567 3,134,866
Debt service:Principal - - - 50,606 1,474,693 1,525,299 Interest - - - - 2,332,625 2,332,625
Capital outlay - - - 400,600 6,281,465 6,682,065
Total expenditures 22,657,274 5,158,314 4,025,042 451,206 18,208,689 50,500,525
Excess (deficiency) of revenuesover (under) expenditures 1,469,032 21,981 (378,922) (446,938) (387,461) 277,692
Other financing sources (uses):Transfers in 5,203 - - 1,964,526 1,969,729 Transfers out (439,920) (120,000) - (5,133) (1,404,676) (1,969,729) Capital leases - - - 100,348 - 100,348
Total other financing sources and uses (434,717) (120,000) - 95,215 559,850 100,348
Net change in fund balances 1,034,315 (98,019) (378,922) (351,723) 172,389 378,040
Fund balances - beginning 3,059,210 863,181 3,996,520 351,723 24,988,952 33,259,586
Fund balances - ending 4,093,525$ 765,162$ 3,617,598$ -$ 25,161,341$ 33,637,626$
The notes to the financial statements are an integral part of this statement.
II-17

Amounts reported for governmental activities in the statement of activities are different because:
Net change in fund balances - total governmental funds (Statement of Revenues, Expenditures and Changes in Fund Balances). 378,040$
Governmental funds report capital outlays as expenditures. However, in the statement of activitiesthe cost of those assets is allocated over their estimated useful lives and reported as depreciation expense:
Capital outlay 9,533,302 Depreciation Expense (7,301,582)
Donations of capital assets increase net assets in the statement of activities, but do not appear in the governmental funds because they are not financial resources. 2,330,539
The increases in net pension obligations for the 1925 Police Officers' Pension Plan, the 1937 Firefighters' Pension Plan and the Public Employees' Retirement Fund, reported as expenses in the statement of activities, do not require the use of current financial resources and, therefore, are not reported as expenditures in the governmental funds (2,716,924)
Revenues in the statement of activities that do not provide current financial resources are not reported as revenues in the funds, and some expenses reported in the statement of activities do not require the use of current financial resources and, therefore, are not reported as expenditures in governmental funds. (190,295)
The issuance of long-term debt (e.g., bonds, leases) provides current financial resources to govern- mental funds, while the repayment of the principal of long-term debt consumes the current financial resources of governmental funds. Neither transaction, however, has any effect on net assets. Also, governmental funds report the effect of issuance costs, premiums, discounts and similar items when debt is first issued, whereas these amounts are deferred and amortized in the statement of activities. This amount is the net effect of these differences in the treatment of long-term debt and related items.
2,148,909
Internal service funds are used by management to charge the costs of certain activities toindividual funds. The net revenue (expense) of the internal service funds is reported withgovernmental activities. (641,924)
Change in net assets of governmental activities (statement of activities) 3,540,065$ 3,540,065
-
For the Year Ended December 31, 2005
The notes to the financial statements are an integral part of this statement.
CITY OF BLOOMINGTON, INDIANARECONCILIATION OF THE STATEMENT OF REVENUES,
EXPENDITURES AND CHANGES IN FUND BALANCES OF GOVERNMENTAL FUNDSTO THE STATEMENT OF ACTIVITIES
II-18

GovernmentalActivities -
Water Wastewater InternalUtility Utility Total Service Funds
AssetsCurrent assets:
Cash and cash equivalents 1,671,147$ 4,093,040$ 5,764,187$ 1,080,132$ Interest receivable 858 807 1,665 152 Accounts receivable (net of allowance) 175,532 526,266 701,798 - Other receivable 972 972 1,944 - Interfund receivables:
Interfund loans 118,297 140,369 258,666 - Interfund services provided and used - - - 44,121
Inventories 620,128 - 620,128 231,348
Total current assets 2,586,934 4,761,454 7,348,388 1,355,753
Noncurrent assets:Restricted cash and cash equivalents:
Cash with fiscal agent 1,185,840 3,024,335 4,210,175 - Construction cash and cash equivalents 2,566,331 462,861 3,029,192 - Debt Service Reserve 6,150 7,013 13,163 - Customer deposits 8,250 - 8,250 -
Total restricted assets: 3,766,571 3,494,209 7,260,780 -
Deferred charges 100,747 344,942 445,689 -
Capital assets: Land, improvements to land and construction in progress 14,166,428 7,654,443 21,820,871 - Other capital assets (net of accumulated depreciatio 52,109,029 87,009,218 139,118,247 659,805
Total capital assets 66,275,457 94,663,661 160,939,118 659,805
Total noncurrent assets 70,142,775 98,502,812 168,645,587 659,805
Total assets 72,729,709 103,264,266 175,993,975 2,015,558
Liabilities
Current liabilities:Accounts payable 213,956 224,877 438,833 88,613 Accrued payroll and withholdings 126,062 223,870 349,932 - Taxes payable 31,610 - 31,610 - Estimated Unfiled Claims - - - 454,617 Interfund payables: Interfund loans 140,369 118,297 258,666 - Interfund services provided and used 3,660 5,490 9,150 19,390 Compensated absences payable-long term - - - 9,091 Compensated absences payable-short term 17,786 34,892 52,678 6,355 Capital lease payable 14,106 219,853 233,959 - Notes and loans payable 2,982,306 3,386,340 6,368,646 - Unearned revenue - 98,839 98,839 - Current liabilities payable from restricted assets:
Customer deposits 8,250 27,500 35,750 - Revenue bonds payable 965,000 725,000 1,690,000 - Accrued interest payable 475,840 793,943 1,269,783 -
Total current liabilities 4,978,945 5,858,901 10,837,846 578,066
Noncurrent liabilities:Revenue bonds payable (net of unamortized discounts and
premium and deferral of loss on refunding) 6,676,024 22,279,046 28,955,070 - Notes and loans payable 21,963,578 16,421,030 38,384,608 - Capital leases payable 93,247 1,795,089 1,888,336 - Compensated absences payable 34,421 68,785 103,206 - Advances for Construction 536,912 - 536,912 -
Total noncurrent liabilities 29,304,182 40,563,950 69,868,132 -
Total liabilities 34,283,127 46,422,851 80,705,978 578,066
Net assets
Invested in capital assets, net of related debt 33,581,196 49,837,303 83,418,499 - Restricted for:
Construction 2,566,331 462,861 3,029,192 - Debt Service 1,191,990 3,031,348 4,223,338 -
Unrestricted 1,107,065 3,509,903 4,616,968 1,437,492
Total net assets 38,446,582$ 56,841,415$ 95,287,997$ 1,437,492$
The notes to the financial statements are an integral part of this statement.
Business-Type Activities - Enterprise Funds
CITY OF BLOOMINGTON, INDIANASTATEMENT OF NET ASSETS
PROPRIETARY FUNDSDecember 31, 2005
II-19

Water Wastewater InternalUtility Utility Total Service Funds
Operating Revenues:Customer revenue 8,424,666$ 11,226,014$ 19,650,680$ 7,110,661$ Fire protection revenue 710,916 - 710,916 - Storm revenue - 1,301,932 1,301,932 - Tap fees - 713,822 713,822 - Other 244,055 224,286 468,341 7,601
Total operating revenues 9,379,637 13,466,054 22,845,691 7,118,262
Operating expenses:Administrative and general expense:
Salaries and wages 711,116 1,043,891 1,755,007 596,088 Employee pensions and benefits 511,692 730,324 1,242,016 5,177,093 Insurance 186,257 264,704 450,961 - Maintenance 137,266 205,030 342,296 - General office and miscellaneous expense 69,620 170,215 239,835 330,457 Materials and supplies - 7,061 7,061 1,070,370 Utilities 31,270 46,900 78,170 - Taxes 257,782 283,447 541,229 - Depreciation 1,552,861 2,804,586 4,357,447 37,169 Other services 695,323 797,303 1,492,626 602,498 Stormwater - 575,624 575,624 -
Source of supply and expense/collection system expense:operations and maintenance 846,126 992,660 1,838,786 -
Transmission and distribution/pumping expense:operations and maintenance 1,340,856 317,879 1,658,735 -
Treatment and disposal expense - operations and maintenance:Salaries and wages 552,786 1,404,132 1,956,918 - Operation expense 189,082 688,919 878,001 - Maintenance 81,045 289,204 370,249 - Treatment PCB - 49,631 49,631 - Sludge removal expense - 52,011 52,011 - Chemicals 245,049 125,998 371,047 -
Customer accounts expense 199,283 537,403 736,686 -
Total operating expenses 7,607,414 11,386,922 18,994,336 7,813,675
Operating income (loss) 1,772,223 2,079,132 3,851,355 (695,413)
Nonoperating revenues (expenses):Interest and investment revenue 102,952 154,786 257,738 51,963 Miscellaneous revenue 186,352 24,200 210,552 - Gain / loss on the sale of assets (45,853) - (45,853) 1,526 Amortization of bond issue costs (7,195) (17,501) (24,696) - Interest expense (967,181) (1,737,345) (2,704,526) - Miscellaneous expense - (1,710) (1,710) -
Total nonoperating revenue (expenses) (730,925) (1,577,570) (2,308,495) 53,489
Income (loss) before contributions, transfers, special items 1,041,298 501,562 1,542,860 (641,924)
Extraordinary gain (Note G) 461,705 461,705 923,410 -
Change in net assets 1,503,003 963,267 2,466,270 (641,924)
Net assets - beginning, as originally reported 36,943,579 56,055,733 92,999,312 2,079,416 Prior period adjustment (Note G) - (177,585) (177,585) -
Net assets - beginning, restated 36,943,579 55,878,148 92,821,727 2,079,416
Total net assets - ending 38,446,582 56,841,415 95,287,997 1,437,492
The notes to the financial statements are an integral part of this statement.
Enterprise Funds
CITY OF BLOOMINGTON, INDIANASTATEMENT OF REVENUES, EXPENSES AND OTHER CHANGES IN FUND NET ASSETS
PROPRIETARY FUNDSFor the Year Ended December 31, 2005
II-20

Water Wastewater InternalUtility Utility Total Service Funds
Cash flows from operating activities:Receipts from customers and users 9,145,666$ 11,974,572$ 21,120,238$ 7,105,217$ Payments to suppliers (3,141,099) (4,767,745) (7,908,844) (7,054,277) Payments to employees (2,435,814) (3,842,510) (6,278,324) (592,295) Other receipts and payments (545,493) 44,404 (501,089) - Payments for interfund services used 239,959 1,525,532 1,765,491 -
Net cash provided (used) by operating activities 3,263,219 4,934,253 8,197,472 (541,355)
Cash flows from noncapital financing activities: Other income and expense 186,352 24,200 210,552 -
Extraordinary gain (Insurance claim proceeds) 461,705 461,705 923,410 -
Net cash provided by noncapitalfinancing activities 648,057 485,905 1,133,962 -
Cash flows from capital and related financing activities:Proceeds from capital debt 2,500,000 198,182 2,698,182 - Acquisition and construction of capital assets (863,570) (851,265) (1,714,835) - Principal paid on capital debt (1,173,504) (1,816,623) (2,990,127) - Interest paid on capital debt (594,797) (1,447,579) (2,042,376) - Proceeds from sales of capital assets - - - 1,526
Net cash used by capital andrelated financing activities (131,871) (3,917,285) (4,049,156) 1,526
Cash flows from investing activities:Interest received 102,122 154,786 256,908 52,927
Net cash provided (used) by investing activities 102,122 154,786 256,908 52,927
Net increase (decrease) in cash and cash equivalents 3,881,527 1,657,659 5,539,186 (486,902)
Cash and cash equivalents, January 1 (Including $622,985 and $3,463,905 for the water and wastewater utility, respectively, reported in restricted accounts) 1,556,191 5,929,590 7,485,781 1,567,034
Cash and cash equivalents, December 31(Including $3,776,571 and $3,494,209 for the water and wastewater utility, respectively, reported in restricted accounts) 5,437,718 7,587,249 13,024,967 1,080,132
Reconciliation of operating income to net cashprovided (used) by operating activities:
Operating income 1,772,223 2,079,132 3,851,355 (695,413)
Adjustments to reconcile operating income tonet cash provided (used) by operating activities:
Depreciation expense 1,552,861 2,804,585 4,357,446 37,169 Change in assets and liabilities:
Accounts receivable 1,834 (2,639) (805) - Interest Receivable - (686) (686) - Interfund receivables - - - (13,045) Due from other funds (44,598) (832) (45,430) - Allowance for uncollectible accounts - - - - Inventories (46,583) - (46,583) 97,498
Change in liabilities:Customer deposits 8,250 19,000 27,250 Accounts payable 30,029 (15,572) 14,457 (61,153) Accrued payroll and withholdings (2,898) 6,915 4,017 - Employee benefits payable (3,872) (23,985) (27,857) - Taxes payable 2,401 - 2,401 - Compensated absence payable (1,188) 4,723 3,535 7,724 Interfund payables 426 639 1,065 (1,544) Due to other funds 831 44,597 45,428 - Deferred revenue - 18,376 18,376 - Customer advances for construction (6,497) - (6,497) - Estimated unfiled claims - - - 87,409
Total adjustments 1,490,996 2,855,121 4,346,117 154,058
Net cash provided by operating activities 3,263,219 4,934,253 8,197,472 (541,355)
The notes to the financial statements are an integral part of this statement.
Enterprise Funds
CITY OF BLOOMINGTON, INDIANASTATEMENT OF CASH FLOWS
PROPRIETARY FUNDSFor the Year Ended December 31, 2005
II-21
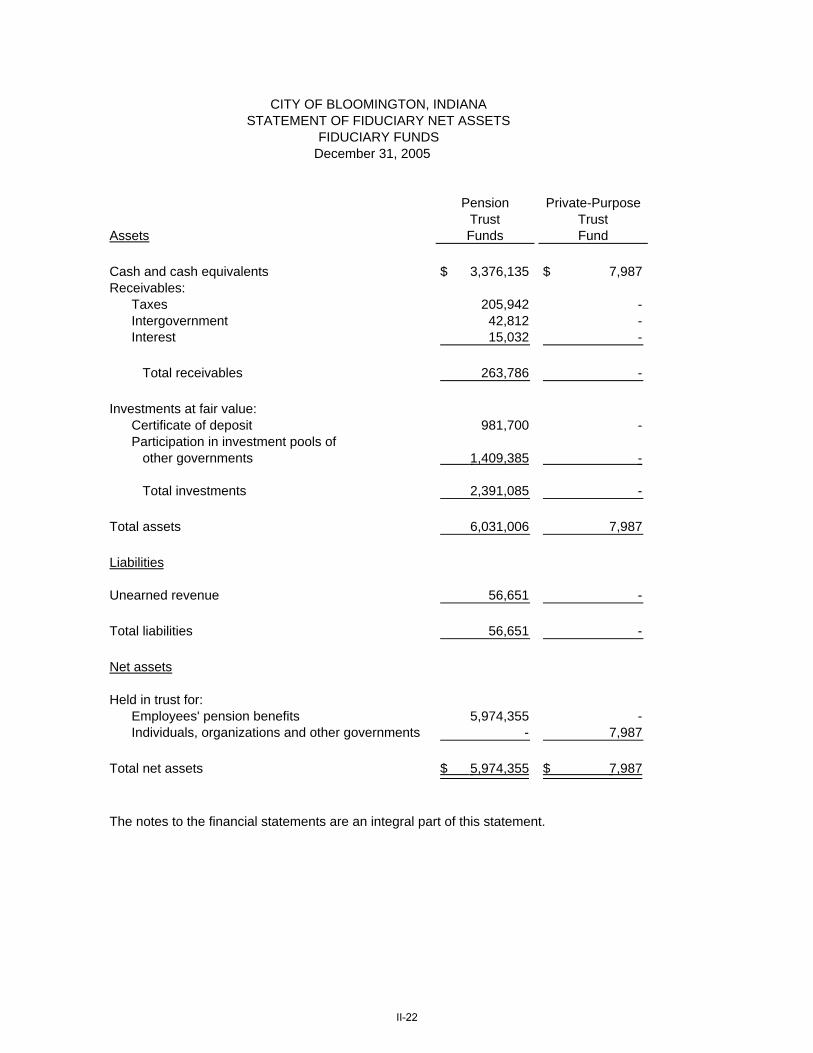
December 31, 2005
Pension Private-PurposeTrust Trust
Assets Funds Fund
Cash and cash equivalents 3,376,135$ 7,987$ Receivables:
Taxes 205,942 - Intergovernment 42,812 - Interest 15,032 -
Total receivables 263,786 -
Investments at fair value:Certificate of deposit 981,700 - Participation in investment pools of
other governments 1,409,385 -
Total investments 2,391,085 -
Total assets 6,031,006 7,987
Liabilities
Unearned revenue 56,651 -
Total liabilities 56,651 -
Net assets
Held in trust for:Employees' pension benefits 5,974,355 - Individuals, organizations and other governments - 7,987
Total net assets 5,974,355$ 7,987$
The notes to the financial statements are an integral part of this statement.
CITY OF BLOOMINGTON, INDIANASTATEMENT OF FIDUCIARY NET ASSETS
FIDUCIARY FUNDS
II-22

CITY OF BLOOMINGTON, INDIANA
For the Year Ended December 31, 2005
Pension Private-PurposeTrust TrustFunds Fund
Additions
Contributions:Employer contributions made by city 1,875,022$ -$ Employer contributions made by state 1,371,762 - Plan members 12,067 - Other contributions 1,810 -
Total contributions 3,260,661 -
Investment income:Interest 166,678 197
Total investment income 166,678 197
Total additions 3,427,339 197
Deductions
Benefits 2,673,720 - Administrative expense 56,939 -
Total deductions 2,730,659 -
Changes in net assets 696,680 197
Net assets - beginning 5,277,675 7,790
Net assets - ending 5,974,355$ 7,987$
The notes to the financial statements are an integral part of this statement.
STATEMENT OF CHANGES IN FIDUCIARY NET ASSETSFIDUCIARY FUNDS
II-23

CITY OF BLOOMINGTON NOTES TO FINANCIAL STATEMENTS
I. Summary of Significant Accounting Policies A. Reporting Entity
The City of Bloomington (City) was established under the laws of the State of Indiana. The primary government operates under a Council-Mayor form of government and provides the following services: public safety (police and fire), highways and streets, health, welfare and social services, culture and recreation, public improvements, planning and zoning, general administrative services, water, sewer, and urban redevelopment and housing, and sanitation. The accompanying financial statements present the activities of the city and its significant component unit. The component unit discussed below is included in the city's reporting entity because of the significance of their operational or financial relationships with the city. Discretely presented component units are involved in activities of an operational nature independent from the government; their transactions are reported in a separate column in the government-wide financial statements to emphasize that it is legally separate from the government. Discretely Presented Component Unit The Public Transportation Corporation (Transit) is a significant discretely presented component unit of the city. The city appoints a voting majority of Transit's board and a financial benefit/burden relationship exists between the city and Transit. Transit is a significant discretely presented component unit of the city. Transit is fiscally dependent on the city. It would be misleading to exclude Transit form the city's financial statements because of its relationship with the city. Complete financial statements of the individual component unit may be obtained from its administrative office: Bloomington Public Transportation Corporation 130 West Grimes Lane Bloomington, Indiana 47401
B. Government-Wide and Fund Financial Statements Government-wide financial statements (i.e., the statement of net assets and the statement of changes in net assets) report information on all of the nonfiduciary activities of the city. For the most part, the effect of interfund activity has been removed from these statements. Governmental activities, which normally are supported by taxes and intergovernmental revenues, are reported separately from business-type activities, which rely to a significant extent on fees and charges for support. Likewise, the city is reported separately from certain legally separate component units for which the city is financially accountable. The statement of activities demonstrates the degree to which direct expenses of a given function or segments are offset by program revenues. Direct expenses are clearly identifiable with a specific function or segment. Program revenues include (1) charges to customers or applicants who purchase, use or directly benefit from goods, services or privileges provided by a given function or segment and (2) grants and contributions that are restricted to meeting the operational or capital requirements of a particular function or segment. Taxes and other items not properly included among program revenues are reported instead as general revenues. Separate financial statements are provided for governmental funds, proprietary funds and fiduciary funds, even though the latter are excluded from the government-wide financial statements. Major
II-24

individual governmental funds and major individual enterprise funds are reported as separate columns in the fund financial statements.
C. Measurement Focus, Basis of Accounting and Financial Statement Presentation The government-wide financial statements are reported using the economic resources measurement focus and the accrual basis of accounting as are the proprietary fund and fiduciary fund financial statements. Revenues are recorded when earned and expenses are recorded when a liability is incurred, regardless of the timing of the related cash flows. Property taxes are recognized in the year for which they are levied. Grants and similar items are recognized as revenue as soon as all eligibility requirements imposed by the provider have been met. Governmental fund financial statements are reported using the current financial resources measurement focus and the modified accrual basis of accounting. Revenues are recognized as soon as they are both measurable and available. Revenues are considered to be available when they are collectible within the current period or soon enough thereafter to pay liabilities of the current period. For this purpose, the city considers revenues to be available if they are collected within sixty days of the end of the current fiscal period. Expenditures generally are recorded when a liability is incurred, as under accrual accounting. However, debt service expenditures, as well as expenditures related to compensated absences, claims and judgments, are recorded only when payment is due. Property taxes, franchise taxes, licenses and interest associated with the current fiscal period are all considered to be susceptible to accrual and have been recognized as revenues of the current fiscal period. All other revenue items are considered to be measurable and available only when the city receives cash. The city reports the following major governmental funds:
The General Fund is the primary operating fund. It accounts for all financial resources of the general government, except those required to be accounted for in another fund. The Street and Road Fund (special revenue) accounts for the financial resources and expenses for construction, operation and maintenance of local and arterial road and street systems. The Motor Vehicle Highway and Local Road and Street Funds have been combined to form the Street and Road Fund. The Park Fund (special revenue) accounts for the financial resources and expenses for the construction, operation and maintenance of the City's park system. The Municipal Improvement Fund (Capital Projects) accounts for assets acquired by capital leases.
The city reports the following major proprietary funds:
The Water Utility Fund accounts for the operation of the city’s water distribution system. The Wastewater Utility Fund accounts for the operation of the city’s wastewater treatment plant, pumping stations and collection systems.
Additionally, the city reports the following fund types:
The internal service funds account for Worker's Compensation, Fleet Maintenance, and Health Insurance Trust services provided to other departments on a cost-reimbursement basis. The pension trust funds account for the activities of the 1925 police and 1937 fire pension funds which accumulate resources for pension benefit payments. The private-purpose trust fund reports a trust arrangement under which principal and income are to be used for sidewalks and improvements in the year 2076.
II-25

Private-sector standards of accounting and financial reporting issued prior to December 1, 1989, generally are followed in both the government-wide and proprietary fund financial statements to the extent that those standards do not conflict with or contradict guidance of the Governmental Accounting Standards Board. Governments also have the option of following subsequent private-sector guidance for their business-type activities and enterprise funds, subject to this same limitation. The city has elected not to follow subsequent private-sector guidance. As a general rule, the effect of interfund activity has been eliminated from the government-wide financial statements. Exceptions to this general rule are payments-in-lieu of taxes and other charges between the water, wastewater, and various other functions of the government. Elimination of these charges would distort the direct costs and program revenues reported for the various functions concerned. Amounts reported as program revenues include (1) charges to customers or applicants for goods, services or privileges provided, (2) operating grants and contributions, and (3) capital grants and contributions. Internally dedicated resources are reported as general revenues rather than as program revenues. Likewise, general revenues include all taxes. Proprietary funds distinguish operating revenues from nonoperating items. Operating revenues and expenses generally result from providing services and producing and delivering goods in connection with a proprietary fund’s principal ongoing operations. The principal operating revenues of the enterprise funds are charges to customers for sales and services. Operating expenses for enterprise funds and internal service funds include the cost of sales and services, administrative expenses, and depreciation on capital assets. All revenues and expenses not meeting this definition are reported as nonoperating revenues and expenses. When both restricted and unrestricted resources are available for use, it is the city’s policy to use restricted resources first, then unrestricted resources as they are needed.
D. Assets, Liabilities and Net Assets or Equity
1. Deposits and Investments The city’s cash and cash equivalents are considered to be cash on hand, demand deposits and short-term investments with original maturities of three months or less from the date of acquisition. State statute (IC 5-13-9) authorizes the City to invest in securities, including but not limited to, federal government securities, repurchase agreements, and certain money market mutual funds. Certain other statutory restrictions apply to all investments made by local governmental units, including the authorization to invest local pension funds in an external investment pool administered by the state public employee retirement system. Nonparticipating interest bearing investment contracts, certificates of deposit, demand deposits and similar nonparticipating negotiable instruments that are not reported as cash and cash equivalents are reported as investments at cost. The investments of the City consisted of amounts invested with an external investment pool reported at fair value and nonparticipating interest earning investment contracts reported at cost. The investments of Transit consisted entirely of nonparticipating interest earning investment contracts and are reported at cost. Investment income, including changes in the fair value of investments, is reported as revenue in the operating statement. The City has invested $1,409,385 in an external investment pool administered by the Public Employees' Retirement Fund Board of Trustees in accordance with IC 5-11-10.3-4.7. The fair value of the position in the pool is the same as the value of the pool shares. There is no regulatory oversight of the pool.
II-26

2. Interfund Transactions and Balances
Activity between funds that are representative of lending/borrowing arrangements outstanding at the end of the fiscal year are referred to as “interfund receivables/payables (i.e., the current and non-current portion of interfund loans). All other outstanding balances between funds are reported as “interfund services provided/used.” Any residual balances outstanding between the governmental activities and business-type activities are reported in the government-wide financial statements as “internal balances.”
3. Property Taxes
Property taxes levied are collected by the County Treasurer and are distributed to the city in June and in December. State statutes (IC 6-1.1-17-16) require the Department of Local Government Finance to establish property tax rates and levies by February 15. These rates were based upon the preceding year's March 1 (lien date) assessed valuations adjusted for various tax credits. Taxable property is assessed at 100% of the true tax value (determined in accordance with rules and regulations adopted by the Department of Local Government Finance). Taxes may be paid in two equal installments that become delinquent if not paid by May 10 and November 10, respectively. Delinquent property taxes outstanding at year end for governmental and/or proprietary funds, net of allowances for uncollectible accounts, are recorded as a receivable with an offset to deferred revenue since the amounts are not considered available.
4. Inventories and Prepaid Items All inventories are valued at cost using the first in/first out (FIFO) method, and consist of maintenance supplies and replacement parts held for consumption. Inventories of governmental funds are recorded as expenditures when consumed rather than when purchased. Inventories for Transit consist of materials and supplies for repair and maintenance and are recorded using the average cost method. Certain payments to vendors reflect costs applicable to future accounting periods and are recorded as prepaid items in both government-wide and fund financial statements.
5. Restricted Assets Certain proceeds of the enterprise fund revenue bonds, as well as certain resources set aside for their repayment, are classified as restricted assets on the statement of net assets balance sheet because they are maintained separately and their use is limited by ordinance or applicable bond covenants.
6. Capital Assets Capital assets, which include property, plant, equipment and infrastructure assets (e.g., roads, bridges, sidewalks and similar items), are reported in the applicable governmental or business-type activities column in the government-wide financial statements. The city's retroactive infrastructure has been included in the capital assets beginning balance. Capital assets are reported at actual or estimated historical cost based on appraisals or deflated current replacement cost. Contributed or donated assets are reported at estimated fair value at the time received. Capitalization thresholds (the dollar values above which asset acquisitions are added to the capital asset accounts), depreciation methods and estimated useful lives of capital assets reported in the government-wide statements and proprietary funds are as follows:
II-27

Capitalization
Threshold
Depreciation
Method
EstimatedUseful
Life Governmental Activities: Buildings $ 10,000 Straight-line 50 Improvements 10,000 Straight-line 10-25 Equipment 10,000 Straight-line 2 to 15 Infrastructure 10,000 Straight-line 5 to 50 Business-type Activities – Utilities Buildings 5,000 Straight-line 40 to 60 Improvements 5,000 Straight-line 10 to 80 Equipment 5,000 Straight-line 5 to 30 Component Unit – Transit Buildings 10,000 Straight-line 50 Improvements 10,000 Straight-line 10-25 Equipment 10,000 Straight-line 2 to15 For depreciated assets, the cost of normal maintenance and repairs that do not add to the value of the asset or materially extend asset lives are not capitalized. Major outlays for capital assets and improvements are capitalized as projects are constructed. Interest incurred during the construction phase of capital assets of business-type activities is included as part of the capitalized value of the assets constructed.
7. Compensated Absences
Paid time off (PTO) is earned by part and full-time employees based on the number of years employed and ranges from seven days to twenty-two days per year. PTO leave may be used for any purpose. PTO leave must be used within the calendar year earned unless otherwise requested by the employee's department head. PTO leave carried forward, due to these special requests, which is expected to be liquidated with expendable available financial resources, is reported as an expenditure and a fund liability of the governmental fund that will pay it. Amounts not expected to be liquidated with expendable available financial resources are reported as a long-term liability. PTO leave not carried forward is converted to sick leave for employees not covered under a collective bargaining agreement. The employees under the agreement earn sick leave at the rate of one day per full-time equivalent month worked. The accumulation of sick leave is unlimited, but any unused balance is not paid to employees upon separation from employment. No liability is reported for unpaid accumulated sick leave.
8. Long-Term Obligations In the government-wide financial statements and proprietary fund types in the fund financial statements, long-term debt and other long-term obligations are reported as liabilities in the applicable governmental activities, business-type activities or proprietary fund type statement of net assets. Bond premiums and discounts, as well as issuance costs, are deferred and amortized over the life of the bonds using the straight-line method. Bonds payable are reported net of the applicable bond premium or discount. Bond issuance costs are reported as deferred charges and amortized over the term of the related debt. In the fund financial statements, governmental fund types recognize bond premiums and discounts, as well as bond issuance costs, during the current period. The face amount of debt issued is reported as other financing sources. Premiums received on debt issuance are reported as other financing sources while discounts on debt issuances are reported as other financing uses. Issuance costs, whether or not withheld from actual debt proceeds received, are reported as debt service expenditures.
II-28

9. Fund Equity
In the fund financial statements, governmental funds report reservations of fund balance for amounts that are not available for appropriation or are legally restricted by outside parties for use for a specific purpose. Designations of fund balance represent tentative management plans that are subject to change.
II. Stewardship, Compliance and Accountability A. Budgetary Information
Annual budgets are adopted on the cash basis which is not consistent with accounting principles generally accepted in the United States. All annual appropriations lapse at fiscal year end. On or before August 31, the City Controller submits to the Common Council a proposed operating budget for the year commencing the following January 1. Prior to adoption, the budget is advertised and public hearings are conducted by the Common Council to obtain taxpayer comments. In September of each year, the Common Council through the passage of an ordinance approves the budget for the next year. Copies of the budget ordinance and the advertisement for funds for which property taxes are levied or highway use taxes are received are sent to the Department of Local Government Finance. The budget becomes legally enacted after the City Controller receives approval of the Department of Local Government Finance. The city’s management cannot transfer budgeted appropriations between object classifications of a budget without approval of the Common Council. The Department of Local Government Finance must approve any revisions to the appropriations for any fund or any department of the General Fund. The legal level of budgetary control is by object and department within the fund for the General Fund and by object within the fund for all other budgeted funds.
III. Detailed Notes on All Funds
A. Deposits
Custodial credit risk is the risk that in the event of a bank failure, the City's deposits may not be returned to it. Indiana Code 5-13-8-1 allows a political subdivision of the State of Indiana to deposit public funds in a financial institution only if the financial institution is a depository eligible to receive state funds; and has a principal office or branch that qualifies to receive public funds of the political subdivision. The bank balances were insured by the Federal Deposit Insurance Corporation or the public Deposit Insurance Fund, which covers all public funds held in approved depositories.
B. Investments
Authorization for investment activity is stated in Indiana Code 5-13. As of December 31, 2005, the City had the following investments.
II-29

Investment Policies Indiana Code 5-13-9 authorizes the City to invest in securities backed by the full faith and credit of the United States Treasury or fully guaranteed by the United States of America and issued by the United States Treasury, a federal agency, a federal instrumentality, or a federal government sponsored enterprise. Indiana Code also authorizes the unit to invest in securities fully guaranteed and issued by a federal agency, a federal instrumentality or a federal government sponsored enterprise. These investments are required by statute to have a stated final maturity of not more than two years. Indiana Code also provides for investment in money market mutual funds that are in the form of securities of or interest in an open-end, no-load, management-type investment company or investment trust registered under the provision of the federal Investment Company Act of 1940, as amended. Investments in money market mutual funds may not exceed fifty percent (50%) of the funds held by the City and available for investment. The portfolio of an investment company or investment trust used must be limited to direct obligations of the United States of America, obligations issued by a federal agency, a federal instrumentality, or a federal government sponsored enterprise; or repurchase agreements fully collateralized by direct obligations of the United States of America or obligations issued by a federal agency, a federal instrumentality, or a federal government sponsored enterprise. The form of securities of or interest in an investment company or investment trust must be rated as AAA, or its equivalent by Standard and Poor's Corporation or its successor or Aaa, or its equivalent, by Moody's Investors Service, Inc., or its successor. The form of securities in an investment company or investment trust should have a stated final maturity of one day. The City may enter into repurchase agreements with depositories designated by the State Board of Finance as depositories for state deposits involving the unit's purchase and guaranteed resale of any interest-bearing obligations issued or fully insured or guaranteed by the United States of America, a United States of America government agency, an instrumentality of the United States of America, or a federal government sponsored enterprise. The repurchase agreement is considered to have a stated final maturity of one day. This agreement must be fully collateralized by interest-bearing obligations as determined by their current market value. At the option of the City, an additional distribution in a prior year of police and fire pension relief funds was held for investment in an external investment pool (Pension Relief Fund) by the Public Employees' Retirement Fund of Indiana (PERF). These deferred amounts invested in the Fund are available to participating cities and towns at their request. The Pension Relief Fund is invested to a target of 70% fixed income debt instruments and 30% domestic stock. The fair value of the City's investment in the Fund is the same as the value of pool shares. Domestic stock fair value as of December 31, 2005, was $ 422,815. Responsibility of regulatory oversight for the pool is assumed by the PERF governing board, under direction by statute to "invest its assets with the care, skill, prudence and diligence that a prudent person acting in a like capacity and familiar with such matters would use in the conduct of an enterprise of a like character and with like aims." Utilizing external investment managers, the PERF Board diversifies such investments in accordance with prudent investment standards. Interest Rate Risk Interest rate risk is the risk that changes in interest rates will adversely affect the fair value of an investment. The City must follow state statute and limit the stated final maturities of the
Investment FairType Value Duration
Pension Relief Investment Pool 986,570$ 3.6
II-30

investments to no more than two years. Interest rate risk of the Pension Relief Fund's fixed income portfolio, using the duration approach, is 3.6. Credit Risk Credit risk is the risk that an issuer or other counterparty to an investment will not fulfill its obligations. The distribution of securities with credit ratings is summarized below.
C. Capital Assets
Capital asset activity for the year ended December 31, 2005, was as follows:
ExternalStandard & Moody's Investment
Poor's Rating Rating Pools
AAA Aaa 642,257$ AA Aa 42,422A A 184,489BBB Baa 105,563BB Ba 6,906Unrated Unrated 4,933
Totals 986,570$
City of Bloomington
II-31

Beginning EndingPrimary government Balance Increases Decreases Balance
Governmental activities:Capital assets, not being depreciated:
Land 106,358,811$ 4,577,395$ -$ 110,936,206$ Construction in progress 1,109,287 2,956,642 - 4,065,929
Total capital assets, notbeing depreciated 107,468,098 7,534,037 - 115,002,135
Capital assets, being depreciated:Buildings 43,242,935 1,640,486 - 44,883,421 Improvements other than buildings 14,049,040 178,768 11,481 14,216,327 Machinery and equipment 16,954,904 643,848 143,563 17,455,189 Roads being depreciated 85,062,969 1,871,490 - 86,934,459
Totals 159,309,848 4,334,592 155,044 163,489,396
Less accumulated depreciation for:Buildings 12,607,584 1,425,106 - 14,032,690 Improvements other than buildings 3,394,469 797,498 11,482 4,180,485 Machinery and equipment 9,226,011 1,267,315 138,774 10,354,552 Roads being depreciated 39,361,563 3,848,832 - 43,210,395
Totals 64,589,627 7,338,751 150,256 71,778,122
Total capital assets, beingdepreciated, net 94,720,221 (3,004,159) 4,788 91,711,274
Total governmental activitycapital assets, net 202,188,319$ 4,529,878$ 4,788$ 206,713,409$
II-32

Beginning Reclassification EndingPrimary government Balance Increases Decreases of Assets Balance
Business-type activites:Capital assets, not being depreciated:
Land 1,623,631$ 7,000$ -$ -$ 1,630,631$ Utility plant acquisition adjustmen 44,582 - 3,040 - 41,542 Construction in progress 14,723,295 8,332,975 2,907,572 - 20,148,698
- Total capital assets, not
being depreciated 16,391,508 8,339,975 2,910,612 - 21,820,871
Capital assets, being depreciated:Buildings 38,751,252 714,114 - (11,175,241) 28,290,125 Improvements other than building 146,323,281 1,079,503 45,442 11,175,241 158,532,583 Transportation equipment 4,117,216 - - - 4,117,216 Machinery and equipment 29,509,536 1,029,738 - - 30,539,274
Totals 218,701,285 2,823,355 45,442 - 221,479,198
Less accumulated depreciation for:Buildings 7,268,065 561,005 241,131 - 7,587,939 Improvements other than building 44,688,349 2,776,928 3,377 - 47,461,900 Transportation equipment 3,058,517 442,793 - - 3,501,310 Machinery and equipment 22,991,612 818,211 21 - 23,809,802
Totals 78,006,543 4,598,937 244,529 - 82,360,951
Total capital assets, beingdepreciated, net 140,694,742 (1,775,582) (199,087) - 139,118,247
Total business-type activitycapital assets, net 157,086,250$ 6,564,393$ 2,711,525$ -$ 160,939,118$
II-33

The Public Transportation Corporation increased their capitalization threshold from $500 to $1,000 during 2005. Net assets have been adjusted for the effect of applying the change in the capitalization threshold. Depreciation expense was charged to functions/programs of the city as follows:
Deletions DueBeginning To Change in Ending
Discretely presented component units Balance Increases Decreases Capitalization Balance
Capital assets, being depreciated:Buildings 6,409,726 13,116 - - 6,422,842 Improvements other than buildings 950 950 - - 1,900 Office equipment 257,193 5,198 89,068 41,447 131,876 Shop equipment 79,025 - - 12,145 66,880 Bus/passenger equipment 273,858 140,288 16,495 44,088 353,563 Motor equipment 7,917,007 1,447,225 675,320 - 8,688,912
Totals 14,937,759 1,606,777 780,883 97,680 15,665,973
Less accumulated depreciation for:Buildings 1,473,959 213,658 - - 1,687,617 Improvements other than buildings - 32 - - 32 Office equipment 150,652 31,321 69,349 25,097 87,527 Shop equipment 62,246 3,343 - 10,163 55,426 Bus/passenger equipment 4,003,133 778,750 661,090 - 4,120,793 Motor equipment 79,408 24,340 13,470 19,485 70,793
Totals 5,769,398 1,051,444 743,909 54,745 6,022,188
Total capital assets, beingdepreciated, net 9,168,361 555,333 36,974 42,935 9,643,785
Governmental activities:General government 4,844,491$ Public safety 547,833 Culture and recreation 1,455,164 Urban redevelopment and housing 3,421 Sanitation 156,006 Highways, Streets and Roads 331,836
Total depreciation expense - governmental activities 7,338,751$
Business-type activities:Water 1,552,861$ Wastewater 2,804,586
Total depreciation expense - business-type activities 4,357,447$
II-34

C. Construction Commitments Construction work in progress is composed of the following:
D. Interfund Balances and Activity
1. Interfund Receivables and Payables
The composition of interfund balances as of December 31, 2005, is as follows:
Interfund balances resulted from the time lag between the dates that (1) Interfund loans are repaid, (2) Interfund goods and services are provided or reimbursable expenditures occur, (3) transactions are recorded in the accounting system and (4) payments between funds are made.
2. Interfund Transfers
Interfund transfers at December 31, 2005, were as follows:
Total Expended to RequiredProject December 31, Future
Project Authorized 2005 Committed Funding
Water Projects 15,255,084$ 13,529,187$ 1,725,897$ -$ Wastewater Projects 9,193,265 6,619,511 2,573,754 -
Totals 24,448,349$ 20,148,698$ 4,299,651$ -$
Due From Due To Amount
General fund Internal Service 14,421$ Park General fund 96,599
Internal Service 2,010 Street and Road General FUnd 59,987
Internal service 12,882 Water Utility Wastewaer 140,369
Internal service 3,660 Wastewater Water 118,297
Internal Service 5,490 Other governmental General fund 84,725
Internal Service 5,524 Internal service General fund 19,256
Internal service 134
Totals 563,354$
II-35

The city typically uses transfers to fund ongoing operating subsidies and to transfer the portion of state-shared revenues from the general fund to the debt service fund for current-year debt service requirements.
E. Leases
1. Operating Leases
The City has no significant operating leases.
2. Capital Leases The city has entered into various capital leases for buildings, transportation equipment, and various other improvements. Future minimum lease payments and present values of the net minimum lease payments under these capital leases as of December 31, 2005, are as follows:
Assets acquired through capital leases still in effect are as follows:
General NonmajorTransfer From Fund Governmental Total
General Fund -$ 439,920$ 439,920$ Park and Recreation -$ 120,000$ 120,000 Municipal Improvement 5,133$ -$ 5,133 Nonmajor Governmental 70 1,404,606 1,404,676
Total 5,203$ 1,964,526$ 1,969,729$
Transfer To
Governmental Business-typeActivities Activities
2006 3,716,970$ 313,092 2007 3,589,147 335,045 2008 3,155,733 335,046 2009 3,038,210 335,046 2010 2,917,419 291,138 2011-2015 14,480,548 873,415 2016-2020 9,290,449 - 2021-2025 4,351,380 - 2026-2030 3,215,342 - 2031-2035 2,306,228 -
Total minimum lease payments 50,061,426 2,482,782
Less amount representing interest 21,207,039 360,487
Present value of net minimum lease payments 28,854,387$ 2,122,295$
II-36

F. Long-Term Liabilities
1. General Obligation Bonds The city issues general obligation bonds to provide funds for the acquisition and construction of major capital facilities. General obligation bonds are direct obligations and pledge the full faith and credit of the city. General obligation bonds currently outstanding at year end are as follows:
Annual debt service requirements to maturity for general obligation bonds are as follows:
Governmental Business-TypeActivities Activities
Land 2,931,800$ -$ Buildings 22,399,510 325,842 Improvements other than buildings 762,468 2,381,304 Machinery and equipment 1,896,265 -
Totals 27,990,043 2,707,146
Accumulated depreciation 3,764,329 157,266
Totals 24,225,714$ 2,549,880$
InterestPurpose Rates Amount
$7,750,000 1998 Street Construction general obligation bonds; payable form the Street Bond Fund in installments of $60,000 to $900,000 plus interest through January 1, 2017 4.38% to 5.00% 7,365,000$ $2,460,000 1999 Park District Golf Course Construction general obligation bonds payable from the Park District Golf Course Bond Fund in installments of $10,000 to $325,000 plus interest through February 1, 2019 4.35% to 5.00% 2,450,000 $2,430,000 2000 Redevelopment District general obligation bonds payable from the Redevelopment Bond Fund in installments of $130,000 to $250,000 plus interest through February 1, 2015 4.65% to 5.70% 1,955,000
$6,200,000 2001 Park District general obligation bonds payable from the Park District Bond Fund in installments of $410,000 to $420,000 plus interest through January 15, 2017 4.20% to 4.70% 4,970,000
Totals 16,740,000$
II-37

2. Revenue Bonds
The city issues bonds to be paid by income derived from the acquired or constructed assets. Revenue bonds outstanding at year end are as follows:
Revenue bonds debt service requirements to maturity are as follows:
Year EndedDecember 31 Principal Interest
2006 845,000$ 769,704$ 2007 875,000 731,516 2008 965,000 690,485 2009 1,195,000 642,112 2010 1,335,000 585,147 2011-2015 7,815,000 1,895,411 2016-2020 3,710,000 246,310
Total 16,740,000$ 5,560,685$
Governmental Activities
InterestPurpose Rates Amount
$10,220,000 2003 Waterworks Refunding Revenue Bonds payable from the Waterworks Utility Bond and Interest Fund in installments of $275,000 to $480,00 plus interest through January 1, 2020 2.00% to 4.50% 8,305,000$ $19,095,000 2003 Wastewater Refunding Revenue Bonds payable from the Wastewater Utility Bond and Interest Fund in installments of $550,000 to $1,310,000 plus interest through January 1, 2025 2.00% to 4.625% 16,955,000 $8,200,000 1999 Wastewater Revenue Bonds payable from the Wastewater Utility Bond and Interest Fund in installments of $175,000 to $505,000 plus interest through January 1, 2029 4.75% to 5.20% 7,400,000
Total 32,660,000$
II-38

3. Notes and Loans Payable
The Water Utility has entered into a note for the purchase of the Russell Road Utility. Annual debt service requirements to maturity for the note, including interest of $6,243, are as follows:
The Water and Wastewater Utilities have made loan agreements with the State of Indiana through its revolving loan program to finance various construction projects. The funds are loaned as the constructions costs are incurred. The agreements provide for maximum loans of $ 22,950,000 for the Water Utility and $21,707,000 Wastewater Utility. As of December 31, 2005, the loan principal balances were $22,375,228 for the Water Utility and $17,198,030 for the Wastewater Utility with the outstanding principal balance of completed projects being $14,738,000 for Water and $15,176,000 for Wastewater.
Annual debt service requirements for the uncompleted loans will not be established until the construction projects are completed. As for the completed loans, the annual debt service requirement to maturity is as follows:
Year EndedDecember 31 Principal Interest
2006 1,690,000$ 1,385,415$ 2007 1,740,000 1,342,340 2008 1,790,000 1,291,259 2009 1,510,000 1,235,634 2010 1,215,000 1,188,440 2011-2015 6,735,000 5,171,364 2016-2020 8,290,000 3,480,652 2021-2025 7,800,000 1,494,034 2026-2030 1,890,000 202,280
Total 32,660,000$ 16,791,418$
Business-Type Activities
Year EndedDecember 31 Principal Interest
2006 17,559$ 2,702$ 2007 19,147 1,995 2008 20,027 1,115 2009 13,923 234
Totals 70,656$ 6,046$
Business Activities
II-39

4. Changes in Long-Term Liabilities
Long-term liability activity for the year ended December 31, 2005, was as follows:
Year EndedDecember 31 Principal Interest
2006 947,000$ 870,440$ 2007 972,000 841,965 2008 999,000 812,731 2009 1,403,000 782,705 2010 1,834,000 735,269 2011-2015 9,961,000 2,828,379 2016-2020 11,424,000 1,263,865 2021-2025 2,374,000 59,426
Total 29,914,000$ 8,194,778$
Business Activities
DueBeginning Ending Within
Primary government Balance Additions Reductions Balance One Year
Governmental activities:Bonds payable:
General obligation 17,375,000$ -$ 635,000$ 16,740,000$ 845,000$ Capital leases 30,368,296 100,348 1,614,257 28,854,387 1,643,359 Compensated absences 509,683 237,748 81,526 665,905 172,766 Net Pension Obligation 20,457,385 2,716,924 - 23,174,309 -
Total governmental activitiesLong-term liabilities 68,710,364$ 3,055,020$ 2,330,783$ 69,434,601$ 2,661,125$
II-40

DueBeginning Ending Within
Primary government Balance Additions Reductions Balance One Year
Business-type activities:Revenue bonds payable:
Water Utility 9,250,000$ -$ 945,000$ 8,305,000$ 965,000$ Wastewater Utility 25,765,000 - 1,410,000 24,355,000 725,000 Add Unamortized Premium 474,014 - 25,649 448,365 - Less Unamortized Discount 72,539 - 4,930 67,609 - Less deferred amount
on refunding 2,536,305 - 140,619 2,395,686 -
Total revenuebonds payable 32,880,170 - 2,235,100 30,645,070 1,690,000
Loans payable 32,916,743 6,739,516 83,000 39,573,259 1,241,000 Capital leases 2,656,173 - 533,878 2,122,295 233,959 Notes Payable 88,906 - 18,249 70,657 18,306 Bond Anticipation Notes 2,609,340 5,109,340 2,609,339 5,109,341 5,109,340 Compensated absences 152,350 22,557 19,023 155,884 52,678
Total business-type activitiesLong-term liabilities 71,303,682$ 11,871,413$ 5,498,589$ 77,676,506$ 8,345,283$
Compensated absences for governmental activities typically have been liquidated from the general fund and special revenue funds. Claims and judgments typically have been liquidated from the general fund.
G. Other Information
1. Risk Management
The city is exposed to various risks of loss related to torts; theft of, damage to, and destruction of assets; errors and omissions; job related illnesses or injuries to employees; medical benefits to employees, retirees, and dependents (excluding postemployment benefits); and natural disasters. The risks of torts; theft of, damage to, and destruction of assets; errors and omissions; job related illnesses or injuries to employees; and natural disasters are covered by commercial insurance from independent third parties. Settled claims from these risks have not exceeded commercial insurance coverage for the past three years. There were no significant reductions in insurance by major category of risk. Health Insurance The city has chosen to establish a risk financing fund for risks associated with employee health claims. The risk financing fund is accounted for in the Health Insurance Trust Fund, an internal service fund, where assets are set aside for claim settlements. An excess policy through commercial insurance covers individual claims in excess of $125,000 per year. Settled claims resulting from this risk did not exceed commercial insurance coverage in the past three years. Amounts are paid into
II-41

the fund by all covered employees and by all insured funds are available to pay claims, claim reserves, and administrative costs of the program. Interfund premiums are based upon the percentage of each fund's current year eligible employees as it relates to the total eligible employees, and are reported as quasi-external interfund transactions. Provisions are also made for unexpected and unusual claims. Claim expenditures and liabilities of the fund are reported when it is probable that a loss has occurred and the amount of the loss can be reasonably estimated. These losses include an estimate of claims that have been incurred but not reported (IBNRs). Claim liabilities are calculated considering the effects of inflation, recent claim settlement trends including frequency and amounts of pay outs and other economic and social factors.
Changes in the balance of claim liabilities during the past two years are as follows:
Workers Compensation
The City has chosen to establish a risk financing fund for risks associated with compensation claims. The risk financing fund is accounted for in the Risk Management Fund, an internal service fund, where assets are set aside for claim settlements. An excess policy through commercial insurance covers individual claims in excess of $300,000 per year. Settled claims resulting from this risk did not exceed commercial insurance coverage in the past three years. Amounts are paid into the fund for all covered employees and for all insured funds and are available to pay claims, claim reserves, and administrative costs of the program. Interfund premiums for workers compensation are based primarily upon the percentage of each fund's current year payroll as it relates to the total payroll and the fund's past claim experience, and are reported as quasi-external interfund transactions. Provisions are also made for unexpected and unusual claims.
Claim expenditures and liabilities of the fund are reported when it is probable that a loss has occurred and the amount of the loss can be reasonably estimated. These losses include an estimate of claims that have been incurred but not reported. Claim liabilities are calculated considering the effects of inflation, recent claim settlement trends including frequency and amounts of pay outs and other economic and social factors.
Changes in the balance of claim liabilities during the past two years are as follows:
2004 2005
Unpaid claims, beginning of fiscal year 268,251$ 307,994$ Incurred claims and changes in estimates 3,891,103 5,267,210 Claim payments 3,851,360 5,167,673
Unpaid claims, end of fiscal year 307,994$ 407,531$
2004 2005
Unpaid claims, beginning of fiscal year 22,543$ 59,214$ Incurred claims and changes in estimates 297,758 489,730 Claim payments 261,087 501,858
Unpaid claims, end of fiscal year 59,214$ 47,086$
II-42

2. Subsequent Events
On May 4, 2006, the Utility received proceeds from the sale of $5,320,000 Waterworks Revenue Bonds and from the sale of $8,090,000 Wastewater Revenue Bonds. The bonds were issued for the purpose of constructing a new utilities building, retiring a Water Bond Anticipation note issued in 2005, retiring a Wastewater Bond Anticipation note issued in 2005, and various other water and wastewater construction projects On June 29, 2006, the Wastewater Utility received approval for a State Revolving Loan for the maximum amount of $10,840,000 for construction of various sewer projects.
3. Prior Period Adjustment
In February 2005 the Wastewater Utility reached an agreement with CSX Transportation, Inc. to settle a disputed account. The settlement resulted in a decrease in the CSX stormwater account balance in the amount of $177,585, removing charges made in prior years.
4. Conduit Debt Obligation
From time to time, the city has issued Economic Development Revenue Bonds to provide financial assistance to private-sector entities for the acquisition and construction of industrial and commercial facilities deemed to be in the public interest. The bonds are secured by the property financed and are payable solely from payments received on the underlying mortgage loans. Upon repayment of the bonds, ownership of the acquired facilities transfers to the private-sector entity served by the bond issuance. Neither the city, the State, nor any political subdivision thereof is obligated in any manner for the repayment of the bonds. Accordingly, the bonds are not reported as liabilities in the accompanying financial statements. As of December 31, 2005, there were three series of Economic Development Revenue Bonds outstanding with an aggregate principal amount payable of $16,610,000.
5. Extraordinary Gain
In a prior year, the Utilities incurred a fire in the administration and service building. The Utilities received an insurance settlement for building contents that exceeded its net book value.
H. Pension Plans
1. Agent Multiple-Employer and Single-Employer Defined Benefit Pension Plans
a. Public Employees' Retirement Fund
Plan Description The city contributes to the Indiana Public Employees' Retirement Fund (PERF), a defined benefit pension plan. PERF is an agent multiple-employer public employee retirement system, which provides retirement benefits to plan members and beneficiaries. All full-time employees are eligible to participate in the defined benefit plan. State statutes (IC 5-10.2 and 5-10.3) govern, through the PERF Board, most requirements of the system and give the city authority to contribute to the plan. The PERF retirement benefit consists of the pension provided by employer contributions plus an annuity provided by the member's annuity savings account. The annuity savings account consists of member's contributions, set by state statute at three percent of compensation, plus the interest credited to the member's account. The employer may elect to make the contributions on behalf of the member. PERF administers the plan and issues a publicly available financial report that includes financial statements and required supplementary information for the plan as a whole and for its participants. The report may be obtained by contacting:
II-43

Public Employees' Retirement Fund Harrison Building, Room 800 143 West Market Street Indianapolis, IN 46204 Phone (317) 233-4162
Funding Policy and Annual Pension Cost The contribution requirements of plan members for PERF are established by the Board of Trustees of PERF. The city's annual pension cost and related information, as provided by the actuary, is presented in this note. Information to segregate the assets/liabilities and the actuarial study figures between the city, the Utilities and Transit is not available. Therefore, the liability for Net Pension Obligation (NPO) is considered an obligation of the city and is presented in the governmental activities of the financial statements and is not presented as an asset/liability of the proprietary funds.
b. 1925 Police Officers' Pension Plan
Plan Description The city contributes to the 1925 Police Officers' Pension Plan which is a single-employer defined benefit pension plan. The plan is administered by the local pension board as authorized by state statute (IC 36-8-6). The plan provides retirement, disability, and death benefits to plan members and beneficiaries. The plan was established by the plan administrator, as provided by state statute. The plan administrator does not issue a publicly available financial report that includes financial statements and required supplementary information of the plan. Funding Policy and Annual Pension Cost The contribution requirements of plan members for the 1925 Police Officers' Pension Plan are established by state statute. The city's annual pension cost and related information as provided by the actuary, is presented in this note. The use of the pay-as-you-go actuarial cost method by the city results in significant underfunding of the plan. Therefore, the Net Pension Obligation (NPO) is not reflected in the financial statements of the pension trust funds.
c. 1937 Firefighters' Pension Plan Plan Description The city contributes to the 1937 Firefighters' Pension Plan which is a single-employer defined benefit pension plan. The plan is administered by the local pension board as authorized by state statute (IC 36-8-7). The plan provides retirement, disability, and death benefits to plan members and beneficiaries. The plan was established by the plan administrator, as provided by state statute. The plan administrator does not issue a publicly available financial report that includes financial statements and required supplementary information of the plan. Funding Policy and Annual Pension Cost The contribution requirements of plan members for the 1937 Firefighters' Pension Plan are established by state statute. The city's annual pension cost and related information, as provided by the actuary, is presented in this note.
II-44

Actuarial Information for the Above Plans
1925 Police 1937 Officers’ Firefighters’ PERF Pension Pension Contribution rates:
Government 5.5% 601% 700% Plan Members 3% 6% 6%
Actuarial valuation date 07-01-05 01-01-05 01-01-05 Actuarial cost method Entry age Entry age Entry age Amortization method Level percentage
of projected payroll, closed
Level percentage of projected payroll, open
Level percentageof projected payroll, open
Amortization period 40 years 30 years 30 years Amortization period
(from date)
07-1-97
1-1-05
1-1-05 Asset valuation method 4 year
smoothed market4 year
smoothed market4 year
smoothed market
.
1925 Police 1937 Officers’ Firefighters’
Actuarial Assumptions PERF Pension Pension Investment rate of return 7.25% 6% 6% Projected future salary increases:
Total 5% 5% 5% Attributed to inflation 4% 4% 4% Attributed to merit/seniority 1% 1% 1%
Cost-of-living adjustments 2% 0% 0%
1925 Police 1937Officers' Firefighters'
PERF Pension Pension
Annual required contribution 1,143,562$ 2,395,000$ 3,267,400$ Interest on net pension
obligation 8,144 579,000 794,300 Adjustment to annual required
contribution (9,281) (1,011,500) (1,387,600)
Annual pension cost 1,142,425 1,962,500 2,674,100 Contributions made 997,760 837,376 1,226,965
Increase (decrease) in netpension obligation 144,665 1,125,124 1,447,135
Net pension obligation,beginning of year 112,330 8,577,892 11,767,163
Net pension obligation,end of year 256,995$ 9,703,016$ 13,214,298$
II-45

Three Year Trend Information
PERF
Year Ending
Annual Pension Cost
(APC)
Percentage of APC
Contributed
Net Pension
Obligation
06-30-03 $ 1,001,935 64% $ 27,850 06-30-04 896,957 91% 112,330 06-30-05 1,142,425 111% 256,995
1925 Police Officers’ Pension Plan
Year Ending
Annual Pension Cost
(APC)
Percentage of APC
Contributed
Net Pension
Obligation
12-31-02 $ 1,905,200 53% $ 7,361,065 12-31-03 1,959,700 38% 8,577,892 12-31-04 1,962,500 43% 9,703,016
1937 Firefighters’ Pension Plan
Year Ending
Annual Pension Cost
(APC)
Percentage of APC
Contributed
Net Pension
Obligation
12-31-02 $ 2,733,700 61% $ 10,560,626 12-31-03 2,646,500 54% 11,767,163 12-31-04 2,674,100 46% 13,214,298
Membership in the 1925 Police Officiers’ Pension Plan and the 1937 Firefighters’ Pension Plan at January 1, 2005, was comprised of the following:
1925 Police
Officers’ Pension
1937 Firefighters’
Pension Retires and beneficiaries currently
receiving benefits
52
56 Current active employees 7 14
2. Cost-Sharing Multiple-Employer Defined Benefit Pension Plans
1977 Police Officers' and Firefighters' Pension and Disability Fund Plan Description The city contributes to the 1977 Police Officers' and Firefighters' Pension and Disability Fund, a cost-sharing multiple-employer defined benefit pension plan administered by the Indiana Public Employees' Retirement Plan (PERF) for all police officers and firefighters hired after April 30, 1977.
State statute (IC 36-8-8) regulates the operations of the system, including benefits, vesting and requirements for contributions by employers and by employees. Covered employees may retire at age fifty-five with twenty years of service. An employee with twenty years of service may leave service, but will not receive benefits until reaching age fifty-five. The plan also provides for death and disability benefits.
II-46

PERF issues a publicly available financial report that includes financial statements and required supplementary information for the plan as a whole and for its participants. That report may be obtained by contacting:
Public Employees' Retirement Fund Harrison Building, Room 800 143 West Market Street Indianapolis, IN 46204 Phone (317) 233-4162
Funding Policy and Annual Pension Costs Plan members are required to contribute 6% of the first-class police officers' and firefighters' salary and the city is to contribute at an actuarially determined rate. The current rate, which has not changed since the inception of the plan, is 21% of the first-class police officers' and firefighters' salary. The contribution requirements of plan members and the city are established by the Board of Trustees of PERF. The city's contributions to the plan for the years ending December 31, 2005, 2004 and 2003 were $1,404,809, $1,319,107, and $1,266,159, respectively, equal to the required contributions for each year.
II-47

CITY OF BLOOMINGTON. INDIANAREQUIRED SUPPLEMENTARY INFORMATIONBUDGETARY COMPARISON SCHEDULEGENERAL FUND For The Year Ended December 31, 2005
Variance withFinal Budget-
PositiveOriginal Final Actual (Negative)
Revenues:
Taxes 13,355,539$ 13,355,539$ 11,862,836$ (1,492,703)$ Licenses and permits 62,050 62,050 59,607 (2,443) Intergovernmental 7,654,404 7,654,404 7,349,975 (304,429) Charges for services 1,538,250 1,538,250 2,132,953 594,703 Fines and forfeits - - 144,211 144,211 Other 278,781 278,781 434,927 156,146
Total revenues 22,889,024 22,889,024 21,984,509 (904,515)
Expenditures:Current:
General government 6,524,480 6,760,479 6,309,669 450,810 Public safety 15,153,008 14,958,137 14,694,121 264,016 Highways and streets 398,122 413,973 345,534 68,439 Urban Redevlopment 776,180 793,497 726,278 67,219
Total expenditures 22,851,789 22,926,086 22,075,602 850,483
Other financing sources (uses):Operating transfers in 5,203 5,203 5,203 - Operating transfers out (439,920) (439,920) (439,920) -
Total other financing sources (uses (434,717) (434,717) (434,717) -
__
Net change in fund balance (397,482) (471,778) (525,809) (54,031)
Fund balance - beginning 3,565,497 3,565,497 3,565,497 -
Fund balance - ending 3,168,015$ 3,093,719$ 3,039,688$ (54,031)$
The notes to RSI are an integral part of RSI.
General Fund
Budgeted Amounts
III-1

CITY OF BLOOMINGTON, INDIANAREQUIRED SUPPLEMENTARY INFORMATIONBUDGETARY COMPARISON SCHEDULESMAJOR SPECIAL REVENUE FUNDSFor The Year Ended December 31, 2005
Variance withFinal Budget-
PositiveOriginal Final Actual (Negative)
Revenues:Taxes 3,907,080$ 3,907,080$ 3,421,810$ (485,270)$ Intergovernmental 313,935 313,935 199,471 (114,464) Charges for services 1,072,145 1,072,145 1,034,149 (37,996) Other 25,600 25,600 27,775 2,175
Total revenues 5,318,760 5,318,760 4,683,205 (635,555)
Expenditures:Current:
Culture and recreation: Personal services 3,434,899 3,520,143 3,471,358 48,785 Supplies 398,627 430,422 407,309 23,113 Other services and charges 1,551,674 1,196,460 1,048,308 148,151 Capital outlay 170,225 202,947 201,170 1,777
Total expenditures 5,555,425 5,349,971 5,128,145 221,826
Other financing sources (uses):Operating transfers in - Operating transfers out (120,000) (120,000) (120,000) -
Total other financing sources (uses) (120,000) (120,000) (120,000) - __
Net change in fund balances (356,665) (151,211) (564,940) (413,729)
Fund balances - beginning 991,633 991,633 991,633 -
Fund balances - ending 634,968$ 840,422$ 426,693$ (413,729)$
The notes to RSI are an integral part of RSI.
Park
Budgeted Amounts
III-2

CITY OF BLOOMINGTON, INDIANAREQUIRED SUPPLEMENTARY INFORMATIONBUDGETARY COMPARISON SCHEDULESMAJOR SPECIAL REVENUE FUNDSFor The Year Ended December 31, 2005
Variance withFinal Budget-
PositiveOriginal Final Actual (Negative)
Revenues:Intergovernmental 3,476,203$ 3,476,203$ 3,548,953$ 72,750$ Other - - 41,036 41,036
- Total revenues 3,476,203 3,476,203 3,589,989 113,786
Expenditures:Current:
Highways and streets: Personal services 1,934,213 1,970,554 1,870,959 99,595 Supplies 1,032,200 1,011,842 949,881 61,961 Other services and charges 1,189,713 1,116,460 927,690 188,770 Capital outlay 1,343,082 340,595 337,574 3,021
Total expenditures 5,499,208 4,439,452 4,086,104 353,348 __
Net change in fund balances (2,023,005) (963,249) (496,115) 467,134
Fund balances - beginning 4,080,091 4,080,091 4,080,091 -
Fund balances - ending 2,057,086$ 3,116,842$ 3,583,976$ 467,134$
The notes to RSI are an integral part of RSI.
Street & Road
Budgeted Amounts
III-3

The major differences between Budgetary (Non-GAAP) basis and GAAP basis are:
a. Revenues are recorded when received in cash (budgetary) as opposed to susceptible to accrual (GAAP).
b. Expenditures are recorded when paid in cash (budgetary) as opposed to when the liability is incurred (GAAP).
basis to a GAAP basis are as follows:
General Park Street & Road
Net changes in fund balances (budgetary basis) (525,809)$ (564,940)$ (496,115)$ Adjustments:
To adjust revenues for accruals 2,141,796 497,090 56,131 To adjust expenditures for accruals (581,672) (30,169) 61,062
Net changes in fund balances (GAAP basis) 1,034,315$ (98,019)$ (378,922)$
For the Year Ended December 31, 2005
Adjustments necessary to convert the results of operations at the end of the year on a budgetary
The notes to RSI are an integral part of this schedule.
CITY OF BLOOMINGTON, INDIANAREQUIRED SUPPLEMENTARY INFORMATION
BUDGET/GAAP RECONCILIATIONGENERAL FUND AND MAJOR SPECIAL REVENUE FUNDS
III-4

Public Employees' Retirement FundExcess
(Unfunded)Actuarial Excess of AAL as a
Actuarial Accrued Assets Over PercentageActuarial Value of Liability (Unfunded) Funded Covered of CoveredValuation Assets (AAL) AAL Ratio Payroll Payroll
Date (a) (b) (a-b) (a/b) (c) ((a-b)/c)
07-01-03 15,105,968$ 17,212,634$ (2,106,666) 88% 15,868,524$ (13%)07-01-04 15,360,487 19,373,381 (4,012,894) 79% 17,712,119 (23%)07-01-05 16,151,067 22,465,947 (6,314,880) 72% 18,502,301 (34%)
1925 Police Officers' Pension PlanExcess
(Unfunded)Actuarial Excess of AAL as a
Actuarial Accrued Assets Over PercentageActuarial Value of Liability (Unfunded) Funded Covered of CoveredValuation Assets (AAL) AAL Ratio Payroll Payroll
Date (a) (b) (a-b) (a/b) (c) ((a-b)/c)
01-01-00 2,127,832$ 19,396,300$ (17,268,468) 11% 464,700$ (3716%)01-01-01 2,043,222 20,391,500 (18,348,278) 10% 400,600 (4580%)01-01-02 2,564,611 19,886,900 (17,322,289) 13% 371,400 (4664%)01-01-03 2,653,563 16,792,200 (14,138,637) 16% 502,300 (2815%)01-01-04 2,202,299 20,076,800 (17,874,501) 11% 401,400 (4453%)01-01-05 2,058,376 19,839,800 (17,781,424) 10% 374,700 (4746%)
1937 Firefighters' Pension PlanExcess
(Unfunded)Actuarial Excess of AAL as a
Actuarial Accrued Assets Over PercentageActuarial Value of Liability (Unfunded) Funded Covered of CoveredValuation Assets (AAL) AAL Ratio Payroll Payroll
Date (a) (b) (a-b) (a/b) (c) ((a-b)/c)
01-01-00 2,790,020$ 28,092,000$ (25,301,980) 10% 727,900$ (3476%)01-01-01 2,620,971 28,583,200 (25,962,229) 9% 715,500 (3629%)01-01-02 3,103,531 28,529,400 (25,425,869) 11% 551,700 (4609%)01-01-03 3,029,989 22,783,400 (19,753,411) 13% 756,500 (2611%)01-01-04 3,428,085 27,434,500 (24,006,415) 12% 544,900 (4406%)01-01-05 3,219,299 26,195,600 (22,976,301) 12% 519,700 (4421%)
The notes to RSI are an integral part of this schedule.
CITY OF BLOOMINGTON, INDIANAREQUIRED SUPPLEMENTARY INFORMATION
SCHEDULES OF FUNDING PROGRESS
III-5

1925 Police Officers' Pension PlanAnnual
RequiredYear Contribution
Ending (ARC) City State
12/31/99 2,101,600$ 13% 21%12/31/00 2,005,300 14% 21%12/31/01 2,152,000 18% 44%12/31/02 2,167,800 18% 29%12/31/03 2,291,700 7% 26%12/31/04 2,395,000
1937 Firefighters' Pension PlanAnnual
RequiredYear Contribution
Ending (ARC) City State
12/31/99 2,868,300$ 10% 21%12/31/00 2,906,000 11% 19%12/31/01 3,041,000 14% 40%12/31/02 3,104,100 14% 28%12/31/03 3,123,000 20% 26%12/31/04 3,267,400
Percentage of ARCContributed
Percentage of ARCContributed
CITY OF BLOOMINGTON, INDIANAREQUIRED SUPPLEMENTARY INFORMATIONSCHEDULES OF CONTRIBUTIONS FROM THE
EMPLOYER AND OTHER CONTRIBUTING ENTITIES
III-6

CITY OF BLOOMINGTON, INDIANA
NOTES TO REQUIRED SUPPLEMENTARY INFORMATION December 31, 2005
Note 1. Budgets and Budgetary Accounting
A. The City follows these procedures in establishing the budgetary data reflected in the budgetary
comparison schedules:
1. The Mayor submits to the City Council a proposed operating budget for the fiscal year commencing the following January 1. The operating budget includes proposed expenditures and the means of financing them.
2. The City advertises the budget prior to adoption and the City Council holds public hearings to obtain taxpayer comments.
3. The budget is approved in September of each year by the City Council through passage of an ordinance.
4. Copies of the budget ordinance and advertisements are sent to the Indiana Department of Local Government Finance. The budget becomes legally enacted after the City Controller receives approval from the Indiana Department of Local Government Finance. The budget ordinance as approved by the Indiana Department of Local Government Finance becomes the City's expenditures budget. The City's maximum tax levy is restricted by Indiana Law, with certain adjustments and exceptions. If the advertised budget exceeds the spending and tax limits of the state control laws, an excess levy can be granted by the Indiana Department of Local Government Finance, upon appeal by the City.
5. The legal level of budgetary control (the level at which expenditures may not exceed
appropriations without the governing body’s approval) is by object classification for all funds except for the General fund, which is by object classification within each department. The City’s management cannot transfer budgeted appropriations between object classifications of a budget, without approval of the City Council. Any revisions that alter the total appropriations for any fund or any department of the General fund must be approved by the City Council and, in some instances, by the Indiana Department of Local Government Finance. Expenditures did not exceed appropriations for any funds or departments within the General Fund, which required legally, approved budgets
III-7

6. Formal budgetary integration is required by State statute and is employed as a management control device. An annual budget was legally adopted for the following funds:
Major Funds: General Fund
Special Revenue Funds: Park, Street and Road
Non-major Funds: Special Revenue Funds:
Parking Enforcement, Dispatch Training, Telecommunications Nonreverting, Police Education, Municipal Arts, Arts Commission Operating, Solid Waste, Alternative Transportation, Wireless Enhanced 911 Nonreverting
Debt Service Funds: Park District Bond, Redevelopment District Bond, Street Bond, Municipal Facilities, Golf Course Bond Capital Project Funds: Cumulative Capital Improvement, Cumulative Capital Development, Cumulative Capital Equipment Proprietary Funds:
Risk Management, Fleet Maintenance Fiduciary Funds:
Police Pension, Fire Pension
7. The City's budgetary process is based upon the cash basis, which is a basis other than generally accepted accounting principles (GAAP). Appropriations lapse with the expiration of the budgetary period unless encumbered by a purchase order or contract. Encumbered appropriations are carried over and added to the subsequent year's budget.
8. Budgeted amounts are as originally adopted, or as amended by the City Council and approved by the Indiana Department of Local Government Finance in the regular legal manner. Net increases to the original appropriations totaled $2,118,295 in 2005.
9. There were no excesses of expenditures over appropriations in the general fund or the budgeted major special revenue funds.
III-8

Major Governmental Funds
General Fund – used to account for all financial resources of the City of Bloomington except those required to be accounted for in another fund. Thus, all general operating revenues which are not restricted as to use by sources outside of the City are recorded in the General Fund. Special Revenue Funds – include funds which are restricted as to use by the Federal or State government and special purpose funds established by the City.
Park – To account for the operation of the city park system. Financing is provided by a specific annual property tax levy to the extent that user fees and miscellaneous revenues are insufficient to provide such financing.
Street and Road – To account for construction, operation and maintenance of local and arterial street systems and maintenance departments. Financing is provided by State motor vehicle highway distributions, State gasoline tax distributions and federal grants.
Capital Projects Funds – used to account for financial resources designated to construct or acquire general fixed assets. Such resources are derived from general obligation bonds of the City, intergovernmental revenues and local property taxes.
Municipal Improvement - To account for assets acquired by capital leases.
IV-1

CITY OF BLOOMINGTON, INDIANASCHEDULE OF EXPENDITURES - BUDGET AND ACTUAL -GENERAL FUNDFor The Year Ended December 31, 2005
Variance withFinal Budget-
Original Final PositiveFunction and Department Budget Budget Actual (Negative)
General government: Mayor Personal services 498,963$ 576,359$ 531,692$ 44,667$ Supplies 3,375 5,875 5,671 204 Other services and charges 112,363 174,363 154,486 19,877 Capital outlay 1,000 1,000 1,000 - Controller Personal services 407,148 419,286 400,394 18,892 Supplies 5,000 4,794 2,149 2,645 Other services and charges 129,369 107,359 103,404 3,955 Capital outlay 1,000 1,000 175 825 City Clerk Personal services 91,527 95,372 94,544 828 Supplies 7,000 7,000 733 6,267 Other services and charges 2,200 1,400 470 930 Capital outlay 1,000 1,000 - 1,000 Public Works Personal services 453,158 470,144 468,924 1,220 Supplies 73,950 63,850 54,663 9,187 Other services and charges 1,187,227 1,094,434 1,033,825 60,609 Capital outlay 1,000 1,000 1,000 - Legal Personal services 483,719 526,123 522,801 3,322 Supplies 21,675 21,675 20,474 1,201 Other services and charges 37,850 34,550 30,430 4,120 Capital outlay 1,000 1,000 333 667 City Council Personal services 263,474 277,842 274,624 3,218 Supplies 3,470 4,065 3,584 481 Other services and charges 2,770 2,950 2,349 601 Capital outlay 1,000 900 - 900 Information and Technology Services Personal services 922,844 948,889 851,803 97,086 Supplies 20,400 20,400 18,255 2,145 Other services and charges 166,048 123,182 117,328 5,854 Capital outlay 13,000 12,143 12,143 - Planning Personal services 716,815 802,091 687,844 114,247 Supplies 9,022 12,022 11,507 515 Other services and charges 117,186 105,922 105,603 319 Capital outlay 1,000 1,000 - 1,000
(Continued)
Budgeted Amounts
IV-2

CITY OF BLOOMINGTON, INDIANASCHEDULE OF EXPENDITURES - BUDGET AND ACTUAL -GENERAL FUNDFor The Year Ended December 31, 2005(Continued)
Variance withFinal Budget-
Original Final PositiveFunction and Department Budget Budget Actual (Negative)
General government: Community and Family Resources Personal services 429,229 470,341 470,085 256 Supplies 7,750 5,964 5,910 54 Other services and charges 19,850 22,261 12,200 10,061 Capital outlay 1,000 375 375 - Employee Services Personal services 273,098 305,547 287,454 18,093 Supplies 9,000 9,000 4,287 4,713 Other services and charges 27,000 27,000 16,182 10,818 Capital outlay 1,000 1,000 967 33
Total General government 6,524,480 6,760,479 6,309,669 450,810
Public safety: Fire Personal services 6,109,757 6,123,687 6,063,399 60,289 Supplies 156,058 171,425 168,001 3,425 Other services and charges 255,196 252,732 235,365 17,367 Capital outlay 211,339 210,507 210,338 169 Police Personal services 6,764,244 6,679,659 6,541,181 138,478 Supplies 266,750 234,085 229,911 4,174 Other services and charges 389,275 303,513 289,746 13,767 Capital outlay 231,328 25,649 24,519 1,130 Board of Public Safety Personal services 3,418 3,418 3,143 275 Supplies 250 250 43 207 Other services and charges 275 275 - 275 Animal Care and Control Personal services 631,642 701,521 690,627 10,894 Supplies 45,661 98,361 94,418 3,944 Other services and charges 86,814 152,054 143,255 8,799 Capital outlay 1,000 1,000 175 825
Total Public safety 15,153,008 14,958,137 14,694,121 264,016 (Continued)
Budgeted Amounts
IV-3

CITY OF BLOOMINGTON, INDIANASCHEDULE OF EXPENDITURES - BUDGET AND ACTUAL -GENERAL FUNDFor The Year Ended December 31, 2005(Continued)
Variance withFinal Budget-
Original Final PositiveFunction and Department Budget Budget Actual (Negative)
Highways and streets: City Engineer Personal services 366,634 384,018 317,326 66,692 Supplies 10,212 9,991 9,991 - Other services and charges 20,217 18,905 18,218 687 Capital outlay 1,059 1,059 - 1,059
Total Highways and streets 398,122 413,973 345,534 68,439
Urban Redevelopment: Housing and Neighborhood Personal services 548,945 569,353 527,842 41,511 Supplies 9,218 9,954 9,294 660 Other services and charges 217,017 213,190 188,879 24,311 Capital outlay 1,000 1,000 263 738
Total Urban Redevelopment 776,180 793,497 726,278 67,219
Total General Fund $ 22,851,789 $ 22,926,086 $ 22,075,602 $ 850,483
Budgeted Amounts
IV-4

Non-major Governmental Funds
Special Revenue Funds – include funds which are restricted as to use by the Federal or State government and special purpose funds established by the City.
Parking Enforcement - To account for all parking related revenues, including meter collections, violations collections and off street parking revenues. Park and Recreation Nonreverting Operating - To account for special community recreation programs. CDBG - To account for all resources related to Federal Community Development Block Grant program. Park and Recreation Nonreverting Capital - To account for revenues received from concessions and golf course fees and used for improvements to Cascades Golf Course and supporting facilities. Child Care Development - To account for Federal and State grants used for subsidized childcare. Law Enforcement – To account for grants and donations to the Police Department to be used for public safety purposes.
Dispatch Training – To account for the funds received from false emergency alarm charges used for Emergency Medical Dispatch training.
Telecommunications Nonreverting - To account for activities related to telecommunication including infrastructure and education.
Industrial Incentive Loan - To account for monies loaned to industrial manufacturing and commercial employers as an incentive to maintain and improve the economy of the City of Bloomington. Nonreverting Economic Development - To account for monies used for economic development projects. Special Nonreverting Improvement I - To account for monies received from in-lieu-of-annexation agreements.
Police Education - To account for funds received for training of police officers. Amethyst House - To account for monies received from sale of property to provide for affording housing programs.
IV-5

Park and Recreation Land Acquisition - To account for monies received to assist with the purchase of land for the Parks Department. H.O.M.E. - To account for federal grant monies received for affordable housing activities that benefit low and moderate-income residents of the City. Unsafe Housing - To account for fines and cost reimbursements to the City received in connection with enforcement of the Unsafe Building Law. Solid Waste - To account for yard waste fees, trash fees and other monies used to provide sanitation and recycling services. Community Services - To account for monies raised through fundraising activities by and in support of the Farmer’s Market, Car Seat Lending Program, and Commission of the Status of Women. Alternative Transportation - To account for monies received to assist with alternative transportation planning. Rainy Day - To account for monies transfers from unused and unencumbered funds. Public Technology - To account for monies received to assist with electronic mapping. Arts Commission Operating - To include works of art and design services of artists in capital projects of the city and to account for expenses and revenues of the bi-annual postcard competition.
Wireless Enhanced 911 Nonreverting - To account for Wireless Enhanced Emergency 911 Funds - shared revenue from State. Restricted Donation Fund- To account for monetary donations received less than $5000 from citizens and businesses, often for specified purposes.
Debt Service Funds – used to account for the accumulation of resources for, and the payment of, general obligation bond principal and interest. They are funded principally from local property taxes.
Park District Bond - To account for the accumulation of resources for, and the payment of, general long-term principal, interest and related costs of bond issues benefiting the taxpayers of the park district. Redevelopment District Bond - To account for the accumulation of resources, for and the payment of, general long-term principal, interest and related costs of bond issues benefiting the taxpayers of the redevelopment district.
IV-6
Street Bond - To account for the accumulation of resources for, and the payment of, general long-term debt principal, interest and related costs of the street improvement bond issue of the City. Municipal Facilities - To account for the accumulation of resources for, and the payment of, long-term lease rental payments for the assets acquired by capital leases and other capital projects. Golf Course Bond - To account for the accumulation of resources for, and the payment of, general long-term debt principle, interest and related costs of the golf course bond issue of the City.
Capital Projects Funds – used to account for financial resources designated to construct or acquire general fixed assets. Such resources are derived from general obligation bonds of the City, intergovernmental revenues and local property taxes.
Cumulative Capital Improvement - To account for resources accumulating from State cigarette tax distributions to provide for the cost of construction, maintenance, acquisition and repair for certain facilities and other items of a capital nature. Cumulative Capital Development - To account for resources accumulating from a dedicated property tax levy to provide for the cost of construction maintenance, acquisition and repair of certain facilities and other items of a capital nature. Redevelopment TIF Downtown - To account for property tax revenues received from tax increment financing (TIF) of the Downtown Redevelopment Area, which is a TIF district. Revenues pay for infrastructure improvements inside or serving the TIF district. Cumulative Capital Equipment - To account for resources accumulated from a property tax levy to provide primarily for the acquisition of equipment and other items of a capital nature. Street Construction - To account for resources accumulating to provide for the cost of construction of the streets. Fire Capital - To account for resources received from the sale of the old Headquarters Fire Station to be used for acquisition of equipment for the new Headquarters Fire Station. Redevelopment TIF Southwest - To account for property tax revenues received from tax increment financing (TIF) of the Southwest Redevelopment Area, which is a TIF district. Revenues pay for infrastructure improvements inside or serving the TIF district.
IV-7

Redevelopment TIF Adams - To account for property tax revenues received from tax increment financing (TIF) of the Adams Redevelopment Area, which is a TIF district. Revenues pay for infrastructure improvements inside or serving the TIF district. Redevelopment TIF Prow - To account for property tax revenues received from tax increment financing (TIF) of the Prow Redevelopment Area, which is a TIF district. Revenues pay for infrastructure improvements inside or serving the TIF district. Technology Park - To increase the opportunities of industries in the community. Industrial Development - To increase the opportunities of industries in the community. Redevelopment TIF Whitehall - To account for property tax revenues received from tax increment financing (TIF) of the Whitehall Redevelopment Area, which is a TIF district. Revenues pay for infrastructure improvements inside or serving the TIF district.
Golf Course Construction - To account for resources accumulating to provide for the cost of construction of the nine hole expansion at Cascades Golf Course. Gates Construction - To account for resources accumulating to provide for the cost of construction of infrastructure for new commercial development. Redevelopment TIF Thomson/Winslow/Walnut - To account for property tax revenues received from tax increment financing (TIF) of the Thomson/Winslow/Walnut Redevelopment Area, which is a TIF district. Revenues pay for infrastructure improvements inside or serving the TIF district. Parks Construction - To account for resources accumulating to provide for the cost of construction of the Parks.
Permanent Fund – To account for the financial resources that are legally restricted to the extent that only earnings, and not principal, may be used for purposes that support the City’s programs.
Rosehill Cemetery - To account for all resources for operation and maintenance of the City’s cemeteries
IV-8

CITY OF BLOOMINGTON, INDIANACOMBINING BALANCE SHEET
NON-MAJOR GOVERNMENTAL FUNDSDecember 31, 2005
Total Total TotalNon-major Non-major Non-major Non-major
Special Debt Service Capital Projects PermanentRevenue Funds Funds Funds Fund Totals
AssetsCash and cash equivalents 9,177,094$ 943,975$ 4,753,081 21,374$ 14,895,524$ Cash with fiscal agent - 255,000 - - 255,000 Investments - 36,300 3,607,970 550 3,644,820 Receivables (net of allowances for uncollectibles):
Interest 7,061 2,625 14,906 91 24,683 Taxes - 132,302 1,920,672 - 2,052,974 Accounts 1,500 - - - 1,500 Intergovernmental 14,643 39,551 81,594 - 135,788 Loans 4,586,355 - - - 4,586,355 Other 153,683 - - - 153,683
Land held for resale 77,650 - - - 77,650
Total assets 14,017,986$ 1,409,753$ 10,378,223$ 22,015$ 25,827,977$
Liabilities and fund balances
Liabilities:Accounts payable 238,543$ 500$ 77,853$ -$ 316,896$ Interfund payable 90,249 - - - 90,249 Deferred revenue - Unearned - 42,699 216,792 - 259,491
Total liabilities 328,792 43,199 294,645 - 666,636
Fund balances:Reserved for:
Encumbrances 264,607 - 1,130,521 - 1,395,128 Land held for resale 77,650 - - - 77,650 Noncurrent loans receivable 4,502,151 - - - 4,502,151 Debt service funds - 1,366,554 - - 1,366,554 Capital projects funds - - 8,953,057 - 8,953,057 Permanent fund - - - 5,870 5,870
Unreserved, reported in:Special revenue funds 8,844,786 - - - 8,844,786 Permanent funds - - - 16,145 16,145
Total fund balances 13,689,194 1,366,554 10,083,578 22,015 25,161,341
Total liabilities and fund balances 14,017,986$ 1,409,753$ 10,378,223$ 22,015$ 25,827,977$
IV-9

CITY OF BLOOMINGTON, INDIANACOMBINING STATEMENT OF REVENUES, EXPENDITURES AND OTHER CHANGES IN FUND BALANCES
NON-MAJOR GOVERNMENTAL FUNDSDecember 31, 2005
Total Total TotalNon-major Non-major Non-major Non-major
Special Debt Service Capital Projects PermanentRevenue Funds Funds Funds Fund Totals
Revenues:Taxes -$ 1,538,957$ 4,428,597$ -$ 5,967,554$ Intergovernmental 1,770,519 617,084 3,199,096 - 5,586,699 Charges for services 3,944,820 - - - 3,944,820 Fines and forfeits 1,008,103 - - - 1,008,103 Other 900,346 43,301 357,593 12,812 1,314,052
Total revenues 7,623,788 2,199,342 7,985,286 12,812 17,821,228
Expenditures:Current:
General government 108,167 - - - 108,167 Public safety 2,113,459 - - - 2,113,459 Highways and streets 226,552 - - - 226,552 Sanitation 1,585,167 - - - 1,585,167 Health and welfare 122,392 - - - 122,392 Culture and recreation 1,557,602 - - - 1,557,602 Urban redevelopment and housing 2,406,567 - - - 2,406,567
Debt service:Principal - 1,474,693 - - 1,474,693 Interest - 2,332,625 - - 2,332,625
Capital outlay - - 6,281,465 - 6,281,465
Total expenditures 8,119,906 3,807,318 6,281,465 - 18,208,689
Excess (deficiency) of revenuesover (under) expenditures (496,118) (1,607,976) 1,703,821 12,812 (387,461)
Other financing sources (uses):Transfers in 678,560 1,285,966 - - 1,964,526 Transfers out (114,561) - (1,290,115) - (1,404,676)
Total other financing sources and uses 563,999 1,285,966 (1,290,115) - 559,850
Net change in fund balances 67,881 (322,010) 413,706 12,812 172,389
Fund balances - beginning 13,621,313 1,688,564 9,669,872 9,203 24,988,952
Fund balances - ending 13,689,194$ 1,366,554$ 10,083,578$ 22,015$ 25,161,341$
IV-10

CITY OF BLOOMINGTON, INDIANACOMBINING BALANCE SHEETNON-MAJOR SPECIAL REVENUE FUNDSDecember 31, 2005
Park andRecreation
Parking NonrevertingEnforcement Operating CDBG
AssetsCash and cash equivalents 1,154,599$ 778,547$ 96,887$ Receivables (net of allowances for uncollectibles):
Interest - - - Accounts - - - Intergovernmental - 8,105 - Loans - - 1,011,509 Other - - -
Land held for resale - - 77,650
Total assets 1,154,599$ 786,652$ 1,186,046$
Liabilities and fund balances
Liabilities:Accounts payable 16,727$ 9,875$ 114,664$ Interfund payable 22,771 4,666 4,904
Total liabilities 39,498 14,541 119,568
Fund balances:Reserved for:
Encumbrances 20,446 - - Land held for resale - - 77,650 Noncurrent loans receivables - - 956,197
Unreserved:Undesignated 1,094,655 772,111 32,631
Total fund balances 1,115,101 772,111 1,066,478
Total liabilities and fund balances 1,154,599$ 786,652$ 1,186,046$
IV-11

CITY OF BLOOMINGTON, INDIANACOMBINING BALANCE SHEETNON-MAJOR SPECIAL REVENUE FUNDSDecember 31, 2005
AssetsCash and cash equivalentsReceivables (net of allowances for uncollectibles):
InterestAccountsIntergovernmentalLoansOther
Land held for resale
Total assets
Liabilities and fund balances
Liabilities:Accounts payableInterfund payable
Total liabilities
Fund balances:Reserved for:
EncumbrancesLand held for resaleNoncurrent loans receivables
Unreserved:Undesignated
Total fund balances
Total liabilities and fund balances
Park andRecreation
Nonreverting Child Care Law Dispatch Capital Development Enforcement Training
93,492$ -$ 177,796$ 46,027$
- - - - - - - - - - 6,538 - - - - - - - - - - - - -
93,492$ -$ 184,334$ 46,027$
-$ -$ -$ -$ - - - -
- - - -
- - - - - - - - - - - -
93,492 - 184,334 46,027
93,492 - 184,334 46,027
93,492$ -$ 184,334$ 46,027$
IV-12

CITY OF BLOOMINGTON, INDIANACOMBINING BALANCE SHEETNON-MAJOR SPECIAL REVENUE FUNDSDecember 31, 2005
AssetsCash and cash equivalentsReceivables (net of allowances for uncollectibles):
InterestAccountsIntergovernmentalLoansOther
Land held for resale
Total assets
Liabilities and fund balances
Liabilities:Accounts payableInterfund payable
Total liabilities
Fund balances:Reserved for:
EncumbrancesLand held for resaleNoncurrent loans receivables
Unreserved:Undesignated
Total fund balances
Total liabilities and fund balances
Industrial Nonreverting SpecialTelecommunications Incentive Economic Nonreverting
Nonreverting Loan Development Improvement I
1,112,220$ 671,840$ 11,350$ 1,086,763$
4,150 172 - 1,940 - - - - - - - - - 20,671 - -
153,683 - - - - - - -
1,270,053$ 692,683$ 11,350$ 1,088,703$
24,489$ 25,000$ -$ 12,869$ - - - -
24,489 25,000 - 12,869
57,757 - - 490 - - - - - - - -
1,187,807 667,683 11,350 1,075,344
1,245,564 667,683 11,350 1,075,834
1,270,053$ 692,683$ 11,350$ 1,088,703$
IV-13

CITY OF BLOOMINGTON, INDIANACOMBINING BALANCE SHEETNON-MAJOR SPECIAL REVENUE FUNDSDecember 31, 2005
AssetsCash and cash equivalentsReceivables (net of allowances for uncollectibles):
InterestAccountsIntergovernmentalLoansOther
Land held for resale
Total assets
Liabilities and fund balances
Liabilities:Accounts payableInterfund payable
Total liabilities
Fund balances:Reserved for:
EncumbrancesLand held for resaleNoncurrent loans receivables
Unreserved:Undesignated
Total fund balances
Total liabilities and fund balances
Park andPolice Amethyst Recreation
Education House Land Acquisition H.O.M.E.
67,838$ 2,833$ 739,455$ 127,260$
- - 189 - - - - - - - - - - - - 3,554,175 - - - - - - - -
67,838$ 2,833$ 739,644$ 3,681,435$
40$ -$ -$ 14,682$ - - - 7,329
40 - - 22,011
- - - - - - - - - - - 3,545,954
67,798 2,833 739,644 113,470
67,798 2,833 739,644 3,659,424
67,838$ 2,833$ 739,644$ 3,681,435$
IV-14

CITY OF BLOOMINGTON, INDIANACOMBINING BALANCE SHEETNON-MAJOR SPECIAL REVENUE FUNDSDecember 31, 2005
AssetsCash and cash equivalentsReceivables (net of allowances for uncollectibles):
InterestAccountsIntergovernmentalLoansOther
Land held for resale
Total assets
Liabilities and fund balances
Liabilities:Accounts payableInterfund payable
Total liabilities
Fund balances:Reserved for:
EncumbrancesLand held for resaleNoncurrent loans receivables
Unreserved:Undesignated
Total fund balances
Total liabilities and fund balances
Unsafe Solid Community AlternativeHousing Waste Services Transportation
145,710$ 133,760$ 22,995$ 159,114$
- 18 - - - 1,500 - - - - - - - - - - - - - - - - - -
145,710$ 135,278$ 22,995$ 159,114$
1,077$ 13,769$ -$ 5,351$ 382 43,030 - -
1,459 56,799 - 5,351
- 40,489 - 145,425 - - - - - - - -
144,251 37,990 22,995 8,338
144,251 78,479 22,995 153,763
145,710$ 135,278$ 22,995$ 159,114$
IV-15

CITY OF BLOOMINGTON, INDIANACOMBINING BALANCE SHEETNON-MAJOR SPECIAL REVENUE FUNDSDecember 31, 2005
AssetsCash and cash equivalentsReceivables (net of allowances for uncollectibles):
InterestAccountsIntergovernmentalLoansOther
Land held for resale
Total assets
Liabilities and fund balances
Liabilities:Accounts payableInterfund payable
Total liabilities
Fund balances:Reserved for:
EncumbrancesLand held for resaleNoncurrent loans receivables
Unreserved:Undesignated
Total fund balances
Total liabilities and fund balances
Public Arts CommissionRainy Day Technology Operating
2,313,764$ 11,775$ 131,611$
592 - - - - - - - - - - - - - - - - -
2,314,356$ 11,775$ 131,611$
-$ -$ -$ - - -
- - -
- - - - - - - - -
2,314,356 11,775 131,611
2,314,356 11,775 131,611
2,314,356$ 11,775$ 131,611$
IV-16

CITY OF BLOOMINGTON, INDIANACOMBINING BALANCE SHEETNON-MAJOR SPECIAL REVENUE FUNDSDecember 31, 2005
AssetsCash and cash equivalentsReceivables (net of allowances for uncollectibles):
InterestAccountsIntergovernmentalLoansOther
Land held for resale
Total assets
Liabilities and fund balances
Liabilities:Accounts payableInterfund payable
Total liabilities
Fund balances:Reserved for:
EncumbrancesLand held for resaleNoncurrent loans receivables
Unreserved:Undesignated
Total fund balances
Total liabilities and fund balances
Wireless Enhanced Restricted911 Nonreverting Donation Totals
89,463$ 1,995$ 9,177,094$
- - 7,061 - - 1,500 - - 14,643 - - 4,586,355 - - 153,683 - - 77,650
89,463$ 1,995$ 14,017,986$
-$ -$ 238,543 7,167 - 90,249
7,167 - 328,792
- - 264,607 - - 77,650 - - 4,502,151
82,296 1,995 8,844,786
82,296 1,995 13,689,194
89,463$ 1,995$ 14,017,986$
IV-17

CITY OF BLOOMINGTON, INDIANACOMBINING STATEMENT OF REVENUES, EXPENDITURES AND OTHER CHANGES IN FUND BALANCESNON-MAJOR SPECIAL REVENUE FUNDSFor the Year Ended December 31, 2005
Park and Park andRecreation Recreation
Parking Nonreverting NonrevertingEnforcement Operating CDBG Capital
Revenues:Intergovernmental -$ 59,258$ 672,794$ -$ Charges for services 992,529 945,361 - - Fines and forfeits 942,246 - - - Other 7,072 43,265 189,114 -
Total revenues 1,941,847 1,047,884 861,908 -
Expenditures:Current:
General government - - - - Public safety 1,813,792 - - - Highways and streets - - - - Sanitation - - - - Health and welfare - - - - Culture and recreation - 1,059,320 - - Urban redevelopment and housing - - 1,263,923 -
Total expenditures 1,813,792 1,059,320 1,263,923 -
Excess (deficiency) of revenuesover (under) expenditures 128,055 (11,436) (402,015) -
Other financing sources (uses):Transfers in - - - 14,491 Transfers out (100,000) (14,491) - -
Total other financing sources and uses (100,000) (14,491) - 14,491
Net change in fund balances 28,055 (25,927) (402,015) 14,491
Fund balances - beginning 1,087,046 798,038 1,468,493 79,001
Fund balances - ending 1,115,101$ 772,111$ 1,066,478$ 93,492$
IV-18

CITY OF BLOOMINGTON, INDIANACOMBINING STATEMENT OF REVENUES, EXPENDITURES AND OTHER CHANGES IN FUND BALANCESNON-MAJOR SPECIAL REVENUE FUNDSFor the Year Ended December 31, 2005
Child Care Law Dispatch TelecommunicationsDevelopment Enforcement Training Nonreverting
Revenues:Intergovernmental 55,890$ 6,538$ -$ 1,800$ Charges for services - - - 594,071 Fines and forfeits - - 12,400 - Other 66 103,728 31 39,900
Total revenues 55,956 110,266 12,431 635,771
Expenditures:Current:
General government - - - - Public safety - 70,362 7,249 - Highways and streets - - - - Sanitation - - - - Health and welfare 73,487 - - Culture and recreation - - - 439,766 Urban redevelopment and housing - - - -
Total expenditures 73,487 70,362 7,249 439,766
Excess (deficiency) of revenuesover (under) expenditures (17,531) 39,904 5,182 196,005
Other financing sources (uses):Transfers in 9,920 - - - Transfers out (70) - - -
Total other financing sources and uses 9,850 - - -
Net change in fund balances (7,681) 39,904 5,182 196,005
Fund balances - beginning 7,681 144,430 40,845 1,049,559
Fund balances - ending -$ 184,334$ 46,027$ 1,245,564$
IV-19

CITY OF BLOOMINGTON, INDIANACOMBINING STATEMENT OF REVENUES, EXPENDITURES AND OTHER CHANGES IN FUND BALANCESNON-MAJOR SPECIAL REVENUE FUNDSFor the Year Ended December 31, 2005
Industrial Nonreverting SpecialIncentive Economic Nonreverting Police
Loan Development Improvement I EducationRevenues:
Intergovernmental -$ -$ -$ -$ Charges for services - - 139,080 17,035 Fines and forfeits - - - 11,682 Other 22,358 - 35,513 120
Total revenues 22,358 - 174,593 28,837
Expenditures:Current:
General government - - 102,177 - Public safety - - - 20,542 Highways and streets - - - - Sanitation - - - - Health and welfare - - - - Culture and recreation - - - - Urban redevelopment and housing 62,550 - - -
Total expenditures 62,550 - 102,177 20,542
Excess (deficiency) of revenuesover (under) expenditures (40,192) - 72,416 8,295
Other financing sources (uses):Transfers in - - - Transfers out - - - -
Total other financing sources and uses - - - -
Net change in fund balances (40,192) - 72,416 8,295
Fund balances - beginning 707,875 11,350 1,003,418 59,503
Fund balances - ending 667,683$ 11,350$ 1,075,834$ 67,798$
IV-20

CITY OF BLOOMINGTON, INDIANACOMBINING STATEMENT OF REVENUES, EXPENDITURES AND OTHER CHANGES IN FUND BALANCESNON-MAJOR SPECIAL REVENUE FUNDSFor the Year Ended December 31, 2005
Park andAmethyst Recreation Unsafe
House Land Acquisition H.O.M.E. HousingRevenues:
Intergovernmental -$ -$ 974,239$ -$ Charges for services - - - - Fines and forfeits - - - 41,775 Other - 25,911 297,715 86
Total revenues - 25,911 1,271,954 41,861
Expenditures:Current:
General government - - - - Public safety - - - 35,541 Highways and streets - - - - Sanitation - - - - Health and welfare - - - - Culture and recreation - 58,479 - - Urban redevelopment and housing 934 - 1,079,160 -
Total expenditures 934 58,479 1,079,160 35,541
Excess (deficiency) of revenuesover (under) expenditures (934) (32,568) 192,794 6,320
Other financing sources (uses):Transfers in - 124,149 - - Transfers out - - - -
Total other financing sources and uses - 124,149 - -
Net change in fund balances (934) 91,581 192,794 6,320
Fund balances - beginning 3,767 648,063 3,466,630 137,931
Fund balances - ending 2,833$ 739,644$ 3,659,424$ 144,251$
IV-21

CITY OF BLOOMINGTON, INDIANACOMBINING STATEMENT OF REVENUES, EXPENDITURES AND OTHER CHANGES IN FUND BALANCESNON-MAJOR SPECIAL REVENUE FUNDSFor the Year Ended December 31, 2005
Solid Community Alternative PublicWaste Services Transportation Rainy Day Technology
Revenues:Intergovernmental -$ -$ -$ -$ -$ Charges for services 1,118,605 - - - 1,915 Fines and forfeits - - - - - Other 18,476 30,847 - 78,159 -
Total revenues 1,137,081 30,847 - 78,159 1,915
Expenditures:Current:
General government - - - - - Public safety - - - - - Highways and streets - - 226,552 - - Sanitation 1,585,167 - - - - Health and welfare - 48,905 - - - Culture and recreation - - - - Urban redevelopment and hous - - - - -
Total expenditures 1,585,167 48,905 226,552 - -
Excess (deficiency) of revenuesover (under) expenditures (448,086) (18,058) (226,552) 78,159 1,915
Other financing sources (uses):Transfers in 430,000 - 100,000 - - Transfers out - - - - -
Total other financing sources an 430,000 - 100,000 - -
Net change in fund balances (18,086) (18,058) (126,552) 78,159 1,915
Fund balances - beginning 96,565 41,053 280,315 2,236,197 9,860
Fund balances - ending 78,479$ 22,995$ 153,763$ 2,314,356$ 11,775$
IV-22

CITY OF BLOOMINGTON, INDIANACOMBINING STATEMENT OF REVENUES, EXPENDITURES AND OTHER CHANGES IN FUND BALANCESNON-MAJOR SPECIAL REVENUE FUNDSFor the Year Ended December 31, 2005
Arts Commission Wireless Enhanced RestrictedOperating 911 Nonreverting Donation Total
Revenues:Intergovernmental -$ -$ -$ 1,770,519$ Charges for services 733 135,491 - 3,944,820 Fines and forfeits - - - 1,008,103 Other - - 7,985 900,346
Total revenues 733 135,491 7,985 7,623,788
Expenditures:Current:
General government - - 5,990 108,167 Public safety - 165,973 - 2,113,459 Highways and streets - - - 226,552 Sanitation - - - 1,585,167 Health and welfare - - - 122,392 Culture and recreation 37 - - 1,557,602 Urban redevelopment and housing - - - 2,406,567
Total expenditures 37 165,973 5,990 8,119,906
Excess (deficiency) of revenuesover (under) expenditures 696 (30,482) 1,995 (496,118)
Other financing sources (uses):Transfers in - - - 678,560 Transfers out - - - (114,561)
Total other financing sources and uses - - - 563,999
Net change in fund balances 696 (30,482) 1,995 67,881
Fund balances - beginning 130,915 112,778 - 13,621,313
Fund balances - ending 131,611$ 82,296$ 1,995$ 13,689,194$
IV-23

CITY OF BLOOMINGTON, INDIANACOMBINING BALANCE SHEET
NON-MAJOR DEBT SERVICE FUNDDecember 31, 2005
Park RedevelopmentDistrict District Municipal GolfBond Bond Street Bond Facilities Course Bond Totals
AssetsCash and cash equivalents 124,281$ 275,615$ 41$ 162,480$ 381,558$ 943,975$ Cash with fiscal agent - - 255,000 - - 255,000 Investments - - 36,300 - - 36,300 Receivables (net of allowances for uncollectibles):
Interest 89 1,006 10 124 1,396 2,625 Taxes 58,533 - 17,080 56,689 - 132,302 Intergovernmental 13,659 - 16,533 9,359 - 39,551
Total assets 196,562$ 276,621$ 324,964$ 228,652$ 382,954$ 1,409,753$
Liabilities and fund balances
Liabilities: Accounts Payable - 500 - - - 500
Deferred Revenue - Unavailable 14,120$ -$ 17,080$ 11,499 - 42,699
Total liabilities 14,120 500 17,080 11,499 - 43,199
Fund balances:Reserved for:
Debt service 182,442 276,121 307,884 217,153 382,954 1,366,554
Total fund balances 182,442 276,121 307,884 217,153 382,954 1,366,554
Total liabilities and fund balances 196,562$ 276,621$ 324,964$ 228,652$ 382,954$ 1,409,753$
IV-24

CITY OF BLOOMINGTON, INDIANACOMBINING STATEMENT OF REVENUES, EXPENDITURES AND OTHER CHANGES IN FUND BALANCES
NON-MAJOR DEBT SERVICE FUNDSFor the Year Ended December 31, 2005
Park RedevelopmentDistrict District Municipal GolfBond Bond Street Bond Facilities Course Bond Totals
Revenues:Taxes 555,601$ -$ 602,667$ 380,689$ -$ 1,538,957$ Intergovernmental 42,634 - 45,239 529,211 - 617,084 Other 561 9,123 3,102 17,085 13,430 43,301
Total revenues 598,796 9,123 651,008 926,985 13,430 2,199,342
Expenditures:Debt service:
Principal 410,000 145,000 70,000 839,693 10,000 1,474,693 Interest 224,155 108,966 352,375 1,528,307 118,822 2,332,625
Total expenditures 634,155 253,966 422,375 2,368,000 128,822 3,807,318
Excess (deficiency) of revenuesover (under) expenditures (35,359) (244,843) 228,633 (1,441,015) (115,392) (1,607,976)
Other financing sources (uses):Transfers in - 252,966 - 913,000 120,000 1,285,966
Total other financing sources and us - 252,966 - 913,000 120,000 1,285,966
Net change in fund balances (35,359) 8,123 228,633 (528,015) 4,608 (322,010)
Fund balances - beginning 217,801 267,998 79,251 745,168 378,346 1,688,564
Fund balances - ending 182,442$ 276,121$ 307,884$ 217,153$ 382,954$ 1,366,554$
IV-25

CITY OF BLOOMINGTON, INDIANACOMBINING BALANCE SHEET
NON-MAJOR CAPITAL PROJECTS FUNDSDecember 31, 2005
Cumulative CumulativeCapital Capital Redevelopment
Improvement Development TIF DowntownAssetsCash and cash equivalents 4,391$ 742,184$ 114,485$ Investments - - - Receivables (net of allowances for
uncollectibles):Interest - - 412 Taxes - 98,945 539,400 Intergovernmental 42,261 19,920 8,410 Interfund - - -
Total assets 46,652$ 861,049$ 662,707$
Liabilities and fund balances
Liabilities:Accounts payable -$ 10,925$ 748$ Interfund payable - - - Unearned revenue - 26,634 59,013
Total liabilities - 37,559 59,761
Fund balances:Reserved for:
Encumbrances - 809,827 - Capital projects funds 46,652 13,663 602,946
Total fund balances 46,652 823,490 602,946
Total liabilities and fund balances 46,652$ 861,049$ 662,707$
IV-26

CITY OF BLOOMINGTON, INDIANACOMBINING BALANCE SHEET
NON-MAJOR CAPITAL PROJECTS FUNDSDecember 31, 2005
AssetsCash and cash equivalentsInvestmentsReceivables (net of allowances for
uncollectibles):InterestTaxesIntergovernmentalInterfund
Total assets
Liabilities and fund balances
Liabilities:Accounts payableInterfund payableUnearned revenue
Total liabilities
Fund balances:Reserved for:
EncumbrancesCapital projects funds
Total fund balances
Total liabilities and fund balances
CumulativeCapital Street Fire Redevelopment
Equipment Construction Capital TIF Tapp
920,472$ -$ 109,036$ 902,133$ - - - 714,200
- - 27 90 47,038 - - 122,845 11,003 - - -
- - - -
978,513$ -$ 109,063$ 1,739,268$
40,454$ -$ -$ -$ - - - -
12,733 - - 8,057
53,187 - - 8,057
320,694 - - - 604,632 - 109,063 1,731,211
925,326 - 109,063 1,731,211
978,513$ -$ 109,063$ 1,739,268$
IV-27

CITY OF BLOOMINGTON, INDIANACOMBINING BALANCE SHEET
NON-MAJOR CAPITAL PROJECTS FUNDSDecember 31, 2005
AssetsCash and cash equivalentsInvestmentsReceivables (net of allowances for
uncollectibles):InterestTaxesIntergovernmentalInterfund
Total assets
Liabilities and fund balances
Liabilities:Accounts payableInterfund payableUnearned revenue
Total liabilities
Fund balances:Reserved for:
EncumbrancesCapital projects funds
Total fund balances
Total liabilities and fund balances
Redevelopment Redevelopment Technology IndustrialTIF Adams TIF Prow Park Development
50,318$ 40,291$ 44,257$ 381,194$ 501,950 240,800 - -
1,250 759 164 1,857 241,803 24,431 - -
- - - - - - - -
795,321$ 306,281$ 44,421$ 383,051$
-$ -$ -$ -$ - - - -
18,099 2,106 - -
18,099 2,106 - -
- - - - 777,222 304,175 44,421 383,051
777,222 304,175 44,421 383,051
795,321$ 306,281$ 44,421$ 383,051$
IV-28

CITY OF BLOOMINGTON, INDIANACOMBINING BALANCE SHEET
NON-MAJOR CAPITAL PROJECTS FUNDSDecember 31, 2005
AssetsCash and cash equivalentsInvestmentsReceivables (net of allowances for
uncollectibles):InterestTaxesIntergovernmentalInterfund
Total assets
Liabilities and fund balances
Liabilities:Accounts payableInterfund payableUnearned revenue
Total liabilities
Fund balances:Reserved for:
EncumbrancesCapital projects funds
Total fund balances
Total liabilities and fund balances
RedevelopmentRedevelopment TIF Thomson - ParkTIF Whitehall Winslow - Walnut Construction Totals
976,270$ 80,895$ 387,155$ 4,753,081$ 1,180,600 970,420 - 3,607,970
7,944 2,305 98 14,906 465,926 380,284 - 1,920,672
- - - 81,594 - - - -
2,630,740$ 1,433,904$ 387,253$ 10,378,223$
-$ 25,726$ -$ 77,853$ - - - -
44,373 45,777 - 216,792
44,373 71,503 - 294,645
- - - 1,130,521 2,586,367 1,362,401 387,253 8,953,057
2,586,367 1,362,401 387,253 10,083,578
2,630,740$ 1,433,904$ 387,253$ 10,378,223$
IV-29

CITY OF BLOOMINGTON, INDIANACOMBINING STATEMENT OF REVENUES, EXPENDITURES AND OTHER CHANGES IN FUND BALANCESNON-MAJOR CAPITAL PROJECTS FUNDSFor the Year Ended December 31, 2005
Cumulative Cumulative CumulativeCapital Capital Redevelopment Capital
Improvement Development TIF Downtown EquipmentRevenues:
Taxes -$ 810,251$ 872,301$ 447,567$ Intergovernmental 256,459 62,174 4,000 34,344 Other 1,501 441 4,379 335
Total revenues 257,960 872,866 880,680 482,246
Expenditures:Capital outlay 270,000 853,638 221,334 125,518
Total expenditures 270,000 853,638 221,334 125,518
Excess (deficiency) of revenuesover (under) expenditures (12,040) 19,228 659,346 356,728
Other financing uses:Transfers out - (124,149) (169,000) -
Total other financing sources and uses - (124,149) (169,000) -
Net change in fund balances (12,040) (104,921) 490,346 356,728
Fund balances - beginning 58,692 928,411 112,600 568,598
Fund balances - ending 46,652$ 823,490$ 602,946$ 925,326$
IV-30

CITY OF BLOOMINGTON, INDIANACOMBINING STATEMENT OF REVENUES, EXPENDITURES AND OTHER CHANGES IN FUND BALANCESNON-MAJOR CAPITAL PROJECTS FUNDSFor the Year Ended December 31, 2005
Street Fire Redevelopment RedevelopmentConstruction Capital TIF Southwest TIF Adams
Revenues:Taxes -$ -$ 205,799$ 401,067$ Intergovernmental - - - - Other 44 3,684 47,915 17,631
Total revenues 44 3,684 253,714 418,698
Expenditures:Capital outlay 46,379 - 41,152 21,048
Total expenditures 46,379 - 41,152 21,048
Excess (deficiency) of revenuesover (under) expenditures (46,335) 3,684 212,562 397,650
Other financing uses:Transfers out - - - (100,000)
Total other financing sources and uses - - - (100,000)
Net change in fund balances (46,335) 3,684 212,562 297,650
Fund balances - beginning 46,335 105,379 1,518,649 479,572
Fund balances - ending -$ 109,063$ 1,731,211$ 777,222$
IV-31

CITY OF BLOOMINGTON, INDIANACOMBINING STATEMENT OF REVENUES, EXPENDITURES AND OTHER CHANGES IN FUND BALANCESNON-MAJOR CAPITAL PROJECTS FUNDSFor the Year Ended December 31, 2005
Redevelopment Technology Industrial RedevelopmentTIF Prow Park Development TIF Whitehall
Revenues:Taxes 40,023$ -$ -$ 972,739$ Intergovernmental - - 250,000 - Other 9,310 1,500 28,233 66,317
Total revenues 49,333 1,500 278,233 1,039,056
Expenditures:Capital outlay - - 1,047,877 -
Total expenditures - - 1,047,877 -
Excess (deficiency) of revenuesover (under) expenditures 49,333 1,500 (769,644) 1,039,056
Other financing uses:Transfers out - - - (441,966)
Total other financing sources and uses - - - (441,966)
Net change in fund balances 49,333 1,500 (769,644) 597,090
Fund balances - beginning 254,842 42,921 1,152,695 1,989,277
Fund balances - ending 304,175$ 44,421$ 383,051$ 2,586,367$
IV-32

CITY OF BLOOMINGTON, INDIANACOMBINING STATEMENT OF REVENUES, EXPENDITURES AND OTHER CHANGES IN FUND BALANCESNON-MAJOR CAPITAL PROJECTS FUNDSFor the Year Ended December 31, 2005
RedevelopmentTIF Thomson - Park
Winslow - Walnut Construction TotalsRevenues:
Taxes 678,850$ -$ 4,428,597$ Intergovernmental 2,592,119 - 3,199,096 Other 149,080 27,223 357,593
Total revenues 3,420,049 27,223 7,985,286
Expenditures:Capital outlay 3,044,680 609,839 6,281,465
Total expenditures 3,044,680 609,839 6,281,465
Excess (deficiency) of revenuesover (under) expenditures 375,369 (582,616) 1,703,821
Other financing uses:Transfers out (455,000) - (1,290,115)
Total other financing sources and uses (455,000) - (1,290,115)
Net change in fund balances (79,631) (582,616) 413,706
Fund balances - beginning 1,442,032 969,869 9,669,872
Fund balances - ending 1,362,401$ 387,253$ 10,083,578$
IV-33

CITY OF BLOOMINGTON, INDIANABUDGETARY COMPARISON SCHEDULESNON-MAJOR BUDGETED SPECIAL REVENUE FUNDSFor The Year Ended December 31, 2005
Variance with Variance withFinal Budget- Final Budget-
Positive PositiveOriginal Final Actual (Negative) Original Final Actual (Negative)
Revenues:Intergovernmental -$ -$ -$ -$ -$ -$ 1,800$ 1,800$ Charges for services 1,160,000 1,160,000 1,119,595 (40,406) 590,000 590,000 593,359 3,359 Other 16,000 16,000 17,398 1,398 10,000 10,000 35,949 25,949
Total revenues 1,176,000 1,176,000 1,136,992 (39,008) 600,000 600,000 631,108 29,308
Expenditures:Current:
Sanitation: Personal services 981,941 989,958 982,379 7,579 - - - - Supplies 79,200 75,314 68,604 6,710 - - - - Other services and charges 628,642 600,039 490,252 109,787 - - - - Capital outlay 29,979 29,979 29,979 - - - - - Culture and recreation: Supplies - 1,000 1,000 77 923 Other services and charges - 435,680 435,110 424,364 10,746 Capital outlay - - - - 92,669 98,802 87,855 10,946
Total expenditures 1,719,762 1,695,290 1,571,214 124,076 529,349 534,911 512,296 22,615
Other financing sources (uses):Transfers in 430,000 430,000 430,000 - - - - -
Total other financing sources (uses) 430,000 430,000 430,000 - - - - - Sa e o __
Net change in fund balances (113,762) (89,290) (4,222) 85,068 70,651 65,089 118,812 51,923
Fund balances - beginning 137,981 137,981 137,981 - 993,408 993,408 993,408 -
Fund balances - ending 24,219$ 48,691$ 133,759$ 85,068$ 1,064,059$ 1,058,497$ 1,112,220$ 51,923$
Variance with Variance withFinal Budget- Final Budget-
Positive PositiveOriginal Final Actual (Negative) Original Final Actual (Negative)
Revenues:Taxes -$ -$ -$ -$ -$ -$ 139,080$ 139,080$ Intergovernmental - - Other - - - - 210,460 210,460 33,580 (176,880)
Total revenues - - - - 210,460 210,460 172,660 (37,800)
Expenditures:Current:
Urban Redevelopment: Other services and charges - - - - 93,200 92,710 92,710 - Highways: Capital outlay 246,016 236,015 235,680 335 - - - -
Total expenditures 246,016 236,015 235,680 335 93,200 92,710 92,710 -
Other financing sources (uses):Transfers in 100,000 100,000 100,000 - - - - -
Total other financing sources (uses) 100,000 100,000 100,000 - - - - - Sa e o __Net change in fund balances (146,016) (136,015) (135,680) 335 117,260 117,750 79,950 (37,800)
Fund balances - beginning 294,793 294,793 294,793 - - - - - Cumulative effect of change in accounting pr - - - - - - - -
Total beginning fund balance - restated 294,793 294,793 294,793 - - - - -
Fund balances - ending 148,777$ 158,778$ 159,113$ 335$ 117,260$ 117,750$ 79,950$ (37,800)$
Alternative Transportation Nonreverting Improvement I
Budgeted Amounts Budgeted Amounts
Solid Waste Telecommunications Nonreverting
Budgeted Amounts Budgeted Amounts
IV-34

CITY OF BLOOMINGTON, INDIANABUDGETARY COMPARISON SCHEDULESNON-MAJOR BUDGETED SPECIAL REVENUE FUNDSFor The Year Ended December 31, 2005
Variance with Variance withFinal Budget- Final Budget-
Positive PositiveOriginal Final Actual (Negative) Original Final Actual (Negative)
Revenues:Charges for services 764,000$ 764,000$ 992,529$ 228,529$ -$ -$ -$ -$ Fines and forfeits 900,000 900,000 942,246 42,246 8,000 8,000 12,400 4,400 Other 492,044 492,044 7,071 (484,973) - - 31 31
Total revenues 2,156,044 2,156,044 1,941,846 (214,198) 8,000 8,000 12,431 4,431
Expenditures:Current:
Public safety: Personal services 664,233 681,148 641,831 39,317 - - - - Supplies 87,107 86,041 42,525 43,516 - - - - Other services and charges 1,400,121 1,380,741 1,108,504 272,238 8,000 8,000 7,249 751 Capital outlay 66,963 66,963 35,567 31,396 - - - -
- - - - - - - - Total expenditures 2,218,424 2,214,893 1,828,427 386,466 8,000 8,000 7,249 751
Other financing sources (uses):Transfers in - - - - - - - - Transfers out 100,000 100,000 100,000 - - - - -
Total other financing sources (uses) 100,000 100,000 100,000 - - - - -
Net change in fund balances 37,620 41,151 213,420 172,268 - - 5,182 5,182
Fund balances - beginning 1,138,969 1,138,969 1,138,969 - 40,845 40,845 40,845 -
Fund balances - ending 1,176,589$ 1,180,120$ 1,352,389$ 172,268$ 40,845$ 40,845$ 46,027$ 5,182$
Variance with Variance withFinal Budget- Final Budget-
Positive PositiveRevenues: Original Final Actual (Negative) Original Final Actual (Negative)
TaxesIntergovernmental 114,000$ 114,000$ -$ (114,000)$ -$ -$ -$ -$ Charges for services - - - -$ - - - - Charges for services - - 135,491 135,491$ - - 17,034 17,034 Fines and forfeits - - - - 9,500 9,500 11,682 2,182 Other - - - - - - 120 120
Total revenues 114,000 114,000 135,491 21,491 9,500 9,500 28,837 19,337
Expenditures:Current:
Public safety: Personal services 161,599 164,344 164,070 274 - - - - Other services and charges - - - - 25,454 21,569 20,502 1,067
- - - - - - - - Total expenditures 161,599 164,344 164,070 274 25,454 21,569 20,502 1,067
Net change in fund balances (47,599) (50,344) (28,579) 21,765 (15,954) (12,069) 8,335 20,404
Fund balances - beginning 118,042 118,042 118,042 - 59,503 59,503 59,503 -
Fund balances - ending 70,443 67,698 89,463 21,765 43,549 47,434 67,838 20,404
Wireless Enhanced 911 Nonreverting Police Education
Budgeted Amounts Budgeted Amounts
Parking Enforcement Dispatch Training
Budgeted Amounts Budgeted Amounts
IV-35

CITY OF BLOOMINGTON, INDIANABUDGETARY COMPARISON SCHEDULESNON-MAJOR BUDGETED SPECIAL REVENUE FUNDSFor The Year Ended December 31, 2005
Variance with Variance withFinal Budget- Final Budget-
Positive PositiveOriginal Final Actual (Negative) Original Final Actual (Negative)
Revenues:Charges for services -$ -$ -$ -$ -$ -$ 733$ 733$
Total revenues - - - - - - 733 733
Expenditures:Current:
Culture and recreation: Supplies - - - - 2,000 2,000 37 1,963 Other services and charges - 5,000 - 5,000 3,000 3,000 - 3,000
Total expenditures - 5,000 - 5,000 5,000 5,000 37 4,963
Net change in fund balances - (5,000) - 5,000 (5,000) (5,000) 696 5,696
Fund balances - beginning - - - - - - - -
Fund balances - ending -$ (5,000)$ -$ 5,000$ (5,000)$ (5,000)$ 696$ 5,696$
Municipal Arts Arts Commission Operating
Budgeted Amounts Budgeted Amounts
IV-36

CITY OF BLOOMINGTON, INDIANABUDGETARY COMPARISON SCHEDULESNON-MAJOR BUDGETED DEBT SERVICE FUNDSFor The Year Ended December 31, 2005
Variance with Variance withFinal Budget- Final Budget-
Positive PositiveOriginal Final Actual (Negative) Original Final Actual (Negative)
Revenues:Taxes 388,869$ 388,869$ 335,499$ (53,370) 567,538$ 567,538$ 511,188$ (56,350)$ Intergovernmental 529,129 529,129 519,852 (9,277) 42,218 42,218 28,975 (13,243) Other 17,100 17,100 20,028 2,928 500 500 781 281
Total revenues 935,098 935,098 875,379 (59,719) 610,256 610,256 540,944 (69,312)
Expenditures:Current:
Debt Service: Principal Retirement - - - - 410,000 410,000 410,000 - Interest and Fiscal Charges - - - - 224,755 224,755 224,155 600 Lease Payments 2,368,000 2,368,000 2,368,000 - - - - - Total expenditures 2,368,000 2,368,000 2,368,000 - 634,755 634,755 634,155 600
Other financing sources (uses):Transfers in 913,000 - 913,000 913,000 - - - -
Total other financing sources (uses) 913,000 - 913,000 913,000 - - - -
Net change in fund balances (519,902) (1,432,902) (579,621) 853,281 (24,499) (24,499) (93,211) (68,712)
Fund balances - beginning 742,100 742,100 742,100 - 217,492 217,492 217,492 -
Fund balances - ending 222,198$ (690,802)$ 162,479$ 853,281$ 192,993$ 192,993$ 124,281$ (68,712)$
Variance with Variance withFinal Budget- Final Budget-
Positive PositiveOriginal Final Actual (Negative) Original Final Actual (Negative)
Revenues:Taxes 562,283$ 562,283$ 602,667$ 40,384$ -$ -$ -$ -$ Intergovernmental 41,850 41,850 28,706 (13,144) - - - - Other 150 150 3,093 2,943 7,500 7,500 13,231 5,731
Total revenues 604,283 604,283 634,466 30,183 7,500 7,500 13,231 5,731
Expenditures:Current:
Debt Service: Principal Retirement 255,000 255,000 255,000 - 10,000 10,000 10,000 - Interest and Fiscal Charges 353,375 353,375 352,375 1,000 118,913 118,913 118,822 91 Total expenditures 608,375 608,375 607,375 1,000 128,913 128,913 128,822 91
Other financing sources (uses):Transfers in - - - - 120,000 120,000 120,000 -
Total other financing sources (uses) - - - - 120,000 120,000 120,000 -
Net change in fund balances (4,092) (4,092) 27,091 31,183 (1,413) (1,413) 4,409 5,822
Fund balances - beginning 9,250 9,250 9,250 - 377,149 377,149 377,149 -
Fund balances - ending 5,158$ 5,158$ 36,341$ 31,183$ 375,736$ 375,736$ 381,558$ 5,822$
Street Bond Golf Course Bond
Budgeted Amounts Budgeted Amounts
Municipal Facilities Park District Bond
Budgeted Amounts Budgeted Amounts
IV-37

CITY OF BLOOMINGTON, INDIANABUDGETARY COMPARISON SCHEDULESNON-MAJOR BUDGETED DEBT SERVICE FUNDSFor The Year Ended December 31, 2005
Variance withFinal Budget-
PositiveOriginal Final Actual (Negative)
Revenues:Other 6,000$ 6,000$ 8,393$ 2,393$
Total revenues 6,000 6,000 8,393 2,393
Expenditures:Current:
Debt Service: Principal Retirement 145,000 145,000 145,000 - Interest and Fiscal Charges 108,967 108,967 108,466 501 Total expenditures 253,967 253,967 253,466 501
Other financing sources (uses):Transfers in 252,966 252,966 252,966 -
Total other financing sources (uses) 252,966 252,966 252,966 -
Net change in fund balances 4,999 4,999 7,893 2,894
Fund balances - beginning 262,197 262,197 262,197 -
Total beginning fund balance - restated 262,197 262,197 262,197 -
Fund balances - ending 267,196$ 267,196$ 270,090$ 2,894$
Redevelopment District Bond
Budgeted Amounts
IV-38

CITY OF BLOOMINGTON, INDIANABUDGETARY COMPARISON SCHEDULESNON-MAJOR BUDGETED CAPITAL PROJECTS FUNDSFor The Year Ended December 31, 2005
Variance with Variance withFinal Budget- Final Budget-
Positive PositiveOriginal Final Actual (Negative) Original Final Actual (Negative)
Revenues:Taxes -$ -$ -$ -$ 827,660$ 827,660$ 737,940$ (89,720)$ Intergovernmental 260,600 260,600 214,198 (46,402) 92,179 92,179 42,255 (49,924) Other - - 1,502 1,502 - - 440 440
Total revenues 260,600 260,600 215,700 (44,900) 919,839 919,839 780,635 (139,204)
Expenditures:Current:
Capital Outlays Supplies 280,000 280,000 270,000 10,000 - - - - Other services and charges - - - 403,360 294,423 169,117 125,306 Capital Outlays - - - - 1,423,174 722,285 706,476 15,809
Total expenditures 280,000 280,000 270,000 10,000 1,826,535 1,016,708 875,593 141,115
Other financing sources (uses):Transfers out - - - - 124,149 124,149 124,149 -
Total other financing sources (uses) - - - - 124,149 124,149 124,149 -
Net change in fund balances (19,400) (19,400) (54,300) (34,900) (782,547) 27,280 29,191 1,911 Fund balances - beginning 58,692 58,692 58,692 - 961,291 961,291 961,291 -
Fund balances - ending 39,292$ 39,292$ 4,392$ (34,900)$ 178,744$ 988,571$ 990,482$ 1,911$
Cumulative Capital Equipment
Variance withFinal Budget-
PositiveOriginal Final Actual (Negative)
Revenues:Taxes 457,183$ 457,183$ 413,262$ (43,921)$ Intergovernmental 35,581 35,581 23,341 (12,240) Other - - 335 335
Total revenues 492,764 492,764 436,938 (55,826)
Expenditures:Current:
Capital Outlays Other services and charges 286,750 246,940 60,189 186,751 Capital outlay 312,343 31,459 31,458 1 Total expenditures 599,093 278,399 91,647 186,752
Net change in fund balances (106,329) 214,365 345,291 130,925
Fund balances - beginning 575,181 575,181 575,181 -
Total beginning fund balance - restated 575,181 575,181 575,181 -
Fund balances - ending 468,852$ 789,546$ 920,472$ 130,925$
Cumulative Capital Equipment
Budgeted Amounts
Cumulative Capital Improvement Cumulative Capital Development
Budgeted Amounts Budgeted Amounts
IV-39

Non-major Proprietary Funds
Internal Service Funds - To account for the financing of goods or services provided by one department or agency to other departments or agencies of the City on a cost reimbursement basis.
Risk Management - To account for revenues generated by assessing premiums on each City department and the Bloomington Public Transit Corporation, for the purpose of administering a self-insurance program for Worker’s Compensation. Fleet Maintenance - To account for the financing of goods and services provided by the Fleet Maintenance department to other departments and agencies of the City. Health Insurance Trust - To account for revenues generated and expenses incurred for the administration of the City’s self-insured employee health plan.
IV-40

CITY OF BLOOMINGTON, INDIANACOMBINING STATEMENT OF NET ASSETS
NON-MAJOR PROPRIETARY FUNDSDecember 31, 2005
HealthRisk Fleet Insurance
Assets Management Maintenance Trust Total
Current assets:Cash and cash equivalents 233,164$ 350,383$ 496,585$ 1,080,132$ Interest receivable 57 - 95 152 Interfund receivables:
Interfund services provided and used - 44,121 - 44,121 Inventories - 231,348 - 231,348
Total current assets 233,221$ 625,852$ 496,680$ 1,355,753$
Capital assets:Other capital assets (net of
accumulated depreciation) 13,635 646,170 - 659,805
Total noncurrent assets 13,635 646,170 - 659,805
Total assets 246,856 1,272,022 496,680 2,015,558
Liabilities
Current liabilities:Accounts payable 36,108 52,505 - 88,613 Interfund payables 8,028 11,362 - 19,390 Compensated absences payable-long term 4,187 4,904 - 9,091 Compensated absences payable-short term 4,955 1,400 - 6,355 Estimated unfiled claims 47,086 - 407,531 454,617
Total current liabilities 100,364 70,171 407,531 578,066
Total liabilities 100,364 70,171 407,531 578,066
Net assets
Unrestricted 146,492 1,201,851 89,149 1,437,492
Total net assets 146,492$ 1,201,851$ 89,149$ 1,437,492$
The notes to the financial statements are an integral part of this statement.
Governmental-Type Activities - Internal Service Funds
IV-41

CITY OF BLOOMINGTON, INDIANACOMBINING STATEMENT OF REVENUES, EXPENSES AND OTHER CHANGES IN FUND NET ASSETS
NON-MAJOR PROPRIETARY FUNDSFor the Year Ended December 31, 2005
HealthRisk Fleet Insurance
Management Maintenance Trust TotalOperating Revenues:
Charges for services 790,240$ 1,249,636$ 5,070,785$ 7,110,661$ Other 2,902 4,699 - 7,601
.Total operating revenues 793,142 1,254,335 5,070,785 7,118,262
Operating expenses:Administrative and general:
General - - 330,457 330,457 Salaries 218,627 377,461 - 596,088 Employee benefits - - 5,177,093 5,177,093 Materials and supplies 36,122 1,034,248 - 1,070,370 Other services 494,503 107,995 - 602,498 Depreciation 6,448 30,721 - 37,169
Total operating expenses 755,700 1,550,425 5,507,550 7,813,675
Operating loss 37,442 (296,090) (436,765) (695,413)
Nonoperating revenues:Interest and investment revenue 12,618 - 39,345 51,963 Gain on sale - 1,526 - 1,526
Total nonoperating revenue 12,618 1,526 39,345 53,489
Change in net assets 50,060 (294,564) (397,420) (641,924)
Total net assets - beginning 96,432 1,496,415 486,569 2,079,416
Total net assets - ending 146,492$ 1,201,851$ 89,149$ 1,437,492$
Governmental-Type Activities - Internal Service Funds
IV-42

CITY OF BLOOMINGTON, INDIANACOMBINING STATEMENT OF CASH FLOWS
NON-MAJOR PROPRIETARY FUNDSFor the Year Ended December 31, 2005
HealthRisk Fleet Insurance
Management Maintenance Trust TotalCash flows from operating activities:
Receipts from customers and users 793,142$ 1,241,290$ 5,070,785$ 7,105,217$ Payments to suppliers (577,062) (1,041,966) (5,435,249) (7,054,277) Payments to employees (218,627) (373,668) - (592,295)
Net cash provided (used) by operating activities (2,547) (174,344) (364,464) (541,355)
Cash flows from capital and related financing activities:Acquisition and construction of capital assets - - - - Proceeds from sales of capital assets - 1,526 - 1,526
Net cash provided by capitaland related financing activities - 1,526 - 1,526
Cash flows from investing activities:Interest received 12,593 - 40,334 52,927
Net increase (decrease) in cash and cash equivalents 10,046 (172,818) (324,130) (486,902)
Cash and cash equivalents, January 1 223,118 523,201 820,715 1,567,034
Cash and cash equivalents, December 31 233,164$ 350,383$ 496,585$ 1,080,132$
Reconciliation of operating income to net cashused by operating activities:
Operating income loss 37,442 (296,090) (436,765) (695,413)
Adjustments to reconcile operating income tonet cash provided (used) by operating activities:
Depreciation expense 6,448 30,721 37,169 Change in assets and liabilities:
Interfund receivables - (13,045) - (13,045) Inventories 97,498 - 97,498 Accounts payable (39,044) 5,127 (27,236) (61,153) Compensated absence payable 3,931 3,793 - 7,724 Interfund payables 804 (2,348) - (1,544) Estimated unfiled claims (12,128) - 99,537 87,409
Total adjustments (39,989) 121,746 72,301 154,058
Net cash provided (used) by operating activities (2,547)$ (174,344)$ (364,464)$ (541,355)$
Governmental-Type Activities - Internal Service Funds
IV-43

CITY OF BLOOMINGTON, INDIANABUDGETARY COMPARISON SCHEDULESNON-MAJOR BUDGETED INTERNAL SERVICE FUNDSFor The Year Ended December 31, 2005
Variance with Variance withFinal Budget- Final Budget-
Positive PositiveOriginal Final Actual (Negative) Original Final Actual (Negative)
Revenues:Charges for services 480,930$ 480,930$ 790,240$ 309,310$ 1,226,980$ 1,226,980$ 1,236,591$ 9,611$ Other 5,000 5,000 15,495 10,495 - - 6,225 6,225
Total revenues 485,930 485,930 805,735 319,805 1,226,980 1,226,980 1,242,816 15,836
Expenditures:Current:
General government: Personal services 206,653 227,221 214,026 13,195 382,995 387,750 376,016 11,734 Supplies 38,100 38,100 36,122 1,978 776,700 935,700 934,716 984 Other services and charges 234,108 545,811 545,541 270 107,844 100,714 98,363 2,351 Capital outlay 1,000 1,000 - 1,000 11,000 11,000 6,539 4,461
Total expenditures 479,861 812,132 795,690 16,443 1,278,539 1,435,164 1,415,634 19,530 Net change in fund balances 6,069 (326,202) 10,046 336,248 (51,559) (208,184) (172,818) 35,366
Fund balances - beginning 251,981 251,981 251,981 - 520,434 520,434 520,434 -
Fund balances - ending 258,050$ (74,222)$ 262,026$ 336,248$ 468,875$ 312,250$ 347,616$ 35,366$
Risk Management Fleet Maintenance
Budgeted Amounts Budgeted Amounts
IV-44

Non-major Fiduciary Funds Pension Trust Funds – used to account for assets held by the City for the members and beneficiaries of defined benefit plans.
Police Pension - To account for the provision of retirement and disability benefits to police officers hired prior to May 1, 1977. Financing is provided by mandatory contributions by active members, state cigarette tax distributions, and a specific annual property tax levy. Fire Pension - To account for the provision of retirement and disability benefits to firefighters hired prior to May 1, 1977. Financing is provided by mandatory contributions by active members, state cigarette tax distributions, and a specific annual property tax levy.
Private Purpose Trust Fund – used to report assets held by the City that benefit individuals, private organizations, or other governments.
Howard Young Bicentennial Trust - To account for the Howard Young $1,000 gift in 1976 to the City and all subsequent investment earnings. The trust agreement provides that the principal and accumulated earnings be used in the year 2076 for sidewalk improvements.
IV-45

CITY OF BLOOMINGTON, INDIANASTATEMENT OF FIDUCIARY NET ASSETS
NON-MAJOR FIDUCIARY FUNDSDecember 31, 2005
Police FireAssets Pension Pension Total
Cash and cash equivalents 1,108,555$ 2,267,580$ 3,376,135$ Receivables:
Taxes 89,098 116,844 205,942 Intergovernmental 17,960 24,852 42,812 Interest 9,104 5,928 15,032
Total receivables 116,162 147,624 263,786
Investments at fair value:Certificate of deposit 585,650 396,050 981,700 Participation in investment pools of
other governments 613,067 796,318 1,409,385
Total investments 1,198,717 1,192,368 2,391,085
Total assets 2,423,434 3,607,572 6,031,006
Liabilities
Unearned revenue 20,462 36,189 56,651
Total liabilities 20,462 36,189 56,651
Net assets
Held in trust for:Employees' pension benefits 2,402,972 3,571,383 5,974,355
Total net assets 2,402,972$ 3,571,383$ 5,974,355$
Pension Trust Funds
IV-46

Police FirePension Pension Total
Additions
Contributions:Employer contributions made by city 786,567$ 1,088,455$ 1,875,022$ Employer contributions made by state 570,429 801,333 1,371,762 Plan members 4,178 7,889 12,067 Other contributions 1,563 247 1,810
Total contributions 1,362,737 1,897,924 3,260,661
Investment income:Interest 68,800 97,878 166,678
Total investment income 68,800 97,878 166,678
Total additions 1,431,537 1,995,802 3,427,339
Deductions
Benefits 1,079,039 1,594,681 2,673,720 Administrative expense 7,902 49,037 56,939
Total deductions 1,086,941 1,643,718 2,730,659
Changes in net assets 344,596 352,084 696,680
Net assets - beginning 2,058,376 3,219,299 5,277,675
Net assets - ending 2,402,972$ 3,571,383$ 5,974,355$
The notes to the financial statements are an integral part of this statement.
STATEMENT OF CHANGES IN FIDUCIARY NET ASSETSFIDUCIARY FUNDS
CITY OF BLOOMINGTON, INDIANA
For the Year Ended December 31, 2005
IV-47

CITY OF BLOOMINGTON, INDIANABUDGETARY COMPARISON SCHEDULESNON-MAJOR BUDGETED PENSION TRUST FUNDSFor The Year Ended December 31, 2005
Variance with Variance withFinal Budget- Final Budget-
Positive PositiveOriginal Final Actual (Negative) Original Final Actual (Negative)
Revenues:Taxes 746,208$ 746,208$ 661,876$ (84,332)$ 1,032,604$ 1,032,604$ 930,230$ (102,374)$ Intergovernmental 662,681 662,681 608,525 (54,156) 903,699 903,699 854,051 (49,648) Other 13,000 13,000 32,454 19,454 15,000 15,000 31,573 16,573
Total revenues 1,421,889 1,421,889 1,302,856 (119,033) 1,951,303 1,951,303 1,815,854 (135,449)
Expenditures:Current:
Public safety: Personal services 3,445 3,445 3,200 245 3,445 3,445 3,200 245 Supplies 550 550 - 550 350 350 167 183 Other services and charges 1,489,914 1,489,914 1,083,739 406,175 2,019,749 2,019,749 1,640,353 379,396
Total expenditures 1,493,909 1,493,909 1,086,939 406,970 2,023,544 2,023,544 1,643,721 379,823 Sa e o __
Net change in fund balances (72,020) (72,020) 215,916 287,936 (72,241) (72,241) 172,133 244,374
Fund balances - beginning 2,200,617 2,200,617 2,200,617 - 3,425,151 3,425,151 3,425,151 -
Fund balances - ending 2,128,597$ 2,128,597$ 2,416,533$ 287,936$ 3,352,910$ 3,352,910$ 3,597,284$ 244,374$
Police Pension Fire Pension
Budgeted Amounts Budgeted Amounts
IV-48

Exhibit B-1
2005 2004 2003 2002Governmental activities:
Invested in capital assets, net of related debt $161,119 $154,445 $142,750 N/A Restricted 1,367 1,689 1,904 N/A
Unrestricted 6,656 9,467 11,108 N/ATotal government activities net assets 169,142 165,601 155,762 N/A
Business-type activities:Invested in capital assets, net of related debt 83,418 85,935 88,961 N/ARestricted 7,252 774 1,766 N/AUnrestricted 4,617 6,290 4,908 N/A
Total business-type activities net assets; 95,287 92,999 95,633 N/A
Primary government:Invested in capital assets, net of related debt 244,537 240,380 231,711 N/ARestricted 8,619 2,463 3,670 N/AUnrestricted 11,273 15,757 16,016 N/A
Total primary government net assets $264,429 $258,600 $251,397 N/A
(A) The comparative data for 1996-2002 is not available because 2003 was the initial year of GASB statement No. 34 with relevant data.
Schedule 1
Fiscal Year
Last 10 Fiscal Years (A)Net Assets By Component (dollars are in thousands )
City of Bloomington
V-1

Exhibit B-2
2005 2004 2003 2002Expenses:Governmental activities
General Government 11,393 9,443 10,643 N/APublic Safety 19,422 18,477 17,119 N/AHighways and Streets 3,321 4,477 4,547 N/ASanitation 1,766 1,597 1,542 N/AHealth and Welfare 126 683 799 N/ACulture and Recreation 5,756 7,408 7,108 N/AUrban Development and Housing 4,977 2,172 2,321 N/AInterest on long-term debt 3,002 2,459 3,223 N/A
Total governmental activities expenses 49,763 46,716 47,302 N/A
Business-type activities:Water 8,628 9,618 7,729 N/AWastewater 13,143 13,189 11,932 N/A
Total business-type activities expenses 21,771 22,807 19,661 N/ATotal primary government expenses 71,534$ 69,523$ 66,963$ N/A
Program Revenues:Governmental activities
Charges for services 8,323 7,608 9,038 N/ARefuse collection - - - N/AOther public works - - - N/AParks and recreation - - - N/AOther activities - - - N/A
Operating grants and Contributions 6,231 5,370 5,902 N/ACapital grants and contributions 5,165 166 1,154 N/A
Total governmental activities program revenues 19,719 13,144 16,094 N/A
Business-type activities:Charges for services N/A
Water 9,566 9,241 9,633 N/AWastewater 13,490 14,177 13,742 N/AOther activities - - - N/A
Operating grants and contributions - - - N/ACapital grants and contributions - 351 1,948 N/AOther - 464 519 N/A
Total business-type activities program revenues 23,056 24,233 25,842 N/ATotal primary government program revenues 42,775$ 37,377$ 41,936$ N/A (continued)
Schedule 2
Fiscal Year
Last Ten Fiscal Year (A)Changes in Net Assets (dollars are in thousands )
City of Bloomington
V-2

Exhibit B-2
2005 2004 2003 2002
Schedule 2
Fiscal Year
Last Ten Fiscal Year (A)Changes in Net Assets (dollars are in thousands )
City of Bloomington
Net (Expense) RevenueGovernmental activities (30,044) (33,572) (31,208) N/ABusiness-type activities 1,285 1,426 6,181 N/ATotal primary government net expense (28,759)$ (32,146)$ (25,027)$ N/A
General Revenues and Other Changes in Net AssetsGovernmental activities:
TaxesProperty taxes 22,914 22,255 21,300 N/ACounty Option Income Tax 6,596 6,817 6,210 N/AExcise Tax 1,022 1,471 1,281 N/AOther taxes 1,093 1,209 1,494 N/A
Unrestricted grants and contributions 1,078 11,253 201 N/APayments in lieu of taxes - - - N/AUnrestricted Investment earnings 879 406 277 N/AMiscellaneous - - - N/ATransfers - - - N/A
Total government activities 33,582 43,411 30,763 N/A
Business-type activities:Unrestricted investment earnings 258 78 40 N/AOther - 464 519 N/A
Total Business-type activities 258 542 559 N/A
Total Primary Government: 33,840 43,953 31,322 N/A
Change in Net AssetsGovernmental Activities
Increase in net assets before transfers 3,540 9,839 (444) N/ASpecial and extraordinary items - - - N/AChange in Accounting Principle - - - N/AIncrease in net assets 3,540 9,839 (444) N/A
Business-type activities N/AIncrease in net assets before transfers 1,543 1,504 6,221 N/ASpecial and extraordinary items 923 - 193 N/AChange in Accounting Principle - (4,138) - N/APrior Period Adjustment (177) - - Increase in net assets 2,289 (2,634) 6,414 N/A
Total Change in Net Assets 5,829 7,205 5,970 N/A
Net Assets January 1st 258,600 251,396 245,425 N/ANet Assets December 31st 264,429 258,600 251,396 N/A
(A) The comparative data for 1996-2002 is not available because 2003 was the initial year of GASB statement No. 34 with relevant data.V-3

Exhibit B-3
2005 2004 2003 2002 2001General Fund
Reserved 1,022,243 193,631 392,875 N/A N/AUnreserved 3,071,282 2,865,579 2,778,073 N/A N/A
Total general fund 4,093,525$ 3,059,210$ 3,170,948$ N/A N/A
All Other Governmental FundsReserved:
Encumbrances 2,884,309 1,709,267 1,935,589 1,148,727 N/ALand held for resale 77,650 298,817 210,317 230,587 N/ANoncurrent loans receivable 4,502,151 2,439,928 2,224,782 1,852,835 N/ADebt service funds 1,366,554 1,688,564 1,904,449 N/A N/ACapital projects funds 8,953,057 9,405,751 9,140,998 N/A N/APermanent funds 5,870 5,870 5,870 N/A N/A
Unreserved: N/A N/ASpecial revenue funds 11,738,365 14,648,846 12,973,206 N/A N/APermanent funds 16,145 3,333 3,191 N/A N/AUndesignated - - - 13,053,915 N/A
Total all other governmental funds 29,544,101$ 30,200,376$ 28,398,402$ 16,286,064$ N/A
(A) Data from 1996-2002 does not provide similar statements.
Last 10 Fiscal Years (A)Fund Balances, Governmental Funds
City of BloomingtonSchedule 3
V-4
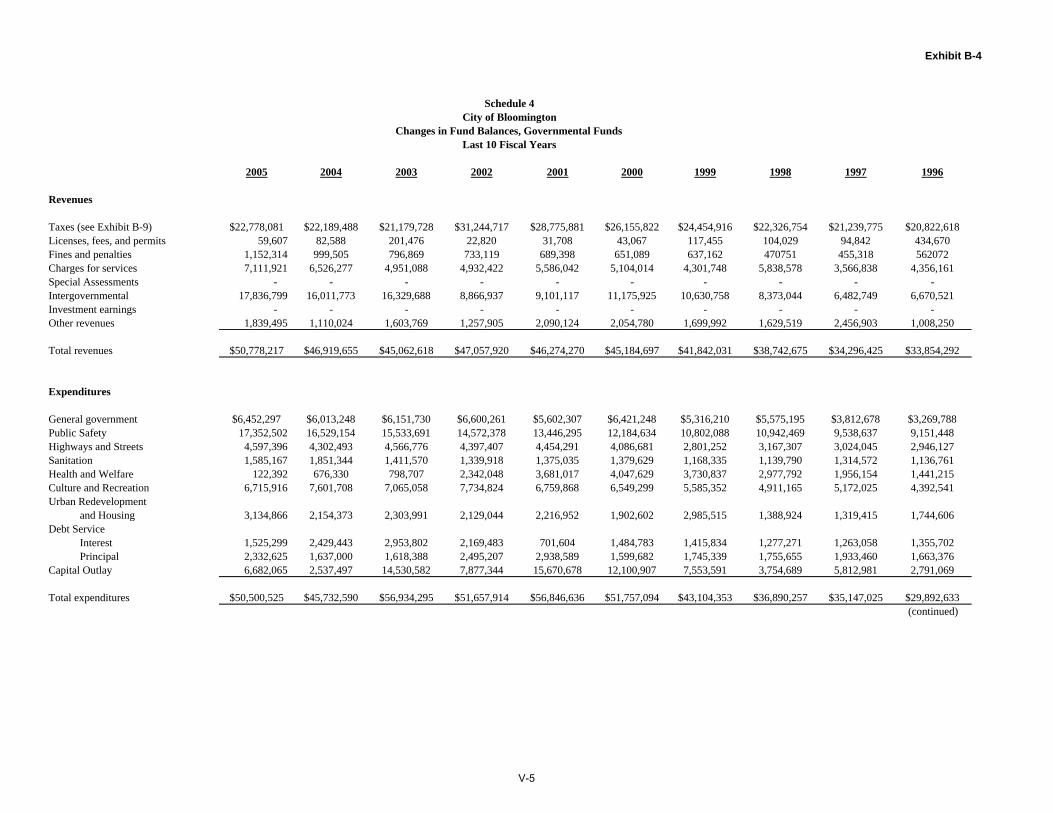
Exhibit B-4
2005 2004 2003 2002 2001 2000 1999 1998 1997 1996
Revenues
Taxes (see Exhibit B-9) $22,778,081 $22,189,488 $21,179,728 $31,244,717 $28,775,881 $26,155,822 $24,454,916 $22,326,754 $21,239,775 $20,822,618Licenses, fees, and permits 59,607 82,588 201,476 22,820 31,708 43,067 117,455 104,029 94,842 434,670Fines and penalties 1,152,314 999,505 796,869 733,119 689,398 651,089 637,162 470751 455,318 562072Charges for services 7,111,921 6,526,277 4,951,088 4,932,422 5,586,042 5,104,014 4,301,748 5,838,578 3,566,838 4,356,161Special Assessments - - - - - - - - - -Intergovernmental 17,836,799 16,011,773 16,329,688 8,866,937 9,101,117 11,175,925 10,630,758 8,373,044 6,482,749 6,670,521Investment earnings - - - - - - - - - -Other revenues 1,839,495 1,110,024 1,603,769 1,257,905 2,090,124 2,054,780 1,699,992 1,629,519 2,456,903 1,008,250
Total revenues $50,778,217 $46,919,655 $45,062,618 $47,057,920 $46,274,270 $45,184,697 $41,842,031 $38,742,675 $34,296,425 $33,854,292
Expenditures
General government $6,452,297 $6,013,248 $6,151,730 $6,600,261 $5,602,307 $6,421,248 $5,316,210 $5,575,195 $3,812,678 $3,269,788Public Safety 17,352,502 16,529,154 15,533,691 14,572,378 13,446,295 12,184,634 10,802,088 10,942,469 9,538,637 9,151,448Highways and Streets 4,597,396 4,302,493 4,566,776 4,397,407 4,454,291 4,086,681 2,801,252 3,167,307 3,024,045 2,946,127Sanitation 1,585,167 1,851,344 1,411,570 1,339,918 1,375,035 1,379,629 1,168,335 1,139,790 1,314,572 1,136,761Health and Welfare 122,392 676,330 798,707 2,342,048 3,681,017 4,047,629 3,730,837 2,977,792 1,956,154 1,441,215Culture and Recreation 6,715,916 7,601,708 7,065,058 7,734,824 6,759,868 6,549,299 5,585,352 4,911,165 5,172,025 4,392,541Urban Redevelopment
and Housing 3,134,866 2,154,373 2,303,991 2,129,044 2,216,952 1,902,602 2,985,515 1,388,924 1,319,415 1,744,606Debt Service
Interest 1,525,299 2,429,443 2,953,802 2,169,483 701,604 1,484,783 1,415,834 1,277,271 1,263,058 1,355,702Principal 2,332,625 1,637,000 1,618,388 2,495,207 2,938,589 1,599,682 1,745,339 1,755,655 1,933,460 1,663,376
Capital Outlay 6,682,065 2,537,497 14,530,582 7,877,344 15,670,678 12,100,907 7,553,591 3,754,689 5,812,981 2,791,069
Total expenditures $50,500,525 $45,732,590 $56,934,295 $51,657,914 $56,846,636 $51,757,094 $43,104,353 $36,890,257 $35,147,025 $29,892,633(continued)
Last 10 Fiscal YearsChanges in Fund Balances, Governmental Funds
City of BloomingtonSchedule 4
V-5

Exhibit B-4
2005 2004 2003 2002 2001 2000 1999 1998 1997 1996
Last 10 Fiscal YearsChanges in Fund Balances, Governmental Funds
City of BloomingtonSchedule 4
Excess of revenuesover (under)expenditures $277,692 $1,187,065 -$11,871,677 -$4,599,994 -$10,572,366 -$6,572,397 -$1,262,322 $1,852,418 -$850,600 $3,961,659
Other Financing Sources (Uses)
Proceeds from borrowing - - - - - - - - - -Proceeds from refunding - - - - - - - - - -Payments to escrow agent - - - - - - - - - -Transfers in 1,969,729 3,170,422 2,432,679 4,050,338 3,659,087 1,995,400 2,587,883 1,416,829 1,621,812 1,775,915Transfers out (1,969,729) (3,170,422) (2,432,679) (4,050,338) (3,658,930) (1,995,400) (2,587,883) (1,416,717) (1,621,812) (1,775,915)Capital Leases 100,348 503,171 7,766,157 712,753 8,211,643 6,835,913 300,000 - - -General Obligation
Bond Proceeds - - - - 6,202,223 2,355,013 2,445,244 7,750,000 1,437,932 -Total other financing sources (uses) 100,348 503,171 7,766,157 712,753 14,414,023 9,190,926 2,745,244 7,750,112 1,437,932 0
Net change in fund balances 378,040$ $1,690,236 -$4,105,520 -$3,887,241 $3,841,657 $2,618,529 $1,482,922 $9,602,530 $587,332 $3,961,659
Fund Balances- beginning $33,259,586 $31,569,350 $35,674,870 $39,559,021 $35,717,364 $33,098,658 $31,615,736 $22,013,206 $21,427,799 $17,466,026Fund Balances- ending $33,637,626 $33,259,586 $31,569,350 $35,671,780 $39,559,021 $35,717,364 $33,098,658 $31,615,736 $22,015,131 $21,427,799
Debt Service as % of noncapital expenditures 8.80% 9.41% 10.78% 10.65% 8.84% 7.78% 8.89% 9.15% 10.90% 11.14%
V-6

Exhibit C-1
REAL PROPERTY PERSONAL PROPERTY TOTAL PROPERTYYEAR Actual Value Actual Value Actual Value
1996 $975,787,746 $193,928,328 $1,169,716,0741997 1,067,996,670 208,554,759 1,276,551,4291998 1,132,760,970 218,043,036 1,350,804,0061999 1,185,354,210 220,942,143 1,406,296,3532000 1,229,557,335 231,596,595 1,461,153,9302001 1,292,823,660 239,993,541 1,532,817,2012002 1,334,645,900 253,709,170 1,588,355,0702003 2,330,364,854 283,040,182 2,613,405,0362004 2,349,859,904 229,434,401 2,579,294,3052005 2,652,889,752 248,985,489 2,901,875,241
(A) Values represent the assessment on March 1 of the previous year for taxes due and payable in the year shown above. Assessed Value equals one-third of the "actual" of the property, which is significantly less than fair market value. The City of Bloomington's corporate boundaries contain four township units: Bloomington City, Perry City, Richland City, and Van Buren City. Source: Monroe County Auditor's "Abstract of Property Valuations."
* Beginning in 2002, Assessed Value equaled Actual Value in anticipation of a reassessment to market value in 2003. (See note (A) above ** Beginning in 2003, Assessed and Actual Value reflect Market Value
Last 10 Fiscal YearsAssessed and Actual Value of Taxable Property
City of BloomingtonSchedule 5
V-7

Exhibit C-2
Year
1996 1.7805 0.5565 0.2416 0.5956 0.4234 3.5976
1997 1.8621 0.5514 0.2365 0.5990 0.3539 3.6029
1998 1.6691 0.8422 0.2262 0.5195 0.3390 3.5960
1999 1.8606 0.8420 0.1098 0.5502 0.2111 3.5737
2000 2.2778 0.8309 0.0868 0.3783 0.1495 3.7233
2001 2.1681 0.8511 0.0814 0.3251 0.2215 3.6472
2002 0.6816 0.2965 0.0295 0.0869 0.1142 1.2087
2003 0.4631 0.1880 0.0242 0.0647 0.0598 0.7998
2004 0.4987 0.2008 0.0273 0.0481 0.0618 0.8367
2005 0.5083 0.1620 0.0677 0.0489 0.0578 0.8447
Source: Monroe County Auditor's Office, "Notice to Taxpayers of Monroe County of Tax Rates Charged."
(G) Tax rates are applicable to taxes payable in May and Novemeber of the stated year.
(A) Per $100 of Assessed Valuation, which is one-third of "true tax value" for 1993-2001. As of 2003, Assessed Value is equal to Market V(B) Consists of the Corporation General Fund and the TIF Replacement Credit (C) Consists of the Parks and Recreation Fund (0.1865) and Tax Increment Replacement (0..0143).(D Consists of the Police Pension Fund (0.0108) and the Fire Pension Fund (0.0165). (E) Consists of the Cumulative Capital Improvement (0.0197) and the Cumulative Capital Development Fund ((F) Consists of the Park District Bond Fund (0.0228), the Police Bond Fund (0.0087), the Bloomington Municipal Facilities Fund (0.0139) a
General Fund (B)
Special Revenue Fund
Trust Fund (D)
Capital Proejcts Fund
Debt Service Fund (F)
Total City Rate (G)
City of BloomingtonSchedule 6
Last 10 Fiscal YearsDirect and Overlapping Property Tax Rates (A)
V-8

Exhibit C-3
DirectSpecial
School Enterprise Solid WasteCity Township Library District County Fund (C) District State Total
Bloomington City
1996 3.7766 0.0925 0.4462 4.2369 1.9997 0.1790 0.0963 0.0100 10.65821997 3.7781 0.0965 0.5192 4.3963 2.0303 0.1752 0.0937 0.0100 10.92411998 3.7766 0.0965 0.5213 4.4520 2.0268 0.1806 0.0891 0.0100 11.15291999 3.7245 0.0999 0.5070 4.5996 2.0651 0.1508 0.0846 0.0100 11.24152000 3.7233 0.1011 0.5181 4.7216 2.0569 0.1531 0.0871 0.0100 11.37122001 3.6472 0.1026 0.4967 4.6495 1.6087 0.1492 0.0878 0.0100 10.75172002 1.2087 0.0351 0.1645 1.5726 0.5385 0.0502 0.0366 0.0033 3.60952003 0.7998 0.0210 0.1044 1.0208 0.4042 0.0315 0.0237 0.0033 2.40872004 0.8367 0.0231 0.1078 1.1038 0.2841 0.0328 0.0251 0.0024 2.41582005 0.8447 0.022 0.1055 1.1565 0.4203 0.0316 0.0234 0.0024 2.6064
Perry City
1996 3.7766 0.0538 0.4462 4.2369 1.9997 0.1790 0.0963 0.0100 10.61951997 3.7781 0.1117 0.5192 4.3963 2.0303 0.1752 0.0937 0.0100 10.93931998 3.7766 0.1021 0.5213 4.4520 2.0268 0.1806 0.0891 0.0100 11.15851999 3.7245 0.0790 0.5070 4.5996 2.0651 0.1508 0.0846 0.0100 11.22062000 3.7233 0.1048 0.5181 4.7216 2.0569 0.1531 0.0871 0.0100 11.37492001 3.6472 0.1067 0.4967 4.6495 1.6087 0.1492 0.0878 0.0100 10.75582002 1.2087 0.0372 0.1645 1.5726 0.5385 0.0502 0.0366 0.0033 3.61162003 0.7998 0.0242 0.1044 1.0208 0.4042 0.0315 0.0237 0.0033 2.41192004 0.8367 0.0233 0.1078 1.1038 0.2841 0.0328 0.0251 0.0024 2.4162005 0.8447 0.0227 0.1055 1.1565 0.4203 0.0316 0.0234 0.0024 2.6071
Source: Monroe County Auditor's Office, "Notice to Taxpayers of Monroe County of Tax Rates Charged."
Schedule 6
Last Ten Fiscal YearsDirect and Overlapping Governments (A)
Property Tax Rates (A)City of Bloomington
(C) Consists of the Bloomington Transportation Corporation Fund, implemented in 1983.
(A) Property tax rates per $100 assessed valuation (B) The City of Bloomington's corporate boundaries contain four township units: Bloomington City, Richland City, Perry City, and Van Buren City
Overlapping
V-9

Exhibit C-4
DirectSpecial
School Enterprise Solid WasteCity Township Library District County Fund (C) District State Total
Richland City
1996 3.7766 0.0275 0.4462 4.3713 1.9997 0.1790 0.0963 0.0100 10.72761997 3.7781 0.0364 0.5192 4.6463 2.0303 0.1752 0.0937 0.0100 11.11401998 3.7766 0.0366 0.5213 4.3608 2.0268 0.1806 0.0891 0.0100 11.00181999 3.7245 0.0344 0.5070 4.0634 2.0651 0.1508 0.0846 0.0100 10.63982000 3.7233 0.0358 0.5181 4.7731 2.0569 0.1531 0.0871 0.0100 11.35742001 3.6472 0.0370 0.4967 4.6344 1.6087 0.1492 0.0878 0.0100 10.67102002 1.2087 0.0117 0.1645 1.5259 0.5385 0.0502 0.0366 0.0033 3.53942003 0.7998 0.0085 0.1044 1.4512 0.4042 0.0315 0.0237 0.0033 2.82662004 0.8367 0.0180 0.1078 1.4984 0.2841 0.0328 0.0251 0.0024 2.80532005 0.8447 0.0184 0.1055 1.5495 0.4203 0.0316 0.0234 0.0024 2.9958
Van Buren City
1996 3.7766 0.1240 0.4462 4.2369 1.9997 0.1790 0.0963 0.0100 10.68971997 3.7781 0.1336 0.5192 4.3963 2.0303 0.1752 0.0937 0.0100 10.96121998 3.7766 0.1286 0.5213 4.4520 2.0268 0.1806 0.0891 0.0100 11.18501999 3.7245 0.1379 0.5070 4.5996 2.0651 0.1508 0.0846 0.0100 11.27952000 3.7233 0.1526 0.5181 4.7216 2.0569 0.1531 0.0871 0.0100 11.42272001 3.6472 0.1560 0.4967 4.6495 1.6087 0.1492 0.0878 0.0100 10.80512002 1.2087 0.0557 0.1645 1.5726 0.5385 0.0502 0.0366 0.0033 3.63012003 0.7998 0.0507 0.1044 1.0208 0.4042 0.0315 0.0237 0.0033 2.43842004 0.8367 0.0540 0.1078 1.1038 0.2841 0.0328 0.0251 0.0024 2.44672005 0.8447 0.0545 0.1055 1.1565 0.4203 0.0316 0.0234 0.0024 2.6389
Source: Monroe County Auditor's Office, "Notice to Taxpayers of Monroe County of Tax Rates Charged."
Schedule 6
Last Ten Fiscal YearsDirect and Overlapping Governments (B)
Property Tax Rates (A)City of Bloomington
Overlapping
(A) Property tax rates per $100 assessed valuation (B) The City of Bloomington's corporate boundaries contain four township units: Bloomington City, Richland City, Perry City, and Van Buren City (C) Consists of the Bloomington Transportation Corporation Fund, implemented in 1983.
V-10

Exhibit C-5
Percentage Of2005 Pay 2006 Valuation (B)
Taxpayer Type Of Business Valuation (A) City's AssessedRCR, Inc. Rental Properties $45,210,700 1.74%CFC, Inc. Rental Properties 41,446,770 1.59%Whitehall Crossing Retail 28,390,100 1.09%Woodbridge Rental Properties 26,185,700 1.01%Rogers Construction and Properties 24,033,100 0.92%Simon Property Retail 23,717,100 0.91%Fred Latimer Real Estate 23,400,100 0.90%Cook Pharmica Rental Properties 23,400,100 0.90%Smallwood Rental Properties 22,410,300 0.86%PSI/CINERGY (B) Utility 12,172,960 0.47%
TOTAL $270,366,930 10.39%
Percentage Of1996 Pay 1997 Valuation (B)
Taxpayer Type Of Business Valuation (A) City's AssessedThomson Corporation Color TV receivers, electronics $12,345,430 2.90%Woodbridge Apartments Real estate 5,027,220 1.18%Public Service Indiana Utility 4,713,650 1.11%CFC, Inc. Rental properties 4,549,590 1.07%Indiana Bell Telephone Utility 4,420,350 1.04%College Mall Company Regional shopping center 4,075,040 0.96%Regency Management Service Rental properties 3,743,700 0.88%Indiana Gas Company Utility 2,809,760 0.66%Rogers Group Construction 2,632,910 0.62%Carlisle (B.F. Goodrich) Off-road braking systems 2,032,060 0.48%
TOTAL $46,349,710 10.89%
(A) Source: Monroe County Auditor's Office; represents the assessment of March 1 of previous year for taxes due and payable in year shown(B) Valuation is not current; based on previous year.
Last 10 Fiscal YearsPrincipal Property Tax Payers (A)
City of BloomingtonSchedule 7
V-11

Exhibit C-6
Taxpayer 2005 Assessed Value
COOK $35,203,000ABB, INC 35,203,000GENERAL ELECTRIC 23,061,170BAXTER 17,680,500SABIN 14,506,110DUNN & FERGUSON 12,426,000MENARD INC. 8,582,900PUBLIC INVERSTMENT CORP. 8,413,930SCHULTE 5,985,400BLOOMINGTON LKE 5,428,000BLOMINGTON TECH. PARK 5,175,400OTIS ELEVATOR 4,641,200LIBERTY LLC 3,520,600BTP 6 LP 2,622,200UNITED METHODIST CHURCH 2,026,500BTP 12 LP 1,919,200EXMIN, INC 1,552,700INDIANA INVESTMENTS 729,100ATR COIL 432,900PERFECTION BAKERIES INC. 322,740VIP HOLDINGS 318,000JASTRENSKI HOLDINGS, LLC 66,000COPHENHAVER CONSTRUCTION 65,500
Total $189,882,050
(A) The City of Bloomington has negotiated an "In Lieu of Annexation Agreement," pursuant to Indiana Statute, with a number of local industriesand businesses which lie outside the City corporate limits. The City provides services to the industries for a specified payment, and will foregoannexation during the period of agreement. Payments are negotiated to approximate a percentage of City property taxes.
Payment in Lieu of Annexation Agreement (A)City of Bloomington
Schedule 7
V-12

Exhibit C-7
Percent of Percent ofPercent Of Delinquent Total Tax Outstanding Delinquent
Current Tax Levy Tax Total Tax Collections Delinquent Taxes ToFiscal Year Tax Levy Collections Collected Collections Collections To Tax Levy Taxes Tax Levy
1996 14,666,632 14,269,163 97.29% 514,408 14,783,570 100.80% 684,443 4.67% 1997 15,943,365 15,631,134 98.04% 496,960 16,128,095 101.16% 549,855 3.45% 1998 16,933,658 16,439,712 97.08% 351,587 16,791,299 99.16% 742,948 4.39% 1999 17,436,672 16,970,500 97.33% 582,421 17,552,922 100.67% 701,996 4.03% 2000 17,946,390 17,597,007 98.05% 507,516 18,104,523 100.88% 536,105 2.99% 2001 18,537,756 18,072,474 97.49% 390,398 18,462,872 99.60% 720,470 3.89% 2002 18,969,814 18,505,961 97.55% 594,256 19,100,216 100.69% 647,749 3.41% 2003 20,400,694 19,978,630 97.93% 500,036 20,478,666 100.38% 661,992 3.24% 2004 $15,943,365 $15,631,134 98.04% $496,960 $16,128,094 101.16% $549,854 3.45% 2005 $5,082,901 $4,921,363 96.82% $272,776 $5,194,140 102.19% $254,447 5.01%
Note: All property tax collections in excess of 102% of the state approved levy are transferred to a "Levy Excess Fund" and are used either to reduce tax levies in subsequent years or to reimburse any fund for property taxes withheld due to refunds awarded.
Source: Monroe County Auditor's "Apportionment of Taxes Collected," prorated according the City of Bloomington's share.
City of Bloomington
Last Ten Fiscal YearsProperty Tax Levies and Collections
Schedule 8
V-13

Exhibit C-8
Percent of Delinquent Total Tax Outstanding DelinquentCurrent Tax Levy Tax Total Tax Collections Delinquent Taxes To
Tax Levy Collections Collected Collections Collections To Tax Levy Taxes Tax Levy
Bloomington City
1996 $5,082,901 $4,921,364 96.82% $272,777 $5,194,141 102.19% $254,447 5.01% 1997 5,711,440 5,584,749 97.78% 181,769 5,766,518 100.96% 210,927 3.69% 1998 5,860,065 5,671,949 96.79% 131,699 5,803,648 99.04% 279,128 4.76% 1999 5,962,957 5,760,191 96.60% 229,388 5,989,579 100.45% 285,615 4.79% 2000 6,101,947 5,955,127 97.59% 207,821 6,162,948 101.00% 223,000 3.65% 2001 6,129,548 5,966,235 97.34% 178,076 6,144,311 100.24% 258,458 4.22% 2002 6,202,020 6,049,897 97.55% 210,090 6,259,986 100.93% 207,610 3.35% 2003 6,858,777 6,693,539 97.59% 168,691 6,862,230 100.05% 233,567 3.41% 2004 5,711,440 5,584,749 97.78% 181,769 5,766,518 100.96% 210,927 3.69% 2005 5,082,901 4,921,364 96.82% 272,777 5,194,141 102.19% 254,447 5.01%
Perry City
1996 8,918,064 8,696,223 97.51% 198,520 8,894,743 99.74% 413,901 4.64% 1997 9,510,803 9,346,146 98.27% 299,846 9,645,991 101.42% 315,958 3.32% 1998 10,246,378 9,994,078 97.54% 198,477 10,192,555 99.47% 406,214 3.96% 1999 10,592,000 10,348,866 97.70% 294,801 10,643,668 100.49% 389,317 3.68% 2000 10,672,076 10,469,769 98.10% 274,863 10,744,632 100.68% 308,169 2.89% 2001 11,215,820 10,914,735 97.32% 207,439 11,122,174 99.17% 458,778 4.09% 2002 11,514,772 11,246,396 97.67% 381,937 11,628,333 100.99% 394,948 3.43% 2003 12,290,258 12,077,295 98.27% 307,603 12,384,898 100.77% 355,030 2.89% 2004 9,510,803 9,346,146 98.27% 299,846 9,645,991 101.42% 315,958 3.32% 2005 8,918,064 8,696,223 97.51% 198,520 8,894,743 99.74% 413,901 4.64%
Note: The City of Bloomington's corporate boundaries contain four township units: Bloomington City, Perry City, Richland City, and Van B
(A) Source: Monroe County Auditor's "Apportionment of Taxes Collected," prorated according to Richland City and Van Buren City shares
Schedule 8
Last Ten Fiscal YearsListed by Township (A)
Property Tax Levies and CollectionsCity of Bloomington
V-14

Exhibit C-9
Percent of Delinquent Total Tax Outstanding DelinquentCurrent Tax Levy Tax Total Tax Collections Delinquent Taxes To
Tax Levy Collections Collected Collections Collections To Tax Levy Taxes Tax Levy
Richland City
1996 $77,721 $70,547 90.77% $1,155 $71,703 92.26% $7,174 9.23% 1997 100,927 100,927 100.00% 7,628 108,554 107.56% 0 0.00% 1998 126,634 102,688 81.09% 248 102,936 81.29% 23946 18.91% 1999 158,473 152,664 96.33% 26,906 179,570 1.13% 6066 3.83% 2000 352,382 352,382 100.00% 5,966 358,347 101.69% 8 0.00% 2001 385,513 385,513 100.00% 54 385,567 100.01% 34 0.01% 2002 425,562 421,240 98.98% 122 421,362 99.01% 4423 1.04% 2003 403,488 387,640 96.07% 3,471 391,111 96.93% 16,814 4.17%2004 100,927 100,927 100.00% 7,628 108,554 107.56% 0 0.00%2005 77,721 70,547 90.77% 1,155 71,703 92.26% 7,174 9.23%
Van Buren City
1996 $587,947 $581,028 98.82% $41,955 $622,983 105.96% $8,921 1.52% 1997 620,195 599,313 96.63% 7,718 607,031 97.88% 22,970 3.70% 1998 700,582 670,996 95.78% 21,163 692,159 98.80% 33,659 4.80% 1999 723,242 708,779 98.00% 31,326 740,105 102.33% 20,998 2.90% 2000 819,985 819,730 99.97% 18,867 838,596 102.27% 4,928 0.60% 2001 806,875 805,991 99.89% 4,829 810,820 100.49% 3,200 0.40% 2002 827,459 788,428 95.28% 2,107 790,535 95.54% 40,767 4.93% 2003 848,171 820,156 96.70% 20,271 840,427 99.09% 56,581 6.67% 2004 620,195 599,313 96.63% 7,718 607,031 97.88% 22,970 3.70% 2005 2,632,217 581,028 22.07% 41,955 622,983 23.67% 8,921 0.34%
Note: The City of Bloomington's corporate boundaries contain four township units: Bloomington City, Perry City, Richland City, a
(A) Source: Monroe County Auditor's "Apportionment of Taxes Collected," prorated according to Richland City and Van Buren Ci
Schedule 8
Last 10 Fiscal YearsListed By Township (A)
Property Tax Levies and CollectionsCity of Bloomington
V-15

Exhibit D-1
Fiscal Year Water Bonds
1996 $1,460,000 $730,000 $2,585,000 $13,980,000 $23,205,000 $41,960,000 $3,161,067,000 1.33% 6921997 915,000 615,000 2,330,000 13,435,000 22,575,000 39,870,000 3,357,071,000 1.19% 6581998 8,260,000 485,000 2,060,000 12,860,000 21,905,000 45,570,000 3,574,167,000 1.27% 7521999 7,855,000 340,000 4,230,000 12,260,000 29,390,000 54,075,000 3,697,434,000 1.46% 8922000 7,750,000 2,610,000 3,920,000 11,635,000 28,625,000 54,540,000 3,955,684,000 1.38% 7692001 7,750,000 2,340,000 9,790,000 10,980,000 27,660,000 58,520,000 4,036,418,000 1.45% 8362002 7,635,000 2,365,000 8,660,000 10,280,000 26,630,000 55,570,000 4,119,263,000 1.35% 8002003 7,495,000 2,235,000 8,250,000 10,220,000 26,830,000 55,030,000 4,301,023,000 1.28% 7962004 7,435,000 2,100,000 7,840,000 9,250,000 25,765,000 52,390,000 N/A N/A 7622005 7,365,000 1,955,000 7,420,000 8,305,000 24,355,000 49,400,000 N/A N/A 716
N/A = Not available
Business-Type ActivitiesGovernmental ActivitiesPercentage of
Personal Income
Debt Per Capita Income
Redevelopment Bonds
General Obligation
BondsWastewater
BondsTotal Primary Government
Total Personal Income
Park District Bonds
Ratio of Outstanding Debt by TypeLast Ten Fiscal YearsCity of Bloomington
Schedule 9
V-16

Exhibit D-2
Fiscal Year Total
1996 $1,460,000 $730,000 $2,585,000 $4,775,000 $425,517,143 1.12% 78.75$ 1997 915,000 615,000 2,330,000 3,860,000 450,268,002 0.86% 63.66 1998 8,260,000 485,000 2,060,000 10,805,000 468,765,451 2.30% 178.20 1999 7,855,000 340,000 4,230,000 12,425,000 487,051,310 2.55% 204.92 2000 7,750,000 2,610,000 3,920,000 14,280,000 510,939,067 2.79% 201.39 2001 7,750,000 2,340,000 9,790,000 19,880,000 1,588,355,070 1.25% 283.94 2002 7,635,000 2,365,000 8,660,000 18,660,000 2,613,405,036 0.71% 268.64 2003 7,495,000 2,235,000 8,250,000 17,980,000 2,613,405,036 0.69% 260.02 2004 7,435,000 2,100,000 7,840,000 17,375,000 2,601,754,329 0.67% 252.62 2005 7,365,000 1,955,000 7,420,000 16,740,000 2,901,875,241 0.58% 236.97$
Per Capita
Ratios of General Bonded Debt OutstandingCity of Bloomington
Schedule 10
Taxable Assessed Value
(A)
General Obligation
BondRedevelopment
Bond
Park District Bond
Last 10 Fiscal Years
Percentage of Actual Taxable
Value of Property
V-17

Exhibit D-3
Direct DebtTotal City 16,740,000$ 100.00% 16,740,000
Overlapping DebtCounty 5,990,664 52.56% 3,148,503County Library (B) 11,440,000 52.56% 6,012,501Monroe County Community School District 100,007,056 59.25% 59,250,310Richland-Bean Blossom School District 31,505,000 4.11% 1,293,521
Total Overlapping Debt 148,942,720 69,704,835
Total direct and overlapping debt 165,682,720 86,444,835
(A) Source: Monroe County Auditor's "Abstract of Property Valuations."Net Assessed Value represents the assessed valuation on March 1, 2005 for taxes due and payable in 2006.
(B) The County and the County Library jurisdictions are coterminous
As of December 31st, 2005Direct and Overlapping Governmental Activities Debt
City of BloomingtonSchedule 11
Estimated Share of Overlapping
DebtGovernmental UnitDebt
Outstanding
Estimated Percentage Applicable
V-18

Exhibit D-4
1996 1997 1998 1999 2000 2001 2002 2003 2004 2005
Net Assessed Value $389,905,358 $425,517,143 $450,268,002 $468,726,186 $484,493,510 $508,261,482 $1,588,355,070 $2,613,405,036 $2,579,294,305 $2,901,875,241
Debt Limit 7,798,107 8,510,343 9,005,360 9,374,524 9,689,870 10,165,230 10,589,034 17,422,700 17,195,295 19,345,835
Total net debt appplicable to limit 1,460,000 915,000 8,260,000 7,855,000 7,750,000 7,750,000 7,635,000 7,495,000 7,435,000 7,365,000
Legal Debt Margin 6,921,049 8,017,632 1,177,831 1,615,480 2,085,511 2,445,586 3,094,991 9,987,700 9,760,295 11,980,835
Total net debt applicable to the limit as a percentage of debt limit 18.72% 10.75% 91.72% 83.79% 79.98% 76.24% 72.10% 43.02% 43.24% 38.07%
(A) Source: Monroe County Auditor's "Abstract of Property Valuations."Net Assessed Value represents the assessed valuation on March 1 of the previous year fortaxes due and payable in the year shown. In 2003, True Tax Value changed to market value.
(B) Article XIII, Section 1 of the Indiana Constitution states that debt may not exceed 2% of amunicipality's taxable assessed valuation. According to IC 36-1-15-2 - Legislative intent -Sec. 2. It is the intent of the general assembly that the amount of debt incurred by a political subdivision after February 28, 2001, not exceed, in the aggregate, the amount of debt that the political subdivision could have incurred under: (1) Article 13, Section 1of the Constitution of the State of Indiana; and (2) any statute imposing an assessed value limitation on the aggregate amount of bonds that a political subdivision may issue;if property were assessed at thirty-three and one-third percent (33.33%) of true tax value.
Last 10 Fiscal YearsLegal Debt Margin Information, Civil City
City of BloomingtonSchedule 12
V-19

Exhibit D-5
1996 1997 1998 1999 2000 2001 2002 2003 2004 2005
Net Assessed Value $389,905,358 $425,517,143 $450,268,002 $468,726,186 $484,493,510 $508,261,482 $1,588,355,070 $2,613,405,036 $2,579,294,305 $2,901,875,241
Debt Limit 4,498,107 8,510,343 9,005,360 9,374,524 9,689,870 10,165,230 10,589,034 17,422,700 17,195,295 19,345,835
Total net debt appplicable to limit 730,000 615,000 485,000 340,000 2,610,000 2,430,000 2,365,000 2,235,000 2,100,000 1,955,000
Legal Debt Margin 7,183,955 8,027,733 8,665,360 9,222,418 7,454,796 7,949,792 8,463,324 15,449,897 15,363,293 17,390,835
Total net debt applicable to the limit as a percentage of debtlimit 16.23% 7.23% 5.39% 3.63% 26.94% 23.91% 22.33% 12.83% 12.21% 10.11%
(A) Source: Monroe County Auditor's "Abstract of Property Valuations."Net Assessed Value represents the assessed valuation on March 1 of the previous year fortaxes due and payable in the year shown. In 2003, True Tax Value changed to market value.
(B) Article XIII, Section 1 of the Indiana Constitution states that debt may not exceed 2% of amunicipality's taxable assessed valuation. According to IC 36-1-15-2 - Legislative intent -Sec. 2. It is the intent of the general assembly that the amount of debt incurred by a political subdivision after February 28, 2001, not exceed, in the aggregate, the amount of debt that the political subdivision could have incurred under: (1) Article 13, Section 1of the Constitution of the State of Indiana; and (2) any statute imposing an assessed value limitation on the aggregate amount of bonds that a political subdivision may issue;if property were assessed at thirty-three and one-third percent (33.33%) of true tax value.
Schedule 12City of Bloomington
Legal Debt Margin Information, Redevelopment DistrictLast 10 Fiscal Years
V-20
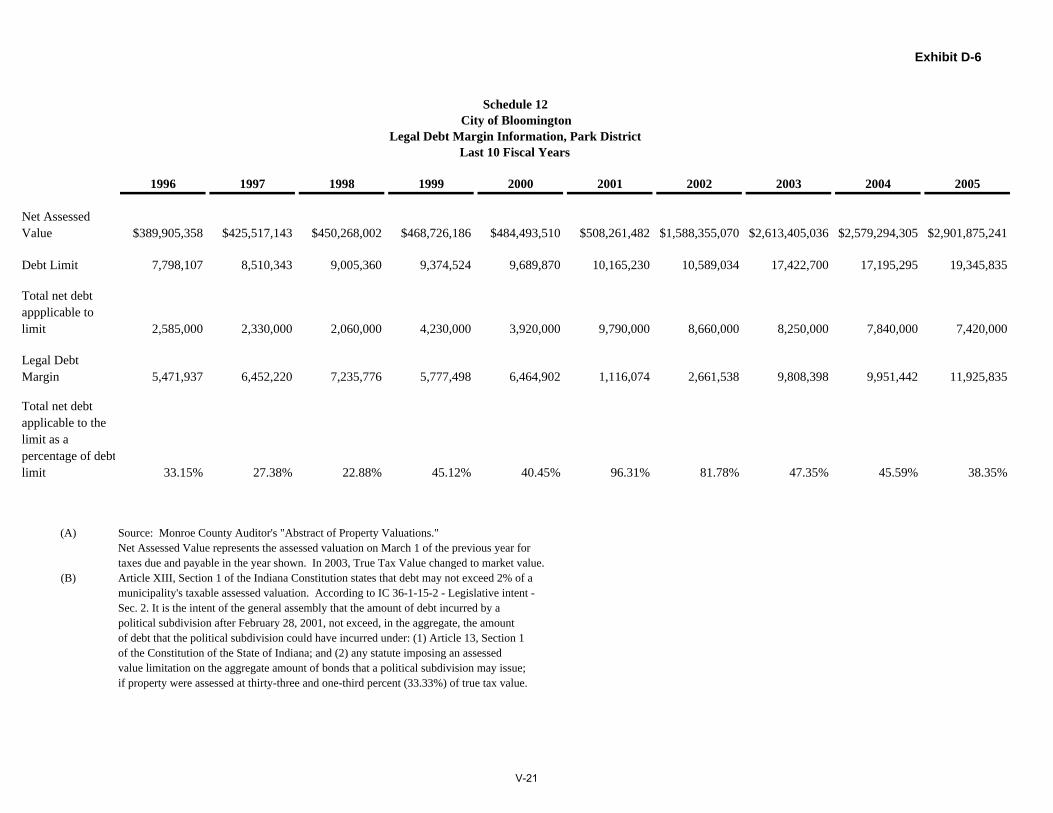
Exhibit D-6
1996 1997 1998 1999 2000 2001 2002 2003 2004 2005
Net Assessed Value $389,905,358 $425,517,143 $450,268,002 $468,726,186 $484,493,510 $508,261,482 $1,588,355,070 $2,613,405,036 $2,579,294,305 $2,901,875,241
Debt Limit 7,798,107 8,510,343 9,005,360 9,374,524 9,689,870 10,165,230 10,589,034 17,422,700 17,195,295 19,345,835
Total net debt appplicable to limit 2,585,000 2,330,000 2,060,000 4,230,000 3,920,000 9,790,000 8,660,000 8,250,000 7,840,000 7,420,000
Legal Debt Margin 5,471,937 6,452,220 7,235,776 5,777,498 6,464,902 1,116,074 2,661,538 9,808,398 9,951,442 11,925,835
Total net debt applicable to the limit as a percentage of debtlimit 33.15% 27.38% 22.88% 45.12% 40.45% 96.31% 81.78% 47.35% 45.59% 38.35%
(A) Source: Monroe County Auditor's "Abstract of Property Valuations."Net Assessed Value represents the assessed valuation on March 1 of the previous year fortaxes due and payable in the year shown. In 2003, True Tax Value changed to market value.
(B) Article XIII, Section 1 of the Indiana Constitution states that debt may not exceed 2% of amunicipality's taxable assessed valuation. According to IC 36-1-15-2 - Legislative intent -Sec. 2. It is the intent of the general assembly that the amount of debt incurred by a political subdivision after February 28, 2001, not exceed, in the aggregate, the amount of debt that the political subdivision could have incurred under: (1) Article 13, Section 1of the Constitution of the State of Indiana; and (2) any statute imposing an assessed value limitation on the aggregate amount of bonds that a political subdivision may issue;if property were assessed at thirty-three and one-third percent (33.33%) of true tax value.
Last 10 Fiscal YearsLegal Debt Margin Information, Park District
City of BloomingtonSchedule 12
V-21

Exhibit D-7
Fiscal Year Gross Revenue Principal Interest Total Coverage Ratio
1996 $7,156,717 $4,553,950 $2,602,767 $1,180,000 $350,818 $1,530,818 1.70
1997 7,356,994 4,604,532 2,752,462 545,000 720,893 1,265,893 2.17
1998 7,113,632 4,901,625 2,212,007 575,000 698,425 1,273,425 1.74
1999 7,645,210 5,241,745 2,403,465 600,000 673,865 1,273,865 1.89
2000 8,084,844 5,620,676 2,464,168 625,000 647,138 1,272,138 1.94
2001 8,186,076 5,379,701 2,806,375 655,000 618,582 1,273,582 2.20
2002 8,243,078 5,395,858 2,847,220 700,000 587,703 1,287,703 2.21
2003 9,981,750 5,394,905 4,586,845 730,000 553,798 1,283,798 3.57
2004 9,482,523 $7,005,222 $2,477,301 $970,000 $296,492 $1,266,492 1.96
2005 9,668,941 $6,054,553 $3,614,388 $945,000 $297,119 $1,242,119 2.91
*Note: Excludes depreciation expense
Net Available Revenue
Less: Operating Expenses
Water Revenue Bonds
Debt Service
Last 10 Fiscal YearsPledged-Revenue Coverage
City of BloomingtonSchedule 13
V-22

Exhibit D-8
Fiscal Year Principal Interest Total Coverage
1996 $7,961,376 $5,222,991 $2,738,385 $370,000 $1,415,463 $1,785,463 1.53
1997 8,641,124 5,824,646 2,816,478 630,000 1,382,500 2,012,500 1.40
1998 8,890,045 6,124,186 2,765,859 670,000 1,340,229 2,010,229 1.38
1999 10,931,662 6,322,953 4,608,709 715,000 1,294,748 2,009,748 2.29
2000 11,827,592 6,938,743 4,888,849 765,000 1,725,192 2,490,192 1.96
2001 12,327,749 6,865,298 5,462,451 965,000 1,600,814 2,565,814 2.13
2002 11,476,691 7,033,432 4,443,259 1,030,000 1,538,854 2,568,854 1.73
2003 13,952,074 7,353,607 6,598,467 1,090,000 1,473,948 2,563,948 2.57
2004 14,477,542 8,132,375 6,345,167 1,065,000 1,162,797 2,227,797 2.85
2005 13,645,040 8,582,336 5,062,704 1,410,000 1,133,440 2,543,440 1.99
*Note: Excludes depreciation expense
Debt Service
Wastewater Revenue Bonds
Net Available Revenue
Less: Operating Expenses
Special Assessment Collections
Last 10 Fiscal YearsPledged-Revenue Coverage
City of BloomingtonSchedule 13
V-23

Exhibit E-1
Year Population1
2005 70,642 23.3 N/A 25,377$ 5.12004 70,642 23.3 N/A 25,377 4.52003 69,987 23.3 24,320$ 25,377 4.32002 69,987 23.3 23,462 25,377 4.42001 70,359 23.3 23,003 25,377 3.92000 69,291 23.3 22,508 25,377 2.71999 66,743 N/A 21,152 18,393 2.91998 66,479 N/A 20,570 18,393 3.21997 66,479 N/A 19,491 18,393 3.21996 66,479 N/A 18,531 18,393 3.7
N/A = Not avaliableSources:1 U.S. Census Bureau2 U.S. Bureau of Economic Analysis, Bloomington, IN Metropolitan Statistical Area3 U.S. Bureau of Labor Statistics, Bloomington, IN Metropolitan Statistical Area
Schedule 14
Median Household
Income1Unemployment
Rate 3Median
Age1Per Capita Income2
Last Ten Fiscal YearsDemographic and Economic Statistics
City of Bloomington
V-24

Exhibit E-2
Employer # of Employees IndustryIndiana University 6,987 Education N/ABloomington Hospital 3,500 Medical Services N/ACook Inc. 2,061 Medical Instruments N/AMonroe County Schools 1,700 Education N/AGeneral Electric 1,110 Refrigerators N/ABaxter 840 Pharmaceuticals N/AMarsh Supermarkets 800 Grocery N/APTS 800 Electronic Remanufacturing N/AKroger 700 Grocery N/ACity of Bloomington 668 Government N/ATotal 19,166 N/A
Employer Employees IndustryN/A N/A N/A N/AN/A N/A N/A N/AN/A N/A N/A N/AN/A N/A N/A N/AN/A N/A N/A N/AN/A N/A N/A N/AN/A N/A N/A N/AN/A N/A N/A N/AN/A N/A N/A N/AN/A N/A N/A N/A
Total N/A N/A
N/A = Not AvailableSource: Bloomington Economic Development Corporation
Schedule 15
% of Total City Employment
1996
% of Total City Employment
City of BloomingtonPrincipal Employers
Current Year and Nine Years Ago
2005
V-25

Exhibit F-1
Function/Program 1996 1997 1998 1999 2000 2001 2002 2003 2004 2005General Government
Mayors Office 3 5 6 6 7 7 8 8 7 8Controllers Office 6 8 9 9 10 9 9 9 9 7Legal 9 9 9 9 9 9 9 9 9 8Employee Services 3 5 6 6 6 5 6 6 6 5ITS 11 14 14 15 17 17 18 18 18 16Other 6 17 17 17 17 18 17 18 17 17
Community DevelopmentCommunity and Family Resources 9 10 16 17 19 19 19 14 12 11Housing and Neighborhood Development 7 17 17 17 18 18 17 18 18 19Parks and Recreation 58 56Planning 11 11 13 13 13 13 14 15 14 14
Public SafetyPolice 90 91 97 104 108 111 113 115 118 119Fire 83 84 88 91 94 97 100 104 107 107Animal Shelter 12 12 12 12 13 13 14 14 15 15Parking Enforcement 11 22 14 15 16 14 14 14 14 17
Public WorksEngineering 13 16 17 15 15 8 9 9 8 9Sanitation 18 23 23 24 25 25 24 24 24 23Street 31 36 36 36 36 38 38 38 40 36Fleet 8 7 7 7 7 7 7 7 8 8Traffic 4 5 6 6 7 7 7 7 7 7
Utilities 152 154 152 155 162 163 165 164 165 166
Total 487 546 559 574 599 598 608 611 674 668
City of BloomingtonFull-time Equivalent City Government Employees by Function/Program
Last Ten Fiscal Years
Schedule 16
V-26

Exhibit F-2
Function/Program 1996 1997 1998 1999 2000 2001 2002 2003 2004 2005
PoliceCalls for service 36,122 38,463 40,867 46,925 52,686 54,774 50,067 47,019 48,212 52,440Arrests* 2,475 2,561 2,863 3,313 3,679 3,856 3,136 2,766 2,390 2,730Citations 3,022 3,287 3,372 4,263 7,594 7,564 4,718 4,107 4,592 6,314
FireCalls for service 1,610 1,621 1,748 2,097 2,350 2,578 2,886 2,766 2,896 3,046Fire inspections performed N/A 535 569 322 368 224 N/A N/A 649 981
Public WorksPotholes filled N/A N/A N/A N/A N\A N\A N\A 5,443 6,023 6,170
UtilitiesSewer line miles inspected 38.7 41.8 42.9 32.8 36.3 40.5 35.7 45.6 45.1 49.9Sewer line miles cleaned N/A N/A N/A 31.662 22.398 23.186 21.841 17.481 21.863 21.034Average daily consumption 12,835 12,952 12,988 13,873 13,199 13,514 13,783 13,633 13,733 13,369
(thousands of gallons)
N/A = Not available* Misd. & Felonies
Schedule 17City of Bloomington
Operating Indicators by Function/ProgramLast Ten Fiscal Years
V-27

Exhibit F-3
Function/Program 1996 1997 1998 1999 2000 2001 2002 2003 2004 2005
General Government Buidlings 52 53 54 55 57 60 61 64 66 66
PoliceMarked Police Vehicles 18 18 18 18 18 18 18 18 18 17
FireFire Stations 5 5 5 5 5 5 5 5 5 5 Fire Engines 13 13 13 13 13 13 14 14 14 14
Public WorksStreet Miles 191 200 198 198 198 205 215 223 228 235 Street Lights N/A N/A N/A N/A N/A N/A N/A N/A N/A N/A
Parks and RecreationPark Acreage 1,822 1,888 1,997 2,028 2,118 2,120 2,161 2,176 2,188 2,226 Baseball/Softball Diamonds 15 15 15 15 15 15 15 15 15 15 Basketball Courts 18 18 18 18 18 18 18 18 18 18
UtilitiesWater Main Miles N/A N/A N/A N/A N/A N/A N/A N/A N/A 389 Sewer Miles N/A N/A N/A N/A N/A N/A N/A N/A N/A 303 Storage Capacity N/A N/A N/A N/A N/A N/A N/A N/A N/A 16,200
(thousands of gallons) Fire Hydrants N/A N/A N/A N/A N/A N/A N/A N/A N/A 2,670
Sources: Various City Departments
City of BloomingtonCapital Asset Statistics by Function/Program
Last Ten Fiscal Years
Schedule 18
V-28