RFID In Retail Neco Can Vice President - Partner ATTEVO Inc.
Upload
nguyenngocCategory
view
216download
1
Comprehensive Analysis of RFID Performance in Retail Stores
Justin Patton – University of Arkansas
INSERT YOUR LOGO HERE
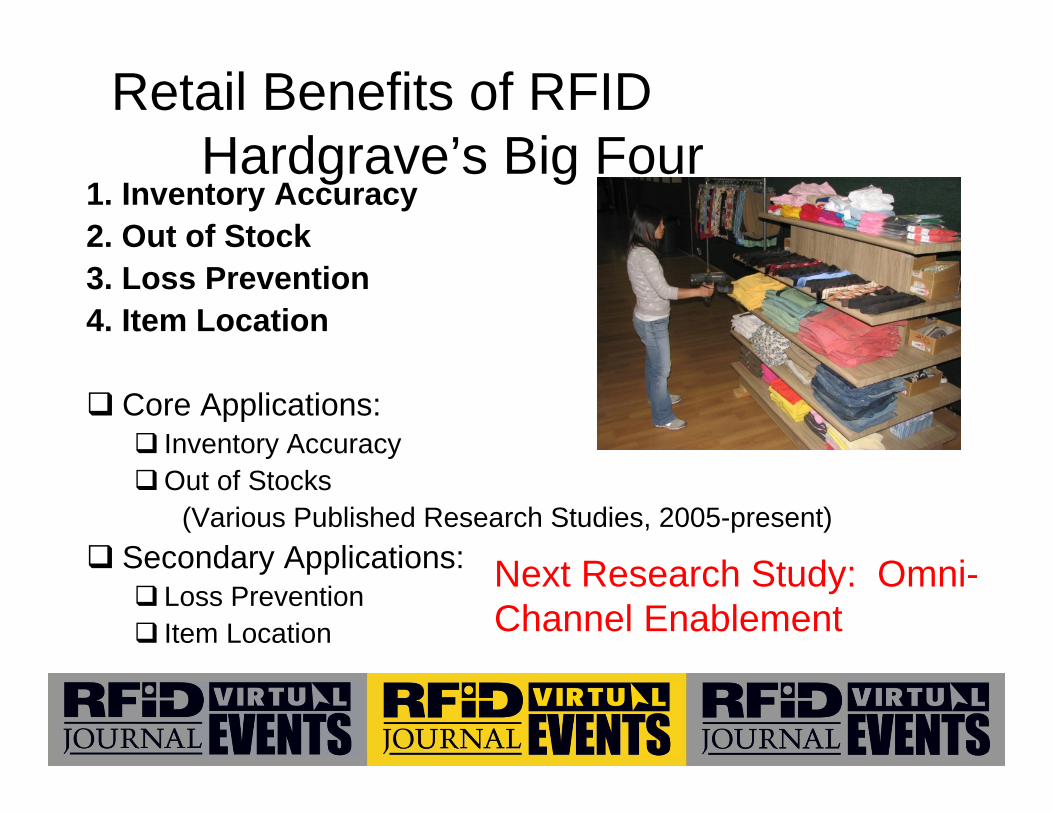
Retail Benefits of RFIDHardgrave’s Big Four
1. Inventory Accuracy2. Out of Stock3. Loss Prevention4. Item Location
Core Applications: Inventory Accuracy Out of Stocks
(Various Published Research Studies, 2005-present) Secondary Applications: Loss Prevention Item Location
Next Research Study: Omni-Channel Enablement
INSERT YOUR LOGO HERE
An RFID Story…• Tiger Apparel Believes in the Inventory
Accuracy and Out of Stock Benefits of RFID• Jumps into item level RFID pilot
– Handhelds and tags on sales floor• Tiger doesn’t do their homework, and
implementation is shoddy• Tiger doesn’t know it, but RFID is only capturing
80% of inventory in store (wrong tags, poor training, unorganized tagging, and lots of untagged product)
• Tiger adjusts their PI and replenishes based on incorrect RFID data
INSERT YOUR LOGO HERE
What Happens?
• Tiger Apparel sees reduction in Out of Stocks• Tiger Apparel sees a sales lift from increased
In Stock
So what’s wrong?• 20% of the shelf inventory is invisible• Shelf is overstocked by 20%• PI is inaccurate, but UNDERstated, not
OVERstated• Replenishment occurs FASTER than necessary
INSERT YOUR LOGO HERE
What Happens Next?
• Increased capital carrying costs of excess inventory
• 20% of shelf shrink and theft are masked• When someone finally figures out the
problem - Markdown Time
INSERT YOUR LOGO HERE
How well are we REALLY doing?RFID Store Audits – Specialized Cycle Count
– Remove and Profile EACH article of clothing• Barcode• EPC• Inlay Model• Tagging Issues (no inlay, encoding problems, double
inlays, loose inlays, etc.)• Read Performance Issues (no read, dead inlay, weak
inlay, no read on store cycle count, etc.)– Compare Audit data to store Cycle Counts and
Store PI
INSERT YOUR LOGO HERE
Audit Program so far…• Two years in operation – Over 100 Audits
from 7 Retailers• Full night per audit, usually 5-10 students
in a store• Multiple categories of apparel and non-
apparel items• Mainly in retail, also tested in other RF
inventory systems
7
INSERT YOUR LOGO HERE
So what does the data say?
• Full Report This Summer“Collected RFID Field Performance – EPC Auditing”
• Let’s look at Denim and Basics• Aggregate data from 4 retailers, 14 stores• Both New and Established RFID stores• Multiple geographic locations
8
INSERT YOUR LOGO HERE
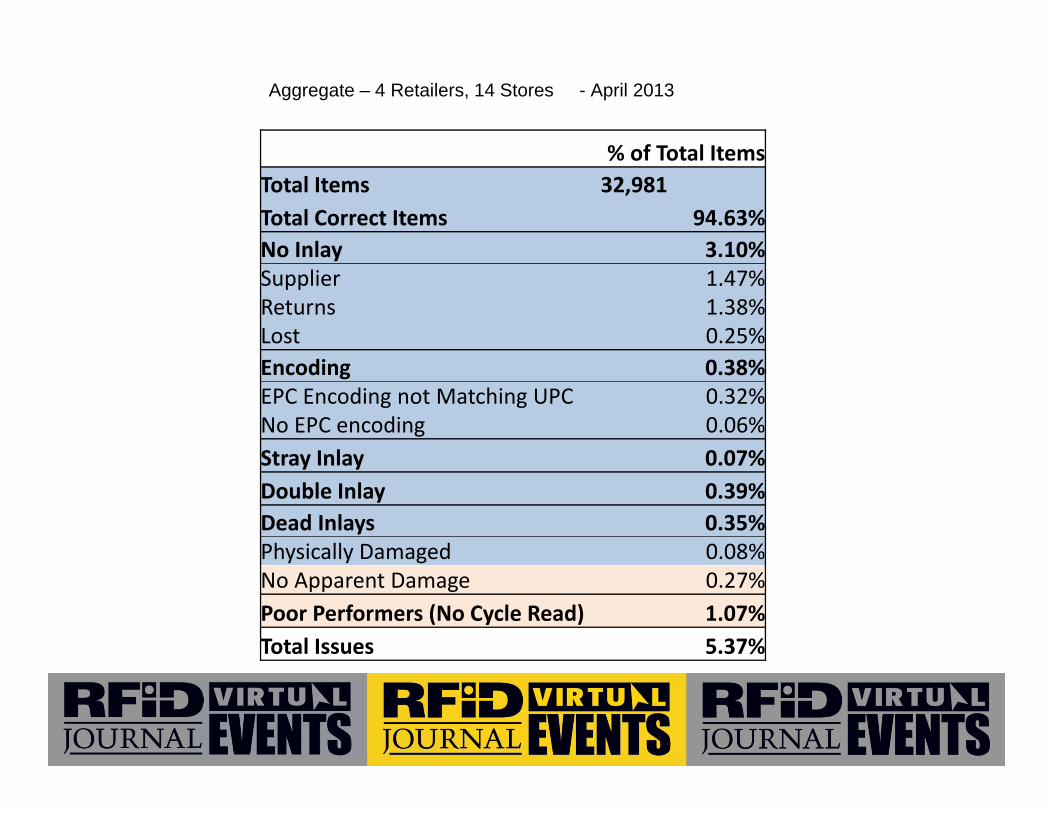
Aggregate – 4 Retailers, 14 Stores - April 2013
% of Total ItemsTotal Items 32,981Total Correct Items 94.63%No Inlay 3.10%Supplier 1.47%Returns 1.38%Lost 0.25%Encoding 0.38%EPC Encoding not Matching UPC 0.32%No EPC encoding 0.06%Stray Inlay 0.07%Double Inlay 0.39%Dead Inlays 0.35%Physically Damaged 0.08%No Apparent Damage 0.27%Poor Performers (No Cycle Read) 1.07%Total Issues 5.37%
INSERT YOUR LOGO HERE
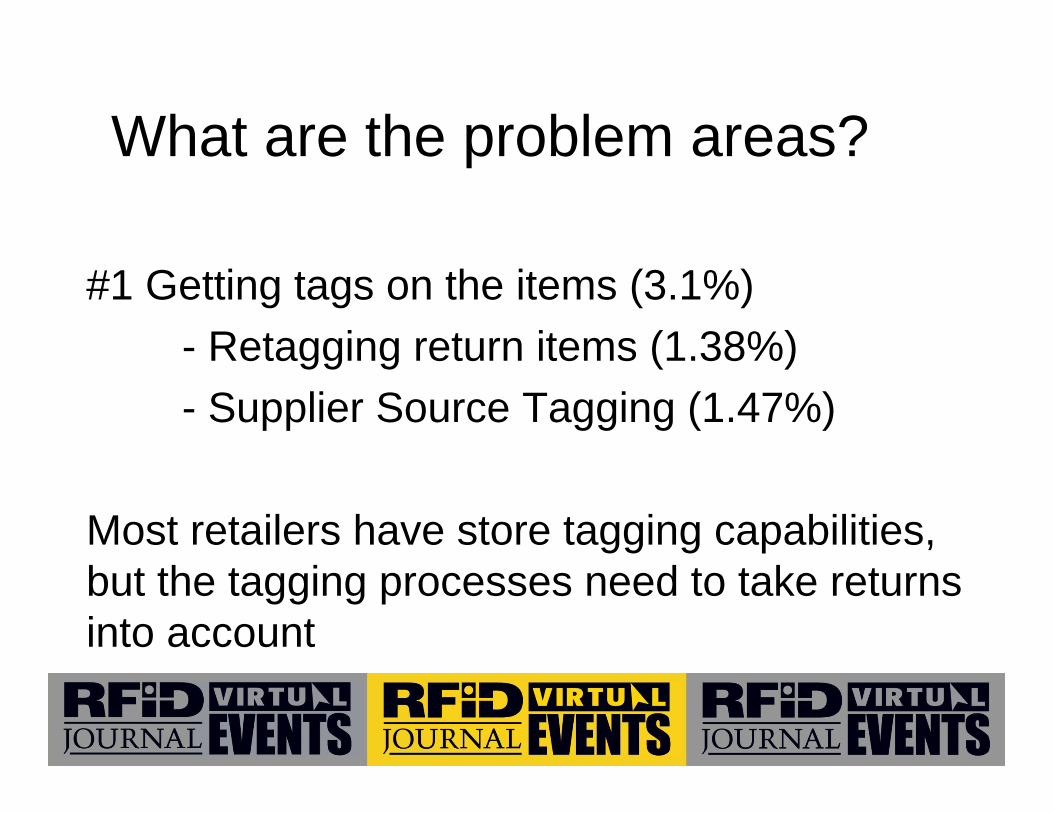
What are the problem areas?
#1 Getting tags on the items (3.1%)- Retagging return items (1.38%)- Supplier Source Tagging (1.47%)
Most retailers have store tagging capabilities, but the tagging processes need to take returns into account
INSERT YOUR LOGO HERE
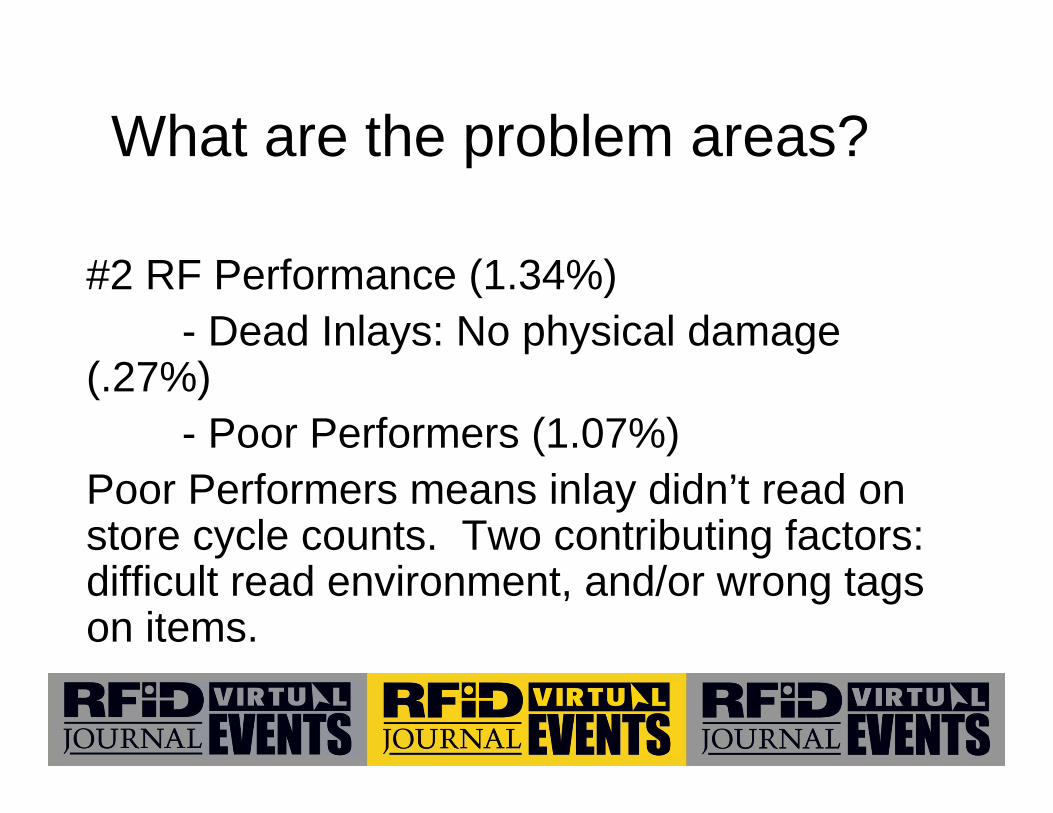
What are the problem areas?
#2 RF Performance (1.34%)- Dead Inlays: No physical damage
(.27%)- Poor Performers (1.07%)
Poor Performers means inlay didn’t read on store cycle counts. Two contributing factors: difficult read environment, and/or wrong tags on items.
INSERT YOUR LOGO HERE
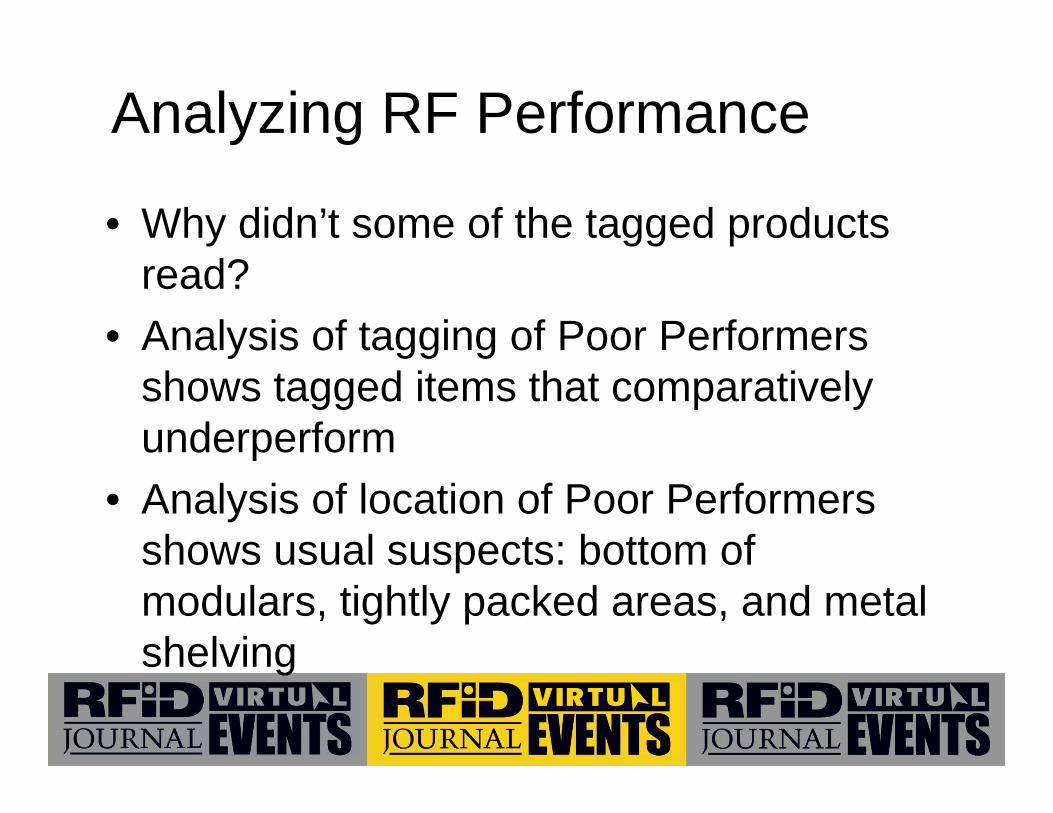
Analyzing RF Performance
• Why didn’t some of the tagged products read?
• Analysis of tagging of Poor Performers shows tagged items that comparatively underperform
• Analysis of location of Poor Performers shows usual suspects: bottom of modulars, tightly packed areas, and metal shelving
INSERT YOUR LOGO HERE
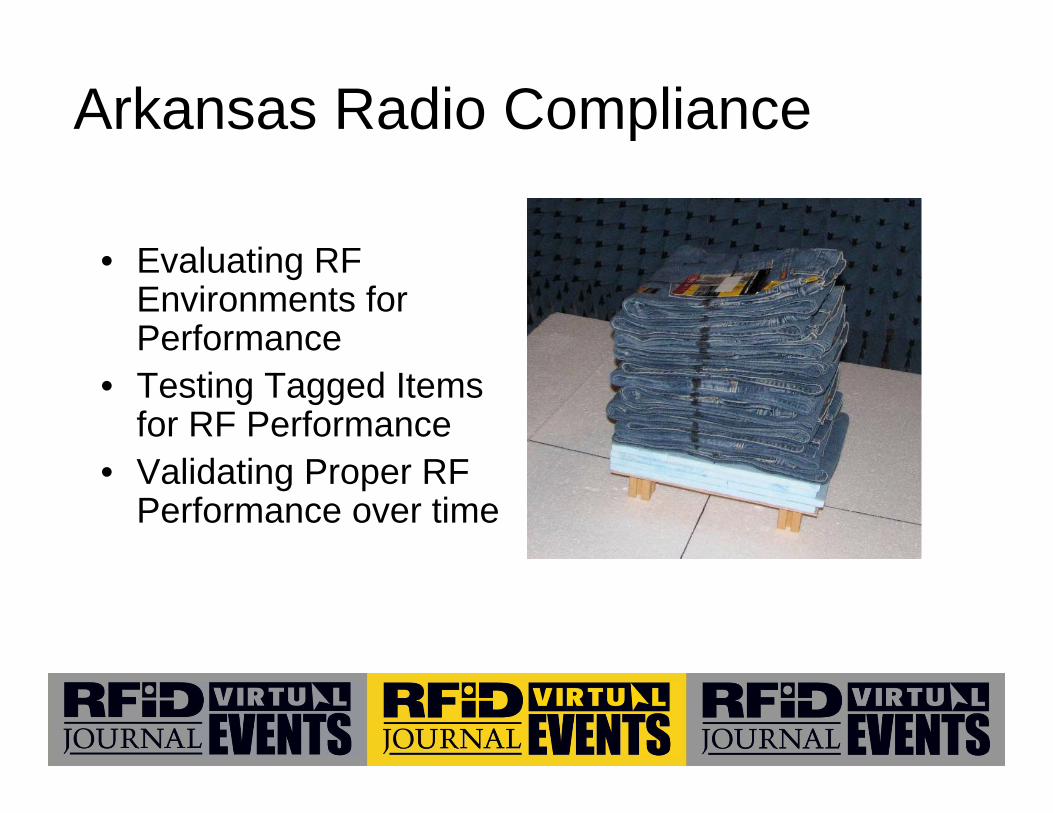
Arkansas Radio Compliance
• Evaluating RF Environments for Performance
• Testing Tagged Items for RF Performance
• Validating Proper RF Performance over time
INSERT YOUR LOGO HERE
14
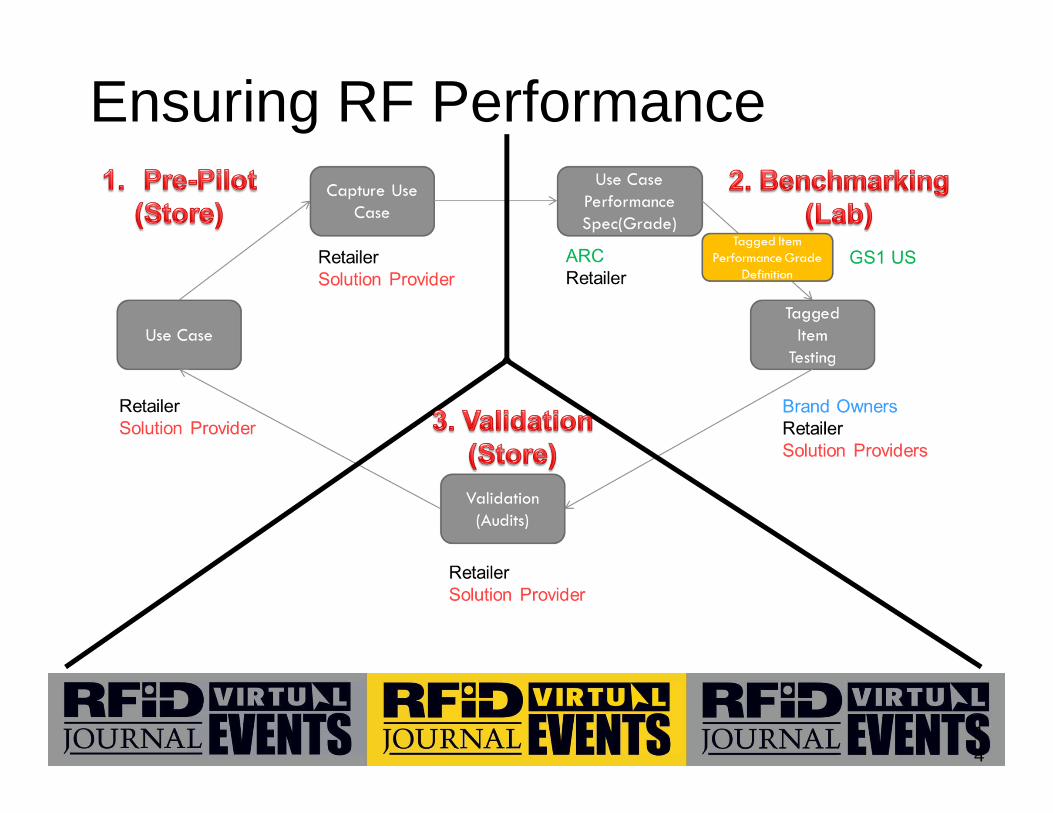
Ensuring RF Performance
INSERT YOUR LOGO HERE
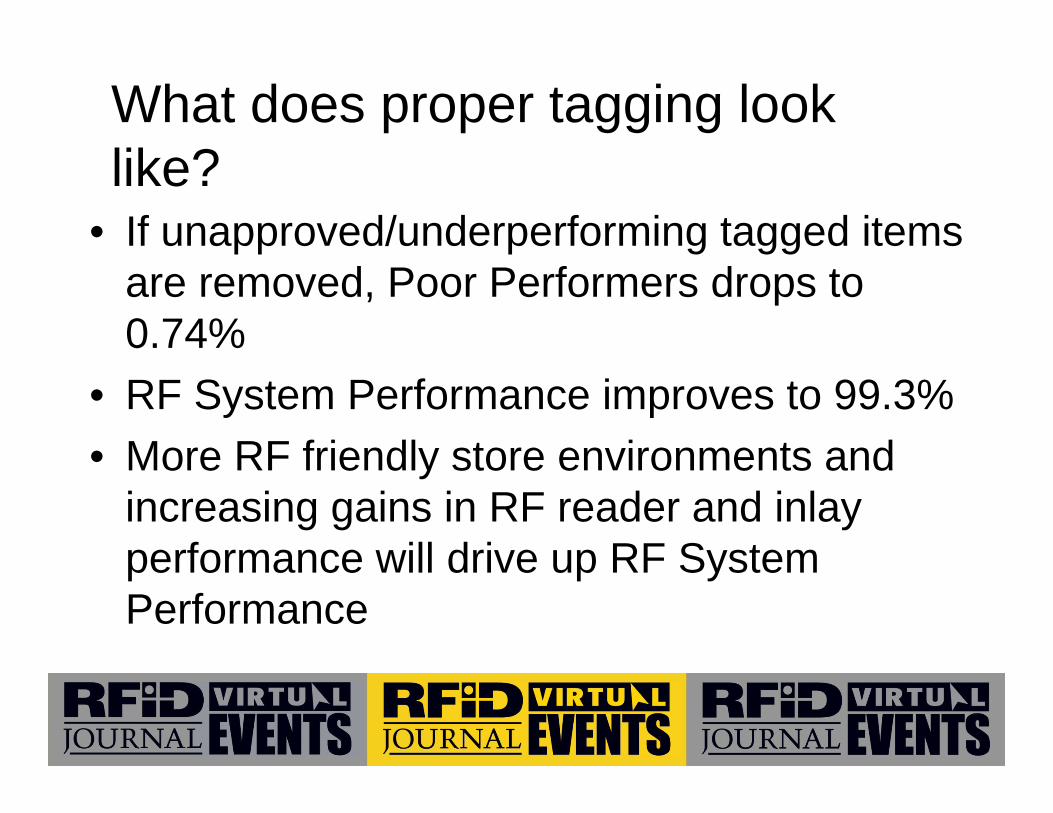
What does proper tagging look like?
• If unapproved/underperforming tagged items are removed, Poor Performers drops to 0.74%
• RF System Performance improves to 99.3%• More RF friendly store environments and
increasing gains in RF reader and inlay performance will drive up RF System Performance
INSERT YOUR LOGO HERE
Chipping Away at the Last 4%
• We can easily achieve RF Capture Rates of 99%+
• How can we tackle the other 4% of the data capture problem?– Process, process, process– Change management
16
INSERT YOUR LOGO HERE
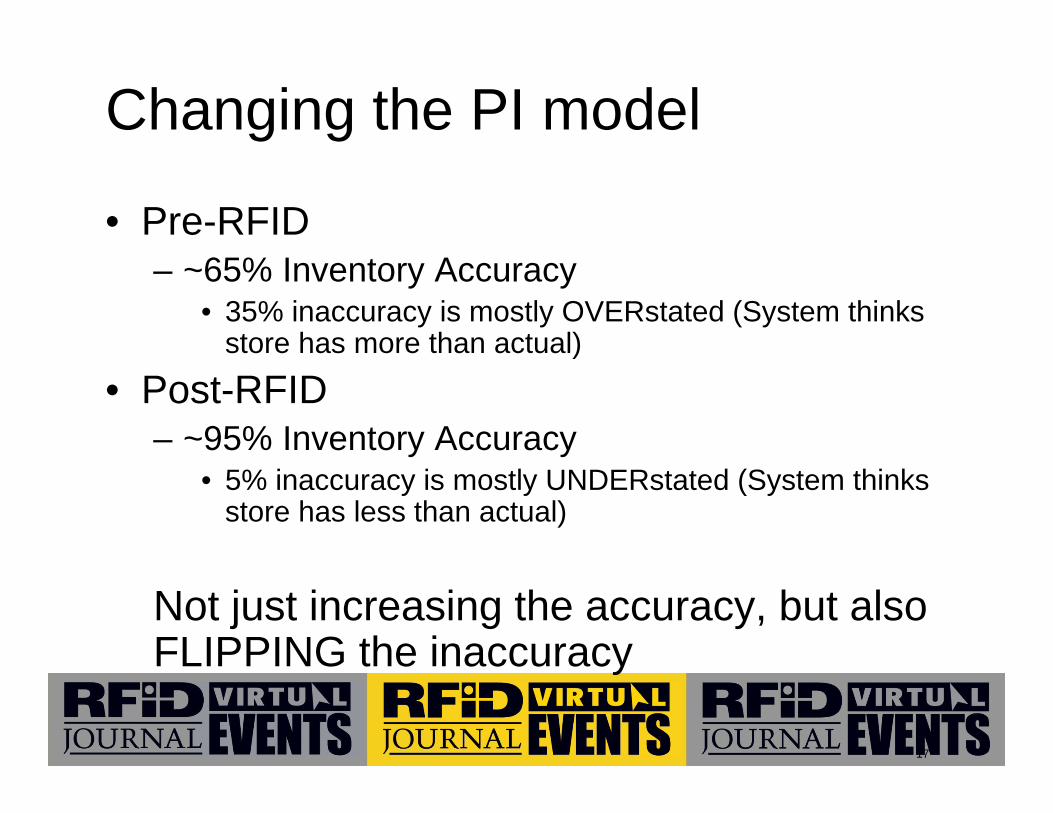
Changing the PI model
• Pre-RFID– ~65% Inventory Accuracy
• 35% inaccuracy is mostly OVERstated (System thinks store has more than actual)
• Post-RFID– ~95% Inventory Accuracy
• 5% inaccuracy is mostly UNDERstated (System thinks store has less than actual)
Not just increasing the accuracy, but also FLIPPING the inaccuracy
17
INSERT YOUR LOGO HERE
Justin Patton ([email protected])
RFID White papers can be found under the research tab at:
http://itri.uark.edu/rfid