Composition of Commingled Recyclables Before and … · 16/03/2011 · by the five largest...
31
Composition of Commingled Recyclables Before and After Processing Prepared for the Oregon Commingled Recycling System Improvement Workgroup By: Solid Waste Policy and Program Development Section Land Quality Division Oregon Department of Environmental Quality March 2011 Last Updated: 03/16/11 By: Peter Spendelow 11-LQ-014 Report
Transcript of Composition of Commingled Recyclables Before and … · 16/03/2011 · by the five largest...

Composition of Commingled Recyclables Before and After Processing Prepared for the Oregon Commingled Recycling System Improvement Workgroup By: Solid Waste Policy and Program Development Section Land Quality Division Oregon Department of Environmental Quality March 2011
Last Updated: 03/16/11 By: Peter Spendelow 11-LQ-014
Report

Table of Contents
Summary .......................................................................................................................................... 1
Background and Methodology ......................................................................................................... 2
Inbound recycling: ....................................................................................................................... 2
Outbound recycling commodities: ............................................................................................... 3
Confidentiality ............................................................................................................................. 3
Results: Inbound Recycling ......................................................................................................... 3
Film Plastic in Inbound Recycling .............................................................................................. 6
Results: Outbound Recycling: ..................................................................................................... 7
Results for Individual Facilities ................................................................................................. 11
Sources of Error ......................................................................................................................... 12
Discussion and Conclusions........................................................................................................... 14
Appendix A .................................................................................................................................. A-1
Appendix B .................................................................................................................................. B-1
Commingled Recycling Material Definitions .............................................................................. B-1
INBOUND RECYCLING CATEGORIES ............................................................................. B-1 PAPER ................................................................................................................................ B-1
PLASTICS (see Additional Component Information) ........................................................ B-2
FOOD, WOOD, YARD DEBRIS ....................................................................................... B-3
GLASS ................................................................................................................................ B-3
METALS (and Appliances) ................................................................................................. B-3
OUTBOUND RECYCLING CATEGORIES ......................................................................... B-4
Discussion of why materials were classified as "Rigorously-sorted," "Acceptably-sorted," or "Not acceptable" in outbound recycling commodities. ........................................................... B-5
This report prepared by:
Oregon Department of Environmental Quality 811 SW 6th Avenue Portland, OR 97204
1-800-452-4011 www.oregon.gov/deq
Contact:
Peter Spendelow (503) 229-5253

1 1 Composition of Commingled Recyclables Before and After Processing 1
Summary Following discussions and requests for information by the Oregon Commingled Recycling Workgroup, the Oregon Department of Environmental Quality conducted a study of the composition of commingled recyclable materials received by the five largest commingled recycling processing facilities in Oregon, and also looked at composition and contamination levels in each of the major commodities that were sorted and marketed by these same five processors. The study had two goals:
1. To collect information on the quantity of different materials and contaminants delivered to Oregon commingled recycling processing facilities as part of a commingled recycling mix
2. To determine the processing facilities’ effectiveness in separating different materials and sending each recyclable material to its proper market, and each non-recyclable contaminant to disposal.
For inbound recyclables received at the facilities, key results are as follows:
• About 9 to 10 percent of incoming commingled materials were contaminants that were not supposed to be set out for recycling as part of the commingled recycling mix.
• Although this is a higher contamination level than was found in DEQ’s 2004-2005 study, the increase is probably mainly due to changes in collection programs. In 2005, a substantial number of curbside collection programs still used 15-gallon bins to collect recyclables. By 2009, nearly all Oregon programs had moved to collecting materials in large roll carts. Roll cart programs are known to collect higher volumes of good recyclables from households, but they also collect significantly higher levels of contaminants. The overall contamination levels in 2009-2010 were similar to contamination levels in roll carts in the 2004-2005 study.
• Listing just contaminants, close to 3 percent of total commingled material was from plastics of types not acceptable in commingled programs, 2 percent was from non-recyclable paper, and 1 percent was from glass. Other nonrecyclables and bagged garbage made up the remaining approximately 3 percent.
• Excluding film plastic that appears to have been purposefully collected as part of a commercial recycling program, 0.66 percent of total incoming commingled material was film plastic.
Key results for outbound recyclable and recycling sorting efficiency include:
• Overall, 92 to 94 percent of the total recyclable material entering the sort line at processing facilities ended up being properly sorted and sent to the correct markets.
• The degree to which different materials were sorted and recycled correctly correlated strongly with the market share of that material. Recyclable paper, making up about 83 percent of the total incoming material, had 93 to 96 percent properly sorted and sent to the correct markets.
• Recyclable plastic containers made up about 4 percent of total commingled recyclables. 84 percent were properly sorted and sent to plastic markets, while 14 percent ended up in paper going to paper mills, and 2 percent were directly disposed.
• Rarer materials had poor sorting effectiveness. Close to one-third of aluminum cans ended up improperly sorted, with most of the missorted containers ending up in the paper. Close to two-thirds of aluminum foil went out in other materials or in garbage instead of with other metal. Paper beverage cartons also were inconsistently sorted, with many ending up in newspaper or other incompatible grades of paper.
• The degree to which contaminants were picked out for disposal depended strongly on the contaminant and the harm that the contaminant could cause to finished product. Almost all glass was removed from the outbound recyclable commodities, and 75 percent of film plastic was removed, but only 25 percent of non-recyclable paper was removed.

2 2 Composition of Commingled Recyclables Before and After Processing 2
Background and Methodology In Oregon, almost all residential recycling and much commercial recycling is collected as commingled material. Oregon programs pick up glass containers separate from other materials or do not include glass in the on-route collection program, choosing to collect glass through recycling depots or some other method. This is unlike single-stream collection programs in much of the rest of the nation that collect all materials, including glass, mixed in together. Although residential and commercial commingled recycling collection programs exist throughout the state, almost all commingled materials from Oregon were processed and sorted at the five commingled recycling processing facilities then operational in the greater Portland Metro area:
• Far West Fibers - Hillsboro • Far West Fibers - Portland • KB Recycling • Oregon Recycling Systems, and • SP Recycling
A sixth facility (Far West Fiber - Beaverton), began operation in the fall of 2010 after this study was conducted. Smurfit Recycling also processes some commingled recycling tonnage at a facility in the Portland area. A small amount of material is processed at a facility in Grants Pass, and some Oregon commingled recyclables are processed out-of-state. These tonnages are small when compared to the tons processed by the five facilities included in the study. The study includes both residential and commercial commingled materials in the inbound and outbound composition analysis. Sky Valley Associates provided all field-sorting and data recording for this study. DEQ and Sky Valley Associates jointly developed the methodology, material categories and analysis methods with input from processing facility operators and other members of the Oregon Commingled Recycling Systems Improvement Workgroup. The five facility operators also played a major role in carrying out this study, including capturing and holding samples of both inbound and outbound recycling for sorting, providing space for sort crew to work, and providing confidential data on quantities of commodities they sell and dispose of. This information was necessary for performing the calculations needed to calculate sorting effectiveness for different materials. Inbound recycling: The first part of this study looked at samples of commingled recyclables delivered to the processing facilities. Quarterly sampling took place at the five facilities, with between five and 11 samples averaging 300 pounds or more taken per quarter at each facility, for a total of 150 samples. Work was conducted between August 2009 and June 2010. Each sample was sorted into 48 separate material categories, and then each material category was weighed and recorded. Definitions for material categories are found in Appendix B. In addition, counts were made of film plastics for one-quarter of the samples, randomly chosen, in order to determine the average weight of each piece of film plastic. Samples at each facility were selected to be representative of all commingled recycling received by that facility. This was based on tonnages recycling collectors report sending to each facility as part of their annual Oregon Material Recovery Survey, as well as reports by the facilities themselves about the sources and quantities of commingled recyclables they receive. Factors taken into account in the sampling plan included geographic source of the recyclables, collection company, season, and whether loads were from residential or commercial sources. Information on residential versus commercial sources was only available for loads brought directly in collection trucks to the facilities, and only for about half of the facilities. For recyclables generated outside of the Portland metro area, recyclables arrived in transfer trailers that included a mix of residential and commercial material.

3 3 Composition of Commingled Recyclables Before and After Processing 3
Outbound recycling commodities: The second part of the study looked at commodities sorted from commingled recyclables at each facility. The first step was to visit each facility and determine all sorted commodity and waste streams produced by sorting commingled materials. Facility operators were then asked for the approximate quantity of each commodity produced per ton of commingled materials sorted. DEQ used this information to develop a sampling plan for each facility. Sampling involved collecting samples of each commodity or waste stream after it had been fully sorted/processed and just before it was about to be baled or packaged to be shipped out of the facility for recycling or disposal. Generally, samples were about 200 to 250 pounds each, but smaller sample sizes were used for some relatively uncommon materials such as aluminum. Also, much smaller sample sizes were used for some disposed materials such as screen fines sent for disposal that include lots of broken glass and small contaminants. Each sample was sorted into 17 material categories and the component materials were weighed and recorded. Definitions of these material categories are also found in Appendix B. Each facility was sampled at two different times at roughly six-month intervals starting October 2009 and finishing May 2010. It took two days to complete the number of samples needed for each period, and these were done on two separate days usually at least a week apart. Appendix A Table A4 shows a generic sampling plan representative of the sampling done at each of the five facilities. Plans for specific facilities are not included because of confidentiality issues. Originally, the intent was to perform unannounced inspections and sorts for outbound recycling. However, during the study, some paper mills were experiencing periodic down-times due to low product demand, creating uncertainty in some of the facilities (particularly SP Recycling) about whether they would be operating in their normal mode from day to day. Because of this project’s limited budget, DEQ could not afford to send the Sky Valley crew to a facility unless it could be assured of loads to sort. Thus, all facilities were contacted at least a day in advance of sampling to ensure the facilities were operating as normal and sorting would be possible at that facility. Confidentiality Much information used for developing sampling plans for both inbound and outbound recycling was based on information DEQ compiles from its annual Material Recovery Survey - information that DEQ is required to hold confidential by state law. For outbound recycling, by agreement with processing facility operators, DEQ is releasing the facilities’ information in aggregate. DEQ is also releasing results for individual facilities, but is only specifying facilities by a letter code without identifying or releasing information that could be used to identify individual facilities. In addition, facility operators requested that not even DEQ know which facility was which in the results. Thus all facilities were identified by an anonymous letter code A through E. DEQ developed the database and analysis methodology to be used for the study, but Sky Valley Associates did the compilation of results without revealing to DEQ the raw data or indicating individual facilities’ identity in the results. Results: Inbound Recycling Table 1 shows the average composition of commingled recyclables received at each of the five facilities, plus the aggregate for all facilities combined. Beneath each entry in the table is the 90 percent confidence interval for that entry. This table combines materials into the 17 material categories used in the outbound recycling part of the study. Appendix Table A1 shows the same information for each of the 48 separate materials measured. Table 2 shows the same information as Table 1, but for four different sources of recyclable material:
• Residential routes (Portland metro area only) • Commercial routes (Portland metro area only) • Transfer trailers (mainly from outside the Portland metro area, but also includes some Portland-area loads from
aggregation points and mixed waste processing facilities) • Unknown - no data delineating whether this was from a residential or commercial route were gathered.
Overall, about 9 to 10 percent of material delivered as commingled recyclables to processing facilities are contaminants that should not have been set out for recycling. As discussed later, the glass percentage might be underestimated due to the way samples were obtained. A DEQ study conducted in 2004-2005 that involved directly collecting and sorting

4 4 Composition of Commingled Recyclables Before and After Processing 4
Table 1. Composition of incoming commingled recyclable materials at each facility
Material Facility ==> All FWH FWP KB ORS SP
Newspaper-compatible paper 46.28% 42.26% 43.32% 44.56% 53.00% 49.91% (90% conf. interval) (44.07-48.48%) (37.17-47.34%) (36.90-49.74%) (40.24-48.87%) (48.33-57.67%) (46.21-53.61%)
Corrugated Cardboard/brown paper 25.33% 29.10% 29.02% 26.36% 18.49% 21.91%
(23.18-27.49%) (23.64-34.57%) (22.15-35.88%) (23.12-29.61%) (15.82-21.17%) (18.53-25.29%)
Paper not ONP-compatible (bleached) 2.85% 2.30% 3.36% 4.56% 2.61% 1.86%
(2.37-3.34%) (1.47-3.13%) (2.44-4.28%) (2.44-6.68%) (1.94-3.29%) (1.44-2.28%)
Paper not ONP-compatible (unbleached) 7.48% 8.14% 6.33% 7.81% 7.45% 7.57%
(7.05-7.91%) (7.06-9.21%) (5.55-7.12%) (6.74-8.87%) (6.23-8.67%) (6.79-8.35%)
Gable Top Beverage Carton 0.30% 0.31% 0.32% 0.17% 0.39% 0.32%
(0.26-0.34%) (0.21-0.40%) (0.18-0.45%) (0.12-0.22%) (0.32-0.46%) (0.27-0.37%)
Aseptic Drink cartons 0.03% 0.01% 0.04% 0.01% 0.06% 0.02%
(0.02-0.03%) (0.01-0.02%) (0.01-0.06%) (0.00-0.01%) (0.03-0.10%) (0.02-0.03%)
Paper not recyclable curbside* 2.00% 1.88% 2.28% 1.65% 2.20% 2.05%
(1.76-2.25%) (1.50-2.25%) (1.39-3.17%) (1.25-2.04%) (1.57-2.83%) (1.63-2.46%)
Commingled curbside plastic 4.54% 4.31% 3.64% 4.60% 5.48% 4.90%
(4.24-4.84%) (3.65-4.97%) (2.85-4.44%) (4.01-5.19%) (4.68-6.27%) (4.36-5.44%)
Film plastic* 1.05% 0.55% 1.88% 0.53% 0.31% 1.64%
(0.65-1.45%) (0.43-0.68%) (0.60-3.15%) (0.38-0.67%) (0.22-0.39%) (0.39-2.90%)
Rigid non-curb plastic* 1.85% 2.23% 1.67% 1.57% 1.85% 1.84%
(1.55-2.15%) (1.16-3.30%) (0.96-2.39%) (1.29-1.84%) (1.39-2.32%) (1.52-2.17%)
All glass* 1.01% 0.67% 1.19% 0.51% 1.99% 1.01%
(0.81-1.21%) (0.44-0.91%) (0.54-1.84%) (0.34-0.68%) (1.23-2.74%) (0.67-1.36%)
Aluminum beverage cans 0.27% 0.23% 0.23% 0.32% 0.27% 0.28%
(0.24-0.29%) (0.18-0.29%) (0.17-0.29%) (0.26-0.39%) (0.18-0.36%) (0.23-0.34%)
Aluminum foil/foil containers 0.13% 0.10% 0.11% 0.10% 0.17% 0.17%
(0.11-0.15%) (0.08-0.12%) (0.06-0.16%) (0.07-0.13%) (0.13-0.22%) (0.13-0.21%)
Steel/tinned cans 2.41% 2.10% 1.92% 2.23% 2.99% 2.90%
(2.21-2.61%) (1.73-2.47%) (1.48-2.35%) (1.93-2.53%) (2.37-3.61%) (2.43-3.37%)
Other scrap metal & aluminum** 1.28% 1.87% 1.66% 1.52% 0.67% 0.56%
(0.95-1.60%) (0.77-2.98%) (0.92-2.41%) (0.80-2.24%) (0.32-1.02%) (0.37-0.74%)
Hazardous materials* 0.06% 0.01% 0.06% 0.04% 0.06% 0.12%
(0.02-0.09%) (0.00-0.02%) (0.01-0.10%) (0.00-0.07%) (0.00-0.13%) (0.00-0.24%)
Other nonrecyclables & bagged garbage* 3.14% 3.91% 2.97% 3.48% 2.01% 2.93%
(2.63-3.65%) (2.44-5.39%) (2.03-3.92%) (2.08-4.89%) (1.15-2.86%) (2.16-3.70%)
Total commingled contaminants* 9.40% 9.65% 10.19% 8.53% 8.47% 9.69%
(8.44-10.36%) (7.24-12.07%) (7.41-12.96%) (6.71-10.35%) (6.73-10.21%) (7.94-11.45%)
* Materials considered contaminants in commingled recycling are shaded gray in Table 1. ** A small portion of scrap metal was not acceptable in commingled recycling due to excess size or weight. In this table and subsequent tables, the following initials refer to facilities: FWH = Far West Fibers Hillsboro FWP = Far West Fibers Portland KB = KB Recycling ORS = Oregon Recycling Systems SP = SP Recycling

5 5 Composition of Commingled Recyclables Before and After Processing 5
Table 2. Composition of incoming commingled recyclable materials by source Material Source ==> Residential Commercial Transfer Unknown Newspaper-compatible paper 53.16% 26.07% 46.97% 47.86%
(90% conf. interval) (50.54-55.78%) (17.28-34.87%) (43.93-50.00%) (43.94-51.77%)
Corrugated Cardboard/brown paper 18.34% 48.51% 23.80% 23.51% (16.78-19.90%) (38.39-58.64%) (21.22-26.38%) (20.44-26.59%)
Paper not ONP-compatible (bleached) 3.45% 1.29% 2.61% 3.52% (2.70-4.20%) (0.78-1.80%) (1.70-3.52%) (2.14-4.90%)
Paper not ONP-compatible (unbleached) 7.69% 5.91% 7.67% 7.90% (6.97-8.41%) (4.40-7.42%) (7.13-8.20%) (6.53-9.27%)
Gable Top Beverage Carton 0.42% 0.09% 0.29% 0.28% (0.32-0.51%) (0.03-0.15%) (0.24-0.33%) (0.21-0.35%)
Aseptic Drink cartons 0.04% 0.02% 0.02% 0.04% (0.02-0.05%) (0.00-0.03%) (0.01-0.02%) (0.01-0.06%)
Paper not recyclable curbside* 1.75% 2.85% 2.02% 1.78% (1.52-1.99%) (1.47-4.23%) (1.70-2.33%) (1.24-2.32%)
Commingled curbside plastic 4.68% 1.88% 5.19% 4.89% (4.18-5.19%) (1.14-2.61%) (4.79-5.59%) (4.16-5.61%)
Film plastic* 0.40% 2.60% 1.26% 0.56% (0.33-0.46%) (0.70-4.50%) (0.45-2.07%) (0.26-0.86%)
Rigid non-curb plastic* 1.62% 2.45% 1.93% 1.65% (1.37-1.86%) (0.28-4.61%) (1.70-2.16%) (1.32-1.98%)
All glass* 1.38% 0.62% 0.79% 1.14% (0.87-1.88%) (0.21-1.03%) (0.58-1.01%) (0.70-1.58%)
Aluminum beverage cans 0.31% 0.08% 0.29% 0.28% (0.26-0.37%) (0.05-0.11%) (0.26-0.33%) (0.21-0.34%)
Aluminum foil/foil containers 0.14% 0.04% 0.14% 0.15% (0.10-0.17%) (0.01-0.07%) (0.12-0.17%) (0.11-0.20%)
Steel/tinned cans 2.06% 2.06% 2.72% 2.62% (1.81-2.31%) (1.24-2.89%) (2.39-3.04%) (2.14-3.10%)
Other scrap metal & aluminum** 1.95% 1.08% 0.68% 1.52% (1.06-2.84%) (0.21-1.95%) (0.50-0.85%) (0.86-2.17%)
Hazardous materials* 0.03% 0.06% 0.09% 0.03% (0.00-0.07%) (0.00-0.13%) (0.01-0.17%) (0.00-0.07%)
Other nonrecyclables & bagged garbage* 2.59% 4.39% 3.54% 2.28% (1.86-3.33%) (1.98-6.80%) (2.77-4.31%) (1.37-3.20%)
Total commingled contaminants* 8.13% 13.19% 9.79% 7.93% (7.16-9.10%) (7.74-18.65%) (8.47-11.12%) (6.36-9.50%)
Number of samples 47 20 57 26 * Materials considered contaminants in commingled recycling are shaded gray. ** A small portion of scrap metal was not acceptable in commingled recycling due to excess size or weight. recycling setouts from households found that recyclables set out in small bins had contamination levels of only 2 to 3 percent, while recyclables set out in roll carts had contamination levels of 9 to 10 percent on average. In the current study, residential routes from the Portland area had slightly less contamination than commercial routes or transfer trailers - on the order of 7 to 9 percent. This is not statistically significantly different from what DEQ found for roll carts statewide in its 2004-05 study. Recycling collection programs have changed substantially since 2004-05, with almost all Oregon programs switching to roll carts in place of bins. Thus, the amount of contamination in roll carts does not seem to have changed substantially since 2005. However, total level of contamination received at processing facilities has probably increased substantially in that time frame as many collection programs completed their switch from bins, with 2 to 3 percent contamination to roll carts, with 9 to 10 percent.

6 6 Composition of Commingled Recyclables Before and After Processing 6
The study found no statistically significant difference between facilities in overall level of contamination of inbound recyclables. There were, however, significant differences in film plastic, but this is due to a very small number of commercial loads that that appear to include separated high concentrations of recyclable film plastic. Eliminating those three specific loads sharply reduced variation between facilities in the amount of film plastic. Film plastic will be discussed in more detail in a later section. One area of significant difference between facilities is in the ratio of newspaper to cardboard. This might represent differences in amount of commercial vs. residential materials received by each facility. Otherwise, though, there were few statistically significant differences in composition of inbound commingled materials received by the different facilities. Looking at Table 2, it is clear that there are significant differences between residential and commercial commingled recyclable materials. Loads from transfer trailers more closely resembled residential than commercial sources but definitely included at least some commercial material. High levels of cardboard characterized most commercial loads while high levels of newspaper, magazines, and paper, metal, and plastic beverage containers characterized residential loads. For example, 14 of the 20 commercial loads had more than 40 percent corrugated cardboard and brown paper. In contrast, none of the 47 residential loads had more than 34 percent cardboard. Paradoxically, the two loads with the lowest amount of cardboard were also identified as being commercial loads. It may be that these included mainly multifamily dwellings, as these are commonly collected with commercial trucks, but possible misidentification of the load cannot be ruled out. Film Plastic in Inbound Recycling Processing facilities identify film plastic, which includes plastic bags, tape, sheeting and other non-rigid items, as being particularly problematic. Film plastic can wrap around spinning elements of sorting equipment, impairing its effectiveness for sorting and causing frequent downtime to cut plastic off the equipment. As can be seen in Table 2, commercial loads of recyclables had significantly more plastic film than did residential loads. Generally, commingled recycling collection programs exclude film plastic from the list of acceptable materials. However, some collectors and processors make exceptions for a limited number of commercial generators who produce large amounts of clean, recyclable polyethylene or polypropylene film. In the current study, at least 3 of the 150 samples seemed to include plastic film from such large commercial generators. All three of these samples contained more than 15 percent plastic film by weight, and much of this was clean polyethylene film. No other samples contained more than 9 percent plastic film by weight, and only one contained more than 5 percent plastic film by weight. Two of the "high plastic" samples were from commercial collection trucks, and the third was a transferred load from a facility which processes mixed commercial waste. If these three samples are excluded from the results, the average amount of film plastic and total contaminants in commercial and transfer loads both drop substantially, as seen in Table 3 below. Table 3. Effect of excluding three "high plastic" samples comparing film plastic and total contaminants, by source. Material All Residential Comm. Transfer Unknown Film plastic 1.05% 0.40% 2.60% 1.26% 0.56%
(90% conf. interval) (0.65-1.45%) (0.33-0.46%) (0.70-4.50%) (0.45-2.07%) (0.26-0.86%)
Film plastic - excluding 3 samples 0.66% 0.40% 1.12% 0.79% 0.56% (0.54-0.79%) (0.33-0.46%) (0.30-1.95%) (0.65-0.92%) (0.26-0.86%)
Total commingled contaminants 9.40% 8.13% 13.19% 9.79% 7.93% (8.44-10.36%) (7.16-9.10%) (7.74-18.65%) (8.47-11.12%) (6.36-9.50%)
Total contaminants excluding 3 samples 8.87% 8.13% 10.61% 9.38% 7.93% (8.08-9.67%) (7.16-9.10%) (6.00-15.23%) (8.23-10.53%) (6.36-9.50%)
The same is also true for the two facilities that received these loads, as seen in the "FWP" and "SP" columns of Table 4 below.

7 7 Composition of Commingled Recyclables Before and After Processing 7
Table 4. Effect of excluding 3 "high plastic" samples comparing film plastic and total contaminants, by facility. Material All FWH FWP KB ORS SP Film plastic - all samples 1.05% 0.55% 1.88% 0.53% 0.31% 1.64%
(90% conf. interval) (0.65-1.45%) (0.43-0.68%) (0.60-3.15%) (0.38-0.67%) (0.22-0.39%) (0.39-2.90%)
Film plastic - excluding 3 samples 0.66% 0.55% 0.88% 0.53% 0.31% 0.91% (0.54-0.79%) (0.43-0.68%) (0.35-1.40%) (0.38-0.67%) (0.22-0.39%) (0.65-1.18%)
Total commingled contaminants 9.40% 9.65% 10.19% 8.53% 8.47% 9.69% (8.44-10.36%) (7.24-12.07%) (7.41-12.96%) (6.71-10.35%) (6.73-10.21%) (7.94-11.45%)
Total contaminants excluding 3 samp. 8.87% 9.65% 8.31% 8.53% 8.47% 9.05% (8.08-9.67%) (7.24-12.07%) (7.05-9.57%) (6.71-10.35%) (6.73-10.21%) (7.63-10.46%)
For the study’s inbound recycling part, DEQ separated two grades of film plastic: "Recyclable" and "Nonrecyclable.” Recyclable film plastic included a variety of clean polyolefin film sources including grocery bags, dry cleaner bags, shrink wrap, lumber wrap and commercial bags. See Appendix B for a more-complete definition. In Oregon's solid waste disposal stream, non-recyclable film outweighs recyclable film by more than a 2:1 ratio. In the inbound recyclable study, if all samples are included, then recyclable film appears to outweigh nonrecyclable film, although the difference is not statistically significant. If the three commercial "high plastic" samples are excluded, then the recyclable film plastic shows a substantial drop, such that the nonrecyclable film plastic is significantly higher, as seen in Table 5 below. Table 5. Types of film plastic with and without three "high plastic" samples All samples Excluding 3 samples
Average 90% conf.
interval Average 90% conf.
interval Film plastic 1.05% (0.65-1.45%) 0.66% (0.54-0.79%) Recyclable polyolefin plastic film 0.60% (0.23-0.96%) 0.25% (0.20-0.30%) Nonrecyclable plastic film 0.45% (0.32-0.59%) 0.41% (0.29-0.53%)
In this study, counts were also made of film plastic in addition to weights for a quarter of the samples. In the 38 samples counted, there were 1,173 individual items in the 93.78 pounds of film plastic weighed, which translates to 12.5 items per pound. By chance, none of the three "high plastic" samples were designated for counting. However, one sample from a commercial source had 15 pieces of nonrecyclable film plastic that were very heavy - weighing a total of 25.3 pounds. If that sample is excluded from the count/weight calculation, the average number of pieces per pound of film plastic climbs to 16.9 pieces per pound. Appendix A Table A3 lists weights and counts for the 38 samples. Results: Outbound Recycling: Table 6 gives the average composition of each of the material commodities (or groups of commodities or wastes) sorted from commingled recyclables by the five Oregon commingled recycling processing facilities. Names of commodities sold or disposed of are listed in the column headings. This is the traditional way that markets and processing facilities would look at commodity contamination information. To determine sorting effectiveness, though, requires looking at the information in a different way, shown in Table 7. Based on information provided confidentially by the processors, the bottom row of Table 7 gives the percentage breakdown by weight of each outgoing commodity. Based on samples sorted in this study for each commodity (shown in Table 6), totals for each commodity were broken down into 17 rows of material categories. Unshaded cells in Table 7 are those materials that were properly sorted into the correct commodity category. Cells that are darkly-shaded are materials that were clearly sorted into the wrong categories and likely ultimately disposed by the mill or facility purchasing the material. Lightly shaded cells (yellow, for those viewing this in color) are ones where it is unclear if materials were properly sorted. For example, large plastic items like damaged toys or storage bins are not supposed to be set out at the curb for recycling, but if they are made entirely of polyethylene or polypropylene, it would be perfectly acceptable for the processor to market that plastic along with all rigid plastic containers of similar resin type. Appendix B

8 8 Composition of Commingled Recyclables Before and After Processing 8
Table 6. Composition of outgoing commodities/waste sorted from commingled recyclables.
Material Commodity==> ONP OCC Other Paper
Rigid Plastic Aluminum Tin Cans
Scrap Metal
Glass/ Film/
Garbage Newspaper-compatible paper 86.71% 3.30% 16.60% 0.88% 0.95% 1.05% 0.69% 13.14% Corrugated Cardboard/brown paper 2.66% 83.75% 23.64% 0.07% 0.29% 0.09% 0.05% 2.70% Paper not ONP-compatible (bleached) 3.87% 0.66% 3.00% 0.01% 0.01% 0.03% 0.00% 0.23% Paper not ONP-compatible (unbleached) 3.26% 9.67% 33.29% 0.07% 0.04% 0.06% 0.02% 1.65% Gable Top Beverage Carton 0.15% 0.12% 16.08% 0.01% 0.06% 0.01% 0.00% 0.22% Aseptic Drink Cartons 0.01% 0.01% 2.58% 0.00% 0.01% 0.00% 0.00% 0.02% *Non-recyclable paper 0.66% 1.60% 3.12% 0.97% 0.17% 1.42% 0.04% 3.60% Plastic bottles & tubs curbside OK 0.90% 0.26% 0.51% 84.24% 0.90% 0.78% 0.08% 1.16% *Film Plastic 0.25% 0.11% 0.08% 0.09% 0.18% 0.18% 0.07% 10.07% *Other plastic not acceptable at curb 0.59% 0.26% 0.23% 12.31% 0.35% 0.73% 0.81% 8.12% *Glass 0.04% 0.00% 0.04% 0.07% 0.26% 0.02% 0.00% 29.34% Aluminum beverage cans 0.13% 0.03% 0.10% 0.06% 79.45% 0.34% 0.01% 0.13% Aluminum foil/pet cans 0.08% 0.00% 0.06% 0.02% 14.60% 0.15% 0.84% 0.27% Steel/tinned cans 0.36% 0.06% 0.31% 0.18% 2.15% 91.82% 2.20% 1.26% Other scrap metal& aluminum 0.10% 0.01% 0.08% 0.02% 0.30% 2.91% 93.63% 1.52% *hazardous materials 0.00% 0.00% 0.00% 0.06% 0.00% 0.13% 0.39% 0.10% *other nonrecyclables 0.24% 0.15% 0.27% 0.94% 0.28% 0.29% 1.15% 26.49% Total 100.00% 100.00% 100.00% 100.00% 100.00% 100.00% 100.00% 100.00% Number of samples 88 22 9 43 10 11 10 68
Notes.
• ONP designates any grade of paper sold as a grade of old newspaper. OCC designates any grade of paper sold as old corrugated containers. Paper sold as mixed scrap paper, hi-grade paper, or drink boxes are included in the "Other Paper" commodity
• Each column is a commodity (or combination of commodities) sold or disposed by the processing facilities and the column data show its component makeup
• Each row is a material category sorted as part of this study. • * An asterisk in front of the material name means this material was not supposed to be included in the commingled recycling by the generator. • High-grade office paper was included in the "Newspaper-compatible paper" material sort category by the waste composition crew, but when
marketed as a separate commodity, it was included in the "Other Paper" column.
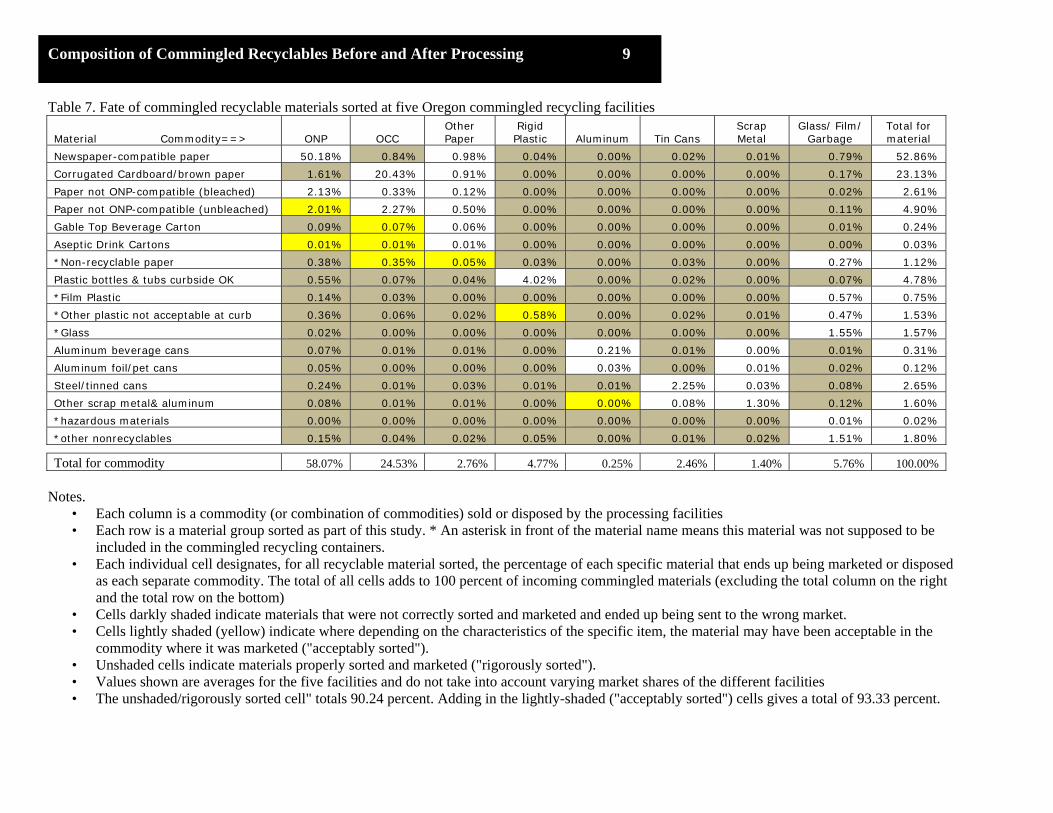
9 9 Composition of Commingled Recyclables Before and After Processing 9 Table 7. Fate of commingled recyclable materials sorted at five Oregon commingled recycling facilities
Material Commodity==> ONP OCC Other Paper
Rigid Plastic Aluminum Tin Cans
Scrap Metal
Glass/ Film/ Garbage
Total for material
Newspaper-compatible paper 50.18% 0.84% 0.98% 0.04% 0.00% 0.02% 0.01% 0.79% 52.86% Corrugated Cardboard/brown paper 1.61% 20.43% 0.91% 0.00% 0.00% 0.00% 0.00% 0.17% 23.13% Paper not ONP-compatible (bleached) 2.13% 0.33% 0.12% 0.00% 0.00% 0.00% 0.00% 0.02% 2.61% Paper not ONP-compatible (unbleached) 2.01% 2.27% 0.50% 0.00% 0.00% 0.00% 0.00% 0.11% 4.90% Gable Top Beverage Carton 0.09% 0.07% 0.06% 0.00% 0.00% 0.00% 0.00% 0.01% 0.24% Aseptic Drink Cartons 0.01% 0.01% 0.01% 0.00% 0.00% 0.00% 0.00% 0.00% 0.03% *Non-recyclable paper 0.38% 0.35% 0.05% 0.03% 0.00% 0.03% 0.00% 0.27% 1.12% Plastic bottles & tubs curbside OK 0.55% 0.07% 0.04% 4.02% 0.00% 0.02% 0.00% 0.07% 4.78% *Film Plastic 0.14% 0.03% 0.00% 0.00% 0.00% 0.00% 0.00% 0.57% 0.75% *Other plastic not acceptable at curb 0.36% 0.06% 0.02% 0.58% 0.00% 0.02% 0.01% 0.47% 1.53% *Glass 0.02% 0.00% 0.00% 0.00% 0.00% 0.00% 0.00% 1.55% 1.57% Aluminum beverage cans 0.07% 0.01% 0.01% 0.00% 0.21% 0.01% 0.00% 0.01% 0.31% Aluminum foil/pet cans 0.05% 0.00% 0.00% 0.00% 0.03% 0.00% 0.01% 0.02% 0.12% Steel/tinned cans 0.24% 0.01% 0.03% 0.01% 0.01% 2.25% 0.03% 0.08% 2.65% Other scrap metal& aluminum 0.08% 0.01% 0.01% 0.00% 0.00% 0.08% 1.30% 0.12% 1.60% *hazardous materials 0.00% 0.00% 0.00% 0.00% 0.00% 0.00% 0.00% 0.01% 0.02% *other nonrecyclables 0.15% 0.04% 0.02% 0.05% 0.00% 0.01% 0.02% 1.51% 1.80%
Total for commodity 58.07% 24.53% 2.76% 4.77% 0.25% 2.46% 1.40% 5.76% 100.00%
Notes.
• Each column is a commodity (or combination of commodities) sold or disposed by the processing facilities • Each row is a material group sorted as part of this study. * An asterisk in front of the material name means this material was not supposed to be
included in the commingled recycling containers. • Each individual cell designates, for all recyclable material sorted, the percentage of each specific material that ends up being marketed or disposed
as each separate commodity. The total of all cells adds to 100 percent of incoming commingled materials (excluding the total column on the right and the total row on the bottom)
• Cells darkly shaded indicate materials that were not correctly sorted and marketed and ended up being sent to the wrong market. • Cells lightly shaded (yellow) indicate where depending on the characteristics of the specific item, the material may have been acceptable in the
commodity where it was marketed ("acceptably sorted"). • Unshaded cells indicate materials properly sorted and marketed ("rigorously sorted"). • Values shown are averages for the five facilities and do not take into account varying market shares of the different facilities • The unshaded/rigorously sorted cell" totals 90.24 percent. Adding in the lightly-shaded ("acceptably sorted") cells gives a total of 93.33 percent.

10 10 Composition of Commingled Recyclables Before and After Processing 10 Table 8. Sorting effectiveness for different materials
Material Commodity==> ONP OCC Other Paper
Rigid Plastic Aluminum Tin Cans
Scrap Metal
Glass/ Film/
Garbage Total
% rigorously
sorted
% acceptably
sorted Newspaper-compatible paper 94.93% 1.58% 1.85% 0.08% 0.00% 0.05% 0.02% 1.49% 100% 96.78% 96.78% Corrugated Cardboard/brown paper 6.96% 88.35% 3.93% 0.02% 0.00% 0.01% 0.00% 0.72% 100% 92.29% 92.29% Paper not ONP-compatible (bleached) 81.60% 12.72% 4.76% 0.12% 0.00% 0.01% 0.00% 0.79% 100% 99.08% 99.08% Paper not ONP-compatible (unbleached) 41.08% 46.38% 10.27% 0.07% 0.00% 0.03% 0.01% 2.15% 100% 56.65% 97.73% Gable Top Beverage Carton 39.12% 29.99% 25.64% 0.30% 0.07% 0.09% 0.00% 4.80% 100% 25.64% 55.63% Aseptic Drink Cartons 30.52% 29.90% 29.25% 1.61% 0.09% 0.00% 0.00% 8.63% 100% 29.25% 89.67% *Non-recyclable paper 33.82% 31.39% 4.48% 2.77% 0.03% 2.90% 0.06% 24.53% 100% 24.53% 60.41% Plastic bottles & tubs curbside OK 11.60% 1.48% 0.79% 84.22% 0.04% 0.44% 0.02% 1.40% 100% 84.22% 84.22% *Film Plastic 19.12% 3.35% 0.42% 0.55% 0.06% 0.46% 0.17% 75.86% 100% 75.86% 75.86% *Other plastic not acceptable at curb 23.46% 4.24% 1.29% 38.20% 0.05% 1.08% 0.90% 30.78% 100% 30.78% 68.97% *Glass 1.20% 0.00% 0.01% 0.14% 0.04% 0.03% 0.00% 98.59% 100% 98.59% 98.59% Aluminum beverage cans 22.27% 2.15% 2.28% 0.90% 66.95% 2.12% 0.07% 3.26% 100% 67.02% 67.02% Aluminum foil/pet cans 40.27% 0.32% 3.57% 1.41% 24.88% 3.48% 9.10% 16.97% 100% 33.98% 33.98% Steel/tinned cans 9.05% 0.53% 1.06% 0.34% 0.23% 84.89% 1.00% 2.90% 100% 85.89% 85.89% Other scrap metal& aluminum 4.77% 0.43% 0.40% 0.07% 0.05% 5.18% 81.46% 7.64% 100% 86.64% 86.69% *hazardous materials 0.00% 0.00% 0.00% 17.72% 0.00% 13.42% 22.98% 45.87% 100% 45.87% 45.87% *other nonrecyclables 8.44% 2.13% 1.21% 2.90% 0.04% 0.55% 1.24% 83.50% 100% 83.50% 83.50%
Notes.
• This table shows for each separate material entering the processing facility in the commingled stream, how much of that material ended up in each of the outgoing recycling commodities or waste streams. The total in each row adds to 100%
• Cells that are darkly shaded indicate materials that were not correctly sorted and marketed, and ended up being sent to the wrong market. • Cells that are lightly shaded (yellow) indicate where depending on the characteristics of the specific item, the material may have been acceptable
in the commodity where it was marketed ("acceptably sorted"). • Cells that are unshaded indicate materials that were properly sorted and marketed ("rigorously sorted"). • The values shown are averages for the 5 facilities, and do not take into account the varying market shares of the different facilities.

11 11 Composition of Commingled Recyclables Before and After Processing 11
contains a discussion of why certain materials were considered "rigorously-sorted," "acceptably-sorted" or "not acceptable" when marketed in specific commodities. On average, at least 90.2 percent of the incoming material was sorted into the correct commodity or waste category ("rigorously-sorted"). This is determined by adding together all of the unshaded cells in Table 7. Adding in the lightly-shaded cells where the material may have been correctly sorted raises this total to 93.3 percent ("acceptably-sorted"). If the analysis is limited to just the recyclable materials (those without an asterisk in front of their name), the results are that 92.1 percent were rigorously sorted into the correct category. Adding in the lightly-shaded cells raises this to 94.4 percent for the acceptably-sorted materials. Table 8 is very similar to Table 7, but looks at sorting efficiency for each individual material. In general, the vast majority of the paper ended up being marketed to an appropriate market. The exceptions were two paper container materials that make up only a very small portion of the commingled material: gable-top (milk) cartons and aseptic (foil-lined) beverage cartons. There was little agreement among facilities as to the appropriate way to market these beverage cartons, and overall they ended up being fairly evenly divided between being included with newspaper, with corrugated cardboard, and with other paper - either in a "mixed scrap" grade or in the case of one facility, in a separate beverage carton grade. The gable-top containers are generally made with wet-strength paper and will not pulp in most newsprint pulpers. Aseptic cartons may pulp in a newsprints pulper, but the percentage that do is not known by DEQ. One other problem is that significant amounts of brown paper or unbleached chipboard is also ending up in newspaper. Some of that paper may not pulp, and that which does pulp ends up lowering the brightness of the newsprint produced at the paper mill. About 7 percent of the cardboard was lost by being marketed as ONP. A significant amount of "non-recyclable paper" also ends up in the paper commodities. This includes paper such as freezer boxes (wet-strength paper), paper towels, and mixes of paper and other materials. Although nominally "not recyclable," some of this paper may actually pulp in appropriate types of pulpers, but generally this would not pulp in newsprint pulpers. For plastic bottles and tubs acceptable in most Oregon curbside programs, 84.22 percent ended up properly in plastic bales. The other 15.78 percent mainly ended up being marketed with paper, where it eventually is discarded as a contaminant. Aluminum cans make up only a small portion of the Oregon commingled recycling stream, since most beverage cans in Oregon are covered under the bottle bill and end up being recycled in that system. However, for those aluminum cans that are recycled through commingled collection, only about two-thirds ends up being marketed as aluminum. Most of the rest end up as contaminants in the paper, where they are ultimately disposed. Small amounts also end up in with tin cans or in the garbage. Although the quantities involved are relatively small, the high intrinsic energy and value of aluminum increases its importance. Aluminum foil is also a commodity present in very small amounts in commingled recycling. However, it is very difficult to sort at the processing facilities. Only about one-third gets marketed as aluminum. Forty percent remains in the newspaper, where again it ends up being disposed. About 17 percent ends up directly being disposed by the processing facilities. Tin cans and scrap metal had moderately high levels of sorting effectiveness, with close to 87 percent being marketed to appropriate markets for both. All of the Oregon facilities use magnets to separate the tin cans and other ferrous metals from the rest of the recyclables. For tin cans, the largest lost is probably lids and flattened cans that become covered or embedded in newspaper such that the magnet fails to attract them. Results for Individual Facilities Table 9 gives, for each of the five Oregon facilities, an estimate of the percentage of properly sorted material at each facility based on the methodology outlined above in relation to Table 7. The overall value for all five facilities combined for the percentage acceptably sorted was 93.33 percent, but the individual facilities ranged from 91.50 percent to 96.35 percent in this measure. Similarly, if just recyclable materials were considered, the percentage properly sorted ranged from 92.87 up to 96.50 for the five facilities.

12 12 Composition of Commingled Recyclables Before and After Processing 12
Table 9. Percent of material properly sorted by facility
Overall Recyclable material only
Facility
overall % acceptable
sort
overall % rigorous
sort
% acceptable
sort % rigorous
sort A 91.50% 88.51% 92.87% 90.54% B 96.35% 95.18% 96.50% 95.81% C 94.27% 91.14% 95.44% 93.20% D 92.85% 90.05% 93.95% 91.93% E 92.42% 87.64% 93.82% 90.58%
All 93.33% 90.24% 94.37% 92.12% Table 10 gives the percentage of acceptably-sorted material by facility for each material. Paper materials are not included in Table 10 since DEQ believes that such results might be able to be used to identify at least some of the facilities. Note that the numbers for "hazardous materials" in Table 10 are probably fairly meaningless due to high variability. Hazardous materials are rare in commingled materials, constituting just a few hundredth of one percent of the incoming material by weight. Just getting one or two cans or plastic bottles with some measureable residue of hazardous material (such as motor oil) inside could dramatically affect the percentage of "acceptably-sorted" hazardous material. Table 10. Percentage of specific materials acceptably sorted - by facility
Material Facility Code ==> A B C D E All
Plastic bottles & tubs curbside OK 72.89% 94.15% 86.04% 86.34% 81.68% 84.22%
*Film Plastic 69.01% 95.00% 78.66% 70.15% 66.49% 75.86%
*Other plastic not acceptable at curb 54.52% 93.75% 56.99% 73.25% 66.36% 30.78%
*Glass 94.38% 100.00% 99.82% 99.34% 99.43% 98.59%
Aluminum beverage cans 38.92% 77.41% 61.60% 87.00% 70.18% 67.02%
Aluminum foil/pet cans 9.18% 84.91% 45.35% 25.97% 4.49% 33.98%
Steel/tinned cans 78.96% 97.21% 77.78% 86.71% 88.79% 85.89%
Other scrap metal& aluminum 94.07% 96.33% 88.87% 73.09% 81.11% 86.64%
*hazardous materials 44.23% 100.00% 9.37% 52.32% 23.45% 45.87%
*other nonrecyclables 74.44% 96.37% 77.75% 92.54% 76.41% 83.50%
* Materials not generally acceptable in the commingled material. Sources of Error Like polls, waste composition studies are sampling studies, and thus subject to random "sampling" error. Sampling error is reduced in proportion to the square root of the number of samples collected. Based on standard statistical methods, the size of sampling errors can be estimated, and this was done for inbound recycling. Table 1 shows the 90% confidence interval for each material based on the inbound recycling sorting results. However, DEQ was not able to calculate confidence intervals for outbound sampling results due to the algebra involved in producing the estimates and the fact that DEQ did not have direct access to the data to be able to use Monte Carlo methods of estimating confidence intervals. Besides normal sampling error, however, there are other potential sources of error, including the following: 1) Self-sorting of material in recycling piles, where small heavy items like glass tend to drift down to the bottom of a pile and light materials like plastic bottles tend to float to the top, may have lead to samples not representing the full composition of the pile. This may have particularly been an issue for inbound recycling. If the facility operator scooped up a sample from the middle of the pile, that scoop might miss much of the glass which had sunk to the bottom of the pile. Facility operators often grabbed samples from recycling loads but did not receive instructions on how to grab a good, representative sample. Also, as the vehicle is crossing the facility with the samples over to where the sorters are, the glass continues to sift down in the scoop. If only part of the scoop is needed for the sample, the glass might still remain in the

13 13 Composition of Commingled Recyclables Before and After Processing 13
bottom of the scoop and not end up in the sample. This may help explain why glass was found to be substantially lower in the inbound recycling than it was expected to be based on outbound recycling results. 2) Commercial vs. residential recycling. This study was looking at all commingled recycling including both residential and commercial. However, only two of the facilities separately tracked whether incoming materials were residential or commercial. The sampling plan for those two facilities properly weighted the number of samples taken from residential vs. commercial sources. For Metro-area samples at other facilities though, samples were chosen randomly in hopes of getting the right mix. For materials transfer in from a distance, residential and commercial materials are commonly mixed, and so the sample should properly represent the commercial/residential split. 3) Errors in estimating tons of commodities recycled or wastes disposed. The numbers in the body of Table 7 strongly depend on the total tons of each commodity recycled, reported in the bottom row of Table 7 in percentage form. However, processors frequently combine materials sorted from commingled recycling with other materials that were collected separately (not commingled). In that case, they may not have information to properly separate the tons of material derived from commingled as opposed to source-segregated sources. In addition, some waste streams and commodities are produced in different ways in different parts of the plant, but are combined for sale or for disposal. For example, processors have multiple places in their sort line and equipment where wastes are separated for disposal. These streams include screen fines from different screening processes, wastes separated on the floor of the facility, and wastes that are hand-pulled in different areas of the sorting process. Although DEQ needed information on the relative size of all these waste streams, the processors might only have records on the total amount of waste sent to disposal. In these cases, we had to work with the processors to develop the best estimates for the amount and type of waste produced at each part of the process where we grabbed samples for sorting. One instructive exercise for evaluating possible sources of error is to compare the results of the two parts of this study - sorting inbound versus outbound materials. Table 1 shows the composition of materials in the inbound recycling as directly measured. The right-most column of Table 7 also shows an estimate of the composition of the commingled recyclables before sorting. This estimate was constructed by taking the sorting percentages of materials in each outbound commodity, multiplying those by the overall commodity breakdown given in the bottom row of Table 3, and then summing the results for each material. Table 11 (below) compares these two results. If the methodology for both of these studies were perfect, then the results should differ only by regular sampling error. As stated before, DEQ has not calculated confidence intervals for the outbound recycling results, but believes that the relative size of the confidence intervals should be on the same order as the confidence intervals for inbound recycling, or possible a little larger (less precision). Although DEQ cannot apply standard statistical tests in this case, some of the differences in the commingled material composition shown in Table 11 appear large enough to be significant. In particular, there was more glass found in the outbound recycling sorts - something that may be expected if glass were underestimated in the inbound sorts as discussed earlier. However, for all other non-recyclable materials across the board, less of these were found in the outbound versus the inbound sorts. This could indicate that processors underreported the amount of material that they dispose of from commingled sorting, or possibly could indicate that the percentage of "fines" waste (containing broken glass) were overestimated and other waste streams were underestimated. The one difference that is not explained by any of the discussion to date though is why the level of newspaper-compatible paper was higher in commingled material as estimated from outbound recycling as compared to the inbound recycling composition estimates. It is possible that sampling error contributed to a substantial portion of this difference, but otherwise this difference is not well explained. A partial explanation may be that disposal was underreported, artificially raising the percentage of the recyclable materials such as newsprint. For the outbound recycling, there also might be an effect stemming from the fact that the materials have already been sorted. When sorting though inbound recycling, all the material is mixed together and so all material need to be handled and separated by commodity. In contrast, when sorting the outbound ONP, the sorters are looking though the pile of paper and pulling out anything that looks like it is not compatible with newsprint. Under these circumstances, it is probably easier to miss grades of paper that look like newsprint or compatible paper than it is when sorting a whole pile of commingled materials. Flattened cereal boxes may look similar to newspaper or junk mail , and be missed by the sorters. That might also explain why the boxboard grades are lower in the results derived from outbound recycling than they were for inbound recycling.

14 14 Composition of Commingled Recyclables Before and After Processing 14
Table 11. Comparison of commingled composition based on inbound and outbound sampling
Inbound Percent
90% Conf. Int. Inbound
Outbound Percent
Newspaper-compatible paper 46.28% (44.07-48.48%) 52.86% ** Corrugated Cardboard/brown paper 25.33% (23.18-27.49%) 23.13% Paper not recyclable with ONP (bleached) 2.85% (2.37-3.34%) 2.61% Paper not recyclable with ONP (unbleached) 7.48% (7.05-7.91%) 4.90% ** Gable Top Beverage Carton 0.30% (0.26-0.34%) 0.24% Aseptic Drink cartons 0.03% (0.02-0.03%) 0.03% Paper not recyclable curbside 2.00% (1.76-2.25%) 1.12% ** Commingled curbside plastic 4.54% (4.24-4.84%) 4.78% Film plastic 1.05% (0.65-1.45%) 0.75% Rigid non-curb plastic 1.85% (1.55-2.15%) 1.53% All glass 1.01% (0.81-1.21%) 1.57% ** Aluminum beverage cans 0.27% (0.24-0.29%) 0.31% Aluminum foil/foil containers 0.13% (0.11-0.15%) 0.12% Steel/tinned cans 2.41% (2.21-2.61%) 2.65% Other scrap metal & aluminum 1.28% (0.95-1.60%) 1.60% Hazardous materials 0.06% (0.02-0.09%) 0.02% Other nonrecyclables 3.14% (2.63-3.65%) 1.80% **
** Materials with fairly large differences between inbound and outbound estimates.
Discussion and Conclusions In the past decade, most Oregon residential recycling programs have changed to use large roll carts instead of bins to collect recyclables. Past studies have shown that although the amount of good recyclables collected increases when roll carts are used, so does the amount and percentage of contaminants collected. The large capacity of the roll carts seems to invite people to put items in the cart that they hope are recyclable, but that they would not try to fit in a small recycling bin. At the same time, the amount of newspaper and magazines being generated per person in Oregon and nationwide has fallen, as people increasingly move away from print media as their source of news. Commercial recycling has also increasingly become more commingled in recent years. As a result, the facilities in Portland that process commingled recycling are receiving larger amounts of contaminants than they received in the past. For residential recyclables, some 7 to 9 percent of the material received at the processors is material that should not have been put in the cart. For commercial recycling, the contamination levels are about the same or possibly a bit higher. The good news though is that although there is more contamination due to the increase use of roll carts, the average contamination levels in roll carts alone have not increased in the past few years. Studies done by DEQ in 2004-2005 showed contamination rates for roll carts on the order of 8-10 percent. Contamination rates for residential roll carts in the current study are about the same or possibly lower. This may be the result of stronger education efforts as to what belongs in commingled recycling bins when some of the newer roll cart programs came online. The function of the commingled recycling processors is to take this mix of recyclables and contaminants and sort them out to make marketable commodities, and to dispose of or possibly market the contaminants. Work done by Metro in 2002-2005 had indicated that some materials may not be adequately sorted, and that a fair number of plastic bottles, aluminum cans, and cardboard might be ending up being sent to paper mills as part of an ONP (Old Newsprint) load, where most of that material would end up being disposed. By looking at the composition of each of the commodities and disposal streams being produced by the processors, we determined that on the order of 92 to 94 percent of the recyclable material set out for collection is in fact being sorted out and sold to an appropriate market. The capture rate for non-recyclable

15 15 Composition of Commingled Recyclables Before and After Processing 15
materials is not as good, meaning that over all, some 90 to 93 percent of material is properly sorted and ends up being sold as an appropriate commodity or being appropriately disposed as waste. The large commodity papers - ONP and OCC, generally are marketed to appropriate markets, although about 7 percent of the cardboard and brown paper ended up in ONP instead of OCC. It is the less-common materials for which higher percentages of materials were improperly sorted. In particular, there was either very poor sorting or no overall agreement between facilities as to how to market paper beverage cartons. These ended up in significant quantities in all of the main paper categories, even though they are unlikely to pulp and produce usable fiber in some of the paper grades such as ONP. There still is considerable debate as to whether this paper beverage cartons should even be collected at the curb. Aluminum foil also showed very poor sorting, but again this is a material that makes up only a tiny fraction of the commingled stream, and is very hard to sort out by hand or machine when present at such low levels. Although most newsprint did end up being marketed as a grade of ONP, there still are significant problems with contaminants in the ONP being produced by the local processors. Newsprint-compatible paper makes up only 86.71 percent of the ONP produced. Boxboard, generally considered an "outthrow" in ONP, makes up another 7.15 percent. Commingled-acceptable recyclables that are unusable in ONP, including corrugated cardboard, gable-top cartons, and all of the non-paper recyclables made up another 4.37 percent of the ONP. Commingled contaminant materials made up only 1.77 percent of the ONP. This means that most of the material contaminating ONP was material that was properly set out as commingled materials by the household or generator, but just did not get sorted properly at the processor. The contaminants in ONP are both a disposal problem for the paper mills and also result in the mills having to buy extra paper to make up for the non-acceptable material that they buy. In conclusion, Oregon commingled recycling processing facilities are successful in properly sorting out and marketing the large majority of the recyclable materials they receive, with 92-94 percent of the recyclable material ending up at the proper market. For some of the less common but higher value materials such as aluminum and plastic containers, however, the losses in sorting are higher, and some rarer, low value materials such as milk cartons were inconsistently sorted between facilities. Reducing plastic film in the recycling stream was identified by facility operators as one thing that would help improve their quality of sorting and lower their costs. Reducing the contamination of newsprint being sold would also be a large benefit to local paper mills, increasing the yield they get per ton of paper purchased and reducing their disposal costs for disposing of the contaminants and non-paper recyclables that they receive.
1 1 Composition of Commingled Recyclables Before and After Processing A-1
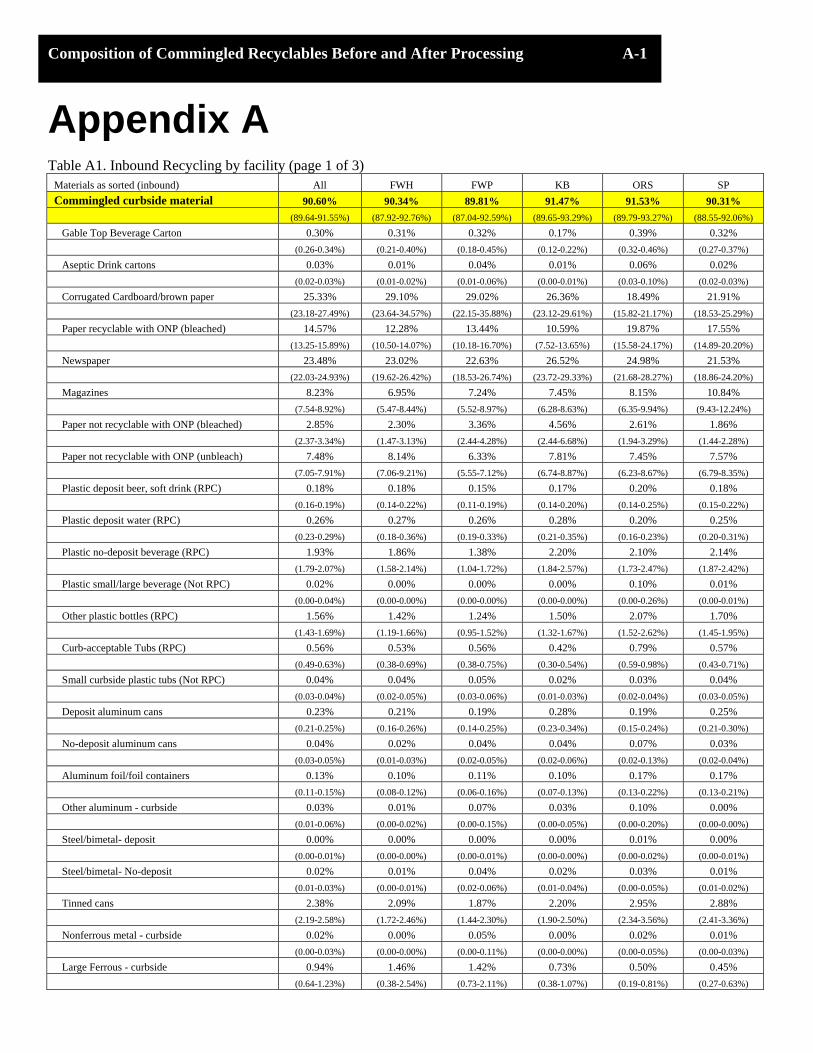
Appendix A Table A1. Inbound Recycling by facility (page 1 of 3)
Materials as sorted (inbound) All FWH FWP KB ORS SP
Commingled curbside material 90.60% 90.34% 89.81% 91.47% 91.53% 90.31%
(89.64-91.55%) (87.92-92.76%) (87.04-92.59%) (89.65-93.29%) (89.79-93.27%) (88.55-92.06%)
Gable Top Beverage Carton 0.30% 0.31% 0.32% 0.17% 0.39% 0.32%
(0.26-0.34%) (0.21-0.40%) (0.18-0.45%) (0.12-0.22%) (0.32-0.46%) (0.27-0.37%)
Aseptic Drink cartons 0.03% 0.01% 0.04% 0.01% 0.06% 0.02%
(0.02-0.03%) (0.01-0.02%) (0.01-0.06%) (0.00-0.01%) (0.03-0.10%) (0.02-0.03%)
Corrugated Cardboard/brown paper 25.33% 29.10% 29.02% 26.36% 18.49% 21.91%
(23.18-27.49%) (23.64-34.57%) (22.15-35.88%) (23.12-29.61%) (15.82-21.17%) (18.53-25.29%)
Paper recyclable with ONP (bleached) 14.57% 12.28% 13.44% 10.59% 19.87% 17.55%
(13.25-15.89%) (10.50-14.07%) (10.18-16.70%) (7.52-13.65%) (15.58-24.17%) (14.89-20.20%)
Newspaper 23.48% 23.02% 22.63% 26.52% 24.98% 21.53%
(22.03-24.93%) (19.62-26.42%) (18.53-26.74%) (23.72-29.33%) (21.68-28.27%) (18.86-24.20%)
Magazines 8.23% 6.95% 7.24% 7.45% 8.15% 10.84%
(7.54-8.92%) (5.47-8.44%) (5.52-8.97%) (6.28-8.63%) (6.35-9.94%) (9.43-12.24%)
Paper not recyclable with ONP (bleached) 2.85% 2.30% 3.36% 4.56% 2.61% 1.86%
(2.37-3.34%) (1.47-3.13%) (2.44-4.28%) (2.44-6.68%) (1.94-3.29%) (1.44-2.28%)
Paper not recyclable with ONP (unbleach) 7.48% 8.14% 6.33% 7.81% 7.45% 7.57%
(7.05-7.91%) (7.06-9.21%) (5.55-7.12%) (6.74-8.87%) (6.23-8.67%) (6.79-8.35%)
Plastic deposit beer, soft drink (RPC) 0.18% 0.18% 0.15% 0.17% 0.20% 0.18%
(0.16-0.19%) (0.14-0.22%) (0.11-0.19%) (0.14-0.20%) (0.14-0.25%) (0.15-0.22%)
Plastic deposit water (RPC) 0.26% 0.27% 0.26% 0.28% 0.20% 0.25%
(0.23-0.29%) (0.18-0.36%) (0.19-0.33%) (0.21-0.35%) (0.16-0.23%) (0.20-0.31%)
Plastic no-deposit beverage (RPC) 1.93% 1.86% 1.38% 2.20% 2.10% 2.14%
(1.79-2.07%) (1.58-2.14%) (1.04-1.72%) (1.84-2.57%) (1.73-2.47%) (1.87-2.42%)
Plastic small/large beverage (Not RPC) 0.02% 0.00% 0.00% 0.00% 0.10% 0.01%
(0.00-0.04%) (0.00-0.00%) (0.00-0.00%) (0.00-0.00%) (0.00-0.26%) (0.00-0.01%)
Other plastic bottles (RPC) 1.56% 1.42% 1.24% 1.50% 2.07% 1.70%
(1.43-1.69%) (1.19-1.66%) (0.95-1.52%) (1.32-1.67%) (1.52-2.62%) (1.45-1.95%)
Curb-acceptable Tubs (RPC) 0.56% 0.53% 0.56% 0.42% 0.79% 0.57%
(0.49-0.63%) (0.38-0.69%) (0.38-0.75%) (0.30-0.54%) (0.59-0.98%) (0.43-0.71%)
Small curbside plastic tubs (Not RPC) 0.04% 0.04% 0.05% 0.02% 0.03% 0.04%
(0.03-0.04%) (0.02-0.05%) (0.03-0.06%) (0.01-0.03%) (0.02-0.04%) (0.03-0.05%)
Deposit aluminum cans 0.23% 0.21% 0.19% 0.28% 0.19% 0.25%
(0.21-0.25%) (0.16-0.26%) (0.14-0.25%) (0.23-0.34%) (0.15-0.24%) (0.21-0.30%)
No-deposit aluminum cans 0.04% 0.02% 0.04% 0.04% 0.07% 0.03%
(0.03-0.05%) (0.01-0.03%) (0.02-0.05%) (0.02-0.06%) (0.02-0.13%) (0.02-0.04%)
Aluminum foil/foil containers 0.13% 0.10% 0.11% 0.10% 0.17% 0.17%
(0.11-0.15%) (0.08-0.12%) (0.06-0.16%) (0.07-0.13%) (0.13-0.22%) (0.13-0.21%)
Other aluminum - curbside 0.03% 0.01% 0.07% 0.03% 0.10% 0.00%
(0.01-0.06%) (0.00-0.02%) (0.00-0.15%) (0.00-0.05%) (0.00-0.20%) (0.00-0.00%)
Steel/bimetal- deposit 0.00% 0.00% 0.00% 0.00% 0.01% 0.00%
(0.00-0.01%) (0.00-0.00%) (0.00-0.01%) (0.00-0.00%) (0.00-0.02%) (0.00-0.01%)
Steel/bimetal- No-deposit 0.02% 0.01% 0.04% 0.02% 0.03% 0.01%
(0.01-0.03%) (0.00-0.01%) (0.02-0.06%) (0.01-0.04%) (0.00-0.05%) (0.01-0.02%)
Tinned cans 2.38% 2.09% 1.87% 2.20% 2.95% 2.88%
(2.19-2.58%) (1.72-2.46%) (1.44-2.30%) (1.90-2.50%) (2.34-3.56%) (2.41-3.36%)
Nonferrous metal - curbside 0.02% 0.00% 0.05% 0.00% 0.02% 0.01%
(0.00-0.03%) (0.00-0.00%) (0.00-0.11%) (0.00-0.00%) (0.00-0.05%) (0.00-0.03%)
Large Ferrous - curbside 0.94% 1.46% 1.42% 0.73% 0.50% 0.45%
(0.64-1.23%) (0.38-2.54%) (0.73-2.11%) (0.38-1.07%) (0.19-0.81%) (0.27-0.63%)

2 2 Composition of Commingled Recyclables Before and After Processing A-2
Materials as sorted (inbound) All FWH FWP KB ORS SP
Non-commingled materials 9.40% 9.65% 10.19% 8.53% 8.47% 9.69%
(8.44-10.36%) (7.24-12.07%) (7.41-12.96%) (6.71-10.35%) (6.73-10.21%) (7.94-11.45%)
Non-commingled curbside 0.96% 0.62% 1.16% 0.45% 1.95% 0.94%
(0.76-1.16%) (0.39-0.85%) (0.52-1.81%) (0.29-0.60%) (1.19-2.71%) (0.59-1.30%)
Deposit glass beverage bottles 0.23% 0.12% 0.19% 0.16% 0.64% 0.18%
(0.15-0.31%) (0.07-0.18%) (0.11-0.26%) (0.08-0.25%) (0.14-1.15%) (0.08-0.28%)
Other glass beverage bottles 0.49% 0.33% 0.76% 0.17% 0.82% 0.46%
(0.34-0.63%) (0.16-0.51%) (0.15-1.36%) (0.08-0.26%) (0.50-1.14%) (0.27-0.64%)
Other glass containers 0.23% 0.16% 0.22% 0.12% 0.49% 0.25%
(0.19-0.28%) (0.09-0.23%) (0.12-0.33%) (0.08-0.16%) (0.34-0.63%) (0.13-0.38%)
Motor oil 0.01% 0.00% 0.00% 0.00% 0.00% 0.05%
(0.00-0.03%) (0.00-0.00%) (0.00-0.00%) (0.00-0.00%) (0.00-0.00%) (0.00-0.12%)
Non-curbside material 8.44% 9.04% 9.02% 8.08% 6.52% 8.75%
(7.48-9.40%) (6.60-11.47%) (6.22-11.83%) (6.24-9.93%) (4.97-8.07%) (7.01-10.49%)
Paper not recyclable curbside 2.00% 1.88% 2.28% 1.65% 2.20% 2.05%
(1.76-2.25%) (1.50-2.25%) (1.39-3.17%) (1.25-2.04%) (1.57-2.83%) (1.63-2.46%)
Polycoats/Marginal recyclable paper 0.08% 0.09% 0.10% 0.05% 0.09% 0.06%
(0.06-0.10%) (0.05-0.13%) (0.06-0.14%) (0.02-0.09%) (0.04-0.15%) (0.03-0.09%)
Hardcover books 0.16% 0.22% 0.08% 0.24% 0.03% 0.19%
(0.08-0.24%) (0.01-0.43%) (0.00-0.16%) (0.00-0.50%) (0.00-0.06%) (0.05-0.33%)
Non-recyclable paper 1.77% 1.57% 2.11% 1.36% 2.08% 1.80%
(1.53-2.00%) (1.26-1.87%) (1.21-3.00%) (1.01-1.70%) (1.49-2.68%) (1.41-2.19%)
Plastic not recyclable curbside 2.90% 2.78% 3.55% 2.09% 2.16% 3.49%
(2.37-3.43%) (1.70-3.87%) (1.79-5.31%) (1.77-2.42%) (1.68-2.64%) (2.20-4.77%)
Plastic tubs not curbside (RPC) 0.47% 0.50% 0.38% 0.40% 0.55% 0.53%
(0.43-0.52%) (0.40-0.60%) (0.28-0.49%) (0.32-0.49%) (0.42-0.68%) (0.43-0.64%)
Other rigid plastic 1.38% 1.73% 1.29% 1.16% 1.31% 1.31%
(1.08-1.67%) (0.64-2.81%) (0.57-2.01%) (0.93-1.40%) (0.90-1.71%) (1.05-1.57%)
Film plastic 1.05% 0.55% 1.88% 0.53% 0.31% 1.64%
(0.65-1.45%) (0.43-0.68%) (0.60-3.15%) (0.38-0.67%) (0.22-0.39%) (0.39-2.90%)
Recyclable polyolefin plastic film 0.60% 0.28% 1.11% 0.19% 0.12% 1.05%
(0.23-0.96%) (0.17-0.38%) (0.12-2.10%) (0.13-0.25%) (0.08-0.16%) (0.00-2.30%)
Nonrecyclable plastic film 0.45% 0.27% 0.77% 0.33% 0.19% 0.60%
(0.32-0.59%) (0.20-0.34%) (0.16-1.38%) (0.21-0.46%) (0.12-0.25%) (0.37-0.82%)
Organics and wood 0.48% 0.33% 0.49% 0.67% 0.35% 0.56%
(0.38-0.58%) (0.20-0.45%) (0.23-0.75%) (0.35-0.98%) (0.13-0.58%) (0.35-0.77%)
Nonrecyclable glass 0.06% 0.05% 0.03% 0.06% 0.04% 0.12%
(0.03-0.10%) (0.02-0.09%) (0.00-0.06%) (0.00-0.14%) (0.00-0.08%) (0.01-0.23%)
Metal not recyclable curbside 0.29% 0.40% 0.13% 0.77% 0.05% 0.10%
(0.14-0.44%) (0.08-0.72%) (0.00-0.26%) (0.05-1.48%) (0.00-0.15%) (0.02-0.17%)
Large aluminum not curbside 0.00% 0.01% 0.00% 0.01% 0.00% 0.00%
(0.00-0.01%) (0.00-0.03%) (0.00-0.00%) (0.00-0.02%) (0.00-0.00%) (0.00-0.00%)
Large non-ferrous - not curbside 0.03% 0.01% 0.09% 0.06% 0.00% 0.00%
(0.00-0.06%) (0.00-0.02%) (0.00-0.22%) (0.00-0.14%) (0.00-0.00%) (0.00-0.00%)
Large Ferrous - not curbside 0.25% 0.38% 0.04% 0.70% 0.05% 0.10%
(0.10-0.40%) (0.06-0.70%) (0.00-0.09%) (0.00-1.41%) (0.00-0.15%) (0.02-0.17%)
Oil filters 0.00% 0.00% 0.00% 0.00% 0.00% 0.00%
(0.00-0.00%) (0.00-0.00%) (0.00-0.00%) (0.00-0.00%) (0.00-0.00%) (0.00-0.00%)
Hazardous material except oil 0.04% 0.01% 0.06% 0.04% 0.06% 0.06%
(0.01-0.07%) (0.00-0.02%) (0.01-0.10%) (0.00-0.07%) (0.00-0.13%) (0.00-0.17%)
Medical waste 0.00% 0.00% 0.01% 0.00% 0.00% 0.00%
(0.00-0.00%) (0.00-0.00%) (0.00-0.03%) (0.00-0.00%) (0.00-0.00%) (0.00-0.00%)
Vehicle batteries 0.02% 0.00% 0.00% 0.00% 0.00% 0.06%
(0.00-0.04%) (0.00-0.00%) (0.00-0.00%) (0.00-0.00%) (0.00-0.00%) (0.00-0.17%)
3 3 Composition of Commingled Recyclables Before and After Processing A-3
Materials as sorted (inbound) All FWH FWP KB ORS SP
Dry-cell batteries 0.00% 0.01% 0.00% 0.00% 0.01% 0.00%
(0.00-0.01%) (0.00-0.01%) (0.00-0.00%) (0.00-0.00%) (0.00-0.03%) (0.00-0.00%)
Latex house paint 0.00% 0.00% 0.02% 0.00% 0.00% 0.00%
(0.00-0.01%) (0.00-0.00%) (0.00-0.06%) (0.00-0.00%) (0.00-0.00%) (0.00-0.00%)
Other hazardous 0.02% 0.00% 0.02% 0.03% 0.04% 0.00%
(0.00-0.03%) (0.00-0.01%) (0.00-0.05%) (0.00-0.07%) (0.00-0.11%) (0.00-0.00%)
Other nonrecyclable 1.43% 2.38% 0.77% 1.77% 0.90% 1.14%
(1.06-1.81%) (1.25-3.51%) (0.45-1.10%) (0.42-3.11%) (0.30-1.51%) (0.84-1.43%)
Bagged garbage 1.22% 1.21% 1.71% 1.05% 0.75% 1.24%
(0.94-1.51%) (0.62-1.80%) (0.89-2.53%) (0.51-1.59%) (0.18-1.33%) (0.63-1.85%)
Bagged recyclables 0.48% 0.42% 0.68% 0.34% 1.06% 0.14%
(0.29-0.66%) (0.20-0.65%) (0.13-1.23%) (0.03-0.65%) (0.15-1.96%) (0.00-0.28%)
Total paper 84.27% 84.00% 84.66% 85.11% 84.21% 83.64%
(83.27-85.27%) (81.28-86.72%) (82.23-87.09%) (83.12-87.11%) (82.01-86.41%) (81.79-85.48%)
Commingled curbside paper 82.27% 82.12% 82.38% 83.47% 82.01% 81.59%
(81.18-83.36%) (79.39-84.85%) (79.51-85.25%) (81.28-85.66%) (79.55-84.47%) (79.49-83.69%)
Newspaper-compatible paper 46.28% 42.26% 43.32% 44.56% 53.00% 49.91%
(44.07-48.48%) (37.17-47.34%) (36.90-49.74%) (40.24-48.87%) (48.33-57.67%) (46.21-53.61%)
Total plastic 7.44% 7.09% 7.20% 6.69% 7.63% 8.39%
(6.86-8.02%) (5.82-8.37%) (5.50-8.89%) (5.87-7.51%) (6.56-8.71%) (7.06-9.71%)
Commingled curbside plastic 4.54% 4.31% 3.64% 4.60% 5.48% 4.90%
(4.24-4.84%) (3.65-4.97%) (2.85-4.44%) (4.01-5.19%) (4.68-6.27%) (4.36-5.44%)
Rigid plastic containers 4.96% 4.78% 3.98% 4.98% 5.89% 5.39%
(4.63-5.29%) (4.04-5.52%) (3.12-4.85%) (4.35-5.61%) (5.03-6.76%) (4.80-5.98%)
Rigid non-curb plastic 1.85% 2.23% 1.67% 1.57% 1.85% 1.84%
(1.55-2.15%) (1.16-3.30%) (0.96-2.39%) (1.29-1.84%) (1.39-2.32%) (1.52-2.17%)
All glass 1.01% 0.67% 1.19% 0.51% 1.99% 1.01%
(0.81-1.21%) (0.44-0.91%) (0.54-1.84%) (0.34-0.68%) (1.23-2.74%) (0.67-1.36%)
All aluminum beverage cans 0.27% 0.23% 0.23% 0.32% 0.27% 0.28%
(0.24-0.29%) (0.18-0.29%) (0.17-0.29%) (0.26-0.39%) (0.18-0.36%) (0.23-0.34%)
Other scrap metal & aluminum 1.28% 1.87% 1.66% 1.52% 0.67% 0.56%
(0.95-1.60%) (0.77-2.98%) (0.92-2.41%) (0.80-2.24%) (0.32-1.02%) (0.37-0.74%)
Steel/tinned cans 2.41% 2.10% 1.92% 2.23% 2.99% 2.90%
(2.21-2.61%) (1.73-2.47%) (1.48-2.35%) (1.93-2.53%) (2.37-3.61%) (2.43-3.37%)
Total metal 4.08% 4.31% 3.92% 4.17% 4.10% 3.91%
(3.70-4.46%) (3.23-5.39%) (2.84-5.00%) (3.41-4.93%) (3.38-4.82%) (3.39-4.43%)
Commingled curbside metal 3.79% 3.91% 3.79% 3.40% 4.05% 3.82%
(3.42-4.16%) (2.82-4.99%) (2.74-4.84%) (2.82-3.99%) (3.36-4.74%) (3.29-4.34%)
Hazardous materials 0.06% 0.01% 0.06% 0.04% 0.06% 0.12%
(0.02-0.09%) (0.00-0.02%) (0.01-0.10%) (0.00-0.07%) (0.00-0.13%) (0.00-0.24%)
Bagged garbage + other nonrecyclables 3.14% 3.91% 2.97% 3.48% 2.01% 2.93%
(2.63-3.65%) (2.44-5.39%) (2.03-3.92%) (2.08-4.89%) (1.15-2.86%) (2.16-3.70%)

4 4 Composition of Commingled Recyclables Before and After Processing A-4
Table A2. Inbound Recyclables by Source (page 1 of 3) Residential Commercial Transfer Unknown Commingled curbside material 91.87% 86.81% 90.21% 92.07% (90.90-92.84%) (81.35-92.26%) (88.88-91.53%) (90.50-93.64%)
Gable Top Beverage Carton 0.42% 0.09% 0.29% 0.28% (0.32-0.51%) (0.03-0.15%) (0.24-0.33%) (0.21-0.35%)
Aseptic Drink cartons 0.04% 0.02% 0.02% 0.04% (0.02-0.05%) (0.00-0.03%) (0.01-0.02%) (0.01-0.06%)
Corrugated Cardboard/brown paper 18.34% 48.51% 23.80% 23.51% (16.78-19.90%) (38.39-58.64%) (21.22-26.38%) (20.44-26.59%)
Paper recyclable with ONP (bleached) 14.76% 10.46% 15.64% 15.04% (12.72-16.80%) (6.53-14.39%) (13.41-17.87%) (11.35-18.73%)
Newspaper 29.12% 12.86% 22.10% 24.49% (26.91-31.33%) (8.20-17.53%) (20.18-24.02%) (21.12-27.85%)
Magazines 9.28% 2.76% 9.23% 8.33% (7.96-10.60%) (1.53-3.99%) (8.24-10.22%) (6.80-9.86%)
Paper not recyclable with ONP (bleached) 3.45% 1.29% 2.61% 3.52% (2.70-4.20%) (0.78-1.80%) (1.70-3.52%) (2.14-4.90%)
Paper not recyclable with ONP (unbleached) 7.69% 5.91% 7.67% 7.90% (6.97-8.41%) (4.40-7.42%) (7.13-8.20%) (6.53-9.27%)
Plastic deposit beer, soft drink (RPC) 0.20% 0.06% 0.20% 0.17% (0.16-0.23%) (0.04-0.08%) (0.18-0.23%) (0.13-0.22%)
Plastic deposit water (RPC) 0.32% 0.10% 0.27% 0.24% (0.25-0.38%) (0.03-0.16%) (0.23-0.31%) (0.18-0.29%)
Plastic no-deposit beverage (RPC) 1.82% 0.84% 2.32% 2.13% (1.57-2.07%) (0.55-1.12%) (2.11-2.52%) (1.78-2.47%)
Plastic small/large beverage (Not RPC) 0.04% 0.00% 0.00% 0.00% (0.00-0.11%) (0.00-0.00%) (0.00-0.01%) (0.00-0.00%)
Other plastic bottles (RPC) 1.59% 0.64% 1.73% 1.84% (1.39-1.78%) (0.38-0.91%) (1.55-1.90%) (1.39-2.28%)
Curb-acceptable Tubs (RPC) 0.67% 0.23% 0.63% 0.48% (0.55-0.79%) (0.06-0.40%) (0.51-0.75%) (0.35-0.61%)
Small curbside plastic tubs (Not RPC) 0.05% 0.02% 0.04% 0.03% (0.04-0.06%) (0.01-0.03%) (0.03-0.05%) (0.02-0.04%)
Deposit aluminum cans 0.25% 0.07% 0.27% 0.23% (0.21-0.29%) (0.04-0.10%) (0.23-0.30%) (0.17-0.29%)
No-deposit aluminum cans 0.06% 0.01% 0.03% 0.05% (0.03-0.08%) (0.00-0.01%) (0.02-0.03%) (0.03-0.07%)
Aluminum foil/foil containers 0.14% 0.04% 0.14% 0.15% (0.10-0.17%) (0.01-0.07%) (0.12-0.17%) (0.11-0.20%)
Other aluminum - curbside 0.06% 0.00% 0.01% 0.07% (0.01-0.12%) (0.00-0.00%) (0.00-0.01%) (0.00-0.14%)
Steel/bimetal- deposit 0.00% 0.00% 0.00% 0.01% (0.00-0.01%) (0.00-0.00%) (0.00-0.01%) (0.00-0.01%)
Steel/bimetal- No-deposit 0.03% 0.02% 0.02% 0.02% (0.01-0.04%) (0.00-0.04%) (0.01-0.03%) (0.00-0.03%)
Tinned cans 2.03% 2.04% 2.70% 2.60% (1.78-2.28%) (1.23-2.86%) (2.37-3.02%) (2.12-3.08%)
Nonferrous metal - curbside 0.03% 0.01% 0.01% 0.00% (0.00-0.08%) (0.00-0.03%) (0.00-0.02%) (0.00-0.00%)
Large Ferrous - curbside 1.50% 0.84% 0.50% 0.96% (0.65-2.34%) (0.04-1.64%) (0.35-0.65%) (0.56-1.36%)

5 5 Composition of Commingled Recyclables Before and After Processing A-5
Residential Commercial Transfer Unknown Non-commingled materials 8.13% 13.19% 9.79% 7.93% (7.16-9.10%) (7.74-18.65%) (8.47-11.12%) (6.36-9.50%)
Non-commingled curbside 1.34% 0.59% 0.73% 1.07% (0.84-1.84%) (0.18-0.99%) (0.51-0.95%) (0.63-1.51%)
Deposit glass beverage bottles 0.35% 0.14% 0.18% 0.20% (0.12-0.57%) (0.04-0.25%) (0.10-0.25%) (0.10-0.31%)
Other glass beverage bottles 0.77% 0.30% 0.33% 0.48% (0.37-1.17%) (0.03-0.57%) (0.22-0.43%) (0.21-0.75%)
Other glass containers 0.23% 0.15% 0.20% 0.39% (0.17-0.29%) (0.04-0.25%) (0.11-0.28%) (0.25-0.53%)
Motor oil 0.00% 0.00% 0.04% 0.00% (0.00-0.00%) (0.00-0.00%) (0.00-0.08%) (0.00-0.00%)
Non-curbside material 6.79% 12.61% 9.06% 6.86% (5.90-7.67%) (7.12-18.10%) (7.75-10.37%) (5.29-8.43%)
Paper not recyclable curbside 1.75% 2.85% 2.02% 1.78% (1.52-1.99%) (1.47-4.23%) (1.70-2.33%) (1.24-2.32%)
Polycoats/Marginal recyclable paper 0.10% 0.02% 0.07% 0.12% (0.06-0.13%) (0.00-0.04%) (0.04-0.09%) (0.06-0.17%)
Hardcover books 0.12% 0.12% 0.20% 0.17% (0.00-0.26%) (0.00-0.29%) (0.10-0.31%) (0.00-0.43%)
Non-recyclable paper 1.54% 2.71% 1.75% 1.49% (1.33-1.75%) (1.34-4.07%) (1.45-2.04%) (1.02-1.97%)
Plastic not recyclable curbside 2.01% 5.05% 3.19% 2.21% (1.74-2.28%) (1.89-8.20%) (2.36-4.02%) (1.75-2.67%)
Plastic tubs not curbside (RPC) 0.54% 0.09% 0.56% 0.46% (0.46-0.61%) (0.05-0.13%) (0.49-0.64%) (0.35-0.57%)
Other rigid plastic 1.08% 2.36% 1.36% 1.19% (0.86-1.30%) (0.19-4.53%) (1.18-1.55%) (0.92-1.46%)
Film plastic 0.40% 2.60% 1.26% 0.56% (0.33-0.46%) (0.70-4.50%) (0.45-2.07%) (0.26-0.86%)
Recyclable polyolefin plastic film 0.17% 1.61% 0.78% 0.18% (0.13-0.20%) (0.12-3.10%) (0.00-1.59%) (0.12-0.23%)
Nonrecyclable plastic film 0.23% 0.99% 0.48% 0.38% (0.18-0.28%) (0.06-1.91%) (0.39-0.57%) (0.08-0.69%)
Organics and wood 0.35% 0.56% 0.52% 0.57% (0.22-0.48%) (0.19-0.93%) (0.36-0.68%) (0.27-0.88%)
Nonrecyclable glass 0.04% 0.04% 0.10% 0.07% (0.01-0.07%) (0.00-0.07%) (0.02-0.17%) (0.00-0.15%)
Metal not recyclable curbside 0.36% 0.23% 0.16% 0.49% (0.04-0.68%) (0.01-0.45%) (0.04-0.29%) (0.00-1.09%)
Large aluminum not curbside 0.00% 0.02% 0.00% 0.01% (0.00-0.00%) (0.00-0.05%) (0.00-0.00%) (0.00-0.02%)
Large non-ferrous - not curbside 0.05% 0.03% 0.02% 0.02% (0.00-0.13%) (0.00-0.07%) (0.00-0.06%) (0.00-0.04%)
Large Ferrous - not curbside 0.30% 0.18% 0.14% 0.46% (0.00-0.62%) (0.00-0.40%) (0.02-0.27%) (0.00-1.06%)
Oil filters 0.00% 0.00% 0.00% 0.00% (0.00-0.00%) (0.00-0.00%) (0.00-0.00%) (0.00-0.00%)
Hazardous material except oil 0.03% 0.06% 0.05% 0.03% (0.00-0.07%) (0.00-0.13%) (0.00-0.12%) (0.00-0.07%)
Medical waste 0.01% 0.00% 0.00% 0.00% (0.00-0.02%) (0.00-0.00%) (0.00-0.00%) (0.00-0.00%)

6 6 Composition of Commingled Recyclables Before and After Processing A-6
Residential Commercial Transfer Unknown Vehicle batteries 0.00% 0.00% 0.04% 0.00% (0.00-0.00%) (0.00-0.00%) (0.00-0.11%) (0.00-0.00%)
Dry-cell batteries 0.00% 0.00% 0.00% 0.01% (0.00-0.01%) (0.00-0.00%) (0.00-0.00%) (0.00-0.03%)
Latex house paint 0.00% 0.03% 0.00% 0.00% (0.00-0.00%) (0.00-0.09%) (0.00-0.00%) (0.00-0.00%)
Other hazardous 0.02% 0.03% 0.01% 0.02% (0.00-0.05%) (0.00-0.06%) (0.00-0.02%) (0.00-0.05%)
Other nonrecyclable 1.10% 1.73% 1.78% 1.05% (0.52-1.69%) (0.23-3.23%) (1.14-2.42%) (0.35-1.75%)
Bagged garbage 1.14% 2.10% 1.24% 0.66% (0.71-1.57%) (0.88-3.32%) (0.80-1.69%) (0.10-1.21%)
Bagged recyclables 0.57% 0.90% 0.15% 0.72% (0.25-0.89%) (0.08-1.73%) (0.04-0.25%) (0.10-1.33%)
Total paper 84.84% 84.75% 83.36% 84.88% (83.39-86.30%) (79.58-89.91%) (82.02-84.71%) (82.78-86.98%)
Commingled curbside paper 83.09% 81.90% 81.35% 83.10% (81.60-84.57%) (76.25-87.54%) (79.83-82.87%) (80.75-85.45%)
Newspaper-compatible paper 53.16% 26.07% 46.97% 47.86% (50.54-55.78%) (17.28-34.87%) (43.93-50.00%) (43.94-51.77%)
Total plastic 6.70% 6.92% 8.38% 7.09% (6.01-7.38%) (3.85-9.99%) (7.50-9.26%) (6.14-8.05%)
Commingled curbside plastic 4.68% 1.88% 5.19% 4.89% (4.18-5.19%) (1.14-2.61%) (4.79-5.59%) (4.16-5.61%)
Rigid plastic containers 5.13% 1.95% 5.72% 5.32% (4.58-5.68%) (1.20-2.70%) (5.28-6.15%) (4.54-6.09%)
Rigid non-curb plastic 1.62% 2.45% 1.93% 1.65% (1.37-1.86%) (0.28-4.61%) (1.70-2.16%) (1.32-1.98%)
All glass 1.38% 0.62% 0.79% 1.14% (0.87-1.88%) (0.21-1.03%) (0.58-1.01%) (0.70-1.58%)
Aluminum beverage cans 0.31% 0.08% 0.29% 0.28% (0.26-0.37%) (0.05-0.11%) (0.26-0.33%) (0.21-0.34%)
Other scrap metal & aluminum 1.95% 1.08% 0.68% 1.52% (1.06-2.84%) (0.21-1.95%) (0.50-0.85%) (0.86-2.17%)
Steel/tinned cans 2.06% 2.06% 2.72% 2.62% (1.81-2.31%) (1.24-2.89%) (2.39-3.04%) (2.14-3.10%)
Total metal 4.46% 3.26% 3.83% 4.57% (3.57-5.35%) (1.90-4.61%) (3.47-4.20%) (3.74-5.39%)
Commingled curbside metal 4.10% 3.03% 3.67% 4.08% (3.22-4.98%) (1.71-4.35%) (3.29-4.04%) (3.36-4.80%)
Hazardous materials 0.03% 0.06% 0.09% 0.03% (0.00-0.07%) (0.00-0.13%) (0.01-0.17%) (0.00-0.07%)
Bagged garbage and other nonrecyclables 2.59% 4.39% 3.54% 2.28% (1.86-3.33%) (1.98-6.80%) (2.77-4.31%) (1.37-3.20%)

7 7 Composition of Commingled Recyclables Before and After Processing A-7
Table A3. Weights and counts for film plastic
Facility Recyclable
Film Weight Recyclable Film Count
Nonrecyc. Film Weight
Nonrecyc. Film Count
Recyclable Film items per pound
Nonrecyc.Film items per
pound
All film items per
pound
KB 0.4 17 0.9 8 42.50 8.89 19.23
FWP 1 12 0.6 9 12.00 15.00 13.13
FWP #22 0.1 5 25.3 15 50.00 0.59 0.79
FWP 0.9 20 0.4 14 22.22 35.00 26.15
FWP 0.8 14 2.3 21 17.50 9.13 11.29
FWP 0.8 9 0 0 11.25 11.25
ORS 0.1 6 0.4 18 60.00 45.00 48.00
ORS 0.1 2 1.5 50 20.00 33.33 32.50
ORS 0.3 7 0.3 10 23.33 33.33 28.33
ORS 0.1 8 0.3 12 80.00 40.00 50.00
ORS 0.015 1 0.16 5 66.67 31.25 34.29
FWP 0 0 1.01 32 31.68 31.68
KB 2.3 29 1.2 16 12.61 13.33 12.86
SP 0.6 9 0.3 4 15.00 13.33 14.44
SP 0.2 7 0.5 15 35.00 30.00 31.43
FWH 1.1 20 0.6 10 18.18 16.67 17.65
FWH 0.4 20 1.1 17 50.00 15.45 24.67
FWP 0.9 23 0.4 9 25.56 22.50 24.62
ORS 0.5 11 0.1 7 22.00 70.00 30.00
FWP 0.3 11 0.2 5 36.67 25.00 32.00
ORS 0 0 0.3 13 43.33 43.33
ORS 0.4 13 0.1 8 32.50 80.00 42.00
FWH 0.7 19 1.3 26 27.14 20.00 22.50
KB 0.2 13 0.2 9 65.00 45.00 55.00
KB 0.5 11 4.7 38 22.00 8.09 9.42
KB 0.9 5 0.7 8 5.56 11.43 8.13
KB 1.1 64 0.2 8 58.18 40.00 55.38
FWH 0.6 21 0.7 23 35.00 32.86 33.85
FWH 4.9 22 0.5 23 4.49 46.00 8.33
FWH 1.4 44 0.5 20 31.43 40.00 33.68
FWH 4.4 27 0.1 10 6.14 100.00 8.22
FWH 2.1 9 0.1 6 4.29 60.00 6.82
SP 0.8 18 1.4 30 22.50 21.43 21.82
SP 0.1 5 0.5 11 50.00 22.00 26.67
SP 0.3 4 0.7 17 13.33 24.29 21.00
SP 0.1 5 0.4 15 50.00 37.50 40.00
SP 7.7 37 2.1 20 4.81 9.52 5.82
FWP 1.5 32 3.1 31 21.33 10.00 13.70
Total 38.615 580 55.17 593 15.02 10.75 12.51 excluding sample #22 38.515 575 29.87 578 14.93 19.35 16.86

8 8 Composition of Commingled Recyclables Before and After Processing A-8
Table A4. Typical outbound recycling plan for one facility for 1 of the 2 sampling periods
Outbound material Number of
samples
Minimum sample weight
ONP (Newspaper & compatible) 8 200
OCC (Cardboard, brown paper) 2 200
Chipboard, Mixed Scrap Paper 1 200
Aseptic drink boxes, gable tops 1 50
PET plastic containers 1 100
Milk jugs, natural HDPE 1 100
Colored HDPE containers 1 100
3-7 or 1-7 residue after other sorts 1 100
Mainly oversized rigid plastics 1 100
Aluminum cans & foil 1 50
Tinned cans 1 100
Other Scrap Metal 1 100
Film Plastic 1 50
Glass (pieces) 1 20
Screen fines disposed 3 15
Hand-pulled garbage 2 200

1 1 Composition of Commingled Recyclables Before and After Processing B-1
Appendix B Commingled Recycling Material Definitions INBOUND RECYCLING CATEGORIES The individual material categories as sorted and weighed in the field are underlined, are preceded by numbers below, and are followed by descriptions. The numbers are not sequential, as they represent material numbers used in the full waste composition study.
PAPER 1. Gable top beverage cartons. Poly-coated bleached paperboard boxes that contain ready-to-drink beverages such
as milk or orange juice. May include plastic pour spouts as part of the carton. Does not include cream or half & half boxes.
2. Aseptic drink boxes. Paper/foil/plastic laminate boxes used to package juice and other ready-to-drink beverages. Does not include aseptic containers used to package non-beverages.
3. Corrugated cardboard and kraft paper (OCC). Unwaxed kraft linerboard and containerboard cartons and shipping boxes with corrugated paper medium. This category includes boxes shrink-wrapped in plastic and unbleached kraft (brown) paper bags. Excludes waxed and plastic-coated cardboard (plastic coating bonded to the cardboard), solid boxboard, and multi-walled bags that are not pure unbleached kraft.
4. Hi-grade and other paper compatible with newspaper. Printing, writing and computer papers, including mainly thermo-chemical pulps. Both virgin pulp substitutes and high-grade de-ink fibers are included. This category is composed of high-grade paper, which includes white ledger, colored ledger, computer printouts, computer tab cards, bond, copy machine, and carbonless paper. Also includes junk mail, glossy and uncoated advertising sheets, envelopes (except brown unbleached kraft envelopes) even with windows or sticky labels, construction paper, file folders, hanging file folders, greeting cards, sticky notes, paperbacks, uncoated groundwood catalogs and advertisements,). Includes paper bound with fasteners including spiral-bound notebooks and plastic reinforced tab dividers. Excludes newspaper and magazines, astro-brights and other unbleachables, and glue-bound publications.
5. Newspaper (ONP). Printed ground-wood newsprint (minimally bleached fiber); commonly referred to as #1 news. This category includes glossy paper typically used in newspaper insert advertisements, if believed to be distributed with newspapers.
6. Magazines. Includes other glossy publications such as some catalogs, but excludes newspaper glossy inserts.
7. Low-grade bleached recyclable paper not compatible with newspaper. Includes egg cartons, fruit separators, phone books and bleached boxboard including cigarette cartons but not individual packs.
8. Low-grade unbleached recyclable paper not acceptable with newspaper. Paper with grey or brown fibers such as cereal boxes, shoeboxes clothing forms, other grey and brown chipboard unbleached kraft envelopes, thermal fax and printing paper and bright-dye (fiesta and neon) papers and envelopes, which although originally bleached, are unbleachable and would contaminate other bleached paper.
9. Polycoated paper. Poly-coated bleached and unbleached paperboard used for ice cream, frozen TV dinners, and many other frozen food boxes. Includes multi-walled bags that are poly-coated or have a plastic layer (watch out for very thin polycoat layers). Includes non-drink box aseptic packaging such as soup cartons. Does not include cups or non-food poly-coated packages,
10. Hard-covered books. Books with hard covers, and excluding paperbacks.
2 2 Composition of Commingled Recyclables Before and After Processing B-2
11. Nonrecyclable paper. Tissue, paper towel, napkins, plates and cups; take out packing (direct contact with sticky foods), molded paper plant pots, gable-top non-beverage cartons such as cream cartons unless they held hazardous materials, mixed paper and materials, photos, old blueprint paper made with the ammonia process, true carbon paper, juice and oil cans, foil containing wrapping paper, wallpaper, foil lined fast food papers, microwave paper food trays used in frozen dinners, individual cigarette packages, paper with large thick plastic windows, paper containers that held hazardous products, thin bound reports with plastic covers, and non-food polycoated boxes. Paper-bound 3-ring binders go here, but the paper contained goes in the appropriate grade. Excludes recyclable paper.
PLASTICS (see Additional Component Information) 12. Deposit beer and soft drink plastic beverage bottles (RPCs). Any beverage container up to 3 liters in size with
an Oregon deposit for beer, soft drink, carbonated water and juice. Does not include out-of-state bottles or soft drink syrup containers.
13. Deposit plastic water bottles (RPCs). Only includes still waters and flavored waters added to the bottle bill as of 2009, up to 3 liters in size. Does not include out-of-state bottles.
14. No-deposit plastic beverage bottles (RPCs). 8 oz to 5 gallons plastic beverage bottle without an Oregon deposit such as milk, juice, alcohol, wine, smoothie, coffee, tea. Includes beer, soft drink, and water bottles that are over 3 liters in size or that are from out-of-state that are not marked with the Oregon refund value. Does not include cream, half & half, syrups, and powdered beverages.
15. No-deposit very small, large beverage bottles. Plastic Bottles less than 8 oz or larger than 5 gallons that hold ready-to-drink beverages. Mainly small liquor bottles.
16. Other plastic bottles (RPCs). All non-beverage bottles 8 oz to 5 gallons used for non-beverage food, medicines, vitamins, hair and bath products, laundry supplies, antifreeze, oil.
17. Plastic tubs, pails acceptable in curbside (RPCs). Tubs, pails (buckets), flowerpots 4"or larger, from 8 oz to 5 gallon in size made from plastic and meeting the definition in Oregon Revised Statute 459A.650 for Rigid Plastic Container. Does not include trays or clamshells.
18. Other plastic tubs, pails, and trays that meet rigid plastic container definition but are not acceptable in curbside (RPCs). Plastic packages of finite shape with a capacity of from 8 oz to 5 gallons. Includes cookie trays, trays with sidewalls that can contain at least 8 oz, clamshells, flower pots <4" that are > 8 oz. Does not include lids, unless the lid is attached or is itself a rigid plastic container. Includes plastic cups used commercially to package food, but not plastic cups sold as a product for home or office use (usually unmarked - included in "rigid plastic products"). Does not include tubs/pails that are acceptable in curbside, or any bottles. Does not include flexible tubes like bathroom caulk, toothpaste.
19. Small plastic tubs acceptable in curbside. Includes the plastic tubs and yogurt containers that are at least 6 oz in size, but less than 8 oz.
20. Other rigid plastic. Includes expanded polystyrene packaging and food trays (holding less than 8 oz), urethane foam packaging, containers larger than 5 gallons, plastic bottle and container lids and lids from glass, metal, or paper containers, dishware and utensils, including expanded polystyrene cups and plates when originally sold for home use (non-packaging), plastic household items, all-plastic furniture, and toys. Also includes thermoset plastic products and "fiberglass" (mainly plastic) boat parts, corrugated roofing, and similar products. Includes polyurethane foam products, such as urethane foam carpet padding, and mixed plastic/materials that are predominantly plastic.
21. "Recyclable" polyethylene film plastic. Includes plastic grocery bags, retail bags, newspaper bags, dry cleaner bags, pallet-wrap, shrink wrap, clear and black polyethylene plastic sheeting, hay sleeves and silage bags, fertilizer/peat/feed bags from nurseries and agricultural operations, furniture and mattress wrap, bubble wrap, woven lumber wrap, roofing material wrap, insulation wrap, commercial bags and liners, commercial parts packaging, and building wrap. Excludes any film that is not polyethylene or other polyolefin, any film that is laminated to other materials (tape/labels are OK), any bag used as a garbage bag (can liners and tied-off garbage bags), bags contaminated with food and other sticky/contaminating materials on the inside, food and household
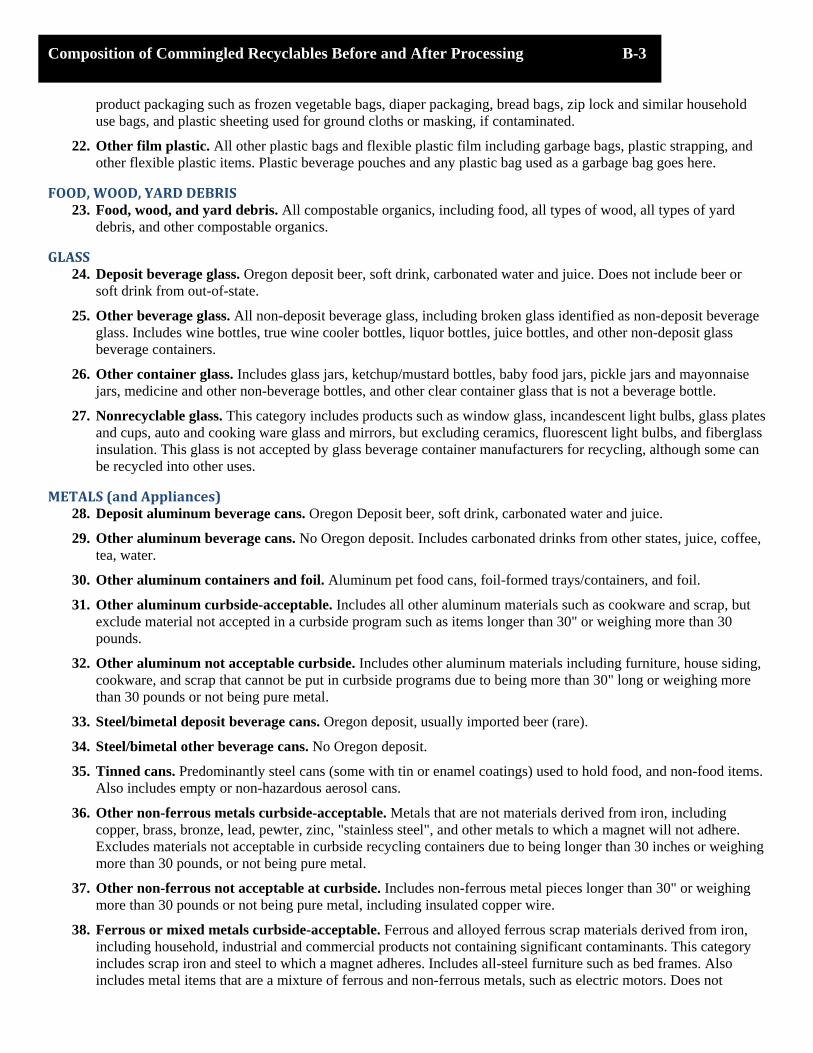
3 3 Composition of Commingled Recyclables Before and After Processing B-3
product packaging such as frozen vegetable bags, diaper packaging, bread bags, zip lock and similar household use bags, and plastic sheeting used for ground cloths or masking, if contaminated.
22. Other film plastic. All other plastic bags and flexible plastic film including garbage bags, plastic strapping, and other flexible plastic items. Plastic beverage pouches and any plastic bag used as a garbage bag goes here.
FOOD, WOOD, YARD DEBRIS 23. Food, wood, and yard debris. All compostable organics, including food, all types of wood, all types of yard
debris, and other compostable organics.
GLASS 24. Deposit beverage glass. Oregon deposit beer, soft drink, carbonated water and juice. Does not include beer or
soft drink from out-of-state.
25. Other beverage glass. All non-deposit beverage glass, including broken glass identified as non-deposit beverage glass. Includes wine bottles, true wine cooler bottles, liquor bottles, juice bottles, and other non-deposit glass beverage containers.
26. Other container glass. Includes glass jars, ketchup/mustard bottles, baby food jars, pickle jars and mayonnaise jars, medicine and other non-beverage bottles, and other clear container glass that is not a beverage bottle.
27. Nonrecyclable glass. This category includes products such as window glass, incandescent light bulbs, glass plates and cups, auto and cooking ware glass and mirrors, but excluding ceramics, fluorescent light bulbs, and fiberglass insulation. This glass is not accepted by glass beverage container manufacturers for recycling, although some can be recycled into other uses.
METALS (and Appliances) 28. Deposit aluminum beverage cans. Oregon Deposit beer, soft drink, carbonated water and juice.
29. Other aluminum beverage cans. No Oregon deposit. Includes carbonated drinks from other states, juice, coffee, tea, water.
30. Other aluminum containers and foil. Aluminum pet food cans, foil-formed trays/containers, and foil.
31. Other aluminum curbside-acceptable. Includes all other aluminum materials such as cookware and scrap, but exclude material not accepted in a curbside program such as items longer than 30" or weighing more than 30 pounds.
32. Other aluminum not acceptable curbside. Includes other aluminum materials including furniture, house siding, cookware, and scrap that cannot be put in curbside programs due to being more than 30" long or weighing more than 30 pounds or not being pure metal.
33. Steel/bimetal deposit beverage cans. Oregon deposit, usually imported beer (rare).
34. Steel/bimetal other beverage cans. No Oregon deposit.
35. Tinned cans. Predominantly steel cans (some with tin or enamel coatings) used to hold food, and non-food items. Also includes empty or non-hazardous aerosol cans.
36. Other non-ferrous metals curbside-acceptable. Metals that are not materials derived from iron, including copper, brass, bronze, lead, pewter, zinc, "stainless steel", and other metals to which a magnet will not adhere. Excludes materials not acceptable in curbside recycling containers due to being longer than 30 inches or weighing more than 30 pounds, or not being pure metal.
37. Other non-ferrous not acceptable at curbside. Includes non-ferrous metal pieces longer than 30" or weighing more than 30 pounds or not being pure metal, including insulated copper wire.
38. Ferrous or mixed metals curbside-acceptable. Ferrous and alloyed ferrous scrap materials derived from iron, including household, industrial and commercial products not containing significant contaminants. This category includes scrap iron and steel to which a magnet adheres. Includes all-steel furniture such as bed frames. Also includes metal items that are a mixture of ferrous and non-ferrous metals, such as electric motors. Does not

4 4 Composition of Commingled Recyclables Before and After Processing B-4
include tinned cans or other metal items listed elsewhere. Excludes metal not acceptable in curbside programs due to being longer than 30", heavier than 30 pounds, or not being pure-enough metal.
39. Other ferrous or mixed metals not acceptable at curbside. Ferrous and alloyed ferrous scrap materials derived from iron, including household, industrial and commercial products not containing significant contaminants. Does not include food cans or other metal items listed elsewhere. Includes only metal not acceptable in curbside programs due to being longer than 30", heavier than 30 pounds, or not being pure metal.
40. Oil filters. Used oil filters.
41. Medical waste. Includes syringes, tubing, gauze, blood-containing, and similar materials, including urine-filled roadside bottles). Bags and containers with medical waste are not sorted further. Thus, other non-medical waste is weighed as medical waste if it is in a bag or container with other apparent medical waste.
42. Lead-acid batteries. Only the large batteries from vehicles, boats. Does not include SSLAs (small sealed lead-acid batteries) sometimes used in camcorders and other electronic equipment.
43. Dry-cell batteries. Includes regular alkaline, NiCad, lithium, and similar batteries, and SSLAs (changed from previous studies). Includes rechargeable flashlights.
44. Latex house paint. All water-based architectural paints and stains. Includes dried paint in cans.
45. Motor oil. Includes drain oil, transmission fluid and similar petroleum hydraulic oils
46. Other hazardous materials. Includes flammable materials, pesticides, toxic materials, corrosive cleaners, and other hazardous chemicals. See further description below.
47. Other nonrecyclables. Includes textiles, diapers, carpet, rubber, roofing, furniture, fluorescent tubes and fixtures, computers and other electronics, rock, dirt, gypsum, insulation, and other materials that are not acceptable in curbside recycling and are not specified elsewhere in this list.
48. Bagged garbage. Bagged materials that are not clearly recyclable. These bags are weighed and disposed without sorting the contents into individual categories. Some of the materials in the bags may have been recyclable if they had been properly separated.
49. Bagged recyclables. Bagged material where the whole bag clearly contains otherwise properly prepared recyclable materials. These bags are weighed first and then the contents are dumped back into the pile to be sorted by material. Thus, the materials in these bags will appear in the individual material categories.
OUTBOUND RECYCLING CATEGORIES
1. Gable top beverage cartons. Poly-coated bleached paperboard boxes that contain ready-to-drink beverages such as milk or orange juice. May include plastic pour spouts as part of the carton. Does not include cream or half & half boxes.
2. Aseptic drink boxes. Paper/foil/plastic laminate boxes used to package juice and other ready-to-drink beverages. Does not include aseptic containers used to package non-beverages.
3. Corrugated cardboard and kraft paper (OCC). Unwaxed kraft linerboard and containerboard cartons and shipping boxes with corrugated paper medium. This category includes boxes shrink-wrapped in plastic and unbleached kraft (brown) paper bags. Excludes waxed and plastic-coated cardboard (plastic coating bonded to the cardboard), solid boxboard, and multi-walled bags that are not pure unbleached kraft.
4. Newspaper & other paper compatible with newspaper. Includes newspaper, magazines, high-grade paper, which includes white ledger, colored ledger, computer printouts, computer tab cards, bond, copy machine, and carbonless paper. Also includes junk mail, glossy and uncoated advertising sheets, envelopes (except brown unbleached kraft envelopes) even with windows or sticky labels, construction paper, file folders, hanging file folders, greeting cards, sticky notes, paperbacks, uncoated groundwood catalogs and advertisements,). Includes paper bound with fasteners including spiral-bound notebooks and plastic reinforced tab dividers. Excludes unbleached paper, astro-brights and other unbleachables.

5 5 Composition of Commingled Recyclables Before and After Processing B-5
5. Low-grade bleached recyclable paper not compatible with newspaper. Includes egg cartons, fruit separators, phone books and bleached boxboard including cigarette cartons but not individual packs.
6. Low-grade unbleached recyclable paper not acceptable with newspaper. Paper with grey or brown fibers such as cereal boxes, shoeboxes clothing forms, other grey and brown chipboard unbleached kraft envelopes, thermal fax and printing paper and bright-dye (fiesta and neon) papers and envelopes, which although originally bleached, are unbleachable and would contaminate other bleached paper.
7. Nonrecyclable paper. Tissue, paper towel, napkins, plates and cups; take out packing (direct contact with sticky foods), polycoated paper used for frozen food boxes, multi-walled bags with poly coating, non-beverage aseptic cartons, molded paper plant pots, gable-top non-beverage cartons such as cream cartons unless they held hazardous materials, mixed paper and materials, photos, old blueprint paper made with the ammonia process, true carbon paper, juice and oil cans, foil containing wrapping paper, wallpaper, foil lined fast food papers, microwave paper food trays used in frozen dinners, individual cigarette packages, paper with large thick plastic windows, paper containers that held hazardous products, thin bound reports with plastic covers, hard-cover books, and all polycoated boxes. Paper-bound 3-ring binders go here, but the paper contained goes in the appropriate grade.
8. Plastic bottles and tubs acceptable curbside. Plastic bottles 6oz and larger, plus tubs, pails (buckets), flowerpots 4"or larger, from 8 oz to 5 gallon in size, made from plastic and meeting the definition in Oregon Revised Statute 459A.650 for Rigid Plastic Container. Also includes similar plastic tubs and yogurt containers that are at least 6 oz in size, but less than 8 oz. Does not include trays or clamshells.
9. Film plastic. Plastic bags, plastic sheeting, plastic strapping, and similar thin, flexible plastic.
10. Other rigid plastic. Includes all other rigid plastic items, including products, lids, trays, clamshells, expanded polystyrene packaging, thermoset plastics, polyurethane foam, and any other rigid plastic item that is not generally acceptable in curbside recycling program.
11. Glass. Includes bottles, jars, window glass, cooking ware, and other types of recyclable and non-recyclable glass. Excludes ceramics, fluorescent light bulbs, and fiberglass insulation.
12. Aluminum beverage cans. Includes all aluminum beverage cans, whether deposit or not.
13. Other aluminum containers and foil. Aluminum pet food cans, foil-formed trays/containers, and foil.
14. Tinned cans. Predominantly steel cans (some with tin or enamel coatings) used to hold beverages, food, and non-food items. Also includes empty or non-hazardous aerosol cans
15. Other scrap metal and aluminum. Includes all other recyclable ferrous scrap metal, other aluminum, and all other nonferrous scrap metal.
16. Hazardous materials. Includes medical waste and also all materials classed as hazardous materials in the solid waste composition study, batteries, paint, motor oil, flammable materials, pesticides, toxic materials, corrosive cleaners, and other hazardous chemicals.
17. Other nonrecyclables. Includes yard debris, food waste, wood, textiles, diapers, carpet, rubber, roofing, furniture, fluorescent tubes and fixtures, computers and other electronics, rock, dirt, gypsum, insulation, and other materials that are not acceptable in curbside recycling and are not specified elsewhere in this list.
Discussion of why materials were classified as "Rigorously-sorted," "Acceptably-sorted," or "Not acceptable" in outbound recycling commodities. Tables 3 and 4 of this report uses shading to indicate which materials fall in each category for each commodity. Generally, a material was considered "not acceptable" if the users generally purchasing a commodity would have no use for that material, and would either have to dispose of it or sort it out and sell it elsewhere. For example, any non-paper material would be unacceptable in a paper commodity, and vice-versa. For specific materials and commodities, here are reasons why each were classified the way they were.

6 6 Composition of Commingled Recyclables Before and After Processing B-6
For the commodity ONP (Old Newsprint) • Cardboard and brown paper was considered unacceptable because it is unwanted, is sometimes screened out by
pulpers, and lowers the brightness of the paper produced • Gable top beverage containers are considered unacceptable because they are generally made of wet-strength paper
and will not pulp in most newsprint pulpers. • Aseptic drink boxes were considered acceptable since some reports indicate they will pulp in a newsprint pulper
and provide usable fiber, although the yield is low. • Chipboard and similar paper ("Paper not ONP-compatible (unbleached)") was considered acceptable since some
of it pulps easier than cardboard and it may not require as strong bleaching as cardboard would, plus it is often made with some recycled newsprint content.
• "Bleached paper not ONP-compatible," which consists of phone books, bleached boxboard, egg cartons, and similar pulpable papers, was considered as "rigorous," in spite of the category name, since the standard practice of the Oregon facilities seems to be to include this in with the ONP, and if they pulp the resultant pulp will generally be very usable in the newsprint produced.
For the commodity OCC (Old Corrugated Containers):
• Newsprint-compatible paper was considered unacceptable since it is often a weaker fiber and because it belongs in the newsprint. However, some of this material might be stronger fibers (such as high-grade paper) and so it possibly could be considered acceptable.
• Gable top and aseptic drink boxes were both considered acceptable, although it is not clear if gable tops will pulp in a regular corrugated mill, and they are probably unwanted by that market. More research needs to be done here.
• "Non-recyclable paper" was ranked as "acceptable" because there may be certain specific grades of this paper that would be acceptable in a corrugated mill and some processors at least appear to be pulling it out and marketing it here. More research may be needed.
For the commodity "Other Paper," all grades were considered rigorous, and even "Non-recyclable Paper" was considered acceptable since some grades that are not accepted in curbside recycling might still be legitimately sold to a willing and knowledgeable buyer. For the commodity "Rigid Plastic," the material "Other plastic not acceptable at the curb" was considered acceptable because many types of rigid plastics are in fact of compatible resin that they can be marketed along with similar plastics that are acceptable at the curb. Examples include large polyethylene items such as damaged storage tubs that could be marketed with other colored HDPE plastic or in mixed plastic bales. For the various garbage commodities (including glass and film plastic), none of the other recyclable materials were considered acceptable in this category. However, some of the recyclable material might legitimately be placed here by the processing facilities if it is contaminates such that it is not otherwise acceptable for its regular market.