Composition and species richness of forest plants along...
15
BS 55 129 Composition and species richness of forest plants along the Albertine Rift, Africa AXEL DALBERG POULSEN, DAVID HAFASHIMANA, GERALD EILU, INNOCENT B. LIENGOLA, CORNEILLE E. N. EWANGO AND TERESE B. HART . POULSEN, A.D., HAFASHIMANA, D., EILU, G., LIENGOLA, I.B., EWANGO, C.E.N. & HART, T.B. 2005. Composition and species richness of forest plants along the Albertine Rift, Africa. Biol. Skr. 55: 129-143. ISSN 0366-3612. ISBN 87-7304-304-4. The Albertine Rift is composed of a system of mountains from Lake Albert to Lake Tanganyika and harbours a high proportion of endemic species. In this area, 16 1-ha plots of 20 m × 500 m were placed in semi-evergreen forests between 770 m to 1520 m; 12 in Uganda and four in Congo. In the Ugandan plots, soil samples were taken for analyses and ground herbs (divided into pteridophytes and angiosperms), trees, climbers and epiphytes were inventoried. From the Congolean plots only data for ground herbs and trees are included. Species richness of ground herbs and trees were correlated with altitude but do not conform to simple models on Pleis- tocene refugia and might also be explained by environmental factors of the present. Species com- position matrices calculated on the bases of presence-absence for each of the five plant groups were highly and significantly correlated and thus any of them can be used as a rough indicator of more general floristic patterns, which provides a tool for rapid assessment of species composition in other Albertine forests in the future. The floristic pattern of most plant groups were correlated with patterns in altitude, pH and cation concentrations (which were intercorrelated). Species composition has two components related to altitude: an Albertine submontane and a Congolean lowland. Axel Dalberg Poulsen, Botanical Museum, University of Copenhagen, Denmark. Present address: Royal Botanic Garden Edinburgh, 20A Inverleith Row, Edinburgh EH3 5LR, Scotland. E--mail: axel@dalberg- poulsen.com David Hafashimana, Ministry of Water, Lands and Environment, P.O.Box 7096, Kampala, Uganda. E-mail: [email protected] or [email protected] Gerald Eilu, Faculty of Forestry and Nature Conservation, Makerere University, P.O. Box 7062, Kampala, Uganda. E-mail: [email protected] Innocent B. Liengola, Wildlife Conservation Society/ Centre de Formation et de recherche en Conservation Forestiere, Ituri Forest, Democratic Republic of Congo. E-mail: [email protected] Corneille E. N. Ewango, Wildlife Conservation Society/ Centre de Formation et de recherche en Conservation Forestiere, Ituri Forest, Democratic Republic of Congo. E-mail: [email protected] Terese B. Hart, International Programs, NYZS/ The Wildlife Conservation Society, 185th St Southern Blvd, Bronx, NY 10460, U.S.A. E-mail: [email protected]
Transcript of Composition and species richness of forest plants along...

BS 55 129
Composition and species richness of forestplants along the Albertine Rift, Africa
AXEL DALBERG POULSEN, DAVID HAFASHIMANA, GERALD EILU, INNOCENT
B. LIENGOLA, CORNEILLE E. N. EWANGO AND TERESE B. HART.
POULSEN, A.D., HAFASHIMANA, D., EILU, G., LIENGOLA, I.B., EWANGO, C.E.N. & HART, T.B. 2005.Composition and species richness of forest plants along the Albertine Rift, Africa. Biol. Skr. 55:129-143. ISSN 0366-3612. ISBN 87-7304-304-4.
The Albertine Rift is composed of a system of mountains from Lake Albert to Lake Tanganyikaand harbours a high proportion of endemic species. In this area, 16 1-ha plots of 20 m × 500 mwere placed in semi-evergreen forests between 770 m to 1520 m; 12 in Uganda and four inCongo. In the Ugandan plots, soil samples were taken for analyses and ground herbs (dividedinto pteridophytes and angiosperms), trees, climbers and epiphytes were inventoried. From theCongolean plots only data for ground herbs and trees are included. Species richness of groundherbs and trees were correlated with altitude but do not conform to simple models on Pleis-tocene refugia and might also be explained by environmental factors of the present. Species com-position matrices calculated on the bases of presence-absence for each of the five plant groupswere highly and significantly correlated and thus any of them can be used as a rough indicator ofmore general floristic patterns, which provides a tool for rapid assessment of species compositionin other Albertine forests in the future. The floristic pattern of most plant groups were correlatedwith patterns in altitude, pH and cation concentrations (which were intercorrelated). Speciescomposition has two components related to altitude: an Albertine submontane and a Congoleanlowland.
Axel Dalberg Poulsen, Botanical Museum, University of Copenhagen, Denmark. Present address: RoyalBotanic Garden Edinburgh, 20A Inverleith Row, Edinburgh EH3 5LR, Scotland. E--mail: [email protected]
David Hafashimana, Ministry of Water, Lands and Environment, P.O.Box 7096, Kampala, Uganda. E-mail: [email protected] or [email protected]
Gerald Eilu, Faculty of Forestry and Nature Conservation, Makerere University, P.O. Box 7062, Kampala,Uganda. E-mail: [email protected]
Innocent B. Liengola, Wildlife Conservation Society/ Centre de Formation et de recherche en ConservationForestiere, Ituri Forest, Democratic Republic of Congo. E-mail: [email protected]
Corneille E. N. Ewango, Wildlife Conservation Society/ Centre de Formation et de recherche en ConservationForestiere, Ituri Forest, Democratic Republic of Congo. E-mail: [email protected]
Terese B. Hart, International Programs, NYZS/ The Wildlife Conservation Society, 185th St Southern Blvd,Bronx, NY 10460, U.S.A. E-mail: [email protected]

Introduction
The Albertine Rift consists of a long belt ofmountains on either side of the Western GreatRift Valley extending from Lake Albert (on theborder between Congo and Uganda) throughparts of Burundi and Rwanda to the southerntip of Lake Tanganyika. The mountain chainsof eastern Congo (including Mts. Bleu andButumbas, the Kivu ridge) form the westernflank of the Great Rift Valley and separate theNile and Zaire basins. The Albertine Rift isnoted as a hotspot in species richness andendemism for birds (Prigogine 1988; Bibby etal. 1992) and other animals; the most known ofthe latter being the mountain gorilla (Gorillagorilla beringei). In a numerical analysis ofspecies distribution of 794 plant species, Lin-der (1998) identified the western rift moun-tains as one of the four most important areas ofhigh plant species richness in the African con-tinent. For the Albertine Rift, about 5,800plant species were compiled from lists and flo-ras (Plumptre et al. 2003) which equals 15% ofthe plant species in mainland Africa. TheAlbertine Rift area has a complex geographyincluding montane and submontane forestsand several phytochoria (plant geographicalregions according to White 1983) meet in thisregion. The Albertine plant species constitute23% of of the species in the Guineo-Congolian,Afromontane and Zambesian phytochoria. Atotal of 567 species endemic to the AlbertineRift have been identified to date (Plumptre etal. 2003), some of which were discovered in thesites inventoried for the present study (Poulsen& Lock 1997; Poulsen & Nordal 1999; Poulsenet al. 1999; Verdcourt 1998). Due to pressurefrom high human population densities in theirproximity, several forests in the Albertine Riftare listed as containing many highly endan-gered species (Plumptre et al. 2003).
In Central Africa, two main centres ofspecies richness and endemism have been
identified. Present day patterns in species dis-tribution have been interpreted to reflect theclimatic history and effect of the most recentice age and in Africa led to proposals of forestrefugia: one in Cameroon and Gabon and asecond near Ruwenzori-Kivu (Kingdon 1971)called the Central Refuge, which is adjacent tothe Albertine Rift. This has been generally sup-ported using present-day distribution patternsof plants (e.g., Robbrecht 1996), primates(Colyn et al. 1991) or birds (Diamond & Hamil-ton 1980). In Uganda, Hamilton (1974) specu-lated that forest has persisted in the very south-west and near the Ruwenzori and expandedfrom there to colonize the forested areas oftoday. However, more recent investigations onpalaeoecological evidence (Jolly et al. 1997)rejects that a forest refuge extended to the east-ern flanks of the Albertine Rift, that is inUganda, but do not rule out the possibility thata major refuge could have existed in E Congo.This would have acted as a source for thereplacement of grassland and scrub in Ugandawith medium altitude forest. However, Jolly etal. (1997) dispute that intact vegetation beltssimply shifted along altitudinal gradients; thepollen data suggests a more complex responsepossibly strongly influenced by local differ-ences in edaphic conditions and distance topotential dispersers, and that species whichpresently occur separated along altitudinal gra-dients could have been mixed in the past.Moore (1998) suggested that forests survivedin patches rather than as a major block.
In this paper we first investigate if floristicpatterns and species richness can be explainedby factors of the present-day environmentalone and we speculate if Pleistocene refugiamay also have played a possible role. We testsome simple hypothesis of species richnessdecreasing with distance from postulatedrefugium but simple and realistic models arenot easily made. The main aim of this paper issubsequently to test if patterns of species com-
130 BS 55
position of different plant groups inventoriedin forest plots at different sites in the AlbertineRift area reveal the same floristic pattern.
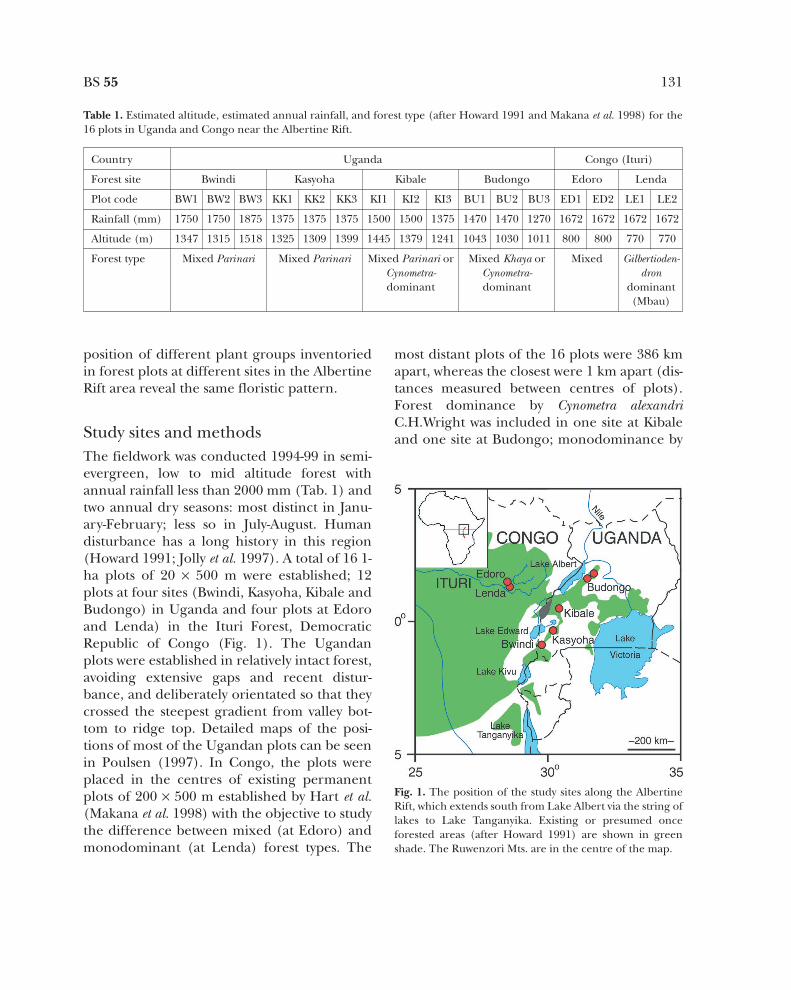
Study sites and methodsThe fieldwork was conducted 1994-99 in semi-evergreen, low to mid altitude forest withannual rainfall less than 2000 mm (Tab. 1) andtwo annual dry seasons: most distinct in Janu-ary-February; less so in July-August. Humandisturbance has a long history in this region(Howard 1991; Jolly et al. 1997). A total of 16 1-ha plots of 20 × 500 m were established; 12plots at four sites (Bwindi, Kasyoha, Kibale andBudongo) in Uganda and four plots at Edoroand Lenda) in the Ituri Forest, DemocraticRepublic of Congo (Fig. 1). The Ugandanplots were established in relatively intact forest,avoiding extensive gaps and recent distur-bance, and deliberately orientated so that theycrossed the steepest gradient from valley bot-tom to ridge top. Detailed maps of the posi-tions of most of the Ugandan plots can be seenin Poulsen (1997). In Congo, the plots wereplaced in the centres of existing permanentplots of 200 × 500 m established by Hart et al.(Makana et al. 1998) with the objective to studythe difference between mixed (at Edoro) andmonodominant (at Lenda) forest types. The
most distant plots of the 16 plots were 386 kmapart, whereas the closest were 1 km apart (dis-tances measured between centres of plots).Forest dominance by Cynometra alexandriC.H.Wright was included in one site at Kibaleand one site at Budongo; monodominance by
BS 55 131
Country Uganda Congo (Ituri)
Forest site Bwindi Kasyoha Kibale Budongo Edoro Lenda
Plot code BW1 BW2 BW3 KK1 KK2 KK3 KI1 KI2 KI3 BU1 BU2 BU3 ED1 ED2 LE1 LE2
Rainfall (mm) 1750 1750 1875 1375 1375 1375 1500 1500 1375 1470 1470 1270 1672 1672 1672 1672
Altitude (m) 1347 1315 1518 1325 1309 1399 1445 1379 1241 1043 1030 1011 800 800 770 770
Forest type Mixed Parinari Mixed Parinari Mixed Parinari or Mixed Khaya or Mixed Gilbertioden-Cynometra- Cynometra- drondominant dominant dominant
(Mbau)
Table 1. Estimated altitude, estimated annual rainfall, and forest type (after Howard 1991 and Makana et al. 1998) for the16 plots in Uganda and Congo near the Albertine Rift.
Fig. 1. The position of the study sites along the AlbertineRift, which extends south from Lake Albert via the string oflakes to Lake Tanganyika. Existing or presumed onceforested areas (after Howard 1991) are shown in greenshade. The Ruwenzori Mts. are in the centre of the map.

Gilbertiodendron dewevrei (De Wild.) J.Leonard –the mbau forest – was pronounced in the twoLenda plots.
Rainfall was estimated comparing the sitelocation to the nearest isohytes in precipitationmaps from the Biomass Divison of the UgandaForest Department, Uganda. A ThommenAltimeter calibrated at the nearest location ofknown altitude was used to read that of theplot. Slope was determined using the SuuntoClinometer. Latitude and longitude wereinferred from maps.
In the Ugandan plots, a soil sample was col-lected in every 10 m sub-unit along each tran-sect and five sequential samples were pooledresulting in ten samples for each transect. Thefive samples were collected from 15 cm deeppits and the sampling was done diagonallystarting at alternate corners of each 20 m × 50m sub plots in order to control for local varia-tions within the transects. Air-dried sampleswere thoroughly mixed and passed through a2-mm sieve and composite samples of 500 gtaken for analyses in the soil science labora-tory, Faculty of Agriculture, Makerere Univer-sity, Kampala based on Okalebo et al. (1993).Soil pH was measured in water (2:2.5 H2O)using a pH meter. Exchangeable Ca, Mg, Naand K were extracted in an excess of 1 Mammonium acetate and concentrations of Naand K determined by a flame photometer, andCa and Mg by atomic absorption spectropho-tometry. Total N was determined by the Kjel-dahl method in which the soil was digested inconcentrated H2SO4 and mixed catalyst. Thedigest was then distilled and titrated againststandard hydrochloric acid (HCl). To deter-mine total P, the soil was digested using a diges-tion mixture (conc. H2SO4, H2O2, LiSO4 andSelinium catalyst). From the digest, total P wasdetermined using a colorimeter. Availablephosphorus (P) was determined according toBray and Kurtz (1945). Soil particle size (physi-cal properties) was determined by the Bouy-
oucos method (1962) using a hydrometer. Per-centage loss on ignition (LOI) was determinedby slowly igniting 10 g of oven dried soil sam-ples in a muffle furnace at 550°C for 3 hours.
All individuals of ground herbs were in all 16transects inventoried only in a 5 m × 500 mband (inside the 20 m × 500 m plots used forthe other plant groups). Ground herbs aredefined as plants with no secondary lignifica-tion and the leaf-bearing shoots rooted atground level (as discussed in Poulsen & Balslev1991; Poulsen 1996a, b). Ground herbs weredivided into terrestrial pteridophytes andangiosperms, which were analysed separately.
In the Ugandan transects, trees, climbersand epiphytes were all inventoried in the com-plete 20 m wide band, but from the database ofthe big plots in Congo we extracted data fortrees in 20 m × 500 m areas that overlappedwith the 5 m × 500 m ground herb inventories.All trees larger than 10 cm diameter at breastheight (DBH), all climbers (woody and herba-ceous) larger than 1 cm diameter measured 1.3m from the base, and all epiphytes on the trees> 10 cm DBH in the plots were enumeratedand vouchered. The canopy was accessed usingrope techniques. Vouchers for the Ugandanplots are deposited at the university herbaria ofMakerere (MHU) and Copenhagen (C)except for the tree vouchers from Congo,which are at the herbaria in Brussels (BR) andMissouri (MO). Tree vouchers from Congoplots were not matches with those fromUganda and the combined list relied on thetwo teams reaching consistent identification.Only about 10 taxa were not identified tospecies level. Most of the ground herb and treespecies are included in Poulsen (1997) andHart et al. (in press). A list of the species ofclimbers is found in Eilu (1999).
Numerical analyses were based on similarityand distance matrices. The Jaccard index (theproportion of shared species of the total num-ber of species found at two sites) was used as a
132 BS 55

measure of floristic similarity between plots.Similarity matrices were computed separatelyfor trees, terrestrial pteridophytes, angiospermground herbs, climbers and epiphytes (the lat-ter two only for the 12 Ugandan plots). Amatrix of log-transformed geographic dis-tances was computed as this better reflects therapid decline of similarity at short distancesbetween plots than a linear relationship (Con-dit et al. 2002). Nutrient concentrations werelog-transformed because a given difference inconcentration is likely to be ecologically moreimportant at low values than at high. All envi-ronmental characteristics were standardisedbefore distance matrices were computed. Foreach of the environmental or soil factors (or acombination of these) Euclidian distance wasused when matrices were computed.
To relate the species richness numbers ofplots to distance from postulated refugia in SWUganda, the distances were rooted in oursouthernmost plot at Bwindi positioned in thepostulated refugia, and the other distances cal-culated from that zero point. Linear correla-tions and regression were made in the statisti-cal package JMP.
Ordinations of transects were done usingPrincipal Coordinate Analyses (PCoA,Legendre & Legendre 1998) on the similaritymatrices converted to distances by D = 1-S(where D is the distance and S the similarityvalue). Correlations between pairs of similaritymatrices were computed using the Mantel test(Mantel 1967). The standardized form of theMantel test was used, which computes the Pear-son correlation coefficient r between the cellvalues of two resemblance matrices. The statis-tical significance of each correlation was deter-mined by a Monte Carlo permutation test toavoid problems related to autocorrelation andnon-normal distributions of the measured vari-ables. In all cases, 999 permutations were used,which allows testing of the statistical signifi-cance at the p<0.001 level for each individual
correlation. Where both can be calculated onthe same data, the Mantel test gives lower val-ues of r than the corresponding linear Pear-son’s correlations in univariate cases, but thetwo methods generally agree on whether thecorrelation is statistically significant (Legendre2000). Partial Mantel tests were performedwith a third matrix of log-transformed geo-graphical distances to assess the effect of spa-tial distribution of the plots (Smouse et al.1986). Matrix calculation, PCoA and Manteltests were conducted using the R-package(http://www.fas.umontreal.ca/BIOL/Legen-dre/indexEnglish.html).
ResultsAll 16 plotsThe inventories of all 16 of the 0.25-ha plotsincluded 204 species of ground herbs (35-74per plot) with 110,851 individuals (5,178-9,696per plot). Of these, the terrestrial pterido-phytes comprised 63 (31%) species (6-27 perplot) and 40,363 individuals (233-7180 perplot) and the angiosperm ground herbs 141(69%) species (22-60 per plot) and 70,488 indi-viduals (868-7974 per plot). The 16 1-ha tran-sect plots contained 326 species of trees in total(ranging 29-81 per plot) and 7372 individuals(328-557). The highest numbers of trees werefound in the mixed forest plots at Edoro.
In the 16 plots, species richness of trees andground herbs were negatively correlated withaltitude (r = -0.58, P < 0.05); r = -0.81, P < 0.001)whereas the species richness of terrestrial pteri-dophytes were positively correlated with alti-tude (r = 0.71, P <0.01).
The ordination of all 16 plots produced bythe PCoA analysis, based on matrices involvingJaccard similarities between plots, showed thata similar pattern appeared whether using ter-restrial pteridohytes, angiosperm groundherbs or trees (Fig. 2). The ordinations all hadthe typical arch-shape with the Congo plots in
BS 55 133

the left ‘leg’ of the arch, followed in sequencefrom north to south by the plots of, Budongo,Kibale, Kasyoha, and Bwindi, the latter twoforming the right ‘leg’. Even if the Congo plotsappear in the diagram to have equal distanceto the Bwindi-Kasyoha and the Budongo plots,the average percentage of shared species wastwice as high (12.5%) with the latter, and thus,Budongo is floristically more similar to Ituriforest. The first axis of tree ordination was cor-related with altitude (r = 0.96, P < 0.001) butnot with rainfall.
The Mantel test produced high correlationbetween the floristic similarity matrices of thethree plant groups (r = 0.84-0.90, P < 0.001). Ifa partial Mantel test is conducted controllingfor the effect of geographical distancesbetween the plots, the r-values decrease (0.50-0.70, P < 0.001).
The 12 Ugandan PlotsSoils in the Ugandan plots ranged in pHbetween 3.58 and 6.19 (Tab. 2), the southernsamples being the most acidic. LOI ranged
from 4.15 to 11.78%, phosphorous contentsfrom 0.09 to 0.16%, and available P from 4-30mg/kg. The concentration of exchangeablebases (sum of Ca, K, Mg, Na) varied from 1.44meq/100g to 26.13 meq/100g, and was mainlydetermined by calcium, which accounted for44 to 72% (mean 59%) of the total base con-tent. The sand fraction dominated across tex-ture classes, ranging from 40 to 60% of soilweight in all transects, and averaged about50% (Tab. 2). Many soil properties were inter-correlated: Pearson correlation coefficientsamong soil properties showed that pH wasstrongly positively correlated with the concen-tration of cations (r = 0.91) and negatively cor-related with altitude (-0.61), LOI (-0.60), N (-0.47), rainfall (-0.35), and silt (-0.34).
The Ugandan plots combined contained 162ground herb species (89,662 individuals) ofwhich 31% were species of terrestrial pterido-phytes (43% of the individuals). There were211 species of trees (ranging 29-66 per plot)and 5747 individuals (344-557), 181 species ofclimbers (35-62 per plot) and 5484 individuals
134 BS 55
Bwindi Kasyoha Kibale BudongoBW1 BW2 BW3 KK1 KK2 KK3 KI1 KI2 KI3 BU1 BU2 BU3
pH 3.80 4.63 3.67 3.58 3.60 3.79 5.70 5.83 6.19 5.87 6.06 6.11
LOI 7.48 4.88 9.55 10.16 11.78 10.90 5.40 7.18 10.14 4.15 6.61 5.89
N (%) 0.33 0.26 0.39 0.46 0.44 0.49 0.31 0.36 0.48 0.16 0.32 0.27
P (%) 0.10 0.09 0.12 0.09 0.10 0.11 0.16 0.11 0.14 0.09 0.09 0.10
avail. P (mg/kg) 6.49 5.09 21.13 18.13 15.47 9.24 13.55 4.05 30.01 11.90 6.82 8.05
Ca (me/100g) 0.65 2.09 0.73 0.64 0.87 1.37 8.26 11.65 18.69 6.98 10.27 10.48
K (me/100g) 0.24 0.27 0.25 0.37 0.33 0.31 0.39 0.58 0.52 0.37 0.44 0.30
Mg (me/100g) 0.39 1.08 0.38 0.28 0.52 0.64 3.74 4.59 6.66 3.07 4.06 4.33
Na (me/100g) 0.15 0.15 0.12 0.17 0.15 0.18 0.15 0.17 0.26 0.21 0.21 0.20
clay (%) 18.20 32.10 18.10 16.80 18.20 24.50 28.00 25.10 19.10 24.40 28.40 21.60
silt (%) 24.80 25.50 27.80 28.70 27.20 30.70 31.30 26.50 20.80 26.70 22.00 28.80
sand (%) 57.00 43.40 54.50 54.50 54.60 44.80 40.50 49.60 59.60 48.90 50.00 49.60
Table 2. Averages of pH, Loss-on-Ignition, nitrogen, phosphorous, available phosphorous, cation concentrations, and tex-ture measured in soils from twelve plots in Uganda (averages of 10 samples per plot).

(155-896 per plot), and 254 species of epi-phytes (46-101) and 189,027 individuals (503-88,931 per plot). These results do not exclude
the possibility of a species appearing in morethan one life form category (especiallybetween ground herbs and epiphytes) and
BS 55 135
Fig. 2. Ordination diagrams (principal coordinates analysis) of 16 transects in forests in the Albertine Rift area, Africa. TheUganda sites included Bwindi (plot BW1-3), Kasyoha (plot KK1-3), Kibale (plot KI1-3), and Budongo (plot BU1-3). Thesites in Ituri forest, Congo included Edoro (ED1-2) and Lenda (LE1-2). Similarity matrices are based on species composi-tion of terrestrial pteridophytes, angiosperm ground herbs or trees. Similarities were calculated with the Jaccard index(species presence-absence data).

136 BS 55
Climbers Terrestrial Angiosperm ground Epiphytespteridophytes herbs
Trees 0.86 *** 0.87 *** 0.69 *** 0.83 ***Climbers 0.78 *** 0.75 *** 0.83 ***
Terrestrial pteridophytes 0.82 *** 0.86 ***Angiosperm ground herbs 0.70 ***
PARTIAL LOG GEODISTTrees 0.62 *** 0.65 *** 0.38 *** 0.57 ***
Climbers 0.42 *** 0.49 *** 0.56 ***Terrestrial pteridophytes 0.65 *** 0.63 ***
Angiosperm ground herbs 0.38 ***
Table 3. Correlations obtained from Mantel Tests between similarity matrices calculated separately for five different plantgroups in the 12 Ugandan plots. Significance levels are based on 999 permutations (*** P <0.001, ** P <0.01). The corre-lations between floristic similarity and environmental factors were repeated in a partial Mantel Test using the log-trans-formed geographical distance matrix to control the effect of the spatial distribution of the plots.
Fig. 3. Ordination diagrams (principal coordinates analysis) of 12 transects in Ugandan forests including Bwindi (plotBW1-3), Kasyoha (plot KK1-3), Kibale (plot KI1-3), and Budongo (plot BU1-3). Similarity matrices based on species com-position of five plant groups: terrestrial pteridophytes, angiosperm ground herbs, trees, climbers, and epiphytes. Similari-ties were calculated with the Jaccard index (species presence-absence data).
adding these numbers would be a slight overes-timate of the combined species richness.
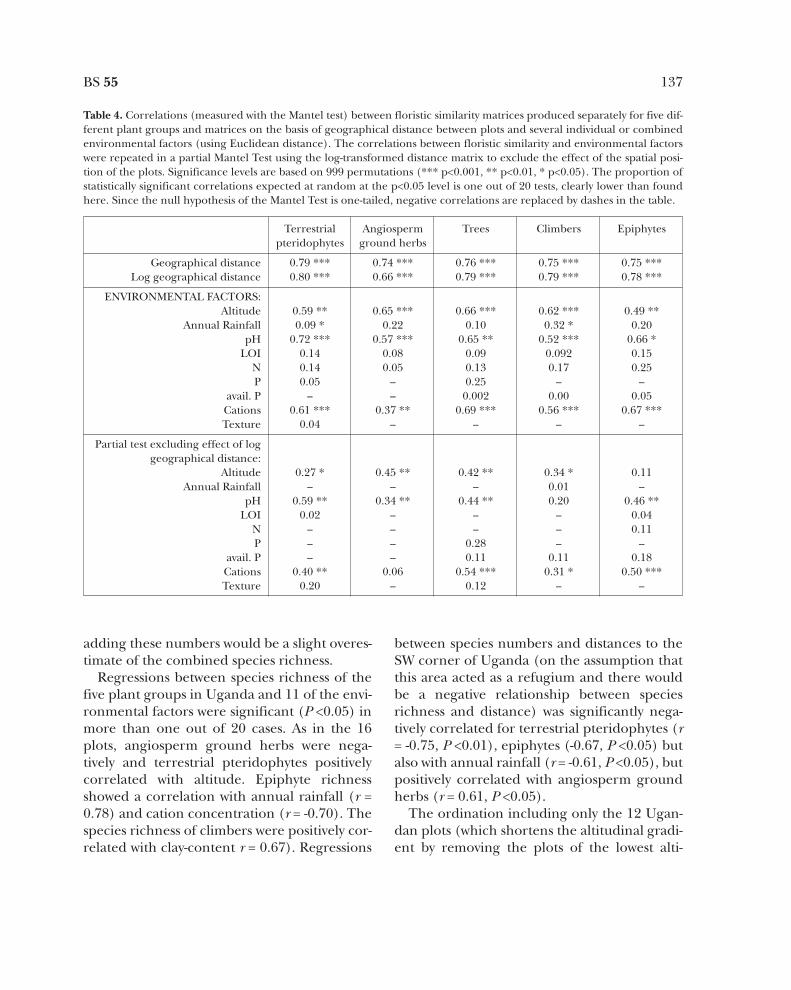
Regressions between species richness of thefive plant groups in Uganda and 11 of the envi-ronmental factors were significant (P <0.05) inmore than one out of 20 cases. As in the 16plots, angiosperm ground herbs were nega-tively and terrestrial pteridophytes positivelycorrelated with altitude. Epiphyte richnessshowed a correlation with annual rainfall (r =0.78) and cation concentration (r = -0.70). Thespecies richness of climbers were positively cor-related with clay-content r = 0.67). Regressions
between species numbers and distances to theSW corner of Uganda (on the assumption thatthis area acted as a refugium and there wouldbe a negative relationship between speciesrichness and distance) was significantly nega-tively correlated for terrestrial pteridophytes (r= -0.75, P <0.01), epiphytes (-0.67, P <0.05) butalso with annual rainfall (r = -0.61, P <0.05), butpositively correlated with angiosperm groundherbs (r = 0.61, P <0.05).
The ordination including only the 12 Ugan-dan plots (which shortens the altitudinal gradi-ent by removing the plots of the lowest alti-
BS 55 137
Terrestrial Angiosperm Trees Climbers Epiphytespteridophytes ground herbs
Geographical distance 0.79 *** 0.74 *** 0.76 *** 0.75 *** 0.75 ***Log geographical distance 0.80 *** 0.66 *** 0.79 *** 0.79 *** 0.78 ***
ENVIRONMENTAL FACTORS:Altitude 0.59 ** 0.65 *** 0.66 *** 0.62 *** 0.49 **
Annual Rainfall 0.09 * 0.22 0.10 0.32 * 0.20pH 0.72 *** 0.57 *** 0.65 ** 0.52 *** 0.66 *
LOI 0.14 0.08 0.09 0.092 0.15N 0.14 0.05 0.13 0.17 0.25P 0.05 -- 0.25 -- --
avail. P -- -- 0.002 0.00 0.05Cations 0.61 *** 0.37 ** 0.69 *** 0.56 *** 0.67 ***Texture 0.04 -- -- -- --
Partial test excluding effect of log geographical distance:
Altitude 0.27 * 0.45 ** 0.42 ** 0.34 * 0.11Annual Rainfall -- -- -- 0.01 --
pH 0.59 ** 0.34 ** 0.44 ** 0.20 0.46 **LOI 0.02 -- -- -- 0.04
N -- -- -- -- 0.11P -- -- 0.28 -- --
avail. P -- -- 0.11 0.11 0.18Cations 0.40 ** 0.06 0.54 *** 0.31 * 0.50 ***Texture 0.20 -- 0.12 -- --
Table 4. Correlations (measured with the Mantel test) between floristic similarity matrices produced separately for five dif-ferent plant groups and matrices on the basis of geographical distance between plots and several individual or combinedenvironmental factors (using Euclidean distance). The correlations between floristic similarity and environmental factorswere repeated in a partial Mantel Test using the log-transformed distance matrix to exclude the effect of the spatial posi-tion of the plots. Significance levels are based on 999 permutations (*** p<0.001, ** p<0.01, * p<0.05). The proportion ofstatistically significant correlations expected at random at the p<0.05 level is one out of 20 tests, clearly lower than foundhere. Since the null hypothesis of the Mantel Test is one-tailed, negative correlations are replaced by dashes in the table.

tude) but include five different life formgroups (Fig. 3) gave a similar pattern to thatincluding all 16; the plots from Bwindi andKasyoha in the south tended to mix, while thetransects from Kibale and Budongo formedtwo separate clusters. The Budongo plotsshared consistently more species with the geo-graphically closer Kibale plots than with theplots further to the south. The first axis of treeordination was again correlated with altitude (r= 0.84, P < 0.001) and not surprisingly also withpH (r = -0.81, P < 0.01) and cation concentra-tion (r = -0.63, P < 0.05).
The Mantel tests of pair-wise correlationsbetween the five plant groups were strong andsignificant (Tab. 3) even when controlling forthe effect of geographical distance. The high-est correlations were between trees and terres-trial pteridophytes (0.65, P < 0.001) and thelowest between ground herbs and trees or epi-phytes (0.38, P < 0.01). The species composi-tion matrices of all plant groups were all highlycorrelated with the matrix of geographical dis-tances between the plots (Tab. 4) as well as tosome of the environmental factors, especiallyaltitude, pH, and cation concentration. Thepartial Mantel test conducted to exclude thegeographical effect reduced the correlationsand their probabilities but all three factors stillremained correlated and significant at least forfour of the total five plant groups.
DiscussionSpecies richnessOur species richness results compared to otherinventories underline the known fact thatAfrica’s forest ecosystems are relatively poor inplant species compared to other continents(Richards 1973; e.g., for pteridophytes see Kor-nas 1993); the pooled number of tree speciesin all 16 1-ha transects up to 400 km apart(326) is only slightly higher than what was
found in a square plot of one hectare in low-land Ecuador (Valencia et al. 1994) but therichness maximum in our plots of 81 species inCongo is comparable to previous results inAfrica (Whitmore 1975). Species richness ofclimbers in 20 m × 50 m was about twice ashigh in some lowland African and Neotropicalforests (Gentry 1991) and more liana specieswere found in one hectare on Barro ColoradoIsland, Panama, Putz (1984) than in our study(65 vs. our average of 51 including allclimbers). Species numbers of terrestrial pteri-dophytes in an Amazonian lowland rainforestusing exactly the same methodology(Tuomisto et al. 2002) were about twice as high(mean = 35, 12-46) as the present study (mean= 16, 6-26) even when the density was abouthalf in the Neotropical study (mean = 1251,360-2521 vs. mean = 2533, 233-7180).
As our study sites are situated in climaticconditions at the margin of what is necessaryfor the persistence of rain forests, it is not sur-prising that our species richness results are rel-atively low, but within the sites species richnesswas generally not correlated with the annualrainfall, the only exception being epiphytes.This may be due to the possibility that theavailable information on rainfall and seasonalvariation were inaccurate, or that a longerrainfall gradient than in the present dataset isnecessary to revel such relationships. Lwangaet al. (1998), including three of our sites intheir analyses of 12, found that species rich-ness of terrestrial pteridophytes in Uganda wascorrelated with rainfall. They also includedsites in drier areas of Uganda and thus sam-pled a longer rainfall gradient and placedemphasis on the mean number of rainy daysin the wettest part of the forest, which theypropose is a more sensitive indicator of aver-age soil moisture content than total rainfall(that we used). Lwanga et al. (1998) alsofound a positive correlation with soil C/N
138 BS 55
ratios; our results do not support that speciesrichness of pteridophytes were correlated withany soil variable.
Species richness and the possible existence ofPleistocene refugiaLwanga et al. (1998) found a weak tendency forrelative species richness of ferns to decline withincreasing distance from nearest (by Hamilton1974) postulated Pleistocene refugium, morespecifically, the south-western corner ofUganda (which includes the Bwindi N.P.). Thismodel is an oversimplification, as Hamilton(1974, illustrated with a map in 1982) alsospeculated that trees migrated E-W from Sem-liki (Fig. 1, centre, just N of Ruwenzori Mts.)and continuous forest may have persisted alsoat the base of Ruwenzori. In any case, ourregression between the plot distances based onthe assumption of the simplified model hadrather contrasting relationships in which ter-restrial pteridophytes and epiphytes conformby having a negative correlation; angiospermground herbs showed the complete oppositepattern. It is in the first place perhaps notappropriate to use terrestrial pteridophytes asindicators of forest refugia since their sporesare very well dispersed (Smith 1972; Conant1978). The negative correlations by richness ofepiphytes or terrestrial pteridophytes with dis-tance from postulated refugium could equallywell be explained by rainfall. On the otherhand, it is not surprising if present-day rainfalldistribution would be correlated to those ofproposed forest refugia since present-daytopograhic patterns, which are to a largeextent determining rainfall patterns, probablyalso contributed to those of the past (Hamilton1992). The decreasing fern richness in plotsfurther north it is also associated with decreas-ing elevation, which also conforms with thegeneral pattern that pteridophyte species rich-ness in lower in the lowlands than at higheraltitude (Moran 1995).
Based on more recent evidence (Jolly et al.1997) it is highly unlikely that the Bwindi areaacted as the source of species to colonize thelower altitudes in Uganda (including Budon-go) but species could have dispersed from thewestern flank of the Albertine Rift to Bwindiand then followed the proposed route. Thespecies richness decline of angiosperm groundherbs and trees from the Congo to the Budon-go plots clearly suggest there may have been adispersal that way as thought by Hamilton(1974, 1982), and floristic similarities clearlyshow that the plots from Budongo share morespecies with the Congo plots than any plots inUganda. Budongo is essentially just an outlier atthe rim of the Guineo-Congolean rain forest(White 1983). If one must speculate on refugia,it is thus probable that there were both a high-land and a lowland source involved and that theprocess was more complex than a simple inva-sion. In the mapping of bird distributions in thearea, Bibby et al. (1992) recognizes the EastCongo Lowland and the Albertine Rift Mts astwo distinct centres of bird endemism. Thus, ifany forest recolonization took place in Ugandait is more likely it had two sources – even if plantdistribution along altitudinal gradients 10 000years ago may have been rather different ormuch more compressed than at present (Jolly etal. 1997). We do not interpret our data to sup-port the existence of two distinct refugia butrather that there are floristic differences thatdepend at least on altitude. Poulsen and Lock(1999) have already discussed this, based on thedistribution of just 16 species of gingers in 13 ofour present plots, and the much larger datasetincluded in the present paper corroboratesthis. This conclusion conforms with the earlythoughts of Hamilton (1974).
Floristic compositionPrevious studies in the species rich rain forestsof Peruvian Amazon by Tuomisto et al. (1995,2003), Ruokolainen et al. (1997), Ruokolainen
BS 55 139

and Tuomisto (1998) demonstrated that differ-ent plant groups inventoried in a series of plotscan produce similar floristic patterns. This wasshown by running pair-wise Mantel testsbetween the species composition of pterido-hytes, members of the family Melastomataceaeand trees in plots at the same regional scale asthe present study.
The positive and significant correlationsbetween the species composition of the five dif-ferent plant groups indicate that it is possibleto get insight to the general pattern in thefloristic variation based on a subset of species.In this case, it would be easier to study plantsthat do not involve tedious or potentially dan-gerous climbing, like terrestrial pteridophytes(as suggested by Ruokolainen et al. 1997). Asmentioned above, one attempt has alreadybeen made to study forests in Uganda based onrapid assessment of ferns (Lwanga 1998)though no correlations with other plantgroups were made.
Further subdivison of the angiospermground herbs may be a promising next step inorder to identify if one particularly easily iden-tifiable family may serve as a potential indica-tor of the overall pattern. This becomes evenmore crucial for gaining an understanding ofthe complex biogeography in the endemic-richAlbertine Rift forests, which are under increas-ing pressure from humans.
Our species composition data are clearlyhighly correlated with geographical distancemainly because the plots follow a S-N gradientthat is also closely related with altitude. Hamil-ton (1974) noted that there is a clear relation-ship between altitude and distribution of thedominant tree species in Uganda, so that Pari-nari forest is above 1400 m (which we have as adominant component of our plots at Bwindiand Kasyoha) and Cynometra-Celtis (700-1200m). Cynometra alexandri was especially abun-dant in one plot in Kibale, one in Budongo,and the Edoro plots (Tab.1). Our data cer-
tainly conform to the tree dominance observa-tions by Hamilton (1974) even though, in ourordination diagrams, plots dominated byCynometra alexandri still tended to stay in theirsite group rather than clustering with otherplots with dominance by the same tree species.
Floristic composition and environmentalfactorsWhen the effect of geographical differencebetween plots is excluded, some environmen-tal characteristics remain positively and signifi-cantly correlated which implies that a largepart of the variation in our data can still beexplained by factors of the present-day envi-ronment. Hamilton (1974) observed also thatspecies typical of the Parinari Zone occurredonly at lower altitude in the highest rainfallarea, but even if there is a tendency for ourrainfall estimates to correlate with altitude,they were not significant. Possibly our rainfallestimates are not sufficiently accurate. It isworth bearing in mind that the rainfall patternin Uganda is very patchy and the length of thedry period has a major effect on the vegetation(Hamilton 1984).
The Neotropical studies (Tuomisto et al.1995, 2003; Ruokolainen et al. 1997; Ruoko-lainen & Tuomisto 1998) also demonstratedthat floristic patterns reflected edaphic condi-tions. Vormisto et al. (2000), at the local scaleof one transect of 20 m × 500 m, showed thatthe floristic composition of four plant groupswere correlated with each other and withedaphic characteristics. Thus, result of the pre-sent African study does not come as a surprise,and that the matrix of cation concentrations issignificantly correlated with most of the speciescomposition matrices, is in accordance withthe Neotropical studies, where, similar to ourresult, pH was also found to be important inone case (Ruokolainen et al. 1997). For the pio-neer study by Hall & Swaine (1976) on trees inGhana, the concentration of cations (which
140 BS 55
was correlated with rainfall and pH) was alsomentioned to correlate best with the first axisof their ordination. In contrast with theNeotropical studies, we did not find evidencesupporting that texture is an important factor.The correlation values of our Mantel tests arecomparable to those found in the Neotropicalstudies but somewhat lower than found at thesame regional scale most likely due to themosaic structure of the Amazonian environ-ment, as opposed to our plots which followed astrong gradient.
ConclusionAny of the five studied plant groups of groundherbs (divided into pteridophyte andangiosperms), trees, climbers or epiphytes canbe used as a rough indicator of more generalfloristic patterns. This is demonstrated here forthe first time on data from the Old WorldTropics and for the first time when includingangiosperm ground herbs, climbers and epi-phytes. The floristic patterns were correlatedwith altitude, pH and cation concentrationsand these results suggest that deterministicprocesses of the present-day environment to alarge extend can explain the distribution ofspecies in forests of the Albertine Rift even ifhistorical factors cannot be ruled out. Thepractical implication of our results is that itmay be possible to gain understanding of theoverall pattern in the floristic variation basedon a small sub-sample including convenientlyonly those plants, which are easy to study.Species richness patterns for some plantgroups correlated with altitude and speciescomposition has two components which arerelated to altitude: an Albertine submontaneand a Congolean lowland and there is a grad-ual transition in species composition along thegradient covered.
Acknowledgements
The help from and collaboration with theDepartment of Botany, Makerere University,and the Makerere University Institute of Envi-ronment and Natural Resources, the UgandaForest Department, the Uganda NationalCouncil for Science and Technology, theUganda National Parks, the Institute for Tropi-cal Forest Conservation, Institut Congolaispour la Conservation de la Nature (ICCN),Centre de Formation et de Recherche en Con-servation Forestière (CEFRECOF) in Congo,as well as J.-R. Makana for extracting data fromthe Congo plot database is greatly appreciated.The fieldwork of the first author was made pos-sible by a grant from the Danish Natural Sci-ence Research Council (grant no. 11-0390)through the Danish Centre for Tropical Biodi-versity, and, in Uganda, would not have beenpossible without the assistance of D. N. Nku-utu. The studies of the second and thirdauthors were funded by the Danish Interna-tional Development Agency (DANIDA) underthe Enhancement of Research Capacity(ENRECA) project ‘Biodiversity Research andtraining in Tanzania and Uganda’ and we wishto thank I. Friis and J. Kasenene for supervisonand the field assistants J. Kyomuhendo and S.Kimuli. Several botanists from various herbariahave helped us in identification of the collec-tions made during the project: H. Beentje, P.Bizzarri, P.C. Boyce, D.M. Bridson, B.L. Burtt,T.A. Cope, P.J. Cribb, J.J.F.E. de Wilde, J.B.Dhetchuvit, P.J. Edwards, R. Faden, I. Friis, B.Hansen, N. Hepper, R.J. Johns, A.B. Katende,W. Lobin, J.M. Lock, K.A. Lye, I. Nordal, B. Pet-tersson, M.G. Price, S.A. Renvoize, E. Rob-brecht, O. Ryding, M. Sosef, M. Thulin, B.Verdcourt, R. Viane, and K.B. Vollesen. We aregrateful for their help as well as for the permis-sion from the Keepers to work at the herbariaof K and BR, and the first author especially toH. Tuomisto and K. Ruokolainen for inspira-
BS 55 141

tion, assistance, and providing a working tableat the University of Turku, Finland, during theanalyses and writing of the present paper.
Literature Cited
Bibby, C.J., Collar, N.J., Crostby, M.J., Heath, M.F., Imbo-den, C.H., Johnson, T.H., Long, A.J., Stattersfield, A.J. &Thirgood, S.J. 1992. Putting Biodiversity on a map: priorityareas for global conservation. International Council forBird Preservation, Cambridge.
Bouyoucos, G.J. 1962. Hydrometer method improved formaking particle size analyses of soils. Agron. J. 53: 464-465.
Bray, R.H. & Kurtz, L.T. 1945. Determination of totalorganic and available phosphorous in soils. Soil Sci. 59:39-45.
Colyn, M., Gautier-Hion, A. & Verheyen, W. 1991. A re-appraisal of palaeoenvironmental history in centralAfrica: evidence for a major fluvial refuge in the ZaïreBasin. J. Biogeogr. 18: 403-407.
Conant, D.S. 1978. A radioisotope technique to measurespore dispersal of the tree fern Cyathea arborea Sm.Pollen & Spores 20: 583-593.
Condit, R., Pitman, N., Leigh, Jr., E.G., Chave, J., Terborgh,J., Foster, R.B., Núñez V., P., Aguilar, S., Valencia, R.,Villa, G., Muller-Landau, H.C., Losos, E. & Hubbell, S.P.2002. Beta-diversity in tropical forest trees. Science 295:666-669.
Diamond, A.W. & Hamilton, A.C. 1980. The distribution offorest passerine birds and Quaternary climatic change intropical Africa. Journal of Zoology, London 191: 379-402.
Eilu, G. 1999. Climbers from tropical rain forests at theAlbertine Rift, Western Uganda. Lidia 4: 93-120.
Gentry, A.H. 1991. The distribution and evolution ofclimbing plants. In: Putz, F.E. & Mooney, H.A. (eds.), Thebiology of vines. Cambridge University Press, New York.Pp. 3-42.
Hall, J.B. & Swaine, M.D. 1976. Classification and ecologyof closed-canopy forest in Ghana. J. Ecol. 64: 913-951.
Hamilton, A.C. 1974. Distribution patterns of forest treesin Uganda and their historical significance. Vegetatio 29:21-35.
Hamilton, A.C. 1982. Environmental history of East Africa. Astudy of the Quaternary. Academic Press, London.
Hamilton, A.C. 1984. Deforestation in Uganda. Oxford Uni-versity Press, Nairobi.
Hamilton, A.C. 1992. History of forests and climate. In:Sayer, A.J., Harcourt, C.S. & Collins, N.M. (eds.), The con-servation of tropical forests. Africa. MacMillan Publishers,Basingstoke. Pp. 17-25.
Hart, T.B., Gereau, R.E., Ewango, C., Liengola, I., Poulsen,A.D., & Hart, J.A. in press. An introduction to the forestecology and a species list of vascular plants of theReserve de Faune a Okapis, Ituri forest, DemocraticRepublic of Congo. Monogr. Syst. Bot. Missouri Bot. Gard.
Howard, P.C. 1991. Nature conservation in Uganda’s tropicalforest reserves. The IUCN Tropical Forest Programme.IUCN, Gland.
Jolly, D., Taylor, D., Marchant, R., Hamilton, A.C., Bon-nefille, R., Buchet, G. & Riollet, G. 1997. Vegetationdynamics in central Africa since 18,000 yr BP: pollenrecords from the interlacustrine highlands of Burundi,Rwanda and western Uganda. J. Biogeogr. 24: 495-512.
Kingdon, J. 1971. East African mammals. An atlas of evolutionin Africa. Vol. 1. Academic Press, London & New York.
Kornas, J. 1993. The significance of historical factors andecological preference in the distribution of Africanpteridophytes. J. Biogeogr. 20: 281-286.
Legendre, P. 2000. Comparison of premutation methodsfor the partial correlation and partial Mantel tests. Jour-nal of Statistical Computation and Simulation 67: 37-73.
Legendre, P. & Legendre, L. 1998. Numerical ecology. Devel-opments in environmental modelling 20. Elsevier, Amster-dam.
Linder, H.P. 1998. Historical interpretation of the Africanphytochoria. In: Huxley, C.R., Lock, J.M. & Cutler, D.F.(eds.), Chorology, taxonomy and ecology of the African andMadagascan floras. Royal Botanical Gardens, Kew. Pp. 67-86.
Lwanga, J.S, Balmford, A. & Badaza, R. 1998. Assessingfern diversity: relative species richness and its environ-mental correlates in Uganda. Biodiversity and Conserva-tion 7: 1387-1398.
Makana, J., Hart, T.B. & Hart, J.A. 1998. Forest structureand diversity of lianas and understory treelets in mon-odominant and mixed stands in the Ituri Forest, Democ-ratic Republic of the Congo. In: Dallmeier, F. &Comiskey, J.A. (eds.), Forest biodiversity research, monitoringand modeling: Conceptual background and Old World casestudies. UNESCO’s Man and the Biosphere Series, Vol-ume 20. Parthenon Publishing, Pearl River, New York,USA. Pp. 429-446.
Mantel, N. 1967. The detection of disease clustering and ageneralised regression approach. Cancer Res. 27: 209-220.
Moore, P.D. 1998. Did forests survive the cold in a hotspot?Nature 391: 124-126.
Moran, R.C. 1995. The importance of Mountains to pteri-dophytes, with emphasis on Neotropical montaneforests. In: Churchill, S.P., Balslev, H., Forero, E. &Luteyn, J.L. (eds.), Biodiversity and conservation of Neotrop-ical Montane forests. The New York Botanical Gardens,Bronx, New York. Pp. 359-363.
Okalebo, J.R., Gathuna, K.W. & Woomer, P.L. 1993. Labora-
142 BS 55

tory methods of soil and plant analysis: A working manual.Tropical Soil Biology and Fertility Programme. Nairobi,Kenya.
Plumptre, A.J., Behangana, M., Davenport, T.R.B.,Kahindo, C., Kityo, R, Endomba, E., Nkuutu, D.N.,Owiunji, I., Ssegawa, P. & Eilu, G. (eds.), 2003. The biodi-versity of the Albertine Rift. Albertine Rift TechnicalReports no. 3. Wildlife Conservation Society.
Poulsen, A.D. 1996a. Species richness and density ofground herbs within a plot of lowland rainforest innorth-west Borneo. J. Trop. Ecol. 12: 177-190.
Poulsen, A.D. 1996b. The herbaceous ground flora of theBatu Apoi Forest Reserve, Brunei. In: Edwards, D.S.,Booth, W.E. & Choy, S.C. (eds.), Tropical Rainforest Re-search – Current Issues. Monographiae Biologicae V. 74.Kluwer Academic Publishers, The Netherlands. Pp. 43-57.
Poulsen, A.D. 1997. Plant diversity in forests of western Ugandaand eastern Zaire (preliminary results). AAU Reports 36.Aarhus University Press.
Poulsen, A.D. & Balslev, H. 1991. Abundance and cover ofground herbs in an Amazonian rain forest. J. Veg. Sci. 2:315-322.
Poulsen, A.D. & Lock, J.M. 1997. New species and newrecords of Zingiberaceae and Costaceae from tropicalEast Africa. Kew Bull. 52: 601-616.
Poulsen, A.D. & Lock, J.M. 1999. A review of African forestZingiberaceae. In: Timberlake, J. & Kativu, S. (eds.),African plants. Biodiversity, taxonomy, and uses. Proceed-ings of the 1997 AETFAT Congress, Harare, Zimbabwe.Royal Botanic Gardens, Kew. Pp. 51-64.
Poulsen, A.D., Lock, J.M., Liengola, I.B. & Ewango, C.E.N.1999. A new forest species of Siphonochilus (Zingiber-aceae) from central Africa. Kew Bull. 54: 203-207.
Poulsen, A.D. & Nordal, I. 1999. Two new species ofChlorophytum from central Africa. Kew Bull. 54: 941-949.
Prigogine, A. 1988. Speciation patterns of birds in the CentralAfrican forest refugia and their relationship with other refugia.Acta XIX Congressus Internationalis Ornithologici 2.University of Ottawa Press, Ottawa. Pp. 144-157.
Putz, F.E. 1984. The natural history of lianas on Barro Col-orado Island, Panama. Ecology 65: 1713-1724.
Richards, P.W. 1973. Africa, the ‘Odd man out’. In: Meg-gers, B.J., Ayensu, E.S. & Duckworth, D. (eds.), Tropicalforest ecosystems in Africa and South America, a comparativereview. Smithsonian Inst. Press, Washington DC.
Robbrecht, E. 1996. Geography of African Rubiaceae withreference to glacial rain forest refuges. In: van der Mae-sen, L.J.G., van der Burgt, X.M., van Medenbach deRooy, J.M. (eds.), The Biodiversity of African plants. KluwerAcademic Publishers, The Netherlands. Pp. 564-581.
Ruokolainen, K., Linna, A. & Tuomisto, H. 1997. Use ofMelastomataceae and pteridophytes for revealing phyto-geographical patterns in Amazonian rain forests. J. Trop.Ecol. 13: 243-256.
Ruokolainen, K. & Tuomisto, H. 1998. Vegetación naturalde la zona de Iquitos. In: Kalliola, R. & Flores Paitán, S.(eds.), Geoecología y desarrollo Amazónico: estudio integradoen la zona de Iquitos, Perú. Annales Universitatis Turkuen-sis. Ser. A II 114. Pp. 253-365.
Smith, A.R. 1972. Comparison of fern and flowering plantdistributions with some evolutionary interpretations forferns. Biotropica 4: 4-9.
Smouse, P.E., Long, J.C. & Sokal, R.R. 1986. Multipleregression and correlation extension of the Mantel testof matrix correspondence. Syst. Zool. 35: 627-632.
Tuomisto, H., Poulsen, A.D., Ruokolainen, K., Moran, R.,Quintana, C., Celi, J. & Cañas, G. 2003. Linking floristicpatterns with soil heterogeneity and satellite imagery inEcuadorian Amazonia. Ecological Applications 13: 352-371.
Tuomisto, H., Ruokolainen, K., Kalliola, R., Linna, A., Dan-joy, W. & Rodriguez, Z. 1995. Dissecting Amzonian bio-diversity. Science 269: 63-66.
Tuomisto, H., Ruokolainen, K., Poulsen, A.D., Moran, R.,Quintana, C., Celi, J. & Cañas, G. 2002. Distribution anddiversity of pteridophytes and Melastomataceae alongedaphic gradients in Yasuni National Park, EcuadorianAmazonia. Biotropica 34: 516-533.
Valencia, R., Balslev, H. & Paz Y Miño, G. 1994. High treealpha-diversity in Amazonian Ecuador. Biodiversity andConservation 3: 21-28.
Verdcourt, B. 1998. A new species of Ficus (Moraceae)from Uganda. Kew Bull. 53: 233-236.
Vormisto, J., Phillips, O.L., Ruokolainen, K., Tuomisto, H.& Vásquez, R. 2000. A comparison of fine-scale distribu-tion patterns of four plant groups in an Amazonian rain-forest. Ecography 23: 349-359.
White, F. 1983. The vegetation of Africa. Maps & Memoir.UNESCO/AETFAT/UNSO, Paris.
Whitmore, T.C. 1975. Tropical rain forests of the Far East.Clarendon Press, Oxford.
BS 55 143