complex university - Office of the President PCEP Tempe... · Top Quartile Third Quartile ... 1984...
53
Transcript of complex university - Office of the President PCEP Tempe... · Top Quartile Third Quartile ... 1984...
complex university
adaptive 2013 and
beyond
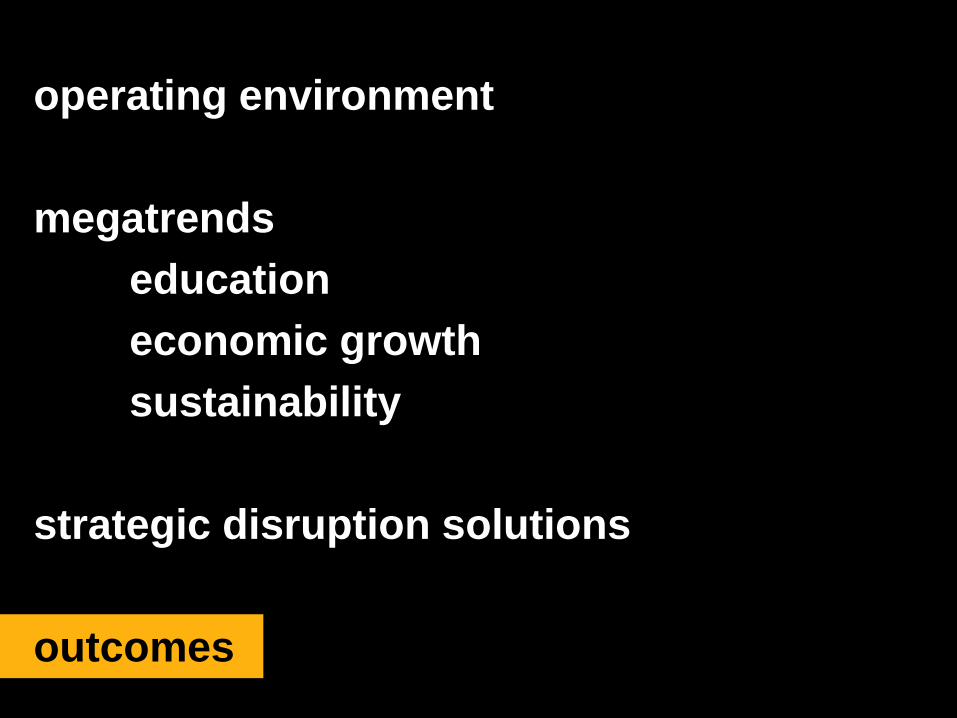
operating environment
megatrends
education
economic growth
sustainability
strategic disruption solutions
outcomes

city
regional
state
national
international Complex Operating
Environment
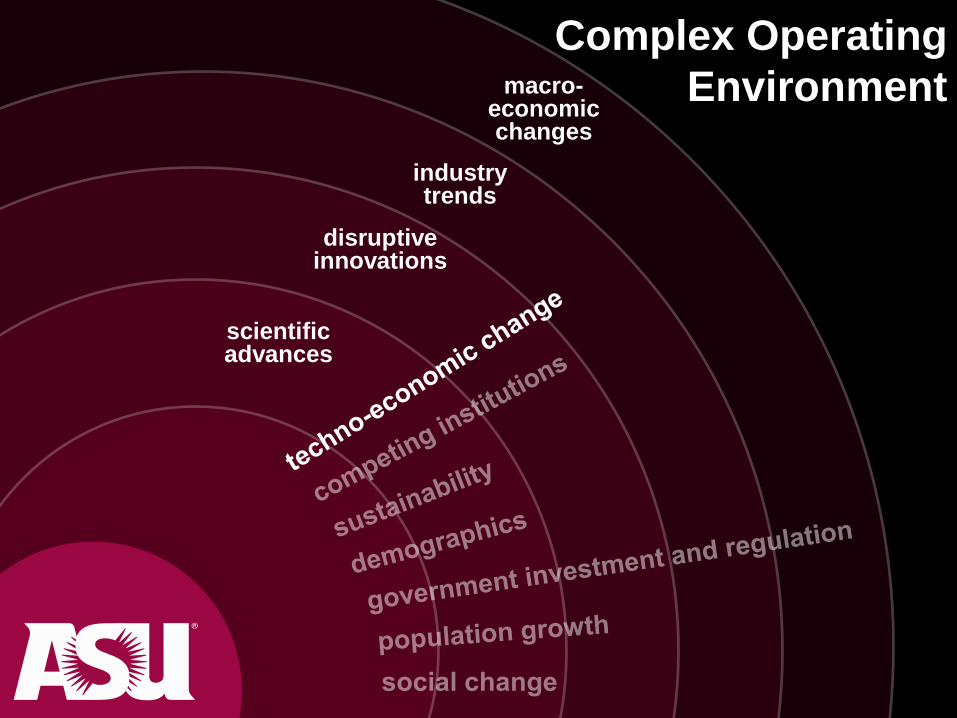
scientific advances
Complex Operating
Environment
disruptive innovations
industry trends
macro- economic changes

operating environment
megatrends
education
economic growth
sustainability
strategic disruptive solutions
outcomes

Income Inequality in Bachelor’s
Degree Attainment
0%
10%
20%
30%
40%
50%
60%
70%
80%
1970 1980 1990 2000 2010
Top Quartile
Third Quartile
Second Quartile
Bottom Quartile
0
10
20
30
40
50
60
70
80
90
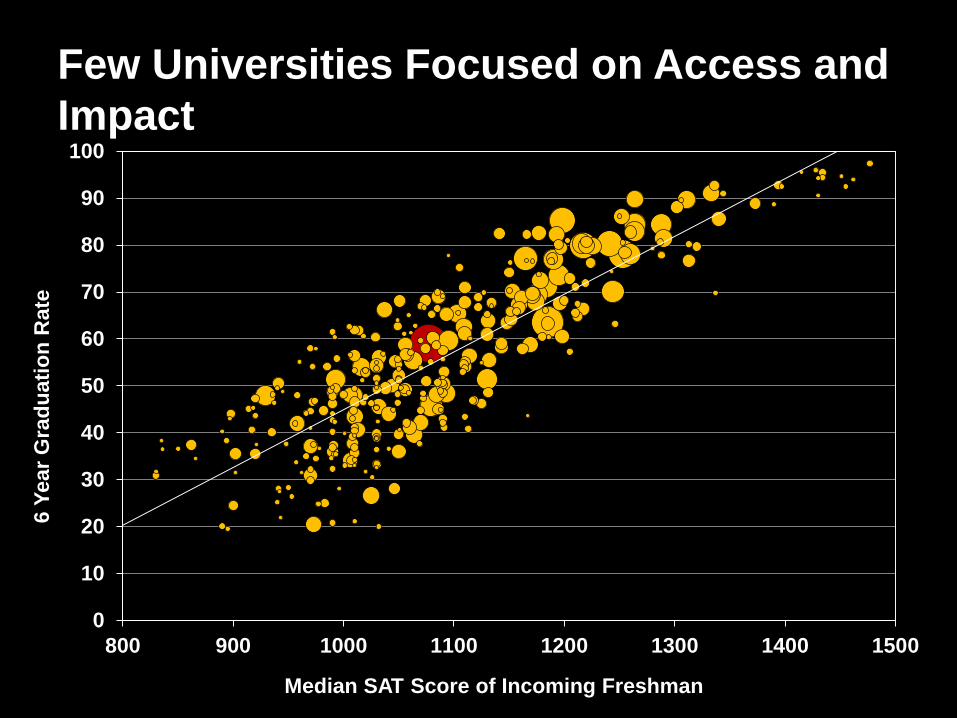
100
800 900 1000 1100 1200 1300 1400 1500
6 Y
ear
Gra
du
ati
on
Rate
Median SAT Score of Incoming Freshman
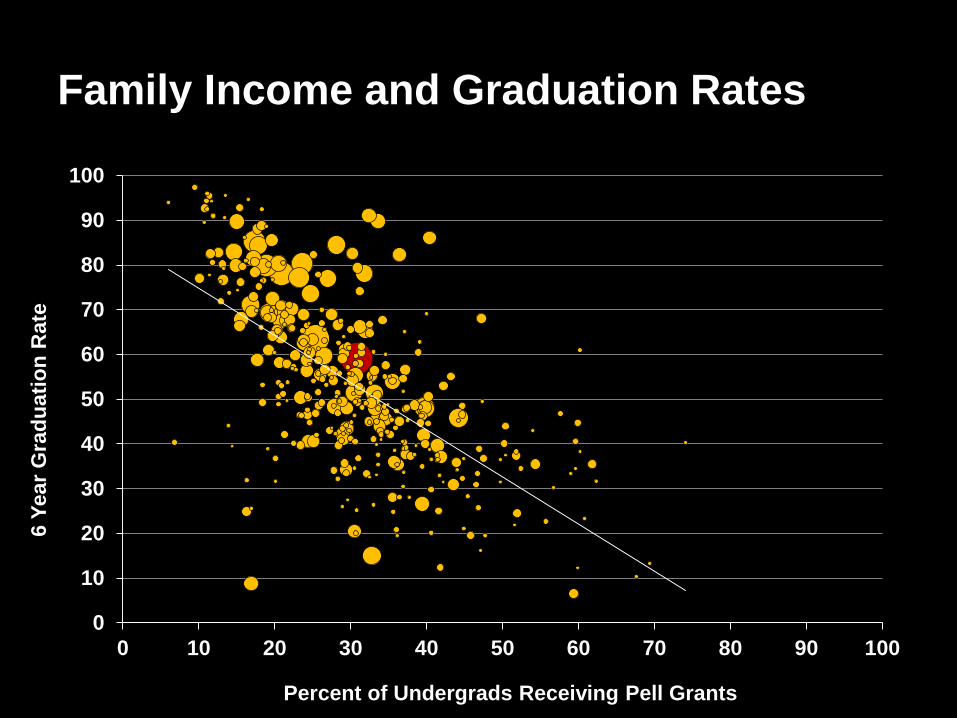
Few Universities Focused on Access and
Impact
0
10
20
30
40
50
60
70
80
90
100
0 10 20 30 40 50 60 70 80 90 100
6 Y
ear
Gra
du
ati
on
Rate
Percent of Undergrads Receiving Pell Grants
Family Income and Graduation Rates
0
10
20
30
40
50
60
70
80
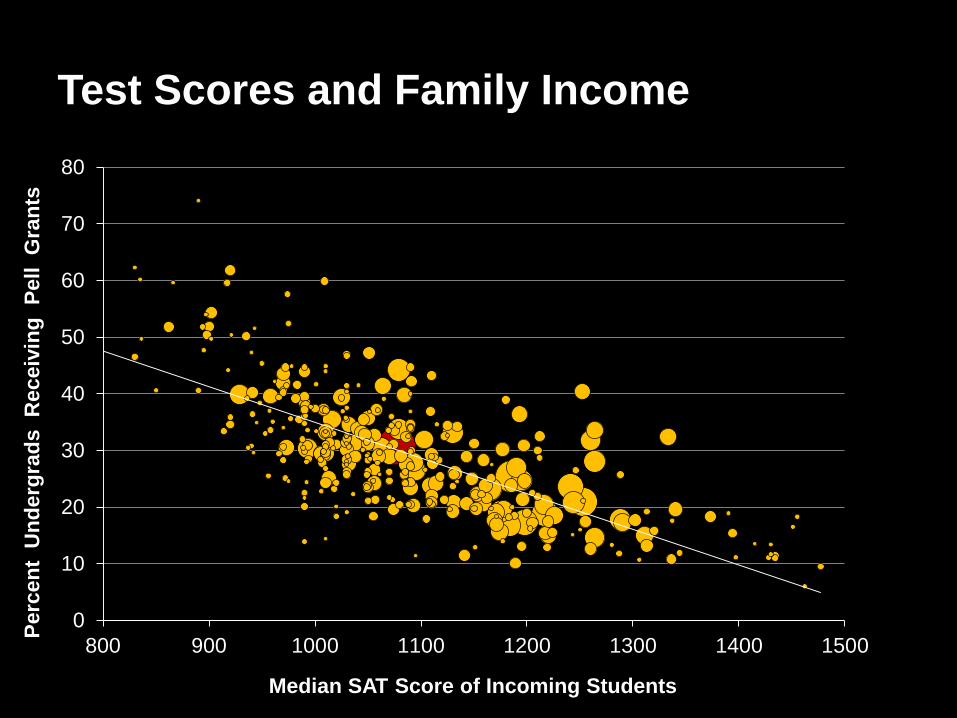
800 900 1000 1100 1200 1300 1400 1500
Perc
en
t U
nd
erg
rad
s
Receiv
ing
P
ell
G
ran
ts
Median SAT Score of Incoming Students
Test Scores and Family Income

Declining State Fiscal Support for Higher
Education per $1000 of Personal Income
$2
$4
$6
$8
$10
$12
$14
$16
1978 1986 1994 2002 2010
National
Average
Arizona
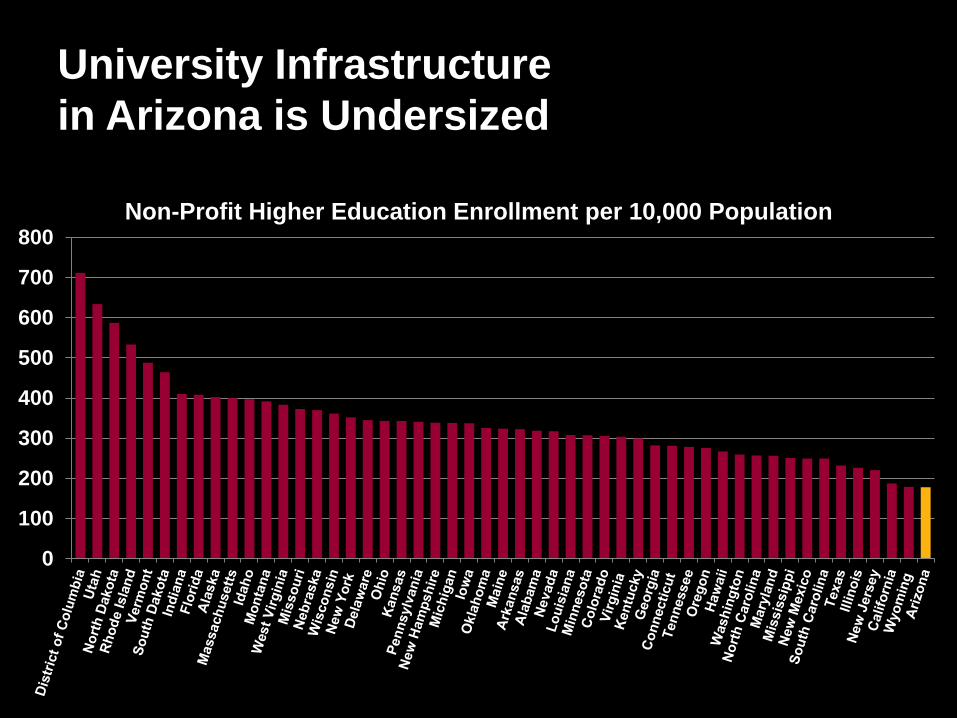
University Infrastructure
in Arizona is Undersized
0
100
200
300
400
500
600
700
800Non-Profit Higher Education Enrollment per 10,000 Population
0
50
100
150
200
250
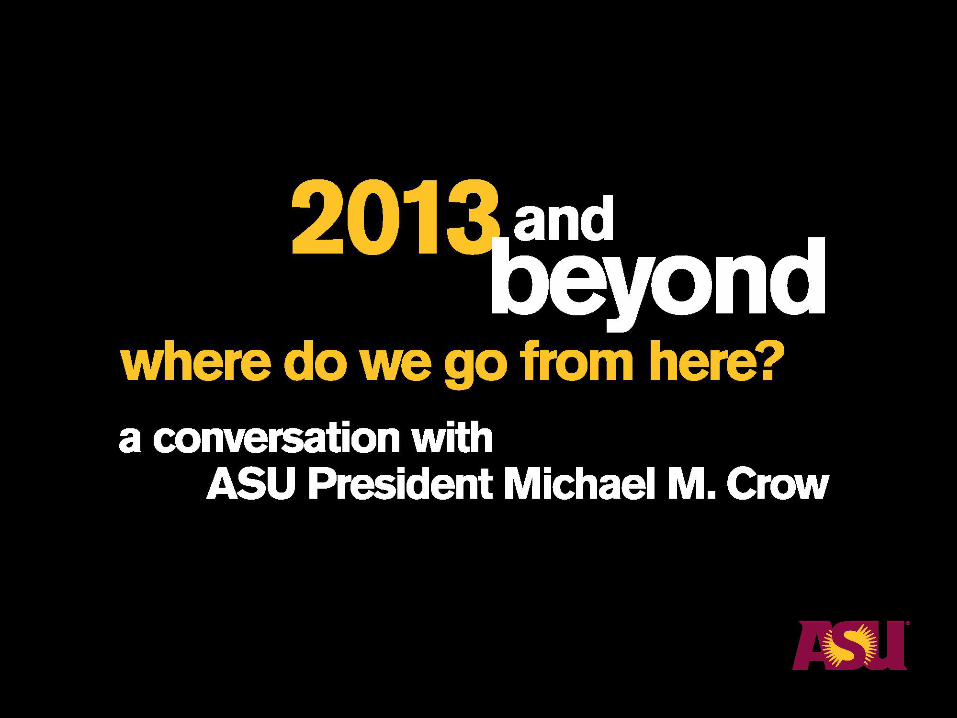
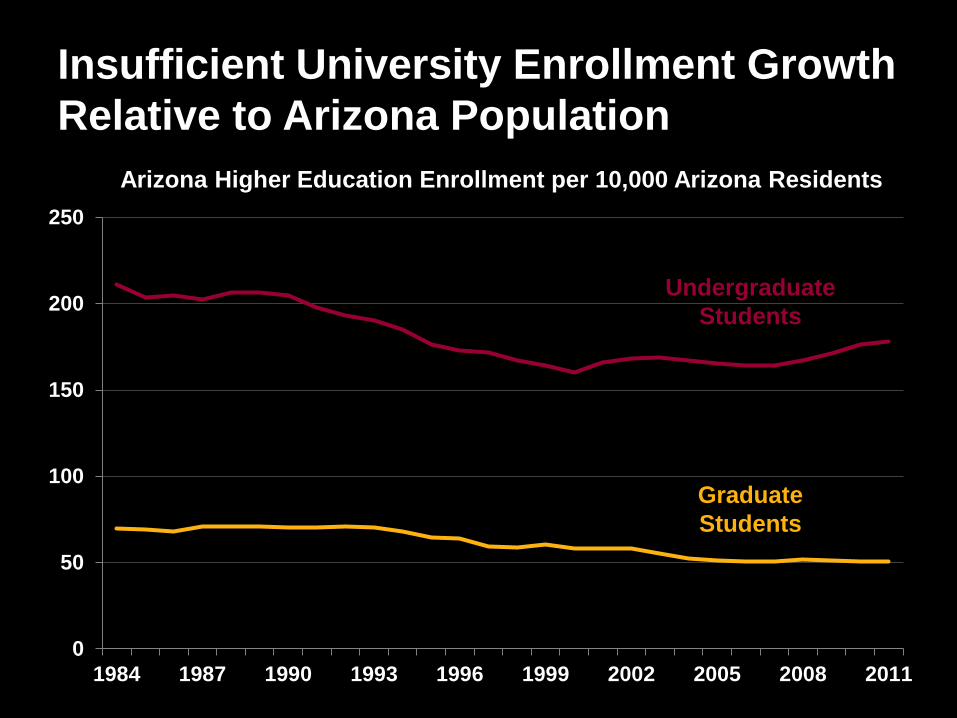
1984 1987 1990 1993 1996 1999 2002 2005 2008 2011
Insufficient University Enrollment Growth
Relative to Arizona Population
Undergraduate
Students
Graduate
Students
Arizona Higher Education Enrollment per 10,000 Arizona Residents
operating environment
megatrends
education
economic growth
sustainability
strategic disruptive solutions
outcomes
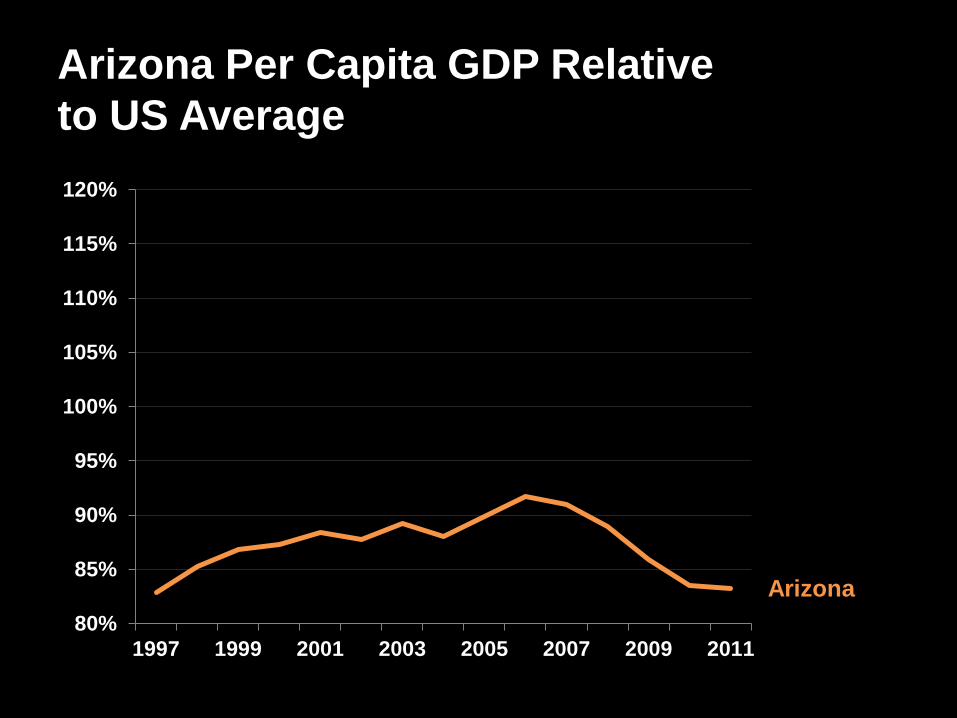
80%
85%
90%
95%
100%
105%
110%
115%
120%
1997 1999 2001 2003 2005 2007 2009 2011
Arizona Per Capita GDP Relative
to US Average
Arizona
Colorado
Minnesota
North
Carolina
Utah
Washington

80%
85%
90%
95%
100%
105%
110%
115%
120%
1997 1999 2001 2003 2005 2007 2009 2011
Arizona Per Capita GDP Relative
to US Average
Arizona
Colorado
Minnesota
North
Carolina
Utah
Washington

80%
85%
90%
95%
100%
105%
110%
115%
120%
1997 1999 2001 2003 2005 2007 2009 2011
Arizona Per Capita GDP Relative
to US Average
Arizona
Colorado
If Arizona matched
Colorado’s per capita GDP,
the economy of Arizona
would be $76.4 billion larger.
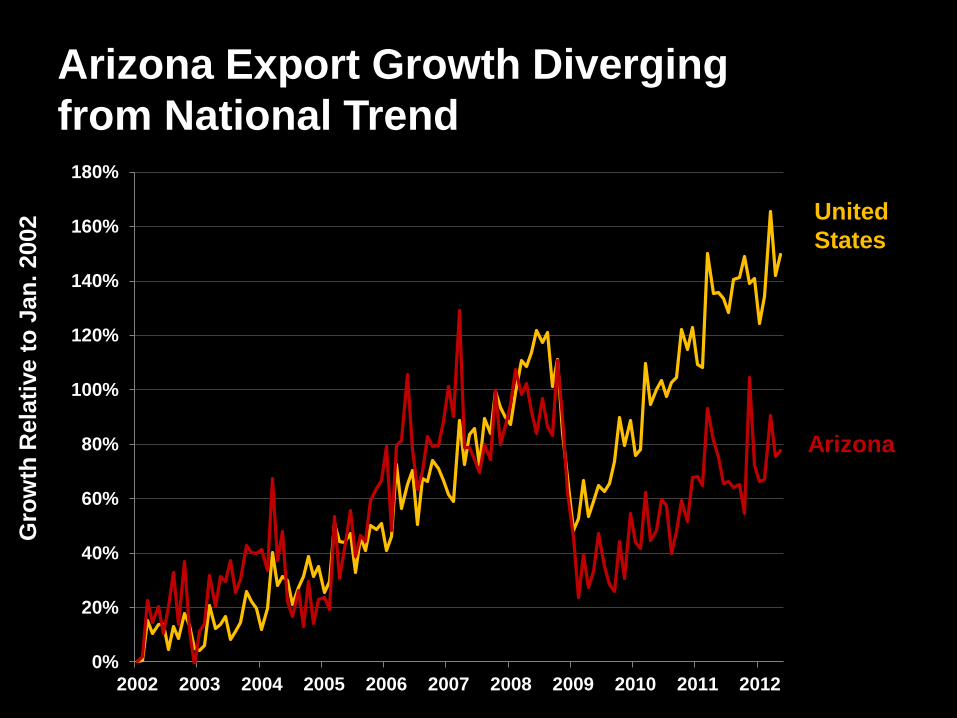
Arizona Export Growth Diverging
from National Trend
0%
20%
40%
60%
80%
100%
120%
140%
160%
180%
2002 2003 2004 2005 2006 2007 2008 2009 2010 2011 2012
United
States
Arizona
Gro
wth
Rela
tive t
o J
an
. 2002

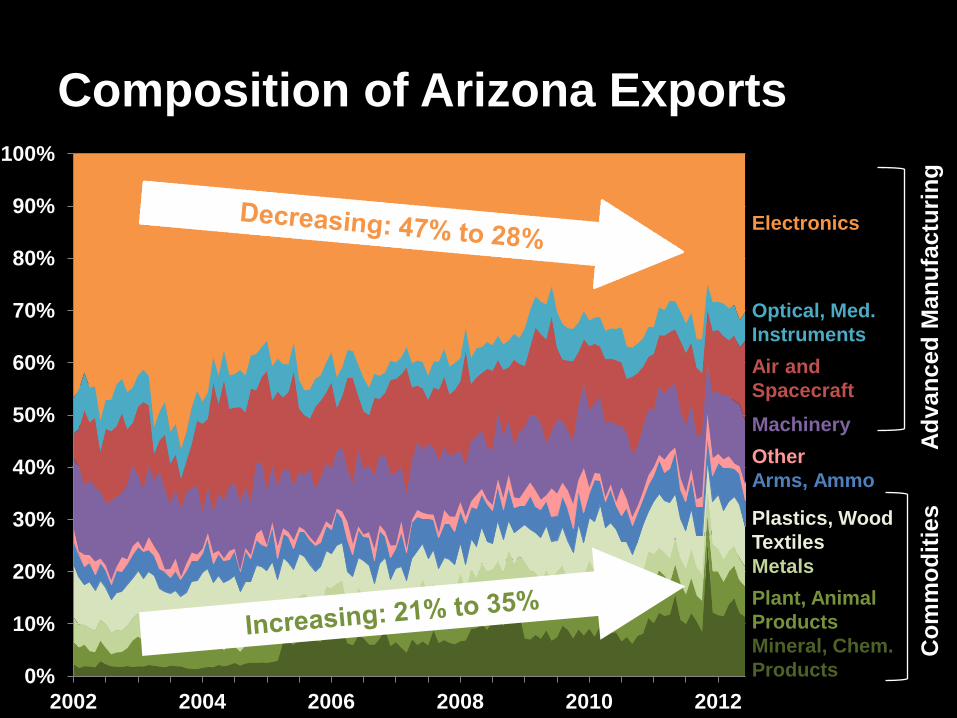
Other
Arms, Ammo
Optical, Med.
Instruments
Air and
Spacecraft
Electronics
Mineral, Chem.
Products
Machinery
Plant, Animal
Products
Metals
Plastics, Wood
Textiles
Composition of Arizona Exports
Ad
van
ced
Man
ufa
ctu
rin
g
Co
mm
od
itie
s
0%
10%
20%
30%
40%
50%
60%
70%
80%
90%
100%
2002 2004 2006 2008 2010 2012
operating environment
megatrends
education
economic growth
sustainability
strategic disruptive solutions
outcomes
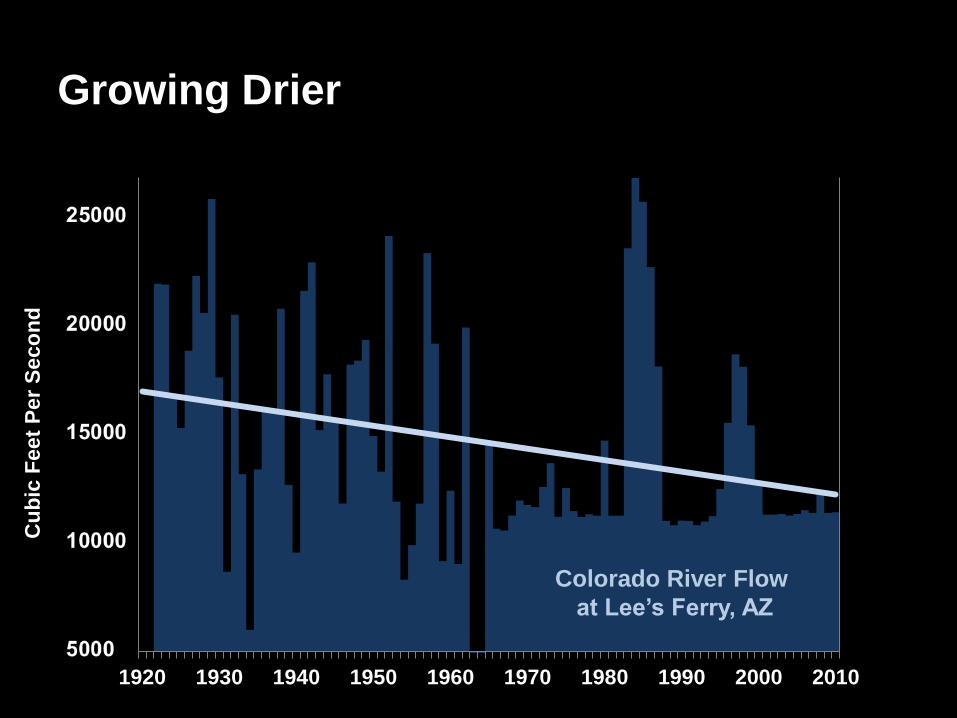
Growing Drier
5000
10000
15000
20000
25000
35
40
45
50
55
60
65
70
75
80
85
1920 1930 1940 1950 1960 1970 1980 1990 2000 2010
Colorado River Flow
at Lee’s Ferry, AZ
Cu
bic
Feet
Per
Sec
on
d

Growing Drier and Hotter
5000
10000
15000
20000
25000
35
40
45
50
55
60
65
70
75
80
85
1920 1930 1940 1950 1960 1970 1980 1990 2000 2010
Colorado River Flow
at Lee’s Ferry, AZ
PHX June
Low Temp
Cu
bic
Feet
Per
Sec
on
d
Deg
rees

Arizona Energy Consumption: 1960-2009
0
200
400
600
800
1000
1200
1400
1600
1800
1960 1965 1970 1975 1980 1985 1990 1995 2000 2005
Tri
llio
n B
TU
s
Arizona Primary Energy Consumption: 1960-2009
Petroleum
Coal
Natural Gas
Nuclear Hydroelectric
Solar
Wind and other
Tri
llio
n B
TU
s
Year

operating environment
megatrends
education
economic growth
sustainability
strategic disruptive solutions
outcomes
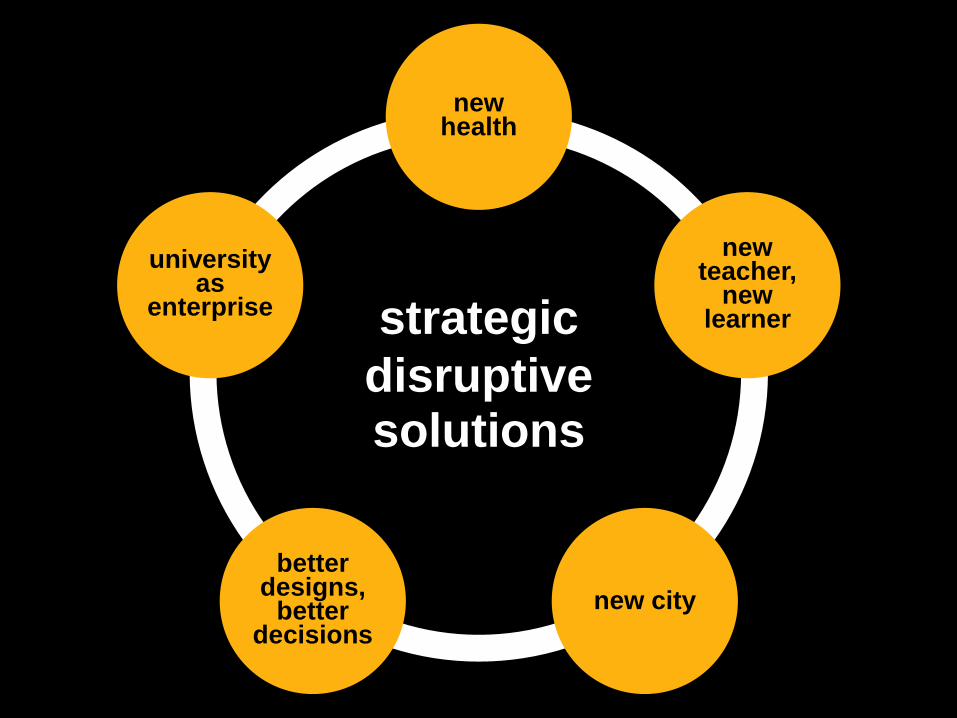
strategic disruptive solutions
new health
new teacher,
new learner
new city
better designs,
better decisions
university as
enterprise

university as enterprise
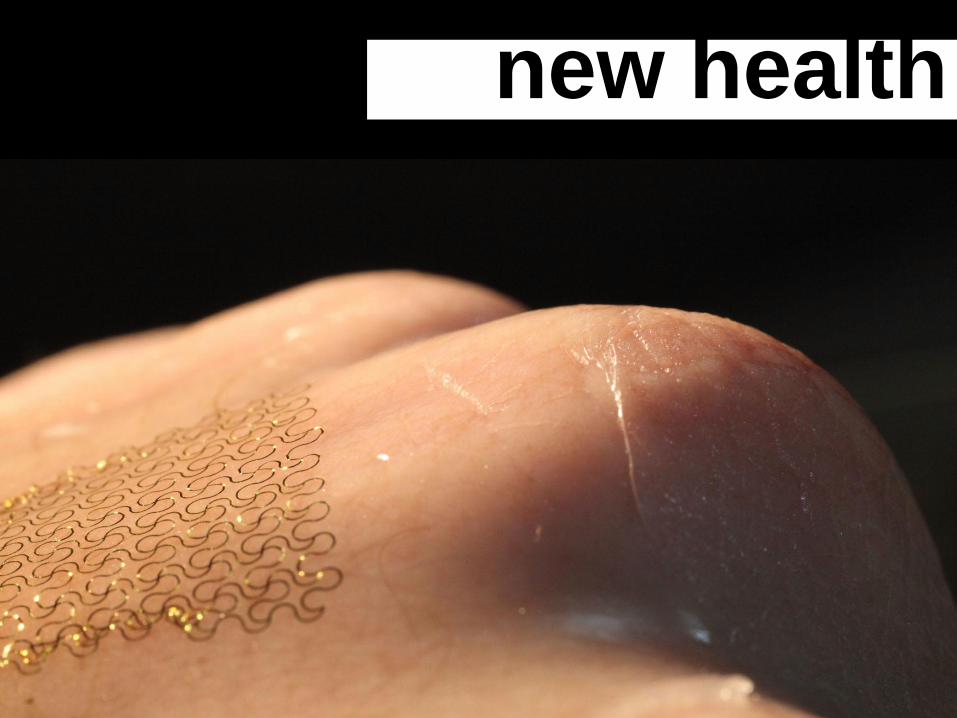
new health

better designs, better decisions
McCain Institute
Complex Adaptive System Network
Center for Science and Imagination
Project Humanities

new city

new teacher, new learner
operating environment
megatrends
education
economic growth
sustainability
strategic disruption solutions
outcomes
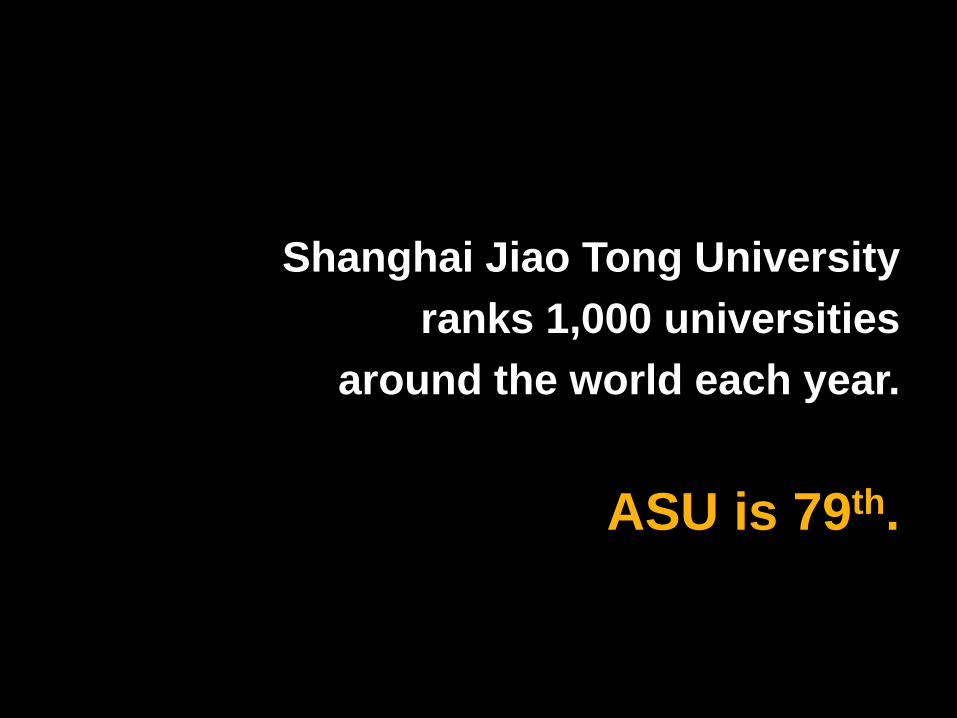
Shanghai Jiao Tong University
ranks 1,000 universities
around the world each year.
ASU is 79th.
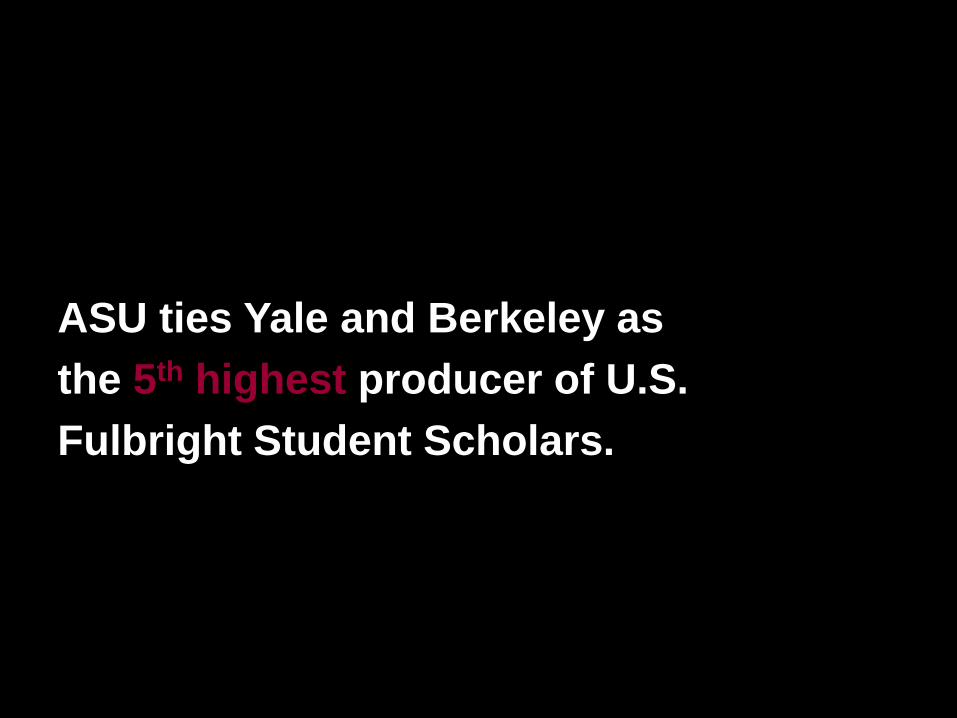
ASU ties Yale and Berkeley as
the 5th highest producer of U.S.
Fulbright Student Scholars.

The National Research Council
ranks more than half of
ASU’s 85 doctoral programs
in the Top 25 nationally.
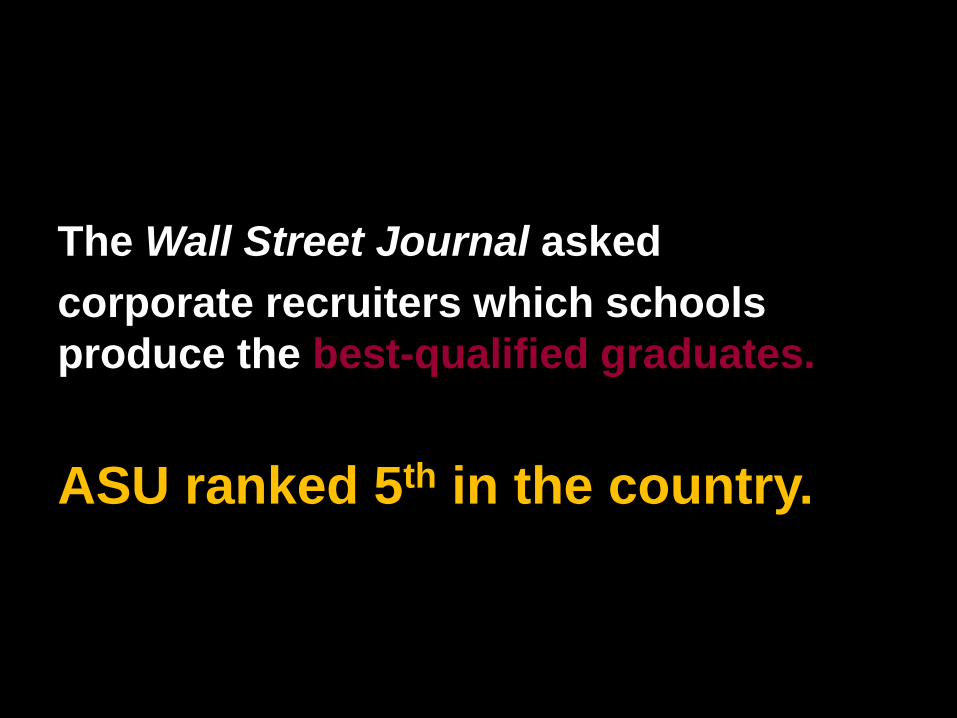
The Wall Street Journal asked
corporate recruiters which schools
produce the best-qualified graduates.
ASU ranked 5th in the country.

There were 22 Flinn Scholars in 2012.
16 chose ASU.

ASU Lower Income Student Enrollment:
3% to 40%
0
10,000
20,000
30,000
40,000
50,000
60,000
70,000
1990 1995 2000 2005 2010
Un
derg
rad
uate
E
nro
llm
en
t

Connecting Lower Income Students to
Knowledge Creation at Unrivaled Scale
0
5,000
10,000
15,000
20,000
25,000
0 5 10 15
Percent Point Change in Freshman Receiving Pell Grants, 2008-10
To
tal
Pell U
nd
erg
rad
s,
20
10
ASU

0
20
40
60
80
100
120
1984 1987 1990 1993 1996 1999 2002 2005 2008 2011
Undergrad Enrollment Per 10,000 Arizona Residents
ASU Enrollment Now Growing Faster
than Arizona Population
ASU
UA
NAU
All Others

-
2,000
4,000
6,000
8,000
10,000
12,000
14,000
16,000
18,000
$14,000
$14,500
$15,000
$15,500
$16,000
$16,500
$17,000
$17,500
$18,000
$18,500
Core Revenues per Student and Degrees Awarded
ASU Leads Degree Production Efficiency

ASU Research Expenditures: 1980-2012
$0
$100
$200
$300
$400
$500
$600
$700
1980 1985 1990 1995 2000 2005 2010 2015 2020
Millio
ns

ASU Research Expenditures: 1980-2020
$0
$100
$200
$300
$400
$500
$600
$700
1980 1985 1990 1995 2000 2005 2010 2015 2020
Millio
ns
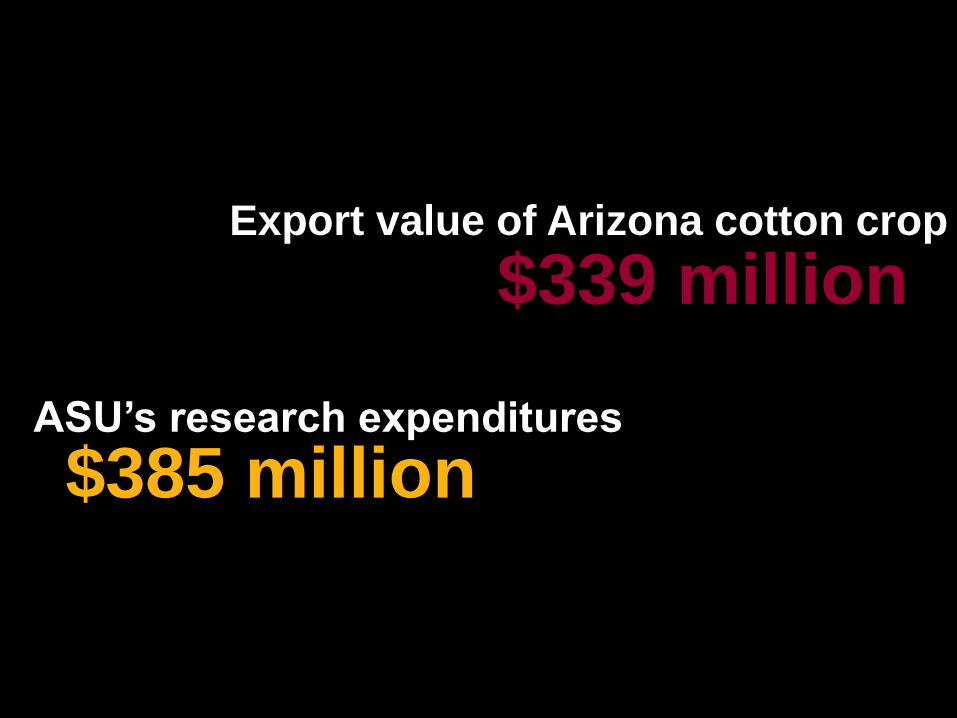
Export value of Arizona cotton crop
ASU’s research expenditures
$385 million
$339 million


vision To establish ASU as the model for
the New American University, measured
not by who we exclude, but rather by
who we include and how they succeed;
pursuing research and discovery that
benefits the public good; assuming
major responsibility for the economic,
social and cultural vitality and health and
well-being of the community.
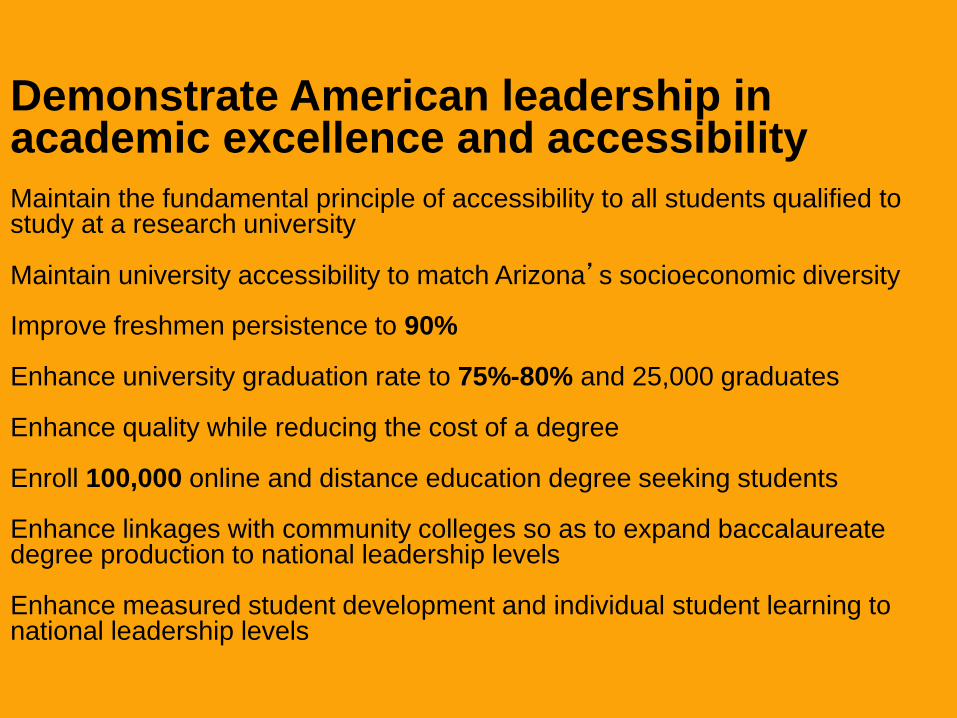
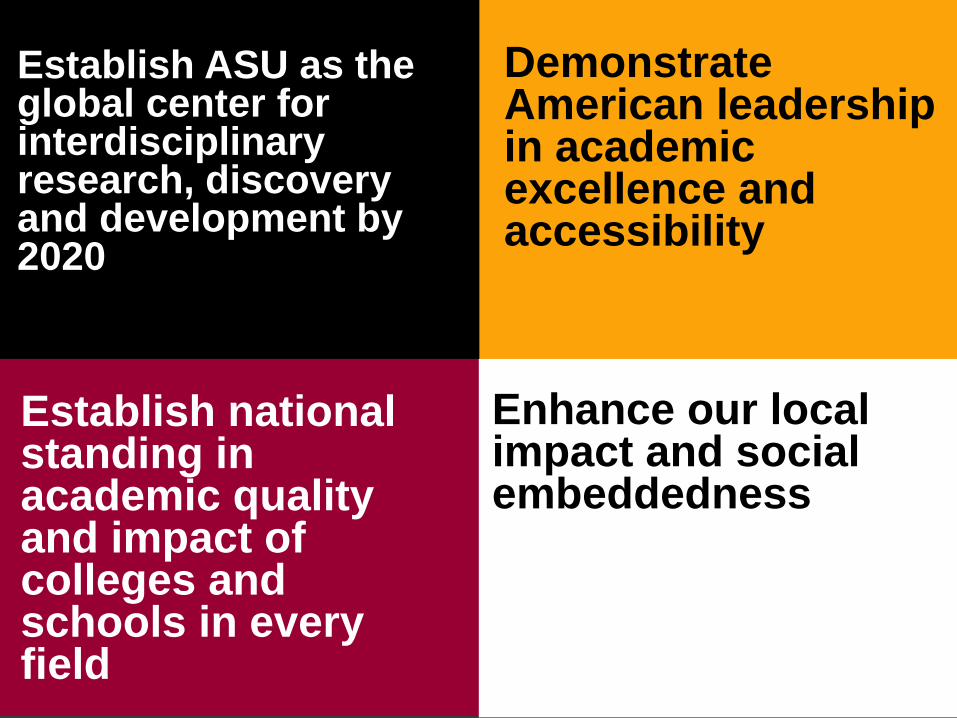
Demonstrate American leadership in academic excellence and accessibility
Maintain the fundamental principle of accessibility to all students qualified to study at a research university
Maintain university accessibility to match Arizona’s socioeconomic diversity
Improve freshmen persistence to 90%
Enhance university graduation rate to 75%-80% and 25,000 graduates
Enhance quality while reducing the cost of a degree
Enroll 100,000 online and distance education degree seeking students
Enhance linkages with community colleges so as to expand baccalaureate degree production to national leadership levels
Enhance measured student development and individual student learning to national leadership levels
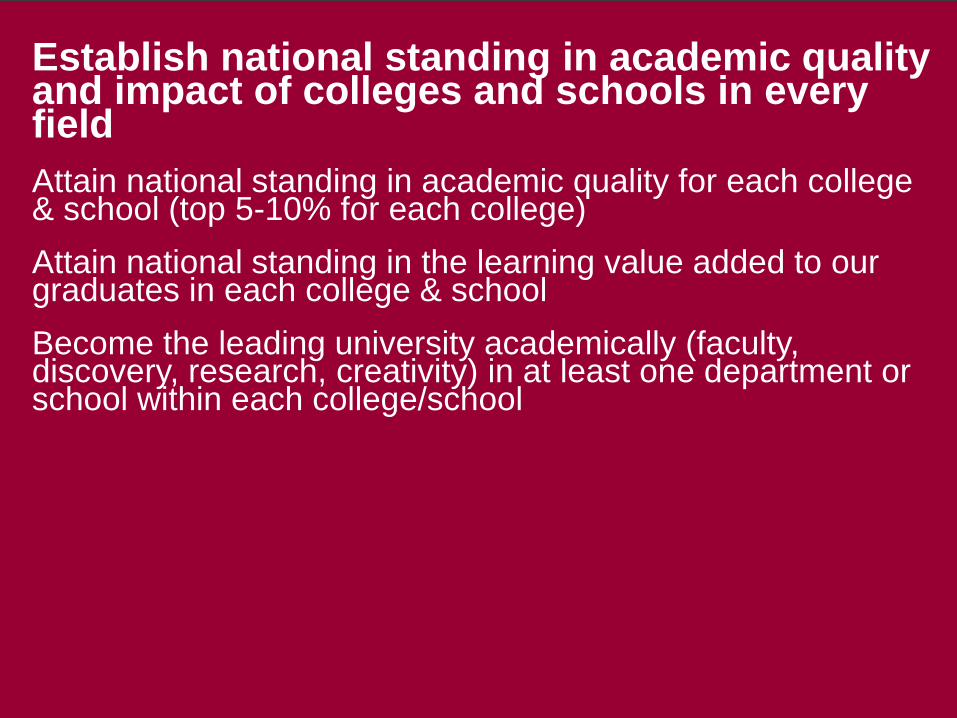
Establish national standing in academic quality and impact of colleges and schools in every field
Attain national standing in academic quality for each college & school (top 5-10% for each college)
Attain national standing in the learning value added to our graduates in each college & school
Become the leading university academically (faculty, discovery, research, creativity) in at least one department or school within each college/school

Establish ASU as the global center for interdisciplinary research, discovery and development by 2020
Become a leading global center for interdisciplinary scholarship discovery and development
Become a leading American center for discovery and scholarship in the social sciences, arts and humanities
Enhance research competitiveness to more than $700 million in annual research expenditures
Augment regional economic competitiveness through research and discovery and value-added programs

Enhance our local impact and social embeddedness
Enhance linkage to local and regional social and community development groups
Establish/develop/enhance linkages and partnerships with local, regional and national NGO’s, governments and public agencies, and private sector firms with a focus on community development
Undertake applied sustainability research that impacts the social, environmental and economic evolution of the southwest
Provide an objective and ongoing facilitation role for the region’s progress
2 of 11
Establish ASU as the global center for interdisciplinary research, discovery and development by 2020
Demonstrate American leadership in academic excellence and accessibility
Establish national standing in academic quality and impact of colleges and schools in every field
Enhance our local impact and social embeddedness


Kyle Whitman
Notes and Data Citations
Slide 2: Complex Adaptive University Background picture source: “The Internet Map,” available at http://internet-map.net/ Slide 7: Inequality in College Degree Attainment Source: Postsecondary Education Opportunity, “Bachelor’s Degree Attainment by Age 24 by Family Income Quartiles, 1970 to 2010.” Slide 8: Institutions: Inputs Determine Outputs Source: ASU analysis of IPEDS data. Slide 9: Family Income and Graduation Rates Source: ASU analysis of IPEDS data. Slide 10: Test Scores and Graduation Rates Source: ASU analysis of IPEDS data. Slide 11: State Fiscal Support for Higher Education per $1000 of Personal Income Source: Postsecondary Education Opportunity Slide 12: State Support to Arizona Universities Reaches Zero in 2032 Given 32 Year Trend Source: Postsecondary Education Opportunity Slide 13: University Infrastructure in Arizona is Undersized Source: ASU analysis of IPEDS and BEA data. Slide 14: Insufficient University Enrollment Growth Relative to Arizona Population Source: ASU analysis of IPEDS and BEA data. Slide 16: Arizona Per Capita GDP Relative to US Average Source: ASU analysis of BEA data. Slide 17: Arizona Per Capita GDP Relative to US Average Source: ASU analysis of BEA data. Slide 18: Arizona Per Capita GDP Relative to US Average Source: ASU analysis of BEA data.
Slide 19: Performance of Sectors Source: ASU analysis of BEA data. Slide 20: Arizona Export Growth Diverging from National Trend Source: ASU Analysis of US Census Bureau, Foreign Trade Division data. Slide 21-2: Composition of Arizona Exports Source: ASU analysis of US Census Bureau, Foreign Trade Division data. Slide 24: Growing Drier Source: USGS, National Water Information System Slide 25: Growing Drier and Hotter Source: NOAA's National Climatic Data Center, Satellite and Information Service Slide 26: Arizona Energy Consumption: 1960-2009 Source: Energy Information Administration, Table CT2 Slide 40: ASU Lower Income Student Enrollment: 3% to 40% Source: ASU Office of Institutional Analysis Slide 41: Connecting Lower Income Students to Knowledge Creation at Unrivaled Scale Source: ASU analysis of IPEDS and NSF data. Slide 42: ASU Enrollment Now Growing Faster than Arizona Population Source: ASU analysis of IPEDS and BEA data. Slide 43: ASU Leads Degree Production Efficiency Source: Office of the University Planner, ASU Slide 44-5: ASU Research Expenditures Source: NSF, ASU Slide 46: Arizona Cotton and ASU research Source: ASU analysis of ASU and US Census Bureau, Foreign Trade Division data.