COMPLEX BUILDING ROOF DETECTION AND STRICT DESCRIPTION ...sxs4643/igarss2012.pdf · COMPLEX...
4
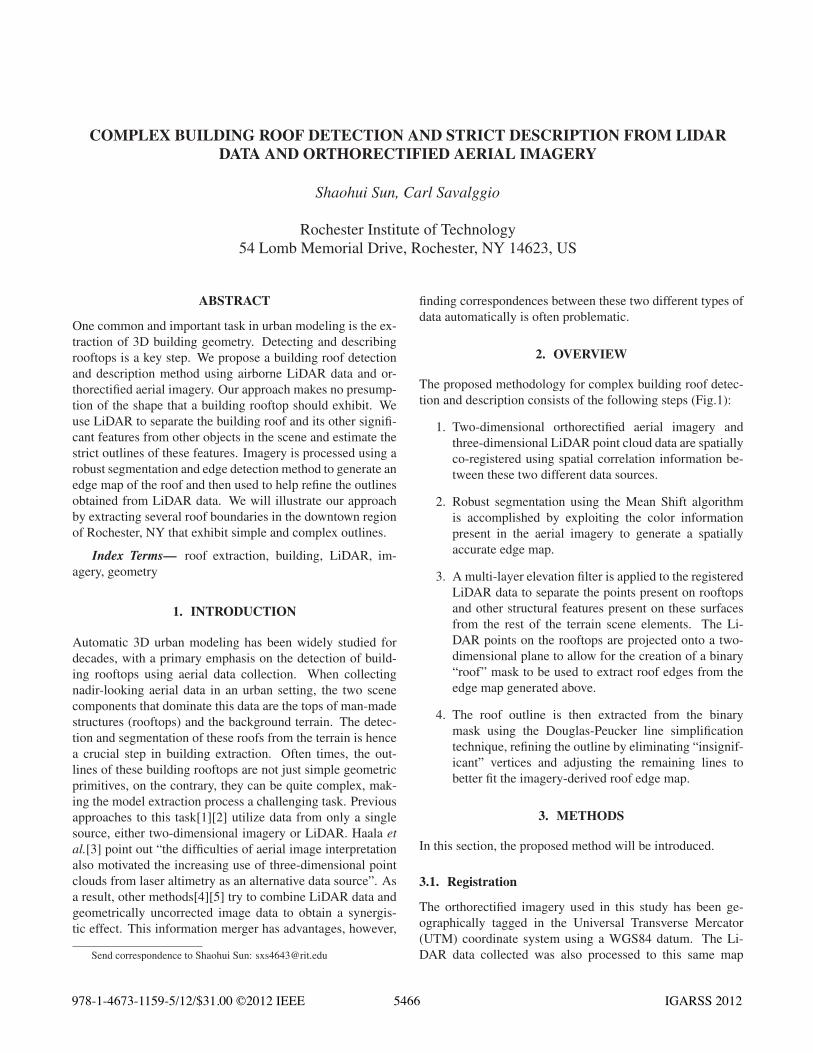
COMPLEX BUILDING ROOF DETECTION AND STRICT DESCRIPTION FROM LIDAR DATA AND ORTHORECTIFIED AERIAL IMAGERY Shaohui Sun, Carl Savalggio Rochester Institute of Technology 54 Lomb Memorial Drive, Rochester, NY 14623, US ABSTRACT One common and important task in urban modeling is the ex- traction of 3D building geometry. Detecting and describing rooftops is a key step. We propose a building roof detection and description method using airborne LiDAR data and or- thorectified aerial imagery. Our approach makes no presump- tion of the shape that a building rooftop should exhibit. We use LiDAR to separate the building roof and its other signifi- cant features from other objects in the scene and estimate the strict outlines of these features. Imagery is processed using a robust segmentation and edge detection method to generate an edge map of the roof and then used to help refine the outlines obtained from LiDAR data. We will illustrate our approach by extracting several roof boundaries in the downtown region of Rochester, NY that exhibit simple and complex outlines. Index Terms— roof extraction, building, LiDAR, im- agery, geometry 1. INTRODUCTION Automatic 3D urban modeling has been widely studied for decades, with a primary emphasis on the detection of build- ing rooftops using aerial data collection. When collecting nadir-looking aerial data in an urban setting, the two scene components that dominate this data are the tops of man-made structures (rooftops) and the background terrain. The detec- tion and segmentation of these roofs from the terrain is hence a crucial step in building extraction. Often times, the out- lines of these building rooftops are not just simple geometric primitives, on the contrary, they can be quite complex, mak- ing the model extraction process a challenging task. Previous approaches to this task[1][2] utilize data from only a single source, either two-dimensional imagery or LiDAR. Haala et al.[3] point out “the difficulties of aerial image interpretation also motivated the increasing use of three-dimensional point clouds from laser altimetry as an alternative data source”. As a result, other methods[4][5] try to combine LiDAR data and geometrically uncorrected image data to obtain a synergis- tic effect. This information merger has advantages, however, Send correspondence to Shaohui Sun: [email protected] finding correspondences between these two different types of data automatically is often problematic. 2. OVERVIEW The proposed methodology for complex building roof detec- tion and description consists of the following steps (Fig.1): 1. Two-dimensional orthorectified aerial imagery and three-dimensional LiDAR point cloud data are spatially co-registered using spatial correlation information be- tween these two different data sources. 2. Robust segmentation using the Mean Shift algorithm is accomplished by exploiting the color information present in the aerial imagery to generate a spatially accurate edge map. 3. A multi-layer elevation filter is applied to the registered LiDAR data to separate the points present on rooftops and other structural features present on these surfaces from the rest of the terrain scene elements. The Li- DAR points on the rooftops are projected onto a two- dimensional plane to allow for the creation of a binary “roof” mask to be used to extract roof edges from the edge map generated above. 4. The roof outline is then extracted from the binary mask using the Douglas-Peucker line simplification technique, refining the outline by eliminating “insignif- icant” vertices and adjusting the remaining lines to better fit the imagery-derived roof edge map. 3. METHODS In this section, the proposed method will be introduced. 3.1. Registration The orthorectified imagery used in this study has been ge- ographically tagged in the Universal Transverse Mercator (UTM) coordinate system using a WGS84 datum. The Li- DAR data collected was also processed to this same map 5466 978-1-4673-1159-5/12/$31.00 ©2012 IEEE IGARSS 2012
Transcript of COMPLEX BUILDING ROOF DETECTION AND STRICT DESCRIPTION ...sxs4643/igarss2012.pdf · COMPLEX...
COMPLEX BUILDING ROOF DETECTION AND STRICT DESCRIPTION FROM LIDARDATA AND ORTHORECTIFIED AERIAL IMAGERY
Shaohui Sun, Carl Savalggio
Rochester Institute of Technology54 Lomb Memorial Drive, Rochester, NY 14623, US
ABSTRACT
One common and important task in urban modeling is the ex-
traction of 3D building geometry. Detecting and describing
rooftops is a key step. We propose a building roof detection
and description method using airborne LiDAR data and or-
thorectified aerial imagery. Our approach makes no presump-
tion of the shape that a building rooftop should exhibit. We
use LiDAR to separate the building roof and its other signifi-
cant features from other objects in the scene and estimate the
strict outlines of these features. Imagery is processed using a
robust segmentation and edge detection method to generate an
edge map of the roof and then used to help refine the outlines
obtained from LiDAR data. We will illustrate our approach
by extracting several roof boundaries in the downtown region
of Rochester, NY that exhibit simple and complex outlines.
Index Terms— roof extraction, building, LiDAR, im-
agery, geometry
1. INTRODUCTION
Automatic 3D urban modeling has been widely studied for
decades, with a primary emphasis on the detection of build-
ing rooftops using aerial data collection. When collecting
nadir-looking aerial data in an urban setting, the two scene
components that dominate this data are the tops of man-made
structures (rooftops) and the background terrain. The detec-
tion and segmentation of these roofs from the terrain is hence
a crucial step in building extraction. Often times, the out-
lines of these building rooftops are not just simple geometric
primitives, on the contrary, they can be quite complex, mak-
ing the model extraction process a challenging task. Previous
approaches to this task[1][2] utilize data from only a single
source, either two-dimensional imagery or LiDAR. Haala etal.[3] point out “the difficulties of aerial image interpretation
also motivated the increasing use of three-dimensional point
clouds from laser altimetry as an alternative data source”. As
a result, other methods[4][5] try to combine LiDAR data and
geometrically uncorrected image data to obtain a synergis-
tic effect. This information merger has advantages, however,
Send correspondence to Shaohui Sun: [email protected]
finding correspondences between these two different types of
data automatically is often problematic.
2. OVERVIEW
The proposed methodology for complex building roof detec-
tion and description consists of the following steps (Fig.1):
1. Two-dimensional orthorectified aerial imagery and
three-dimensional LiDAR point cloud data are spatially
co-registered using spatial correlation information be-
tween these two different data sources.
2. Robust segmentation using the Mean Shift algorithm
is accomplished by exploiting the color information
present in the aerial imagery to generate a spatially
accurate edge map.
3. A multi-layer elevation filter is applied to the registered
LiDAR data to separate the points present on rooftops
and other structural features present on these surfaces
from the rest of the terrain scene elements. The Li-
DAR points on the rooftops are projected onto a two-
dimensional plane to allow for the creation of a binary
“roof” mask to be used to extract roof edges from the
edge map generated above.
4. The roof outline is then extracted from the binary
mask using the Douglas-Peucker line simplification
technique, refining the outline by eliminating “insignif-
icant” vertices and adjusting the remaining lines to
better fit the imagery-derived roof edge map.
3. METHODS
In this section, the proposed method will be introduced.
3.1. Registration
The orthorectified imagery used in this study has been ge-
ographically tagged in the Universal Transverse Mercator
(UTM) coordinate system using a WGS84 datum. The Li-
DAR data collected was also processed to this same map
5466978-1-4673-1159-5/12/$31.00 ©2012 IEEE IGARSS 2012

Fig. 1. Algorithmic structure and work flow of proposed method
projection. As a result of this common mapping, the LiDAR
points are inherently registered to the image data. Due to
system and processing errors, however, the correspondence
between individual points in these two data sources is not
ideal. An example of misregistration can be seen in Fig.2(a).
Here we can clearly tell that Δx and Δy are the offsets which
quantify the misalignment of the LiDAR and image data.
In order to address this misalignment problem, the inten-
sity values from the LiDAR data are utilized. The intensity
responses exhibit great similarities with the gray-scale im-
age data, both depicting a visual representation of the build-
ing rooftop structure. In light of this fact, it is reasonable to
compute the cross correlation between the gray-scale image
data and the two-dimensional LiDAR intensity image for the
purpose of refined alignment. The goal is to maximize the
cross correlation by shifting one data source with respect to
the other to obtain the maximum correlation response, namely
d = argmaxd
{Corr(G, I(d))} (1)
where G represents the gray-scale image, I represents the pro-
jected LiDAR intensity image, and d represents the horizontal
and vertical shift from the initial location within a searching
window. For example, the green rectangle in Fig.2 indicates
a reasonable search area. Fig.3 shows the map of correlation
responses for every position within the search window, with
the maximum response denoted by the black circle. The cor-
responding Δx and Δy (in this example, Δx = 9 and Δy =
-26) represent the required translation determined. Fig.2(b)
illustrates the result of this alignment refining process.
3.2. Roof Detection
At this step, we will explore roof edge information from the
imagery. Mean Shift [6], a well known technique for the seg-
mentation of image data based on the inherent color informa-
tion, is utilized to generate an edge map (Fig.5(c)). This is,
by its nature, a pixel-based approach and as such produces a
result in which the mapped edges have no knowledge of be-
longing to a roof outline or its contained features.
(a) Before alignment (a) After alignment
Fig. 2. LiDAR points overlaid on the orthophoto
In order to overcome this fact, the imposition of certain
knowledge-level information on roof detection needs to be ac-
complished. LiDAR data contains elevation values for each
point, so it is natural to make use of such information to
aid in the detection. Fig.4 represents a profile of the three-
dimensional point cloud from a plane perspective illustrating
that the portion of the point cloud above the 180-meter ele-
vation mark (above sea level) could be readily recognized as
the roof. If a multiple-layer elevation filter is employed, more
variant features on the roof can be extracted.
Once the non-rooftop points are filtered out, a reprojected
two-dimensional point map can be further processed to ob-
tain a binary mask. This binary mask can then be utilized
along with the imagery-derived edge map in order to isolate
only those edges that define the roof edge or the contained
features. In order to accomplish this, the point map is con-
volved with a Gaussian spatial filter, producing the result il-
lustrated in Fig.5(a). Fig.5(b) is then generated by threshold-
ing the gray-scale filter response shown in Fig.5(a). The edge
map shown in Fig.5(c) is derived from the orthorectified im-
age data using Mean Shift segmentation method. The edges
belonging to the building roof only are then isolated using the
binary mask, producing the result in Fig.5(d). This process is
represented as
5467

Fig. 3. Correlation map obtained within a searching window
(Δx ∈ [−30, 30] and Δy ∈ [−30, 30])
Fig. 4. Elevation profile of the LIDAR point cloud data col-
lected of the Chester F. Carlson Center for Imaging Science
building on the Rochester Institute of Technology campus,
Rochester, NY, USA
Mbinary = Obinary{Ipoint ∗Gauss(σ)} (2)
Eroof = Eall⋂
Mbinary (3)
where Mbinary is the binary mask, Obinary is the binariza-
tion operator, Ipoint is the discrete roof point map, and Ealland Eroof represent the global edge and the roof edge-only
maps, respectively.
3.3. Roof Description and Refinement
An imagery-derived roof edge map, on its own, is not a suf-
ficient geometric representation of the roof boundary. Due to
the discrete, pixel-based nature of the edge detection process
employed, the number of edges formed between individual
pixels is large. These individual, short length edges, are often
(a) Blurred Point Map (b) Mask Image
(c) Edge Map (d) Roof Edges
Fig. 5. Workflow utilized to isolate the roof and roof feature
edge map from those edges derived from the original gray-
scale image data.
part of a longer, continuous edge feature and should be com-
bined. In order to accomplish this, the binary mask is refined
by applying a morphological “hole-filling” operator and the
response is used as a first approximation of the roof boundary.
The major vertices of this boundary are derived by applying
a recursive Douglas-Peucker (DP) polyline simplification[7].
This simplification process reduces the number of points used
to represent a similar curve. The approximated roof outline is
shown in Fig.6(a)(b). An assumption is made that two ad-
jacent lines, connected by the same vertex, found on a typi-
cal man-made structure will exhibit a significant directional
change. As a result, the number of vertices on any particu-
lar edge, is significantly reduced (c.f. Fig.6(c)). This initially
generated roof boundary, using the refined mask image, gives
a rough estimation of where an edge line should be. The roof
edge map continues to be used as a cue to refine this boundary
further. A localized search area is defined around the current
edge estimate, in which the estimate of the edge position is
adjusted until it reaches its optimal location. The refined re-
sult is shown in Fig.6(d).
4. OTHER RESULTS
In the previous example, only straight lines are detected. Our
method can also be applied to detect and describe the outline
5468

(a) Boundary on Mask (b)Boundary on Image
(c) Vertices Removal (d) Refined Boundary
Fig. 6. Illustration of the workflow used to obtain the final
refined roof top boundary.
of rooftops with round shapes (Fig.7).
5. DISCUSSION
In the presented workflow, registration is done prior to roof
detection. All points, including the roof and the ground, are
taken into account (Fig.2 depicts only a subset of these points
as an illustration). The roof detection step, however, could be
carried out prior to registration. In that case, only points on
the roof are considered during the generation the correlation
map, which does not affect the accuracy of the registration.
While conducting outline refinement, no explicit con-
straint is imposed to force roof corners to meet at a right
angle. Most building edges in our research scene have regular
orientations (e.g. vertical or horizontal directions). So, we
apply a relatively simple refinement to these edges and let the
orientations be vertical or horizontal. In the future, the prin-
ciple direction of an urban layout needs to be determined first
and then this presented refining procedure could be applied.
6. CONCLUSION
In this research, we propose a method to extract roof infor-
mation from both LiDAR data and aerial imagery. LiDAR is
utilized to detect rooftops and help generate rough roof out-
lines. A segmentation method is applied to the imagery to
(a) Rough boundary (b) Refined boundary
Fig. 7. Illustration of the round shape roof description.
form an information rich edge map for the purpose of refining
these outlines. A simple and fast correlation based registra-
tion method is also adopted in this research to fuse LiDAR
and imagery.
7. REFERENCES
[1] Z.W. Kim, A. Huertas, and R. Nevatia, “Automatic de-
scription of buildings with complex rooftops from mul-
tiple images,” in Computer Vision and Pattern Recogni-tion, 2001. Proceedings of the 2001 IEEE Computer So-ciety Conference on. IEEE, 2001, vol. 2, pp. II–272.
[2] V. Verma, R. Kumar, and S. Hsu, “3d building detec-
tion and modeling from aerial lidar data,” in ComputerVision and Pattern Recognition, 2006. Proceedings ofthe 2006 IEEE Computer Society Conference on. IEEE,
2006, vol. 2, pp. 2213–2220.
[3] N. Haala and M. Kada, “An update on automatic 3d build-
ing reconstruction,” ISPRS Journal of Photogrammetryand Remote Sensing, vol. 65, no. 6, pp. 570–580, 2010.
[4] J. Hu, S. You, U. Neumann, and K.K. Park, “Building
modeling from lidar and aerial imagery,” in ASPRS, 2004,
vol. 4, pp. 23–28.
[5] A. Mastin, J. Kepner, and J. Fisher, “Automatic regis-
tration of lidar and optical images of urban scenes,” in
Computer Vision and Pattern Recognition, 2009. Pro-ceedings of the 2009 IEEE Computer Society Conferenceon. IEEE, 2009, pp. 2639–2646.
[6] D. Comaniciu and P. Meer, “Mean shift: A robust ap-
proach toward feature space analysis,” Pattern Analysisand Machine Intelligence, IEEE Transactions on, vol. 24,
no. 5, pp. 603–619, 2002.
[7] D.H. Douglas and T.K. Peucker, “Algorithms for the
reduction of the number of points required to represent
a digitized line or its caricature,” Cartographica: TheInternational Journal for Geographic Information andGeovisualization, vol. 10, no. 2, pp. 112–122, 1973.
5469