A gallery that comes to you_ Little art displays popping up on Toronto streets _ Metro News
Prepared by: Cross County Connection Transportation Management Association
4A Eves DriveSuite 114
Marlton, NJ 08053856-596-8228
www.driveless.com
Complete Streets in NJ: Lessons LearnedMarch 2011

This Cross County Connection Transportation Management Association publication is funded by the New Jersey Department of Transportation and the U.S. Department of Transportation Federal Highway Administration. The Federal Government and the State of New Jersey assume no liability for the contents.
4A Eves DriveSuite 114
Marlton, NJ 08053856-596-8228
www.driveless.com
Cross County Connection TMA was formally incorporated in 1989 through the efforts of
a group of southern New Jersey business leaders, local government officials, and representatives
from the New Jersey Department of Transportation (NJDOT) and New Jersey Transit Corporation
(NJ TRANSIT) to address mobility issues in the region and reduce the number of vehicles on
state and local roadways. Today, Cross County Connection is a non-profit organization, which
partners with NJDOT, NJ TRANSIT, Federal Highway Administration and its members to provide
solutions to complex transportation problems for counties, municipalities, employers and commuters
in our seven-county region.
Complete Streets in NJ: Lessons LearnedMarch 2011

i
Complete Streets in NJ: Lessons Learned
TABLE OF CONTENTSIntroduction
Community Profiles
Common Threads
Motivations
Concerns
Policy Language
Keys to Adoption
Next Steps to Implementation
Funding Sources
Resources
1
2
6
7
9
11
12
13
17
19
ii
Complete Streets in NJ: Lessons Learned
FIGURE
Figure 1: Areas in New Jersey with Complete Streets Policies
Figure 2: Hoboken City, Land Use
Figure 3: Lawrence Township, Land Use
Figure 4: Linwood City, Land Use
Figure 5: Montclair Township, Land Use
Figure 6: West Windsor Township, Land Use
Figure 7: Monmouth County, Land Use
Figure 8: Red Bank Borough, Land Use
Figure 9: Netcong Borough, Land Use
TABLE
Table 1: Hoboken City Population & Land
Table 2: Lawrence Township Population & Land
Table 3: Linwood City, Population & Land
Table 4: Montclair Township, Population & Land
Table 5: West Windsor Township, Population & Land
Table 6: Monmouth County, Population & Land
Table 7: Red Bank Borough, Population & Land
Table 8: Netcong Borough, Population & Land
1
2
3
3
4
4
5
5
6
2
3
3
4
4
5
5
6
1
Complete Streets in NJ: Lessons Learned
Introduction
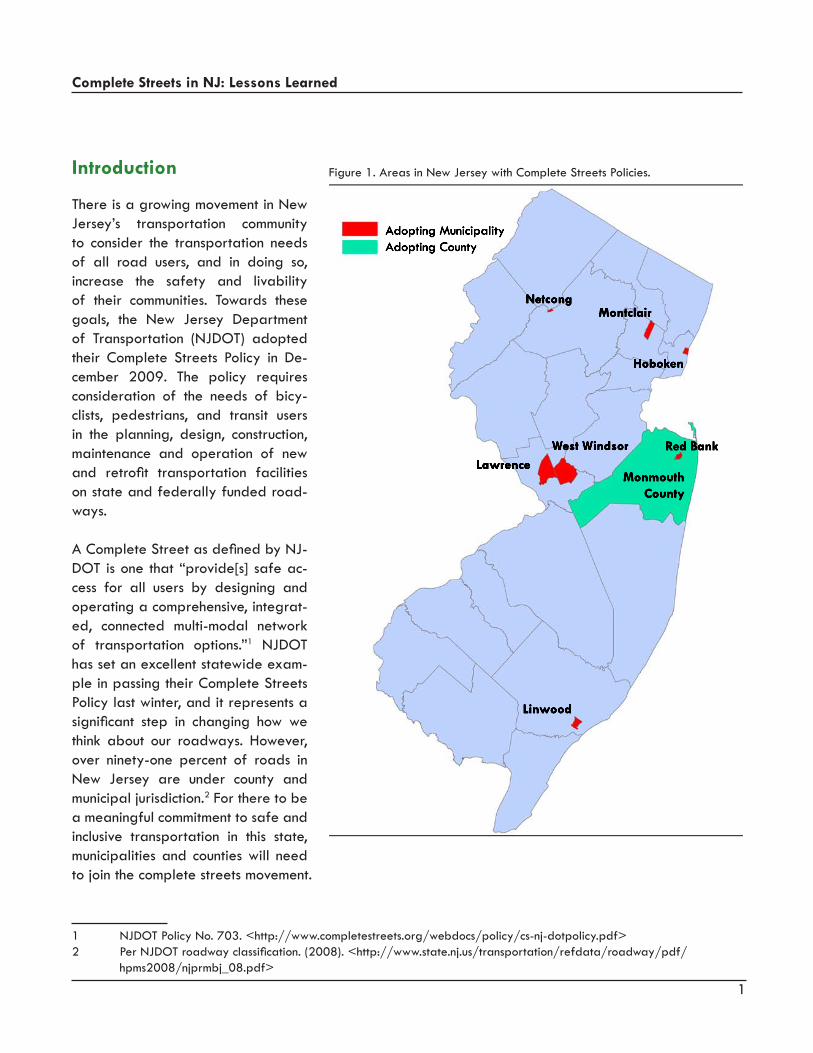
There is a growing movement in New Jersey’s transportation community to consider the transportation needs of all road users, and in doing so, increase the safety and livability of their communities. Towards these goals, the New Jersey Department of Transportation (NJDOT) adopted their Complete Streets Policy in De-cember 2009. The policy requires consideration of the needs of bicy-clists, pedestrians, and transit users in the planning, design, construction, maintenance and operation of new and retrofit transportation facilities on state and federally funded road-ways.
A Complete Street as defined by NJ-DOT is one that “provide[s] safe ac-cess for all users by designing and operating a comprehensive, integrat-ed, connected multi-modal network of transportation options.”1 NJDOT has set an excellent statewide exam-ple in passing their Complete Streets Policy last winter, and it represents a significant step in changing how we think about our roadways. However, over ninety-one percent of roads in New Jersey are under county and municipal jurisdiction.2 For there to be a meaningful commitment to safe and inclusive transportation in this state, municipalities and counties will need to join the complete streets movement.
1 NJDOT Policy No. 703. <http://www.completestreets.org/webdocs/policy/cs-nj-dotpolicy.pdf>2 Per NJDOT roadway classification. (2008). <http://www.state.nj.us/transportation/refdata/roadway/pdf/ hpms2008/njprmbj_08.pdf>
Figure 1. Areas in New Jersey with Complete Streets Policies.
Linwood
Lawrence
West Windsor
NetcongMontclair
Adopting MunicipalityAdopting County
Hoboken
Monmouth County
Red Bank

2
Complete Streets in NJ: Lessons Learned
This resource began as a companion to Cross County Connection’s Safe and Sustainable Transportation in South Jersey workshop held on October 21, 2010, but was expanded to include additional resources. It is meant to assist New Jersey municipalities and counties in adopting complete streets resolutions by draw-ing on the experiences of other areas in New Jersey that have already adopted such policies. Additional strategies are included to assist current and future implementation efforts. The information and experiences of local policy adoption presented in this report are based on published materials and interviews con-ducted with planners, engineers, and others representing Montclair Township, Linwood City, Hoboken City, Lawrence Township, Netcong Borough, Red Bank Borough, West Windsor Township, and Monmouth County about their experiences in adopting these resolutions.
Community ProfilesAt the time of writing, there are seven municipalities and one county in New Jersey that have adopted complete streets policies. Figure 1 shows the locations of these areas throughout the state. All but one of these early adopters have, or are located adjacent to, significant public transit infrastructure, including NJ TRANSIT bus and rail service.
The eight early adopters are a diverse group: one county, and seven municipalities ranging in population from under 3,300 to over 50,000 people, and sized from less than one square mile to 26 square miles. Despite their diversity, these communities share a serious concern for the safety and health of their residents, as well as for the environ-mental and monetary costs of their roads.
Land use maps are included for each municipality to give an indication of the area’s built environment.
Hoboken CityHoboken is a small, but as seen in Figure 2, densely popu-lated city located directly across from New York City on the Hudson River waterfront. The city is served by six NJ TRANSIT rail lines, NJ TRANSIT bus service, NJ TRANSIT Hudson-Bergen Light Rail ser-vice, and PATH subway service with direct access to low-er Manhattan. It is the most urban setting of New Jersey adopting municipalities and also has the highest share of transit commuters with 56% of workers commuting to work using public transportation.3
3 American Community Survey 5-year Estimates, 2005-2009. <www.census.gov>
¬«78
[
Figure 2. Hoboken City, Land Use & Statistics
Population 50,005Area 1.3 sq. mi.Pop. Density 38,465 / sq. mi.
US Census 2010.
Table 1. Hoboken City Population & Land
Data source: NJDEP

3
Complete Streets in NJ: Lessons Learned
Lawrence TownshipLawrence Township is a large suburban community, shown in Figure 3, with a di-verse array of road types and land uses from active farmland, single-family resi-dential development, and village-type commercial centers to the autocentric commercial corridor along heavily traf-ficked U.S. Route 1. Lawrence is served by NJ TRANSIT bus service, and is lo-cated within three miles of the Trenton Transit Center, a terminal for SEPTA Re-gional Rail, RiverLINE Light Rail, and NJ TRANSIT Northeast Corridor rail service; and the Hamilton Station on NJ TRAN-SIT’s Northeast Corridor. The township has several major arterial roads includ-ing U.S. Route 1, Interstate 95/295, and U.S. Route 206. Nearly 6% of workers commute by transit.
Linwood CityLinwood City, shown in Figure 4, is a small municipality located near the Atlantic County shore that is largely dominated by single-family housing. U.S. Route 9 travels through the western portion of the city, while a bike path runs the en-tire length of Linwood parallel to Route 9 and extends to adjacent municipalities.
§̈¦295
£¤1
£¤130
£¤206
¬«31
[
Figure 3. Lawrence Township, Land Use & Statistics
Population 31,528Area 22.1 sq. mi.Pop. Density 1,427 / sq. mi.
ACS Estimate 2005-2009.
£¤9
¬«152 [
Population 7,256Area 3.8 sq. mi.Pop. Density 1,909 / sq. mi.
ACS Estimate 2005-2009.
Figure 4. Linwood City, Land Use & Statistics
Table 2. Lawrence Township Population & Land
Table 3. Linwood City Population & LandData source: NJDEP
Data source: NJDEP
4
Complete Streets in NJ: Lessons Learned
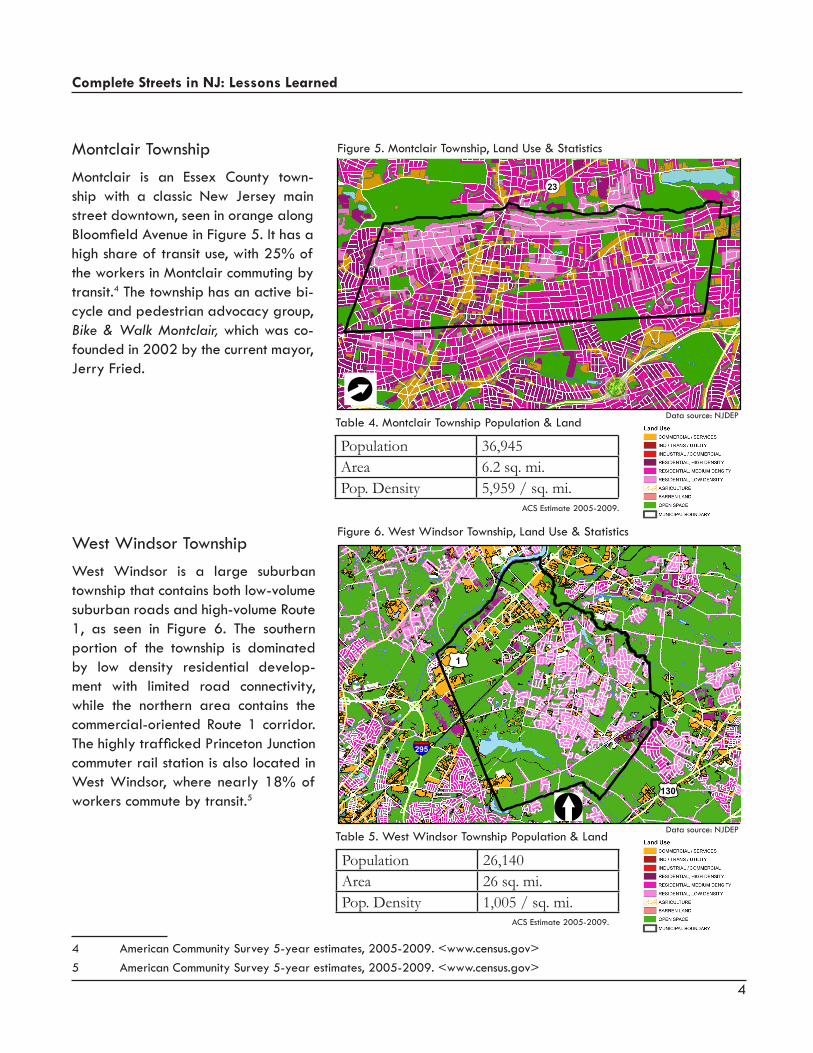
Montclair TownshipMontclair is an Essex County town-ship with a classic New Jersey main street downtown, seen in orange along Bloomfield Avenue in Figure 5. It has a high share of transit use, with 25% of the workers in Montclair commuting by transit.4 The township has an active bi-cycle and pedestrian advocacy group, Bike & Walk Montclair, which was co-founded in 2002 by the current mayor, Jerry Fried.
West Windsor TownshipWest Windsor is a large suburban township that contains both low-volume suburban roads and high-volume Route 1, as seen in Figure 6. The southern portion of the township is dominated by low density residential develop-ment with limited road connectivity, while the northern area contains the commercial-oriented Route 1 corridor. The highly trafficked Princeton Junction commuter rail station is also located in West Windsor, where nearly 18% of workers commute by transit.5
4 American Community Survey 5-year estimates, 2005-2009. <www.census.gov>5 American Community Survey 5-year estimates, 2005-2009. <www.census.gov>
¬«23
[
Figure 5. Montclair Township, Land Use & Statistics
Population 36,945Area 6.2 sq. mi.Pop. Density 5,959 / sq. mi.
ACS Estimate 2005-2009.
§̈¦295
£¤1
£¤130
[
Figure 6. West Windsor Township, Land Use & Statistics
Population 26,140Area 26 sq. mi.Pop. Density 1,005 / sq. mi.
ACS Estimate 2005-2009.
Table 4. Montclair Township Population & Land
Table 5. West Windsor Township Population & Land
Data source: NJDEP
Data source: NJDEP

5
Complete Streets in NJ: Lessons Learned
Monmouth CountyMonmouth County is located on New Jersey’s northern shore, and covers a range of landscapes from shore towns to rural areas. General statistics can be seen in Figure 7. NJ TRANSIT’s North Jersey Coast Line provides ser-vice from fourteen stations in Mon-mouth County into Hoboken and New York Penn Station.
Red Bank BoroughRed Bank, located in Monmouth County, has a vibrant cultural and arts commu-nity and a vital downtown. The borough is dominated by both commercial retail and medium to high density residential land uses, evident in Figure 8. Nearly 12% of commuters use transit to travel to work while over 10% walk to work.6
6 U.S. Census, 2000. <www.census.gov>
¬«35
[
Figure 8. Red Bank Borough, Land Use & Statistics
§̈¦195£¤9
£¤130
£¤206
§̈¦95
£¤1
Land UseGREEN SPACE
URBAN
WATER
¬«34
[
¬«33
¬«35
¬«18
Population 641,984Area 472 sq. mi.Pop. Density 1,360 / sq. mi.
ACS Estimate 2005-2009.
Figure 7. Monmouth County, Land Use & Statistics
Population 11,922Area 1.8 sq. mi.Pop. Density 6,623 / sq. mi.
ACS Estimate 2005-2009.
Table 7. Red Bank Borough Population & Land
Table 6. Monmouth County Population & LandData source: NJDEP
Data source: NJDEP

6
Complete Streets in NJ: Lessons Learned
Netcong BoroughNetcong is a small, walkable commu-nity in Morris County characterized by single family housing, a small com-mercial corridor which can be seen in Figure 9, and a rail station. The station is served by NJ TRANSIT’s Morristown and Montclair-Boonton lines, though the share of commute trips by transit is minimal.7
Common ThreadsA common thread between these early adopters is a well-organized, informed, and very vocal constituency. Existing citizen groups like the West Windsor Bicycle and Pedestrian Alliance and Bike & Walk Montclair were organized well before adoption of complete streets policies, and in both cases helped drive safety improvements in West Windsor and Montclair, respectively. These groups worked collaboratively with the Townships in directing transportation improvements through consistent contact with municipal engineering and planning staff, and town councils.
Other organizations like the Monmouth County Transportation Council, Linwood Environmental Commission, Sustainable Lawrence and the Netcong Green Team–which both pursued a complete streets resolution in part because of Sustainable Jersey certification, and Safe Routes to School groups were formed in part-nership with government staff. Many early supporters of complete streets, including public staff, attended complete streets education and training events and listed these education efforts as an integral catalyst to increased buy-in and passage of their complete streets policy. These groups have been key players in closely examining safety issues in their areas, and generating the political and public support to begin to address them.
These areas have begun to turn their attention to the long-term health, both physical and fiscal, of their communities. They have begun to ask themselves:
7 American Community Survey 5-year estimates, 2005-2009. <www.census.gov>.
¬«183
£¤80
[
Figure 9. Netcong Borough, Land Use & Statistics
Population 3,241Area 0.8 sq. mi.Pop. Density 4,051 / sq. mi.
ACS Estimate 2005-2009.
Table 8. Netcong Borough Population & LandData source: NJDEP
7
Complete Streets in NJ: Lessons Learned
“What do we want our community to look like?”
“How are residents going to get around? Energy prices continue to rise, traffic congestion contin-ues to be a concern, and our senior population is increasing.”
“What do we value?”
MotivationsThese early adopters identified several motivating factors in why they chose to pursue adoption of complete streets policies. Safety of their residents was the highest priority. In particular, they men-tioned the safety of vulnerable populations like schoolchildren, seniors, pedestrians, and bicyclists. Several of these municipalities and the County expressed concern about the future costs of not having a complete streets policy in place. Another important factor mentioned consistently was improving the quality of life afforded to their residents. They were interested in providing amenities, reducing congestion and environmental impacts, and increasing the attractiveness of their community.
Future Costs
Costs are a concern now more than ever as state and local governments face shrinking budgets. Some early adopters identified complete streets policies as a way to potentially reduce future ex-penditures. As development has slowed, it has given these areas the opportunity to shift some of the costs of safety and accessibility improvements to developers if and when development activity resumes. These early adopters wanted to have a complete streets policy in place so that it would be incorporated into their development review process as projects began moving forward. Netcong for instance noted that they have two designated redevelopment zones, and while there was currently little interest in the sites, they wanted the policy in place when development did occur. These areas were proactive in their approach to land use and transportation.
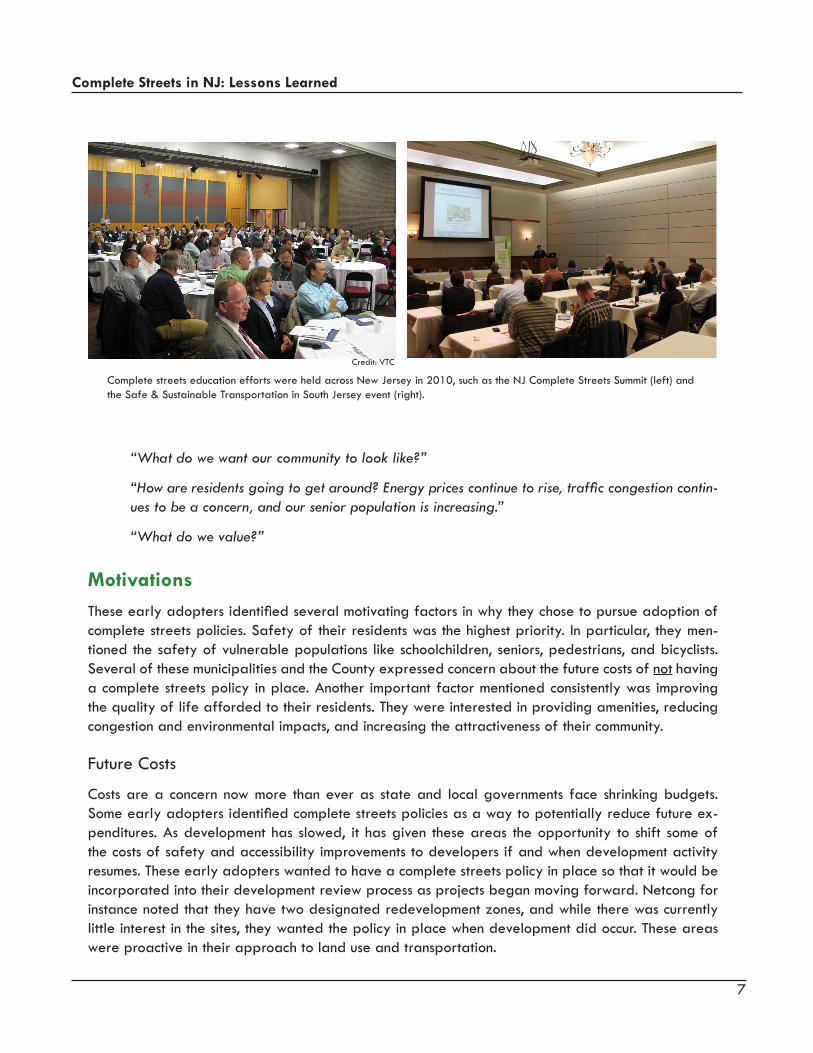
Complete streets education efforts were held across New Jersey in 2010, such as the NJ Complete Streets Summit (left) and the Safe & Sustainable Transportation in South Jersey event (right).
Credit: VTC
8
Complete Streets in NJ: Lessons Learned
In addition, safety improvements are much less expensive when included as a part of road construc-tion and maintenance procedures rather than the ad hoc retrofits. Like the adage “measure twice, cut once,” taking a comprehensive view of an area’s transportation needs can yield significant savings in the long term. The downturn in development activity is an opportunity for municipalities and counties to update policies and regulations to reflect the vision they have for their communities today, not the vision of twenty years ago that has created a congested and dangerous landscape in much of the state.
Having a complete streets policy in place as a favorable element in transportation funding requests was also a consideration for several municipalities. While there is not yet any explicit weighting of complete streets policies in the NJDOT funding application review process, “the Department strongly encourages the adoption of similar policies by regional and local jurisdictions who apply for funding through Local Aid programs.”8 Having such a policy in place can only benefit a grant application. There are indications that both NJDOT and New Jersey MPO’s are considering modifications favor-ing complete streets to funding selection criteria in the near future.
Monmouth County and Netcong voiced concerns about the costs of school bussing. In many areas of the state, bussing is a necessity because the walking conditions around schools are hazardous. Due to budget constraints, many towns have been forced to cut or eliminate courtesy bussing, increas-ing the number of cars driving to the school and creating even more traffic congestion as a conse-quence. Several of these communities, often along with local Safe Routes to School committees, see complete streets as a way to reduce dependency on bussing. Making sure children have safe walking environments is important for many reasons: pre-venting accidents, ensuring that communities raise healthy, active children, but also to help make sure that school-funded transportation is not the only option for children to get to school.
The future cost of healthcare for inactive residents was not mentioned by these early adopters, but should certainly be a concern when considering implementing complete streets.
Safety
Regardless of whether the most trafficked road had 12,000 or 77,000 annual average daily traf-
8 NJDOT. (2009). Complete Streets Policy. < http://www.completestreets.org/webdocs/policy/cs-nj-dotpolicy. pdf>
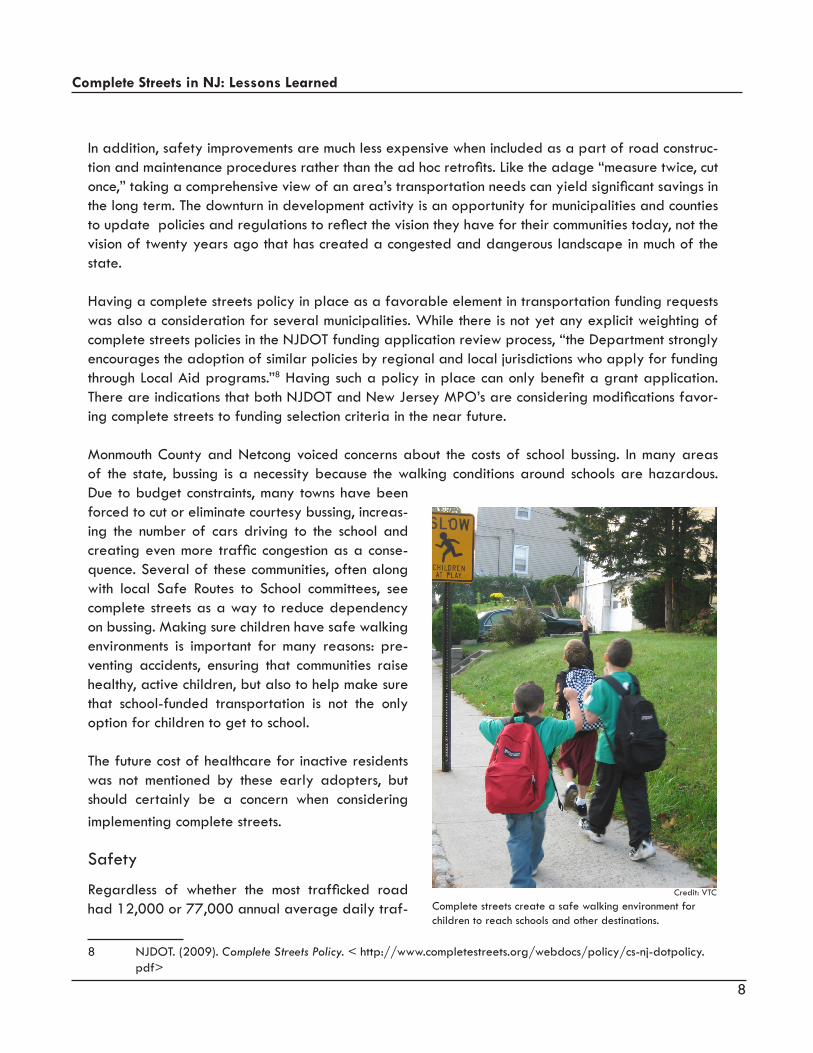
Credit: VTC
Complete streets create a safe walking environment for children to reach schools and other destinations.

9
Complete Streets in NJ: Lessons Learned
fic, every municipality was concerned about the safety of roads in their jurisdiction.9 Safety of school-children was again a particular focus. Often programs focusing on child walking safety were already in place, like Netcong’s “Walk & Roll” program which arranges designated walk-to-school days each month, and the federal Safe Routes to School program which has active committees in these areas and around the state. At the NJ Complete Streets Summit held by NJDOT and the Alan M. Voorhees Transportation Center, Ian Sacs, the Director of Transportation and Parking for Hoboken, pointed to New York City Department of Transportation’s finding that “controlling for other factors, pedestrian KSI [killed or severely injured] crashes on streets with bike lanes were ~40% less deadly as other streets [in Manhattan].”10
Other Factors
Environmental considerations such as reducing vehicle emissions and promoting sustainable transpor-tation options like biking and walking were mentioned by each of the early adopters. In this respect, complete streets are a component of the larger movement towards sustainable transportation and away from the autocentric paradigm that has been dominant in New Jersey transportation. Previous to the passing of Lawrence Township’s complete streets ordinance, the Township adopted a Sustain-ability Element to their Master Plan which specifically called for complete streets in Lawrence.11 By improving pedestrian and bicycle infrastructure, these areas are likely to increase the use of bicycles and walking for short trips and significantly reduce local greenhouse gas emissions.
Linwood City representatives mentioned the desire to provide additional links to their existing bi-cycle infrastructure. Lawrence, Linwood, and West Windsor each have significant pieces in their bicycle network such as the Lawrence Hopewell Trail and Linwood Bicycle Path that may be better used through implementation of complete streets. Increasing the access to community amenities such as parks and bicycle facilities will only add value to these community investments and increase the desirability of the area.
An additional issue mentioned was increasing the inclusiveness of the local transportation system. Complete streets help ensure that residents have the choice to walk or bike to a variety of recre-ational and commercial destinations. Whether it is someone that wants to exercise, someone that does not or cannot drive, or someone that wants to get out into their community, complete streets allow them to do so safely. There is a tendency to forget those people that are unable or do not want to drive to get to their destination, but it is often those people who are injured and killed on our roads as pedestrians and bicyclists. Complete streets are inclusive by design, and can make a substantial and potentially life-saving difference in the lives of those people while also making an area more attractive.
9 Per NJDOT traffic counts. (2008). <http://www.state.nj.us/transportation/refdata/roadway/traffic_counts/>10 New York City Department of Transportation. (2010). The New York City Pedestrian Safety Study & Action Plan. <http://www.nyc.gov/html/dot/downloads/pdf/nyc_ped_safety_study_action_plan.pdf> 11 Clark Caton Hintz. (2010). The Green Buildings and Environmental Sustainability Element of the Master Plan, Lawrence Township, NJ. <http://www.lawrencetwp.com/documents/planning/Lawrence%20Sustainabil ity%20Element.pdf>
10
Complete Streets in NJ: Lessons Learned
Economic development and revitalization associated with complete streets was an-other a motivating factor. Creating walk-able and bikeable areas can increase foot traffic to businesses and retail areas, and help revitalize main streets in New Jer-sey. Studies from around the country have shown that creating safer, more walkable communities improves property values and is a benefit to business.1213
West Windsor and Netcong mentioned that their complete streets resolution was in part an effort to reduce the parking needs. West Windsor has experience significant parking demand increases due to Princeton Junction rail station commuters. When pedestrian and bicycle travel is made more safe and attractive through complete streets, parking demand will likely be reduced as residents decide to walk or bike to nearby destina-tions rather than drive.
ConcernsSome common concerns with complete streets policies and bicycle/pedestrian in-frastructure in general are costs and liabil-ity. The liability concerns have been limited mainly to bikeways, but it is a common stumbling block that has also come up outside of complete streets policies.
Costs
For these early adopters, cost was often a major concern when considering their complete streets resolutions. However, some of these areas remarked that the costs to date associated with complete streets improvements has not been a significant issue. Making streets safer by design does not nec-essarily have to be expensive. Paint and signage can be very effective before moving on to more expensive brick and mortar improvements. Several adopters saw long-term cost savings in complete streets through reducing expensive ad hoc retrofits and cost shifts to developers.
12 Cortright, Joe. (2009). Walking the Walk: How Walkability Raises Home Values in U.S. Cities. Impresa, Inc., for CEOs for Cities. <http://www.ceosforcities.org/pagefiles/WalkingTheWalk_CEOsforCities.pdf>13 The National Complete Streets Coalition. The Benefits of Complete Streets 7. <http://www.completestreets. org/webdocs/factsheets/cs-revitalize.pdf>
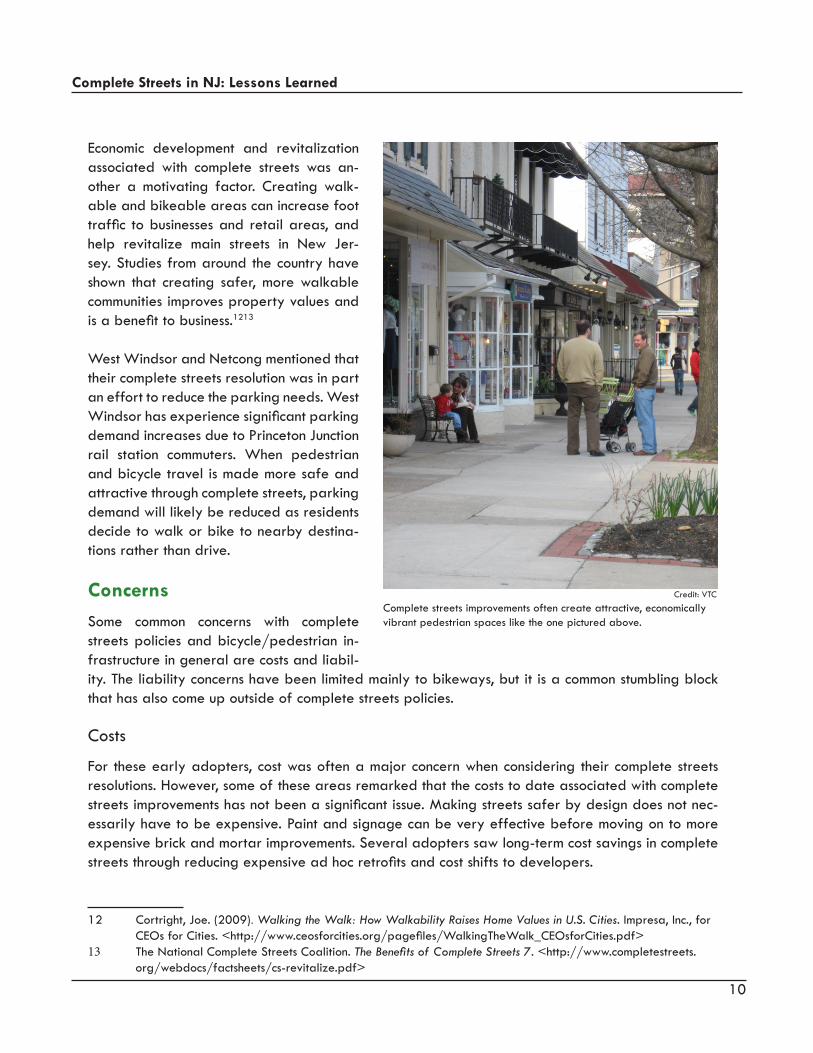
Credit: VTC
Complete streets improvements often create attractive, economically vibrant pedestrian spaces like the one pictured above.
11
Complete Streets in NJ: Lessons Learned
Costs will vary greatly depending on community characteristics and context-specific issues. How and when an area is built out, street width, speed limits, intersection layouts are all going to be factors in determining what treatments will be most effective. West Windsor Township, for example, is a subur-ban community with transit and highway access that saw much of its development in the 1980s. The township has many wide right-of-ways that allow them to install bike lanes and traffic calming mea-sures fairly easily in many places. However, as they move forward with their bicycle and pedestrian improvements, the Township is now having to face more difficult and expensive projects after picking the low hanging fruit. These more difficult situations require some creativity and local judgment to realize success. Implementing complete streets often comes down to local judgment, flexibility and creative solutions.
Liability
Liability was not a consistent concern among the early adopters regarding complete streets policy adoption, however Montclair did have to address some concerns which remain unresolved. Tort claims for negligent design of bikeways are reported to be rare across the country. Nationally, most of the claims are based on alleged maintenance issues, and public entities prevailed in nearly all cases.14 New Jersey’s design immunity statute provides perpetual immunity for a public entity or employee on injuries caused by the plan or design of public property, as long as the representative of that public entity is exercising discretionary authority.15 New Jersey also has a recreational use statute which limits liability for bikeways.16 Facilities should be designed to applicable standards (e.g. AASHTO, MUTCD, ITE) or approved by the proper government entities such as NJDOT or the county engineer. Provisions for maintenance must also be made, however this requirement makes no differ-ence if the area was a shoulder or a bicycle lane.17
In short, New Jersey has fairly strong statutory insulation protecting public entities from liability. Con-sidering the liability impacts of not providing safe facilities for bicyclists and pedestrians should also be taken into account when deciding on safety improvements.
Policy LanguageThe specific language of the adopted resolutions all share similar considerations as the NJDOT policy, though there are some significant differences among them. Each features a commitment to creating a comprehensive, integrated, connected street network that safely accommodates all road users of all abilities for all trips. A compilation of New Jersey state, county, and municipal policies has been made by the Alan M. Voorhees Transportation Center, and is available at the New Jersey Bicycle
14 Larry W. Thomas and James B. McDaniel. (2010). NCHRP Legal Research Digest 53 “Liability Aspects of Bike- ways.” <http://www.bikeleague.org/programs/bicyclefriendlyamerica/communities/pdfs/nchrp_liabil ity_aspects_of_bikeways.pdf>15 N.J. S.A., tit. 59:4-616 N.J. S.A. tit. 2A:42A-2, et seq.17 Alan M. Voorhees Transportation Center. (2011). NJ Complete Streets Summit Summary Report. <http:// policy.rutgers.edu/vtc/bikeped/completestreets/Final%20Complete%20Streets%20Summary%20Report. pdf>

12
Complete Streets in NJ: Lessons Learned
and Pedestrian Resource Center.18
Exemption cases can be a contentious issue when considering complete streets policies. An exemp-tion case outlines when a project may be exempt from considering complete streets improvements. A policy should not just pay lip service to bicycle and pedestrian safety while doing very little to impact street design. However, a policy should also not be so inflexible and unrealistic that it becomes unworkable in application. Striking the balance that reflects complete streets values and outcomes while also being flexible enough to produce implementable solutions is a real key to having a suc-cessful complete streets policy. An example of exemption cases shared by NJDOT, Monmouth County, and Red Bank are listed below:
NJDOT Exemptions: 1) Non-motorized users are prohibited on the roadway.
2) Scarcity of population, travel and attractors, both existing and future, indicate an absence of need for such accommodations. 3) Detrimental environmental or social impacts outweigh the need for these accommodations. 4) Cost of accommodations is excessively disproportionate to cost of project, more than twenty percent (20%) of total cost. 5) The safety or timing of a project is compromised by the inclusion of Complete Streets.
The exemption cases run from straightforward, such as exempting roads that do not permit non-motorized vehicles, to case-specific and subjective concerns like the scarcity of present and future population, travel, and attractors; adverse environmental and social impacts that might outweigh the improvements; and the safety or timing of the project. Depending on the policy and how clear the exemption case, supporting evidence is required. Similar to NJDOT, Hoboken, Netcong, Monmouth County, and Red Bank require supporting evidence of the exception to be submitted to the county en-gineer, mayor, or council for approval. Requiring high-level approval for exceptions is recommended.
An exemption that can be particularly contentious is the cost exemption. NJDOT’s policy extends an exemption when safety accommodations amount to more than 20% of the total project cost. Mont-clair lists in its exemptions that bicycle, pedestrian, or transit improvements that would increase lo-cally funded project costs by more than 5% need council approval prior to bidding. For Montclair, the cost exemption was a serious stumbling block, and an important negotiating tool to make their complete streets policy politically feasible. Monmouth County, Red Bank, and Netcong all use the phrase “excessively disproportionate” to guide their cost exemption. Hoboken set its cost threshold at an increase of 15% in total for pedestrian, public transit, and/or bicycle facilities, as determined by engineering estimates, that would have to be funded with local tax dollars.
The resolutions passed in Montclair, Netcong, Lawrence, Hoboken, and West Windsor did not include the provision that: “in rural areas, paved shoulders or a multi-use path shall be included in all new construction and reconstruction projects on roadways used my more than 1,000 vehicles per day,”
18 Alan M. Voorhees Transportation Center. (2010). Complete Streets in New Jersey: A Compilation of State, County and Municipal Policies. <http://policy.rutgers.edu/vtc/bikeped/completestreets/policies. php>

13
Complete Streets in NJ: Lessons Learned
which is included in the NJDOT, Monmouth County, and Red Bank policies. While this provision is not particularly important to urbanized areas, it is very appropriate to many areas in South Jersey. The picture of a rural complete street can be quite different from an urban complete street, and it is important to pay attention to the treatment of rural roads in policy language since so many roads in New Jersey are rural.
Keys to AdoptionSeveral common themes are apparent in speaking to municipal and county staff about keys to adopting their complete streets policy: educating local leaders, staff, and residents on what com-plete streets are, what they are not, and how they can change a community; focusing on the safety benefits and value of the policy; consideration of the policy’s timing; and perseverance in addressing concerns, passing, and implementing complete streets.
A complete streets policy is a set of values, not a set of rigid design standards. It is a commitment
Credit: bikepedimages.org / Jennifer Campos
Credit: bikepedimages.org / Laura SandtCredit: bikepedimages.org / Bob Byce
There is no one picture of a complete street. Each complete street pictured above offers very different amenities to ensure the safety of road users.
14
Complete Streets in NJ: Lessons Learned
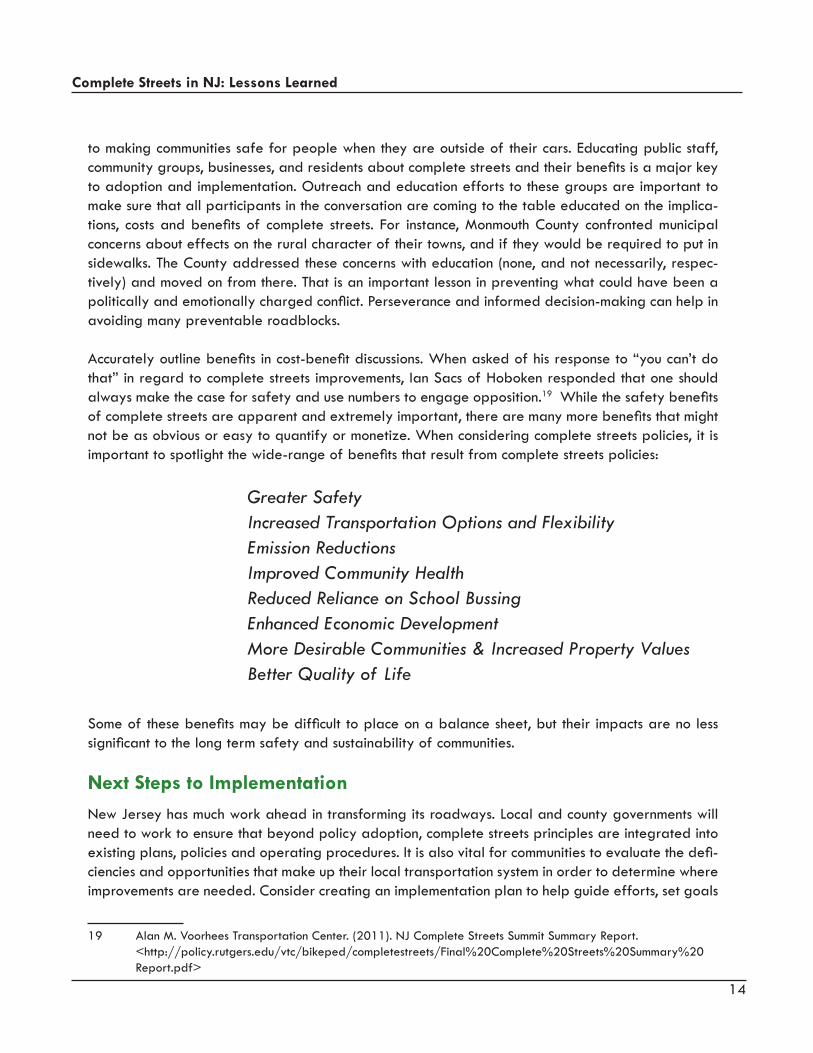
to making communities safe for people when they are outside of their cars. Educating public staff, community groups, businesses, and residents about complete streets and their benefits is a major key to adoption and implementation. Outreach and education efforts to these groups are important to make sure that all participants in the conversation are coming to the table educated on the implica-tions, costs and benefits of complete streets. For instance, Monmouth County confronted municipal concerns about effects on the rural character of their towns, and if they would be required to put in sidewalks. The County addressed these concerns with education (none, and not necessarily, respec-tively) and moved on from there. That is an important lesson in preventing what could have been a politically and emotionally charged conflict. Perseverance and informed decision-making can help in avoiding many preventable roadblocks.
Accurately outline benefits in cost-benefit discussions. When asked of his response to “you can’t do that” in regard to complete streets improvements, Ian Sacs of Hoboken responded that one should always make the case for safety and use numbers to engage opposition.19 While the safety benefits of complete streets are apparent and extremely important, there are many more benefits that might not be as obvious or easy to quantify or monetize. When considering complete streets policies, it is important to spotlight the wide-range of benefits that result from complete streets policies:
Greater SafetyIncreased Transportation Options and FlexibilityEmission ReductionsImproved Community HealthReduced Reliance on School BussingEnhanced Economic DevelopmentMore Desirable Communities & Increased Property ValuesBetter Quality of Life
Some of these benefits may be difficult to place on a balance sheet, but their impacts are no less significant to the long term safety and sustainability of communities.
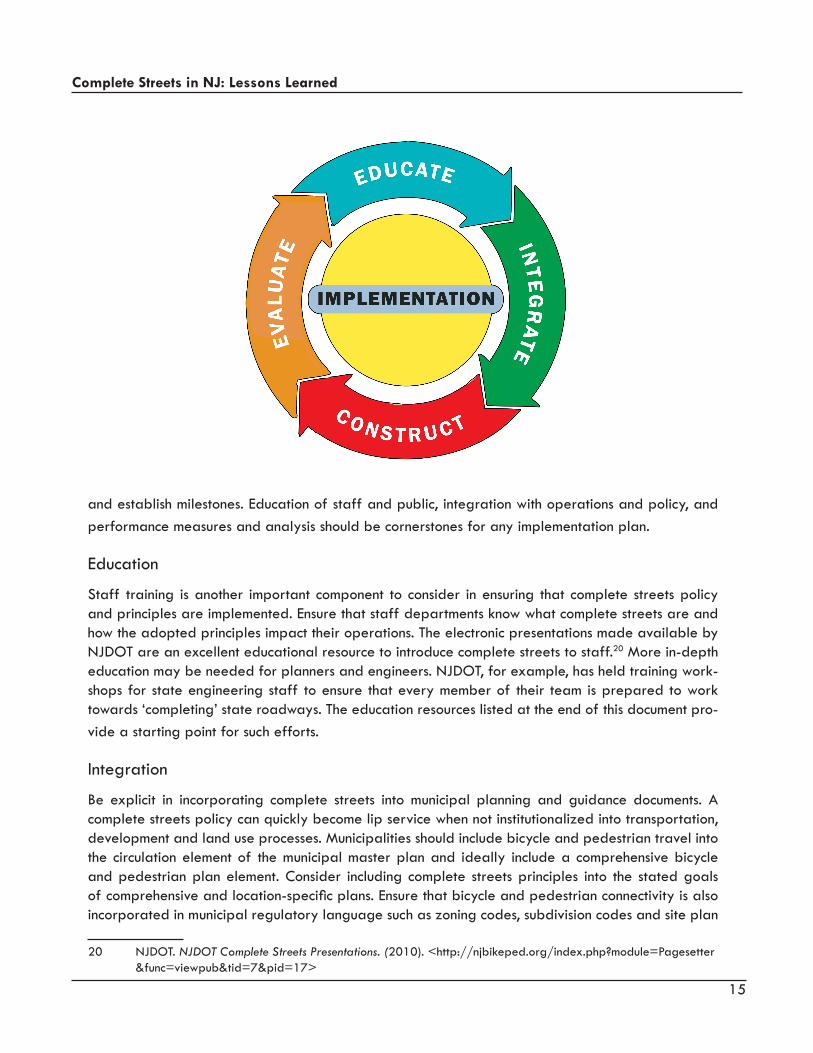
Next Steps to ImplementationNew Jersey has much work ahead in transforming its roadways. Local and county governments will need to work to ensure that beyond policy adoption, complete streets principles are integrated into existing plans, policies and operating procedures. It is also vital for communities to evaluate the defi-ciencies and opportunities that make up their local transportation system in order to determine where improvements are needed. Consider creating an implementation plan to help guide efforts, set goals
19 Alan M. Voorhees Transportation Center. (2011). NJ Complete Streets Summit Summary Report. <http://policy.rutgers.edu/vtc/bikeped/completestreets/Final%20Complete%20Streets%20Summary%20 Report.pdf>
15
Complete Streets in NJ: Lessons Learned
and establish milestones. Education of staff and public, integration with operations and policy, and performance measures and analysis should be cornerstones for any implementation plan.
Education
Staff training is another important component to consider in ensuring that complete streets policy and principles are implemented. Ensure that staff departments know what complete streets are and how the adopted principles impact their operations. The electronic presentations made available by NJDOT are an excellent educational resource to introduce complete streets to staff.20 More in-depth education may be needed for planners and engineers. NJDOT, for example, has held training work-shops for state engineering staff to ensure that every member of their team is prepared to work towards ‘completing’ state roadways. The education resources listed at the end of this document pro-vide a starting point for such efforts.
Integration
Be explicit in incorporating complete streets into municipal planning and guidance documents. A complete streets policy can quickly become lip service when not institutionalized into transportation, development and land use processes. Municipalities should include bicycle and pedestrian travel into the circulation element of the municipal master plan and ideally include a comprehensive bicycle and pedestrian plan element. Consider including complete streets principles into the stated goals of comprehensive and location-specific plans. Ensure that bicycle and pedestrian connectivity is also incorporated in municipal regulatory language such as zoning codes, subdivision codes and site plan
20 NJDOT. NJDOT Complete Streets Presentations. (2010). <http://njbikeped.org/index.php?module=Pagesetter &func=viewpub&tid=7&pid=17>

16
Complete Streets in NJ: Lessons Learned
requirements.
For example, subdivision codes in much of southern New Jersey encourage the development of street networks that “discourage through traffic and provide for maximum privacy.”21 When not coupled with provisions for bicycle and pe-destrian accommodations, these requirements reduce the connectiv-ity of road networks and increase travel distances for walking and biking. Often it is merely a matter of modifying guiding provisions of planning and regulatory proce-dures that can yield the most suc-cessful results. Strive to institutional-ize safety provisions for all modes of transportation by taking a stra-tegic look at municipal and county operations, and exploring modifi-cations that will pave the way for complete streets.
Checklists
Consider creating a complete streets checklist for use in project review, corridor evaluation and studies. A common criticism of complete streets policies is their lack of integration in planning and review processes and the perception that bicycle and pedestrian consid-erations are optional, not included as routine accommodation. A checklist will help ensure that bicycle and pedestrian safety is consistently considered, and will direct attention to design and regulatory concerns in a simple, straightforward manner. Both Monmouth County and Red Bank policies call for the creation of a checklist of pedestrian, bicycle, and transit accommodations that should be consid-ered in each project. Beyond a list of accommodations, elements in such a checklist should include these considerations:
Existing Conditions
What pedestrian and bicycle accommodations are located in and around the project area, such as bikeways, bicycle lanes, sidewalks, crosswalks, pedestrian lighting, etc.? What obstacles to bicycle and pedestrian travel are present in the area? What deficiencies could be addressed with this project? Where are transportation conflicts and bicycle/pedestrian collisions occurring?
Current and Future Demand
What existing and future trip generators are in and around the project area? Do any of these
21 Evesham Township, New Jersey, Municipal Code art. III, §62-9
Credit: bikepedimages.org / Bill Daly
Creation of complete streets facilities like the one pictured above are due in part to checklists like the San Francisco Bay Area’s Metropolitan Transportation Commission Complete Streets Checklist.
17
Complete Streets in NJ: Lessons Learned
generators justify consideration of special safety treatments such as “safety zones” with reduced speeds and traffic calming?
Plans, Policies, Guidelines
What plans have been adopted which include bicycle, pedestrian, transportation, land use, rec-reation or safety components that apply to part or all of the project area? Does the project fulfill these plans? What local, county, state or federal policies exist pertaining to the design and inclu-sion bicycle and pedestrian facilities? Have these policies and design guidelines been followed?
Project Impacts
What impacts are anticipated in the project area on travel behavior and safety for pedestrian and bicycle travel? Elements that may negatively impact bicycle and pedestrian safety include increased vehicle volumes, greater vehicle speeds, increased turning movements/speeds, narrow-ing of shoulders, longer pedestrian crossing distances, and removal of bicycle and pedestrian facilities, among others. Does the project include bicycle and pedestrian facilities that improve the quality and safety of travel? If bicycle and pedestrian facilities are not included or the proj-ect would negatively impact bicycle and/or pedestrian travel, provide justification on why the project is being proposed as designed.
Opportunities
Are there opportunities to improve the bicycle- and pedestrian-friendliness of the project area that have not been considered? Does the area have adequately timed and placed signals for pedestrian crossings? Are there a surplus of curb cuts that can be reduced for safety? Is there adequate pedestrian lighting to make walking safe and attractive? Should lane widths and con-figuration be reexamined for retrofitting of bicycle lanes? Research is mounting that narrowing streets (<12 ft. lane width) increases crossing safety and allows for installation of bicycle travel facilities without necessarily increasing vehicle crash frequencies.2223
Construction Accommodations
What provisions will be made to maintain pedestrian and bicycle access during project construc-tion?
Maintenance
Who is responsible for maintenance of bicycle and pedestrian facilities in the project area? How will maintenance for these facilities be integrated into existing maintenance plans?
The Pennsylvania Department of Transportation, Mid-Ohio Regional Planning Commission, and the San Francisco Bay Area’s Metropolitan Transportation Commission have each created complete
22 Ingrid B. Potts, Douglas W. Harwood, Karen R. Richard. Transportation Research Board. (2007). Relationship of Lane Width to Safety for Suburban Arterials. < http://www.completestreets.org/webdocs/resources/lane- width-safety.pdf>23 Harwood, D.W. Transportation Research Board. (1990). NCHRP Report 330 Effective Utilization of Street Width on Urban Arterials. <http://pubsindex.trb.org/view.aspx?id=312924>
18
Complete Streets in NJ: Lessons Learned
streets checklists that have informed the elements listed above and are included in the resources sec-tion at the end of this document.
Measure Progress
Establishing goals and measuring performance are important factors in implementing complete streets policies. While it is important to establish the vision for a community through goal statements in a complete streets policy, it is extremely valuable to establish measures to evaluate performance. Establishing these performance measures can help spur action and direct efforts to physical results while providing benchmarks of progress. Goals and performance measures may also improve the competitiveness of county and local grant applications for state and federal funding by demonstrat-ing a comprehensive, measurable commitment to sustainable transportation.
Performance measures for complete streets may be based on the number of facilities or amenities installed, consistent evaluation criteria of infrastructure such as level of service, or outcome indicators related to facility usage and travel behavior.
Facility-Based Measures
Roanoke, Virginia for example, has established performance measures as total miles of on-street bicycle routes, linear feet of new pedestrian accommodations, and number of street trees and curb ramps installed.24 An advantage to facility-based performance measures is that they are simple to report, however they do not account for the placement or usage of these facilities.
Infrastructure Evaluation Measures
Traditionally, level of service measures have been associated with automobile facilities, but mul-timodal level of service indicators have recently been established that may be used to evaluate the ‘completeness’ of streets and measure progress using consistent criteria. Criteria have been published by the Transportation Research Board, the Florida Department of Transportation, and developed locally in Charlotte, North Carolina with much success. The evaluations developed by each use a number of factors such as motorized vehicle volumes, speeds, width of outside thru lanes, number of unsignalized conflicts, the presence of sidewalks or bicycle lanes, intersection characteristics, and pedestrian buffer areas. These models are straightforward in their applica-tion and have been included in the resources section of this document.
Outcome Measures
Policy implementation may also be measured through performance outcomes. These outcomes could be assessed by direct facility usage such as pedestrian and bicycle counts, or through indirect measures including surveys and trends observed in American Community Survey-based transportation demographic estimates. Some public organizations, such as the Delaware Valley Regional Planning Commission, periodically perform bicycle and pedestrian counts and may be
24 City of Roanoke. (2008). City of Roanoke Complete Streets Policy. <http://www.rvarc.org/bike/Roa nokeCompleteStreetsPolicy.pdf>
19
Complete Streets in NJ: Lessons Learned
able to provide assistance. These counts may also be performed at low cost by partnering with community groups and volunteers. A health-related indicator that municipalities might also inves-tigate is a health impact assessment (HIA). HIA’s objectively evaluate the potential health effects of a project before it is built, and are being used increasingly at federal agencies. They may be performed by volunteers or consultants.
Municipalities and counties should select the performance measures that best fit their area and ca-pabilities.
Funding SourcesFunding for complete streets implementation is project-dependent and will likely come from a vari-ety of different places, including municipal and county sources. Since complete streets improvements are often embedded in maintenance, reconstruction and development projects the costs may be in-cluded in an existing maintenance plan or project’s scope and funded by the project’s funding source. However, there are several potential funding sources beyond local funds for bicycle and pedestrian safety projects.
State programs that may provide funding for projects creating complete streets include:
NJDOT Municipal and County AidNJDOT Bikeways Grant ProgramNJDOT Local Technical Assistance PlanningNJDOT Safe Streets to Transit ProgramNJDOT Centers of Place Grant ProgramNJDOT Transit Village Grant ProgramNJDOT Local Aid Infrastructure Funds
NJ Department of Environmental Protection Green Acres ProgramNJ Division of Highway Traffic Safety GrantsNJ Department of Community Affairs Downtown Business Improvement (DBIZ) Loans25
Federal programs that may provide funding for complete streets implementation include:
Transportation Enhancement (TE) ProgramSurface Transportation ProgramSafe Routes to SchoolNational Recreational Trails ProgramHUD Community Development Block Grant (CDBG) ProgramCongestion Mitigation and Air Quality (CMAQ) Program
Metropolitan Planning Organizations may also have additional funding programs available to areas in their region for complete streets improvements.
25 Administered through the State of New Jersey Department of Community Affairs grant management system. <https://njdcasage.state.nj.us/>

20
Complete Streets in NJ: Lessons Learned
Special thanks to Nora Shepherd, Monmouth County; Francis Guzik, West Windsor Township; Kim Craft, Montclair Township; Pam Mount, Lawrence Township; Jim Rutala, Linwood Environmental Com-mission; and Ralph Blakeslee, Netcong Borough for graciously answering questions and sharing their experiences.
For any assistance, questions, or feedback please call or email:Graydon Newman, Transportation [email protected]

21
Complete Streets in NJ: Lessons Learned
Resources
Complete Streets Information & Policy
NJDOT Complete Streets Presentations. NJDOT. 2010.http://njbikeped.org/index.php?module=Pagesetter&func=viewpub&tid=7&pid=17
Complete Streets Fact Sheets. National Complete Streets Coalition. 2011.http://www.completestreets.org/complete-streets-fundamentals/factsheets/
NJ Complete Streets Summit Summary Report. The Alan M. Voorhees Transportation Center, Rutgers University. 2011. http://policy.rutgers.edu/vtc/bikeped/completestreets/Final%20Complete%20Streets%20Sum-mary%20Report.pdf
New Jersey Complete Streets Policies. The Alan M. Voorhees Transportation Center, Rutgers Univer-sity. 2010. http://policy.rutgers.edu/vtc/bikeped/completestreets/policies.php
Street Design: Part 1—Complete Streets from Public Roads magazine. Robin Smith, Sharlene Reed, and Shana Baker. Federal Highway Administration (FHWA). 2010.http://www.fhwa.dot.gov/publications/publicroads/10julaug/03.cfm
Complete Streets: Best Policy and Implementation Best Practices — Chapter 5: Making the Transition. Ed. Barbara McCann and Suzanne Rynne. Planners Advisory Service Report 559. 2010.http://www.completestreets.org/webdocs/resources/cs-bestpractices-chapter5.pdf
Policy Statement on Bicycle and Pedestrian Accommodation Regulations and Recommendations. United States Department of Transportation. 2010.http://www.dot.gov/affairs/2010/bicycle-ped.html
Complete Streets Checklists
Complete Streets (Routine Accomodations). Metropolitan Planning Commission - San Francisco Bay Area. September 2010. http://www.mtc.ca.gov/planning/bicyclespedestrians/routine_accommodations.htm
MORPC Complete Streets Checklist for Project Sponsors. Mid-Ohio Regional Planning Commission. 2010.http://www.morpc.org/trans/CompleteStreets_MORPC_CS_ChecklistFINAL2010-03-31WithAp-pendices.pdf
Planning and Programming Checklist. PENNDOT. 2006.ftp://ftp.dot.state.pa.us/public/PubsForms/Forms/D-310.pdf
22
Complete Streets in NJ: Lessons Learned
Design Guidelines
NJDOT Planning and Design Guidelines for Bicycle Compatible Roadways and Bikeways. NJDOT. 1996.http://www.state.nj.us/transportation/publicat/pdf/BikeComp/introtofac.pdf
NJDOT Planning and Design Guidelines for Pedestrian Facilities. NJDOT. 1996.http://www.state.nj.us/transportation/publicat/pdf/PedComp/pedintro.pdf
A Policy on Geometric Design of Highways and Streets, 5th Edition. American Association of State Highway and Transportation Officials (AASHTO). 2004.https://bookstore.transportation.org/item_details.aspx?ID=85
Guide for Development of Bicycle Facilities, 3rd Edition. AASHTO. 1999.https://bookstore.transportation.org/item_details.aspx?ID=40
Guide for the Planning, Design, and Operation of Pedestrian Facilities, 1st Edition. AASHTO. 2004.https://bookstore.transportation.org/item_details.aspx?ID=39
Manual on Uniform Traffic Control Devices. FHWA. 2009.http://mutcd.fhwa.dot.gov
Performance Measure Resources
NCHRP Web-Only Document 128: Multimodal Level of Service Analysis for Urban Streets: Users Guide. Richard Dowling. Transportation Research Board. 2009.http://onlinepubs.trb.org/onlinepubs/nchrp/nchrp_w128.pdf
2009 Quality/Level of Service Handbook. State of Florida Department of Transportation. 2009.http://www.dot.state.fl.us/planning/systems/sm/los/pdfs/2009FDOTQLOS_Handbook.pdf
Urban Street Design Guidelines. City of Charlotte Department of Transportation. 2007.http://www.charmeck.org/city/charlotte/Transportation/PlansProjects/Pages/Urban%20Street%20Design%20Guidelines.aspx
Health Impact Assessment. Centers for Disease Control and Prevention. Accessed 2011.http://www.cdc.gov/healthyplaces/hia.htm
Infrastructure & Design Resources
Context Sensitive Solutions in Designing Major Urban Thoroughfares for Walkable Communities: An ITE Recommended Practice. Institute for Transportation Engineers (ITE). 2010.http://www.ite.org/css

23
Complete Streets in NJ: Lessons Learned
Traffic Calming: State of the Practice. ITE. 1999.http://www.ite.org/traffic/tcstate.asp#tcsop
U.S. Traffic Calming Manual. Reid Ewing and Steven J. Brown. 2009.http://www.planning.org/apastore/Search/Default.aspx?p=3945
NACTO Urban Bikeway Design Guide. National Association of City Transportation Officials. 2011.http://nacto.org/cities-for-cycling/design-guide/
Constructing, Maintaining, and Financing Sidewalks in New Jersey. VTC and Charles R. Carmalt, AICP. 2006. http://policy.rutgers.edu/vtc/bikeped/reports/Sidewalks%20in%20New%20Jersey.pdf
PBIC Case Study Compendium. Pedestrian and Bicycle Information Center. 2010.http://drusilla.hsrc.unc.edu/cms/downloads/pbic_case_study_compendium.pdf
Funding
Funding Pedestrian and Bicycle Planning, Programs and Projects: A Compilation of Funding Sources. New Jersey Bicycle and Pedestrian Resource Center, VTC. March 2009. http://www.njbikeped.org/index.php?module=Downloads&func=display&lid=1513
New Jersey Department of Transportation Division of Local Aid & Economic Development Federal Aid Handbook. Federal Aid Quality Improvement Team, NJDOT. May 2010.http://www.nj.gov/transportation/business/localaid/documents/FEDERALAIDHANDBOOK.pdf