COMPETITIONS POLICY AND THE GLOBAL COFFEE AND COCOA VALUE ... · COMPETITIONS POLICY AND THE GLOBAL...
31
1 COMPETITIONS POLICY AND THE GLOBAL COFFEE AND COCOA VALUE CHAINS Raphael Kaplinsky, Institute of Development Studies University of Sussex, and Centre for Research in Innovation Management, University of Brighton. [email protected] May 2004. Paper prepared for United Nations Conference for Trade and Development (UNCTAD) Thanks are due to Jenny Kimmis and Robert Fitter for their assistance in the preparation of this report.
Transcript of COMPETITIONS POLICY AND THE GLOBAL COFFEE AND COCOA VALUE ... · COMPETITIONS POLICY AND THE GLOBAL...
1
COMPETITIONS POLICY AND THE GLOBAL COFFEE AND COCOA VALUE CHAINS
Raphael Kaplinsky,
Institute of Development Studies University of Sussex, and Centre for Research in Innovation Management, University of
Brighton.
May 2004.
Paper prepared for United Nations Conference for Trade and Development (UNCTAD)
Thanks are due to Jenny Kimmis and Robert Fitter for their assistance in the
preparation of this report.

2
1. INTRODUCTION It is a historical fact that, considered over a long period of time, the prices of traded commodities have fallen, both in real terms (that is, taking account of inflation), and particularly in relation to the price of manufactures (UNCTAD – please put in most appropriate reference). The incomes provided to the growers of these commodities have fallen, but so too often have those of other actors in these chains who are located in the producing countries, such as buyers and exporters. Yet, at the same time, incomes in those links in the chain which are located in the main consuming countries in high-income economies have either been sustained, or more generally have increased. The experience of the 1990s has seen an exacerbation of these trends, particularly for commodities and primary products which are not integrated into production chains which produce complex manufactures.1 The historical context in which this divergent income growth has played out, has been one characterised by two notable, and contrasting developments in the producing and consuming countries. These trends have been particularly apparent in food-based chains such as coffee and cocoa which are not subject to inherent scale economies at the growing and primary processing stage. Both developments began to emerge during the late 1980s, and gathered pace during the 1990s and early 21st century. At the growing stage, countries had previously regulated production and marketing using various forms of marketing boards. The Structural Adjustment Programmes of the 1990s involved a process of deregulation and liberalisation. The consequence has been that the private sector has played a growing role in increasingly deregulated production systems. Thus, “aggregated producer power” which had been reflected in these marketing boards has weakened, and small and medium scale producers, who previously linked to final markets through the various forms of marketing boards, increasingly found themselves selling directly into volatile global markets. At the consuming end of these chains, there has been a growing tendency towards the concentration of economic power into a decreasing number of increasingly transnational firms. Thus, there has been a growing asymmetry in many commodity value chains – between the fragmentation at the producing end of these chains, and the concentration at the buying and retail ends. This asymmetry raises the possibility that part of the explanation for these divergent income trends has been the abuse of dominant market position which often occurs in markets characterised by such inequalities in power. In this report we examine the nature of this concentration in the food industry in general, and the coffee and cocoa value chains in particular. Although, as will be shown below, we are not able to document the existence of the abuse of dominant market power, we are able to show the extent of market concentration in these two chains, and to identify the key actors which drive these two value chains. We have chosen the coffee and cocoa value chains because of their size and significance. In 1 The very rapid growth of China and India in recent years has seen a sharp spike in
the price of metallic commodities, with the possibility of a reversal of the historic trend in the terms of trade of these primary products compared with manufactures (Kaplinsky, forthcoming, Chapter 7).
3
particular, the absence of scale economies at the growing stage of these chains and their agronomic characteristics means that these two crops are particularly important to poor people in the poorest economies in Africa and Central America, as well as to more robust economies such as Brazil, India, Indonesia and Malaysia. Before exploring the emerging patterns of concentration in the food chain in general and in these two chains in particular, we begin with a preparatory discussion laying out the bare bones of the value chain framework. This analytical framework has become increasingly important as a tool for explaining the underlying dynamics of global production networks – identifying the key actors who drive these chains (Gereffi, 1994; Gereffi, Humphrey and Sturgeon, 2004), and the impact which globalisation has on income distribution (Kaplinsky, 2000). An identification of these key actors is of course a necessary step in the exploration of the existence of anti-competitive practices.
1.1. Value chains – a short primer Producers in virtually every sector and in virtually every country are locked into production chains – the product reaches the final customer having passed through the hands of a number of intermediaries, each of whom adds value to the final product. However, the concept of the value chain describes more than a set of input-output relationships.2 In particular it identifies key actors who play a critical role in coordinating production in the chain - defining who is to perform what role, what standards are to be met in participating in the chain, coordinating a process of chain-upgrading, and influencing the distribution of returns amongst the various parties who participate in these chains. Historically, particularly in the era of mass production which extended to the end of the 1970s, producers connected to final markets in one of two ways. At one end of the spectrum, they participated in the “perfect markets” of the economic text-books in which they bought inputs from, and sold output into markets over which they had absolutely no influence – they were price-takers rather than price-makers; their decisions were not influenced by those of particular competitors; and relationships along the chain were short-term and impersonal. At the other end of the spectrum, when the transaction-costs of markets were too high, production was internalised within a single firm which embodied in its operations a series of links in the production chain. However, during the last quarter of the twentieth century, a new form of production organised began to become increasingly prominent, particularly as these production chains became global in nature. On the one hand they were not characterised by internalisation, since intermediate inputs were passed along the chain by parties with no, or very small equity links. On the other hand, the relationships involved in this intermediate processing were neither impersonal
2 For an extended discussion of value chains, see Gereffi and Korzeniewicz 1994, IDS
Bulletin 2001, and Kaplinsky and Morris 2001

4
or short-term; they were durable, and reflected close cooperation amongst participating producers. However, the “glue” holding the producers in these emerging chains together did not reflect equal weight. In each of these chains, one or more key actors came to exert undue power; they became what Gereffi termed “chain governors”.3 Gereffi distinguished two major families of chains. The first of these are the “producer-driven chains”, in which the key governors are firms imbedded in the production chain itself and commanding core technologies, such as Toyota in the auto value chain, and Siemens in the power-generation value chain. The second type of chain-governors are those which are “buyer-driven”, where the reins of power are held by key buyers, usually at the top end of the chain near the final consumer. These buyers determine the nature of the access of producers to final consumers. In general, developing countries producing for global markets sell into buyer-driven chains. One of the major characteristics of global value chains is the growing importance of standards (Kaplinsky and Morris, 2001). Essentially, producers participating in these chains are increasingly required to conform to an increasing number of standards. Some of these standards govern production processes and are set by international bodies – for example, ISO9000 for quality, ISO14000 for environment, SA8000 for labour, and HACCP for the food industry4). Other process standards reflect the specific requirements of the chain-governors, such as those which enable traceability (in order, for example, to track where pesticide residues have entered the chain), or which determine delivery and quality schedules. The growing prevalence of these (private-sector) standards – which in many respects become trade barriers for developing country producers just as (government-defined) tariffs and NTBs are declining – are often particularly challenging for small and medium scale producers who may lack the resources or skills to obtain and sustain the necessary certification. We will use this simplified value chain framework to explore the processes determining price-formation in each of these two sectors.
3 It is this insight which distinguishes value chain analysis from the supply chain
literature and from Porter’s idea of the value stream (Porter, 1990). 4 Hazard Analysis and Critical Control Point procedures regulate processes with food
processing industries.
5
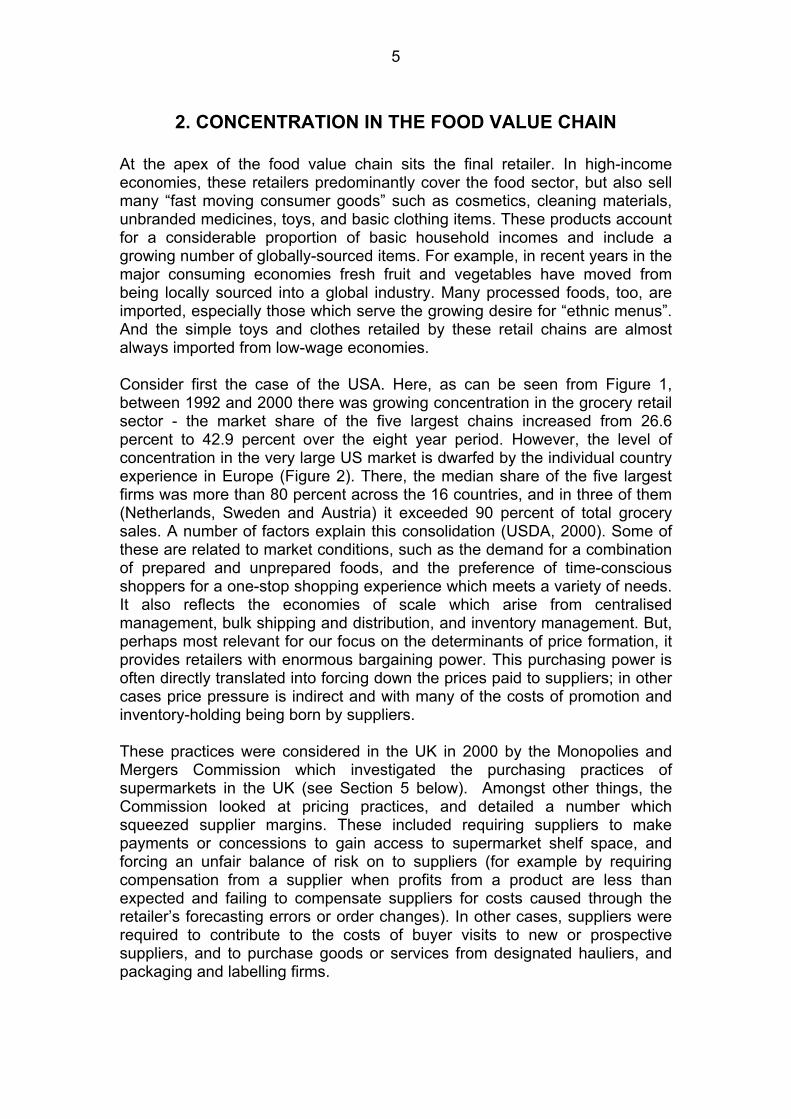
2. CONCENTRATION IN THE FOOD VALUE CHAIN At the apex of the food value chain sits the final retailer. In high-income economies, these retailers predominantly cover the food sector, but also sell many “fast moving consumer goods” such as cosmetics, cleaning materials, unbranded medicines, toys, and basic clothing items. These products account for a considerable proportion of basic household incomes and include a growing number of globally-sourced items. For example, in recent years in the major consuming economies fresh fruit and vegetables have moved from being locally sourced into a global industry. Many processed foods, too, are imported, especially those which serve the growing desire for “ethnic menus”. And the simple toys and clothes retailed by these retail chains are almost always imported from low-wage economies. Consider first the case of the USA. Here, as can be seen from Figure 1, between 1992 and 2000 there was growing concentration in the grocery retail sector - the market share of the five largest chains increased from 26.6 percent to 42.9 percent over the eight year period. However, the level of concentration in the very large US market is dwarfed by the individual country experience in Europe (Figure 2). There, the median share of the five largest firms was more than 80 percent across the 16 countries, and in three of them (Netherlands, Sweden and Austria) it exceeded 90 percent of total grocery sales. A number of factors explain this consolidation (USDA, 2000). Some of these are related to market conditions, such as the demand for a combination of prepared and unprepared foods, and the preference of time-conscious shoppers for a one-stop shopping experience which meets a variety of needs. It also reflects the economies of scale which arise from centralised management, bulk shipping and distribution, and inventory management. But, perhaps most relevant for our focus on the determinants of price formation, it provides retailers with enormous bargaining power. This purchasing power is often directly translated into forcing down the prices paid to suppliers; in other cases price pressure is indirect and with many of the costs of promotion and inventory-holding being born by suppliers. These practices were considered in the UK in 2000 by the Monopolies and Mergers Commission which investigated the purchasing practices of supermarkets in the UK (see Section 5 below). Amongst other things, the Commission looked at pricing practices, and detailed a number which squeezed supplier margins. These included requiring suppliers to make payments or concessions to gain access to supermarket shelf space, and forcing an unfair balance of risk on to suppliers (for example by requiring compensation from a supplier when profits from a product are less than expected and failing to compensate suppliers for costs caused through the retailer’s forecasting errors or order changes). In other cases, suppliers were required to contribute to the costs of buyer visits to new or prospective suppliers, and to purchase goods or services from designated hauliers, and packaging and labelling firms.

6
Figure 1. Concentration in the US Retail Grocery Sector: Share of the five largest firms, 1992-2000
0
5
10
15
20
25
30
35
40
45
50
1992 2000
%
Kroger American Stores Safeway A&P Winn-Dixie
Source: From data in Wrigley, 2001 Figure 2. Market share of five largest grocery retailers in Europe, 2000
0 20 40 60 80 100
Netherlands
Sweden
Austria
Denmark
Norway
Switzerland
France
Finland
Germany
Belgium
UK
Portugal
Spain
Greece
Italy
Median
%
Source: AC Nielson, cited in Bell 2003 Faced with this growing power of retailers, there has been an equivalent consolidation process sweeping through the manufacturing industries which supply these grocery chains. Table 1 shows the level of concentration in the European food manufacturing sector, covering the production of 17 different

7
products in nine countries, and focusing on the share of production of the three largest firms. In aggregate, across all sectors, the three largest firms accounted for more than two-thirds of production in the nine countries. In only two of the sectors was the average less than 50 percent, whereas in six of the sectors the largest three firms accounted on average for more than three-quarters of total production.
Table 1. Three firm concentration ratios in EU food processing industries
(mid-1990s)
Product Ireland Finland Sweden Denmark Italy France Spain UK Germany Avr Baby food 98 100 100 99 96 93* 54 78 86 91 Canned soup 100 85 75 91 50 84 - 79 41* 87 Ice cream - 84 85 90 73* 52 84 45 72 76 Yoghurt 69 83* 90 99* 36 67 73 50 76 70 Chocolate Confectionary
95 74 - 39 93 61 79 74 - 74
Pet food 98 80 84 40 64* 73 53 77 87 79 Breakfast cereals
92 - 52 70 88 70 82 65 67 73
Tea 96 90 63 64 80 82 62 52 55 72 Snack Foods 72 70* 80 78 71 50 56 73 48 68 Carbonates 85 50 62 - 60 69 79 55 60* 71 Pasta 83 97 82 61 51 57 65 37 49 65 Wrapped bread 85 44 47 59 80 70 96 58* 9 59 Biscuits 83 73 51 44 55 61 53 42 50 58 Canned fish - 70 72 49 68 43* 33 43* - 55 Mineral water - 100 74 70 37 - 31 14 22 50 Fruit juice - 70 50 65* 62 26 38 35 46 48 Canned vegetables
- 68 47 50 36 29 - - - 47
Average 9 79 69 69 67 63 1 56 5 68 * indicates two-firm concentration ratio Source: Cotterill (1999). Hence what we can observe is that in the high income consuming countries, there is a growing trend towards consolidation of buying power in the retail grocery sector, and a corresponding increase in concentration in the manufacturing sectors. In many cases these manufacturers and retailers purchase directly from developing countries. Nowhere is this more the case than that of Walmart, whose meteoric growth has made it the world’s largest retailer. It was founded in 1962 and has been the largest retailer in the US since 1995. It began its overseas expansion in 1991 and by 2003 it operated in nine countries, including becoming the third largest retailer in the UK. However, even in buyer-driven chains, producers in poor countries do not always connect with the retailers of their products through direct contact; they often work through buying intermediaries. Here, too, there appears to be a process of consolidating buying power, although this is more difficult to evidence.

8
3. THE COFFEE VALUE CHAIN Coffee is one of the most important exports for the least developed economies. Total global exports (75 percent of production) exceed $9bn, and the sector employs more than 25 million people globally on more than 5m farms. Coffee is mistakenly often described as the world’s second largest commodity export after oil. This was the case during the period of high coffee prices, but since the late-1990s when coffee prices began to fall precipitously, the value of global exports has been exceeded not just by oil, but also by aluminium, wheat and coal (Ponte, 2001). It fills approximately 400 billion cups a year and is estimated to be regularly consumed by more than 40 percent of the world’s population. Coffee has a particularly large “footprint” in poor countries, and amongst poor producers in these countries. For many African countries, coffee has long been the major export, and it also plays an important economic role in Latin America and Asia. Moreover, the lower the level of per capita income, the more dependent producing economies are on coffee exports (Fitter and Kaplinsky, 2001).
3.1. The Chain The coffee chain breaks down into a number of major stages (Figure 3). After the coffee cherries are harvested, they can enter one of two basic processing routes – the wet or the dry process. This is invariably performed on or near the farm itself. The resulting parchment coffee then has to be milled. Here there are more scale economies, and milling tends to occur in the rural areas where coffee is grown, but on a more centralised basis. Both parchment and green coffee can be stored and location is thus technically possible anywhere after this stage. However, green coffee is less bulky and lighter than parchment, so milling tends to be undertaken in the growing country. The green beans are then roasted, and reach the market either as instant coffee (predominantly in the Anglo-Saxon countries and in many developing countries), or in roasted ground form. Whilst instant coffee has a shelf life of six months or longer and production for export is feasible either in the producing or consuming economy, roasted ground coffee is by necessity almost always located near the final consuming market. The horizontal line in Figure 3 shows the “normal” pattern in which coffee has largely entered global markets at the green bean stage.

9
Figure 3.The coffee production chain
seeds, inputs, extension,
coffee cherries
dry process wet process
parchment coffee
mill
green coffee
roast
roasted ground instant
3.2. Concentration and chain governance Pre-Structural Adjustment Historically, four major parties have played critical roles in the coffee production chain. The farmers have obviously been central to the chain, and until recent years when Brazilian farmers have gone in for large-scale irrigated farming, most of these growers have been operating at a small or medium-scale of operations. In most producing countries, the second party of significance has been one of a number of forms of marketing boards and producer associations (see below), who have been responsible for many of the non-farm activities in the producing countries – milling, buying, exporting, and so on. Third, there have been the global traders, sourcing coffee from a variety of origins, and selling them on to the fourth major party in the chain, the roasters, who have branded and sold the coffee on to retailers. Referring back to the earlier discussion on value chains, can any of these parties be said to have played the role of a chain governor? That is, have they determined who does what in the chain, set the standards of performance

10
required to participate in the chain and, where necessary, coordinated a process of chain upgrading through supply chain management procedures? Until the mid-1990s, the only real signs of governance have been the various forms of marketing boards. Located in the producing countries, they have typically taken the following major forms:
• Marketing Boards. Located in many ex-British economies (but also in Angola, Ethiopia and Togo), these coffee Marketing Boards were typically under the control of the Ministry of Agriculture or the Ministry of Trade and Commerce. More often they worked closely with producer cooperatives – the cooperatives were responsible for buying and milling parchment coffee, and the marketing boards set the prices, licensed producers, were responsible for quality control and upgrading, and exported the product. They basically coordinated heavily regulated production systems, and were the intermediary between producers and global traders. Marketing boards often sold coffee on, or coordinated the sale of coffee, through auctions.
• Instituto. Some Latin American countries used a diluted form of
Marketing Boards. They had many of the regulatory functions of the marketing boards, including an active role in price formation and quality assurance, but played a less active role in buying.
• Caisse de Stabilisation. This was a francophone equivalent to the
Marketing Boards operating in many ex-British colonies. It replicated many of the functions of the Boards, but unlike the Boards, it seldom physically handled the coffee. In other words, it assumed the role of governance without becoming involved in direct production processes.
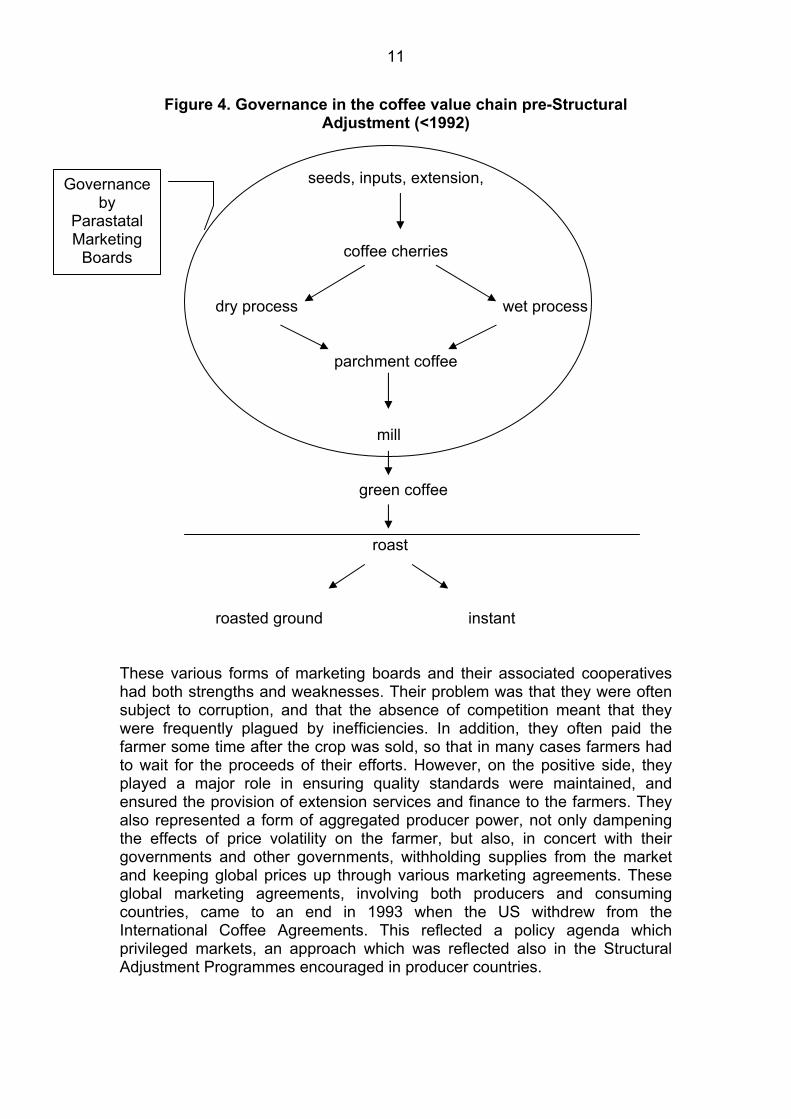
In contrast to the marketing boards, the global traders and roasters seldom got involved in chain governance, preferring to operate on an arms-length basis in global markets. The traders sourced from a variety of countries, sometimes buying from local traders and exporters, at other times from commodity auctions (particularly in East Africa and India). Over the years many of these traders developed ongoing “sticky” links with individual roasters, but this was a relationship of mutual strength rather than of one party becoming dominant in the chain. Therefore, as can be seen in Figure 4, to the extent that the coffee production chain could be characterised as a value chain with governance, it was only in the producing countries that governance was to be found, and the key party involved was the parastatal marketing boards or equivalent.
11
Figure 4. Governance in the coffee value chain pre-Structural Adjustment (<1992)
seeds, inputs, extension,
coffee cherries
dry process wet process
parchment coffee
mill
green coffee
roast
roasted ground instant
These various forms of marketing boards and their associated cooperatives had both strengths and weaknesses. Their problem was that they were often subject to corruption, and that the absence of competition meant that they were frequently plagued by inefficiencies. In addition, they often paid the farmer some time after the crop was sold, so that in many cases farmers had to wait for the proceeds of their efforts. However, on the positive side, they played a major role in ensuring quality standards were maintained, and ensured the provision of extension services and finance to the farmers. They also represented a form of aggregated producer power, not only dampening the effects of price volatility on the farmer, but also, in concert with their governments and other governments, withholding supplies from the market and keeping global prices up through various marketing agreements. These global marketing agreements, involving both producers and consuming countries, came to an end in 1993 when the US withdrew from the International Coffee Agreements. This reflected a policy agenda which privileged markets, an approach which was reflected also in the Structural Adjustment Programmes encouraged in producer countries.
Governance by
Parastatal Marketing
Boards

12
Post Structural Adjustment From the early 1990s, various Structural Adjustment Programmes were introduced in coffee producing countries, sometimes under the behest of multilateral and bilateral aid agencies, and in other cases with the active participation of governments. This had direct consequences for the various forms of marketing boards which were prevalent in the coffee and other commodity sectors. In most cases, they were either dissolved or had most of their power removed. One of the key objectives driving the reforms was to ensure that the farmer received a higher proportion of crop proceeds, and indeed, in many cases, this was the case. However, it was not always so, an outcome which is often glossed over since it reflects an uncomfortable outcome to a high-profile set of policy initiatives. For example, the Common Fund for Commodities Report which involved a cooperation between the World Bank and the International Coffee Organisation concluded that “[t]he key benefits of liberalisation is that increased competition throughout the marketing chain leads to a reduction in marketing costs and growers receiving a higher proportion of the export unit value” (Common Fund for Commodities, 2000: 10). Yet, of the seven countries they consider, in two there was no change pre- and post-liberalisation (Ethiopia and India), in two the proportion fell (Angola and Ghana), and in only three did it rise (Cameroon, Madagascar and Togo) (ibid: 11). Moreover, there was a second adverse outcome which has received even less attention. Even though farmers may have received a greater share of the proceeds accruing within the producing countries, their share of total proceeds in the chain as a whole fell (Figure 5). In other words, one of the major anticipated benefits of liberalisation – the reduction in post-farm costs in producer countries - was not appropriated by the farmers, but by residents in the high-income consuming countries. It should however be noted that there were other benefits for farmers as a consequence of liberalisation, notably that they more often were paid on time, or at the point of sale, as opposed to the frequent delays which often characterised the regulated system.

13
Figure 5. Inter-country distribution of income: % share of final retail price of coffee
0%
20%
40%
60%
80%
100%
1965
1967
1969
1971
1973
1975
1977
1979
1981
1983
1985
1987
1989
1991
1993
1995
1997
1999
2001
2003
Year
Prop
ortio
n of
fina
l ret
ail p
rice
value added in consuming country transport costs and weight loss value added in producing country grower price Source: Update of data in Talbot 1997 The coffee chain is dynamic, and following the dissolution of these marketing boards, new forms of chain-governance began to emerge. A number of factors explain these developments. First, in a process which had been occurring for some time, there was an increase in concentration in both the trading link in the chain, and in the roasting/marketing link. Figure 6 shows the very rapid growth in concentration in the coffee processing sector in Europe, with the share of the largest five producers more than doubling from 21.5 percent to 58.4 percent between 1995 and 1998. But it also shows an increase in concentration in the global buying industry, although at a lower pace and to lower levels.

14
Figure 6. Five-firm concentration ratios in European coffee roasting and global buying
010203040506070
1989 1995 1998
%
Buying Roasting
Source: Kaplinsky and Fitter (2001) In the 1990s, five traders (Neumann Gruppe, Volcafe, ED&F Man, Cargill and Goldman Sachs) together controlled the majority of imports into the key coffee consuming countries. Today, the trading stage of the chain is even more concentrated, with just three firms dominating: Neumann Kaffee Gruppe, Volcafe, and Ecom Agroindustrial. Ecom Agroindustrial Corp., the holding company of the commodity branches of Brazilian company Esteve SA and one of the world”s largest closed capital companies, purchased the coffee division of Cargill in 2000. Annual turnover of the Ecom Coffee Group is over nine million bags, representing over 12 percent of global coffee trade. Table 2 shows the leading international traders in the coffee chain, their nationality, and the coffee producing countries in which they have commercial operations.

15
Table 2: Leading international traders in the coffee commodity chain
Company (Nationality)
Operations in Coffee Producing Countries
Neumann Kaffee Gruppe AG (German)
NK Group has commercial operations in 17 coffee producing countries in Latin America, Africa and Asia. [Honduras, Nicaragua, Costa Rica, Peru, Mexico, El Salvador, Brazil, Colombia, Guatemala, Rwanda, Burundi, Kenya, Uganda, Tanzania, Vietnam, Papua New Guinea, Indonesia]
Volcafe Holdings Ltd (Swiss)
Volcafe Group has export operations in 12 coffee producing countries in Latin America, Africa and Asia. [Mexico, Guatemala, Honduras, Costa Rica, Colombia, Peru, Brazil, Kenya, Tanzania, Uganda, Indonesia, Papua New Guinea]
Ecom Agroindustrial Corp Ltd.
(Swiss/Spanish)
Ecom Coffee Group has commercial operations in 13 coffee exporting countries in Latin America, West Africa and Asia. The Group is involved in milling, warehousing, exporting and trading coffee. [Colombia, Guatemala, Costa Rica, Brazil, Mexico, Honduras, Nicaragua, Peru, Ivory Coast, India, Papua New Guinea, Vietnam, Indonesia]
Source: www.nkg.net/worldwide/group companies/, www.volcafe.com,
www.ecomtrading.com This concentration in trading had a number of causes. Economies of scale developed in the growing practice of hedged buying and coffee futures. The views of Nestlé – as evidenced in a publication which it commissioned and disseminated and which has a preface by its CEO are intriguing:
“[I]t is significant that the ‘buyers’ and ‘sellers’ on the commodities market are mainly speculators, who invest astronomic amounts of money every day in the futures market. They ‘play’ the market in the hope of making a profit. Their ‘purchase’ is a simple contract on paper which they own for a short period of time until they decide to sell. In comparison to this type of ‘paper’ sales of coffee, contracts for the ‘physical’ sale of purchases of coffee are few and far between. This is amply demonstrated, if demonstration is required, by a brief analysis of the operations in 1992 on the New York Coffee Sugar and Cocoa Exchange, Over a year, a grand total of 621 million 60kg bags were traded. In the same period, total world exports mounted to 55 million bags – only 8.8% if the 621 million bags traded on the Exchange….. Without a doubt, such speculation determines to a large degree the international coffee price, and in consequence the price paid to the producer” (Montavon, 1994: ibid: 20).
Another source of concentration in trading was the development of new processing techniques (steam cleaning). These meant that low-cost robusta

16
coffee could be substituted for high-cost arabicas, and this provided the potential to reduce bean costs by mixing different types of beans. Since many developing countries produced a single major type of bean, there were clear scale advantages which arose from the ability of global traders to source from a number of countries. As a consequence of these scale economies in hedging and buying, as the Common Fund Report concludes, this “can make it difficult for local exporters to compete” (Common Fund for Commodities, 2000: 16), meaning that concentration is no longer something which is acted out in the global arena, but increasingly is also evidenced in producing countries. Transnational buyers have increasingly began to operate within the boundaries of producing countries, supplanting many of the traditional export agents who had passed beans of from farm-level buyers to global markets. With regard to concentration in roasting, the heavy promotional costs in brand development and marketing has underlain the growing power of a few key multinational roasting and marketing companies. These firms manufacture instant and ground coffee, and compete with each other on the basis of branding backed by large expenditure on advertising in the coffee consuming countries. Table 3 shows the four largest international coffee manufacturers - Nestle SA, Kraft Foods Inc, Procter & Gamble and Sara Lee Corporation - their nationality and their key brands. As the table shows, three of the four leading international roasting companies are US-based.
Table 3 Leading roasters in the coffee chain
Company (nationality)
Brands
Nestle SA (Swiss)
Nescafe, Bonka, Ricore
Kraft Foods Inc
(US)
Europe: Jacobs, Maxwell House, Carte Noire, Maxim, Blendy, Gevalia, Jacques Vable, Kenco,
Hag, Saimaza. USA: Maxwell House, Yuba, Starbucks
Procter & Gamble (US)
Folgers (ground and instant) and Millstone.
Sara Lee
Corporation (US)
Europe: Douwe Egberts, Maison du Café, Marcilla, Merrild Van Nelle and Senseo.
US: Hills Bros and Superior (food service industry). Brazil: Café do Ponto and Pilao
Source: www.nestle.com, www.kraft.com, www.pg.com, www.saralee.com Nestle is the world’s largest food and beverage company. It has a 22 percent market share of the global sales of coffee for consumption in the home, with sales in 2000 for coffee brands reaching approximately CHF8.5bn. Kraft Foods is part of the Altria Group Inc, formally Philip Morris. In 2000, Philip Morris had an estimated 14 percent market share of coffee sold for home consumption globally, and Kraft brand coffees are sold in over 90 countries worldwide (www.kraft.com).

17
Some of the larger roasting companies buy coffee directly from producers and have commercial operations in coffee producing countries. Nestle and Kraft Foods, for example, are two of the largest coffee purchasers in the world. Nestle developed a direct procurement system over 20 years ago, and in 2002 the company bought about 110,000 tonnes of coffee directly from farmers and co-ops. In coffee producing countries where there are Nescafe factories (11 factories producing 55 percent of Nescafe are in the developing world), the company has also set-up buying stations. Some of these large roasting companies are also involved in sustainable coffee and/or fair trade initiatives. Kraft Foods established the “Sustainable Coffee Initiative” in partnership with Rainforest Alliance in 2003, which involves investments at farm level, certification scheme, etc (www.kraft.com). Does this concentration in trading and roasting add up into chain-governance (in the sense that we have discussed in earlier sections)? One of the unintended consequences of deregulation and privatisation has been the significant fall in coffee quality in many parts of the world - “A significant result of such liberalization processes has been the deterioration of the quality of the previously regulated crops…, a trend noted in different countries and for different crops” (Folds, 2002: 229). As a consequence, “exporters have had to bear more of the costs associated with quality control, drying, grading and sorting” (Common Fund for Commodities, 2000: 12), and this has become a major concern for key roasters. Thus, the erosion of the governance activities formerly undertaken by the marketing boards has forced many of the traders and even some of the roasters in the chain into more active forms of chain governance. In some cases, particularly for the quality-oriented niche producers such as Illy, roasters and traders have become active in teaching growers the rudiments of coffee quality (many growers either do not drink coffee, or have little knowledge of what constitutes a high-quality drink), in buying appropriate beans and in ensuring appropriate quality control in milling and in transport. Thus, comparing Figure 4 with Figure 6, we can see how the locus of governance in this relatively-weakly governed chain has passed from parastatal marketing boards in the producing countries (Figure 4) to trading and roasting companies located in the major consuming countries (Figure 6).

18
Figure 6. Governance in the coffee production chain post-Structural Adjustment (>2000)
seeds, inputs, extension,
coffee cherries
dry process wet process
parchment coffee
mill
green coffee
roast
roasted ground instant
4. THE COCOA VALUE CHAIN Total global consumption of cocoa is around three million tonnes per year (Vorley, 2003) and employs around 14 million workers worldwide, and some 10 million workers in Africa alone (ICCO). The global confectionary market reached estimated value of $73.2 billion in 2001, an increase of 21 per cent since 1996. Although the global cocoa market is of smaller size than that of coffee, it is of disproportionate importance in sub-Saharan Africa, where it is the second largest non-fuel export, accounting for 6.6 percent of all SSA’s non-fuel exports (coffee is the fourth largest, at 4.7 percent)
Governance by Trading
and roasting TNCs

19
4.1. The Chain The farming and harvesting of cocoa pods, and the extraction, fermentation and drying of cocoa beans necessarily occurs on or very near the farm, and has few scale economies. Like coffee, therefore, most cocoa growing occurs on small or medium-sized farms – for example, in the Ivory Coast during the 1980s, there were around 600,000 small and medium sized farmers with farms of between five and 20 hectares (Losch, 2002: 210). After harvesting and preliminary processing, cocoa beans are then roasted and ground into a liquor, before being converted into cocoa butter or cocoa powder. The butter is utilised in chocolate manufacture, whilst the powder is destined for the catering markets and for liquid drinks. Cocoa beans can be stored for around six months, and it is here that global trade often begins. But cocoa butter, powder and even chocolate can also be stored, so these activities can (and do) occur in both producing and consuming countries, with some of the resultant product traded across national boundaries. Figure 7 describes this chain, and the horizontal line shows the predominant pattern in which cocoa has largely entered global markets at the green bean stage.
Figure 7. The cocoa production chain
seeds, inputs, extension,
growing, fermentation and drying
beans
roasting
grinding
cocoa liquor
Cocoa butter cocoa powder
Chocolate manufacturing confectionary and drinks
Branding and marketing

20
4.2. Concentration and chain governance The prevalence of concentration in the cocoa chain Cocoa growing is more geographically concentrated than in the case of coffee. As Figure 8 shows, the largest three cocoa producers (Ivory Coast, Ghana and Indonesia) account for 75 percent of total exports; by contrast, the largest three coffee exporting countries (Brazil, Vietnam and Colombia) only account for 44.9 percent of global exports. The share of the largest cocoa exporter (the Ivory Coast) at 44 percent in 2002, was almost double that of the largest coffee exporter (Brazil) at 23.2 percent.
Figure 8. Distribution of cocoa bean production (%)
0 10 20 30 40 50
Ivory Coast
Ghana
Indonesia
Brazil
Nigeria
Cameroon
Ecuador
D. Republic
Papua NG
Colombia
Malaysia
Mexico
%
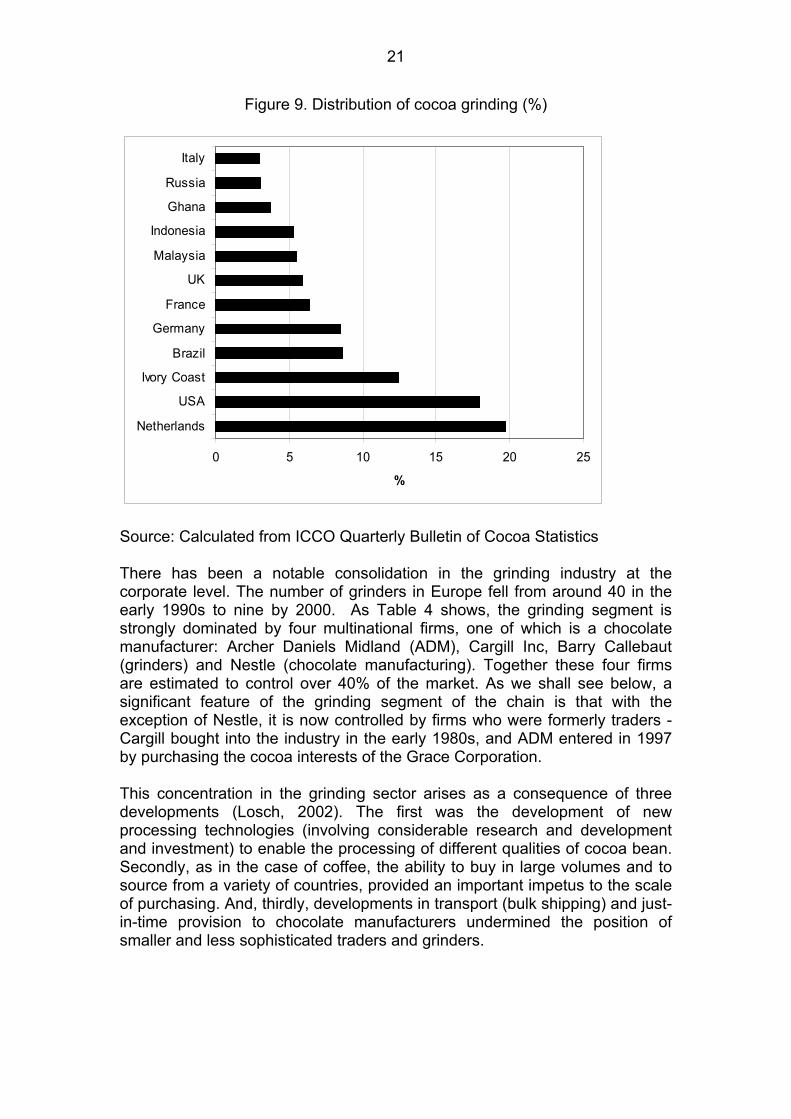
Source: Calculated from ICCO Quarterly Bulletin of Cocoa Statistics Roasting and grinding is also geographically heavily concentrated in the cocoa chain – the three largest grinders (The Netherlands, the US and the Ivory Coast) account for 50 percent of total global capacity. A significant portion of global grinding is centred in the Zaan area of the Netherlands, which with annual production of 450,000 tonnes, accounts for one-third of European and 15 percent of global grinding. But, because of the fact that cocoa products can be stored for longer than roasted ground coffee, cocoa grinding also occurs at a significant level in bean-producing countries. As Figure 9 illustrates, the third and fourth largest grinding economies are low-income countries – the Ivory Coast (by far the largest bean producer), and Brazil.
21
Figure 9. Distribution of cocoa grinding (%)
0 5 10 15 20 25
Netherlands
USA
Ivory Coast
Brazil
Germany
France
UK
Malaysia
Indonesia
Ghana
Russia
Italy
%
Source: Calculated from ICCO Quarterly Bulletin of Cocoa Statistics There has been a notable consolidation in the grinding industry at the corporate level. The number of grinders in Europe fell from around 40 in the early 1990s to nine by 2000. As Table 4 shows, the grinding segment is strongly dominated by four multinational firms, one of which is a chocolate manufacturer: Archer Daniels Midland (ADM), Cargill Inc, Barry Callebaut (grinders) and Nestle (chocolate manufacturing). Together these four firms are estimated to control over 40% of the market. As we shall see below, a significant feature of the grinding segment of the chain is that with the exception of Nestle, it is now controlled by firms who were formerly traders - Cargill bought into the industry in the early 1980s, and ADM entered in 1997 by purchasing the cocoa interests of the Grace Corporation. This concentration in the grinding sector arises as a consequence of three developments (Losch, 2002). The first was the development of new processing technologies (involving considerable research and development and investment) to enable the processing of different qualities of cocoa bean. Secondly, as in the case of coffee, the ability to buy in large volumes and to source from a variety of countries, provided an important impetus to the scale of purchasing. And, thirdly, developments in transport (bulk shipping) and just-in-time provision to chocolate manufacturers undermined the position of smaller and less sophisticated traders and grinders.

22
Table 4. Largest four cocoa grinders, 2000-2001 (‘000 tonnes) Group (“000 tonnes)
Share of Grinding Volume
Archer Daniels Midland 500 17% Cargill Inc 410 14% Barry Callebaut 360 12% Nestle 250 8%
Source: www.icco.org/questions High levels of concentration are also to be found in chocolate manufacturing (Table 5). The six largest chocolate manufacturers are estimated to constitute around 60-70 per cent of the world market. The US market is believed to be even more concentrated, with the top three companies commanding a market share of around 60 per cent. The leading global non-industrial chocolate manufacturers are Nestle (Swiss), Hershey (USA), Cadbury (UK), and Mars and Philip Morris (USA). Table 7 shows 2002 sales in US$ billions for these four leading firms. Barrey Callebaut accounts for more than 50 percent of global production of industrial chocolate. As in the case of coffee roasting, concentration at the stage of the chain reflects the very heavy costs of branding and marketing, requiring large resources and involving marketing on a global scale.
Table 5. Annual sales of largest four chocolate manufacturing companies, 2002 ($bn)
Group Total Sales Mars Inc 7.5 Nestle 7.2 Hershey Foods Corp 4.5 Cadbury Schweppes 4.4 Source: www.icco.org/questions The changing dynamics of governance As in the case of coffee, the pre-liberalisation environment was one in which the major incidence of governance in the chain occurred within producing countries, and was performed by the parastatal marketing boards in their various forms. They were responsible for the full range of processes from the beginning of the chain until the export of the bean. In some producing countries the marketing boards coexisted with local exporters. Figure 8 shows the dominant pattern of governance in this chain in most producing countries prior to the Structural Adjustment Programmes of the 1990s – again, defining governance as the ability to determine who participates in the chain and to what standards they perform, and in activities designed to upgrade performance amongst chain members. As in the case of coffee, chain

23
governance was performed mainly by parastatal marketing boards of various forms, and was limited to those chain activities prior to bean export. Figure 8. Governance in the cocoa production chain, prior to Structural
Adjustment Programmes (<1990)
seeds, inputs, extension
growing, fermentation and drying
beans
roasting
grinding
cocoa liquor
Cocoa butter cocoa powder
Chocolate manufacturing confectionary and drinks
Branding and marketing In the case of the largest cocoa producer, the Ivory Coast, this chain governance led to the local development of almost all of the links in the chian, including the production of bulk chocolate which was subsequently exported to Europe. One of the local exporters (SIFCA) even purchased an equity share in a French grinding company (although this was divested as the Ivorian industry lurched into crisis after 1999). But during the 1990s two main developments radically changed this governance structure in virtually all countries (with Ghana being the major exception – see below), including crucially in the largest cocoa producer, the Ivory Coast. The first was the advent of Structural Adjustment Programmes which eroded the governance power of the various marketing boards which had performed a similar function in the cocoa sector as to that in the coffee chain. As Losch observes of the Ivory Coast, “[t]hus, after a 45-year
Governance by
Parastatal Marketing
Boards
24
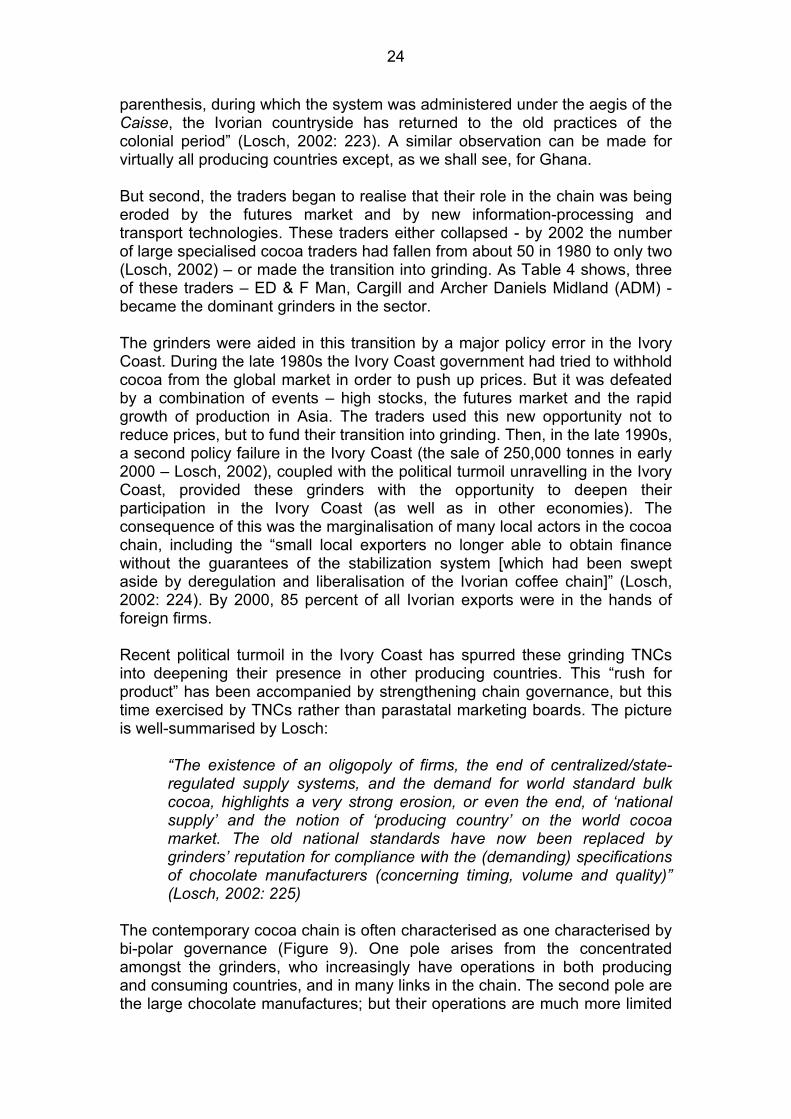
parenthesis, during which the system was administered under the aegis of the Caisse, the Ivorian countryside has returned to the old practices of the colonial period” (Losch, 2002: 223). A similar observation can be made for virtually all producing countries except, as we shall see, for Ghana. But second, the traders began to realise that their role in the chain was being eroded by the futures market and by new information-processing and transport technologies. These traders either collapsed - by 2002 the number of large specialised cocoa traders had fallen from about 50 in 1980 to only two (Losch, 2002) – or made the transition into grinding. As Table 4 shows, three of these traders – ED & F Man, Cargill and Archer Daniels Midland (ADM) - became the dominant grinders in the sector. The grinders were aided in this transition by a major policy error in the Ivory Coast. During the late 1980s the Ivory Coast government had tried to withhold cocoa from the global market in order to push up prices. But it was defeated by a combination of events – high stocks, the futures market and the rapid growth of production in Asia. The traders used this new opportunity not to reduce prices, but to fund their transition into grinding. Then, in the late 1990s, a second policy failure in the Ivory Coast (the sale of 250,000 tonnes in early 2000 – Losch, 2002), coupled with the political turmoil unravelling in the Ivory Coast, provided these grinders with the opportunity to deepen their participation in the Ivory Coast (as well as in other economies). The consequence of this was the marginalisation of many local actors in the cocoa chain, including the “small local exporters no longer able to obtain finance without the guarantees of the stabilization system [which had been swept aside by deregulation and liberalisation of the Ivorian coffee chain]” (Losch, 2002: 224). By 2000, 85 percent of all Ivorian exports were in the hands of foreign firms. Recent political turmoil in the Ivory Coast has spurred these grinding TNCs into deepening their presence in other producing countries. This “rush for product” has been accompanied by strengthening chain governance, but this time exercised by TNCs rather than parastatal marketing boards. The picture is well-summarised by Losch:
“The existence of an oligopoly of firms, the end of centralized/state-regulated supply systems, and the demand for world standard bulk cocoa, highlights a very strong erosion, or even the end, of ‘national supply’ and the notion of ‘producing country’ on the world cocoa market. The old national standards have now been replaced by grinders’ reputation for compliance with the (demanding) specifications of chocolate manufacturers (concerning timing, volume and quality)” (Losch, 2002: 225)
The contemporary cocoa chain is often characterised as one characterised by bi-polar governance (Figure 9). One pole arises from the concentrated amongst the grinders, who increasingly have operations in both producing and consuming countries, and in many links in the chain. The second pole are the large chocolate manufactures; but their operations are much more limited

25
along the chain, and their governance is much weaker than that of the grinders. In most cases it only extends to the relationship between the grinders and the chocolate manufacturers, with Nestle being the partial exception with limited operations in some producing countries.
Figure 9. Governance in the cocoa production chain, after Structural Adjustment Programmes (>2000)
seeds, inputs, extension
growing, fermentation and drying
beans
roasting
grinding
cocoa liquor
Cocoa butter cocoa powder
Chocolate manufacturing confectionary and drinks
Branding and marketing There is a key exception to this story of evolving chain governance and that is the case of Ghana. Unlike other cocoa producing countries, Ghana has systematically tried to protect its effective system of parastatal-based governance. As in other countries, a process of liberalisation began to unfold in Ghana in 1992. Until then all parts of the chain bar production were controlled by the state marketing board (Cocobod). The ultimate aim of this liberalisation was to either transfer these activities to state ministries or preferably to privatise them. But by 2001, only the marketing board’s monopsonistic buying had been removed, with about 10 active licensed buyers. All exporting remained with the marketing board, as have many of the governance functions such as extension and quality assurance. The consequence is Ghana’s distinctive quality performance. In the Ivory Coast,
Governance by TNC grinders Limited
governance by chocolate
manufacturers
26
cocoa quality has plummeted – in 2002, 30-40 percent of beans were of low quality, compared to the historic average of five percent (UNCTAD. 2003: 181). By contrast, Ghana has been able to sustain its quality performance and its coffee consequently earns a premium of around £60 per tonne. Perhaps more importantly the stability of this chain governance has meant that most of the cocoa is bought ahead by 8-16 months, reducing instability for the farmers. Nevertheless, the backward integration by TNCs into the producing countries has also surfaced in the case of Ghana. The search of grinders to maintain supplies in the context of political turmoil in neighbouring Ivory Coast has meant that there are a growing number of TNCs seeking to expand operations in Ghana, resulting in two joint ventures between the state marketing board (Cocobod) and foreign firms – one with a smaller German grinder, and the other with Barry Callebaut.
5. PRICE FORMATION
5.1. A brief summary of changes in governance structures in the coffee and cocoa chains Despite differences there is a commonality of developments in these two chains. In both cases, there is a marked growth in concentration, particularly at the downstream processing ends of the chain near to final markets. This mirrors a general trend in the food processing and retailing sector. In both cases also, after decades of arms-length relationships between growers, domestic-buyers and export agents, on the one hand, and international traders and near-to-market processors on the other, the links between the chain are becoming much stickier, and chain-governance becoming more prominent. The need for greater chain governance has different roots – in the coffee sector it is the need for quality, differentiated product and traceability, whereas in cocoa there is a concern to maintain supplies, as well as to ensure traceability (and to a diminished extent) quality. However, in both sectors, following Structural Adjustment Programmes, governance takes a new form, and is not located in producing country marketing boards, but in TNCs who are increasingly moving into operations formerly the province of producing-country based actors. Finally, as a consequence of the growing concentration of ownership at the downstream processing ends of the chain, and the abolition and/or weakening of the various forms of marketing boards, there hs been a growing asymmetry in these two chains – enhanced power at the downstream end, and diminished power at the upstream end. Accompanying these developments has been a sustained and significant deterioration in prices. Figure 10 shows the picture for coffee and Figure 11 for cocoa. In both cases we present nominal prices. Real terms of trade for these two commodities are even more adverse than these two graphs suggest, given the rise in the prices of many of the imports of coffee and cocoa producing countries over the period, and particularly during the 1980s and 1990s.

27
Figure 10. Average daily price of coffee ($cts/lb)
0
50
100
150
200
250
1965 1968 1971 1974 1977 1980 1983 1986 1989 1992 1995 1998
USct
s/lb
Source: Calculated from ICO Data Base Figure 11. Cocoa production and daily price (‘000 tonnes and $/tonne)
-
500
1,000
1,500
2,000
2,500
3,000
3,500
4,000
1960 1964 1968 1972 1976 1980 1984 1988 1992 1996 2000
$/tonne Production ('000 tonnes)
Source: Calculated from ICCO Quarterly Bulletin of Cocoa Statistics
5.2. Determinants of price formation Both of these sectors suffer from price volatility caused by natural events, including frosts and adverse rainfall. But, as we can see from Figures 10 and 11, they also suffer from a secular decline in prices over the long term, a process which tended to speed-up during the 1990s. The question is - what explains the sustained fall in prices? One view is that this is due to the low barriers to entry which characterise these two sectors in particular, and many commodities in general, and which result in oversupply. In the case of coffee,

28
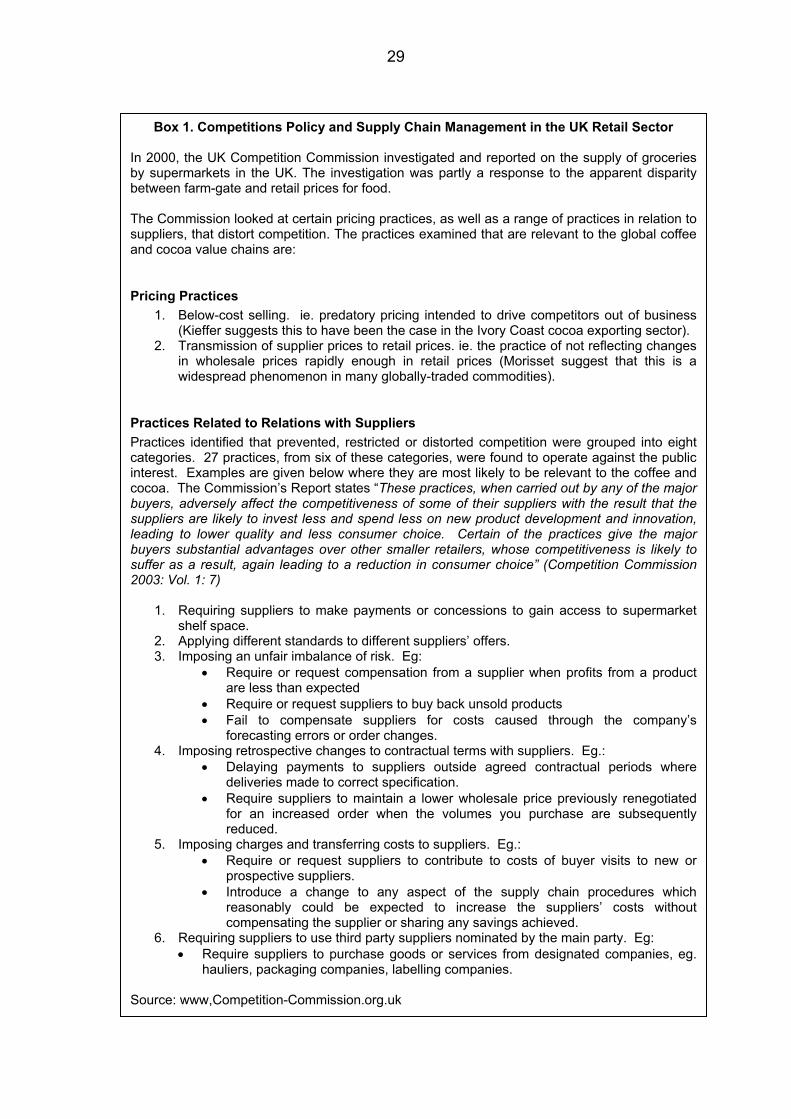
a key barrier to entry for many years were the International Coffee Agreements which limited supplies to the global market. In cocoa, the low barriers to entry became evident when the Ivory Coast tried to limit supplies on the global market in the late 1980s, and the gap was rapidly filled by other producers. But there is a further possible explanation which arises directly from the evolving structure of the value chains in these two sectors. It is that the increasing concentration of ownership and power at the downstream end of the chains, counterposed by the decreasing concentration of power at the upstream growing ends, leads to processes of price formation which explain the growing asymmetry of incomes in these two chains. As Morisset points out in his analysis of price formation in nine commodities (including coffee, but not cocoa), there appears to be a generalised process in which increases in commodity prices are passed on to final consumers by downstream processors, but this is not the case for decreases in commodity prices. Morisset remarks that “[e]xplanations for such patterns remain largely unexplored in the current economic literature” (Morisset, 1998: 520). The Common Fund for Commodities Report observes a similar case for coffee. It examined roasting margins in the US, France and Germany between 1985 and 1998. Although this period did not capture the sharp fall in prices during the late 1990s and early 2000’s, this was nevertheless a period in which coffee bean prices fell by more than 25 percent. In both France and the US the margins of coffee roasters rose by more than 50 percent; in Germany they fell slightly (Common Fund For Commodities, 2000: Diagram 1.5). As Morisset points out, the explanation for these developments is both unclear and largely unexplored. But it is possible that it may reflect a variety of practices by the key chain governors, particularly in the downstream links with buyers and growers. And, some of these practices may be of questionable legality. Kieffer suggests that in the Ivory Coast, local exporters were bought-up by TNCs as a consequence of a deliberate price-war instituted by the TNCs (Kieffer, 2000, cited in Losch, 2002: 224). Losch goes on to suggest that in the case of cocoa, the internalisation of chain operations within TNCs means that “collusive behaviour (tacit or formal) is rendered a priori possible” (Losch, 2002: 225). This is largely unexplored territory. However, the recent experience of a critical examination of governance in the UK retail-dominated food value chains suggests that within the supply-chain management techniques adopted by these chain-governors, there are a variety of practices which are questionable in terms of competitions law (Box 1). This being the case in the UK food retail sector, it would appear that there is a prima facie argument for a closer examination of these practices as they affect growers, traders and exporters in producing countries. This, however, requires a close examination of buying procedures and supply chain management in these producing countries, a challenge which does not yet appear to have been met.
29
Box 1. Competitions Policy and Supply Chain Management in the UK Retail Sector In 2000, the UK Competition Commission investigated and reported on the supply of groceries by supermarkets in the UK. The investigation was partly a response to the apparent disparity between farm-gate and retail prices for food. The Commission looked at certain pricing practices, as well as a range of practices in relation to suppliers, that distort competition. The practices examined that are relevant to the global coffee and cocoa value chains are:
Pricing Practices 1. Below-cost selling. ie. predatory pricing intended to drive competitors out of business
(Kieffer suggests this to have been the case in the Ivory Coast cocoa exporting sector). 2. Transmission of supplier prices to retail prices. ie. the practice of not reflecting changes
in wholesale prices rapidly enough in retail prices (Morisset suggest that this is a widespread phenomenon in many globally-traded commodities).
Practices Related to Relations with Suppliers Practices identified that prevented, restricted or distorted competition were grouped into eight categories. 27 practices, from six of these categories, were found to operate against the public interest. Examples are given below where they are most likely to be relevant to the coffee and cocoa. The Commission’s Report states “These practices, when carried out by any of the major buyers, adversely affect the competitiveness of some of their suppliers with the result that the suppliers are likely to invest less and spend less on new product development and innovation, leading to lower quality and less consumer choice. Certain of the practices give the major buyers substantial advantages over other smaller retailers, whose competitiveness is likely to suffer as a result, again leading to a reduction in consumer choice” (Competition Commission 2003: Vol. 1: 7)
1. Requiring suppliers to make payments or concessions to gain access to supermarket shelf space.
2. Applying different standards to different suppliers’ offers. 3. Imposing an unfair imbalance of risk. Eg:
• Require or request compensation from a supplier when profits from a product are less than expected
• Require or request suppliers to buy back unsold products • Fail to compensate suppliers for costs caused through the company’s
forecasting errors or order changes. 4. Imposing retrospective changes to contractual terms with suppliers. Eg.:
• Delaying payments to suppliers outside agreed contractual periods where deliveries made to correct specification.
• Require suppliers to maintain a lower wholesale price previously renegotiated for an increased order when the volumes you purchase are subsequently reduced.
5. Imposing charges and transferring costs to suppliers. Eg.: • Require or request suppliers to contribute to costs of buyer visits to new or
prospective suppliers. • Introduce a change to any aspect of the supply chain procedures which
reasonably could be expected to increase the suppliers’ costs without compensating the supplier or sharing any savings achieved.
6. Requiring suppliers to use third party suppliers nominated by the main party. Eg: • Require suppliers to purchase goods or services from designated companies, eg.
hauliers, packaging companies, labelling companies. Source: www,Competition-Commission.org.uk

30
REFERENCES Bell, R (2001), “Food retailing in the United Kingdom”, European Retail
Digest, Issue 28, 2001 Bell, R (2003), “Competition issues in European Grocery Retailing”, European
Retail Digest, Issue 39, 2003 Common Fund for Commodities, “Study of Marketing and Trading Policies
and Systems in Selected Coffee Producing Countries, Technical Paper No. 3, Amsterdam: Common Fund for Commodities.
Competition Commission (2000), Supermarkets: A report on the supply of groceries from multiple stores in the United Kingdom
Cotterill, R (1999a), Continuing Concentration in the US: Strategic Challenges to an Unstable Status Quo, Food Marketing Policy Centre, Research Report no 48, August 1999
Cotterill, R (1999b), Continuing Concentration in Food Industries Globally: Strategic Challenges to an Unstable Status Quo, Food Marketing Policy Centre, Research Report no 49, August 1999
Dobson, P (2002), Retailer Buyer Power in European Markets: Lessons from Grocery Supply, Business School Research Series, Paper 2002:1, June 2002, Loughborough University
Dorin, B (2003), From Ivorian cocoa bean to French dark chocolate tablet: Price transmission, value sharing and North/South competition policy, CIRAD Final Report, July 2003
Fitter, R. and R. Kaplinsky, (2001), “Who gains from product rents as the coffee market becomes more differentiated? A value chain analysis”, IDS Bulletin Special Issue on The Value of Value Chains, Vol. 32, No. 3, pp. 69-82.
Fold, N (2002), “Lead Firms and Competition in ‘Bi-polar’ Commodity Chains: Grinders and Branders in the Global Cocoa-chocolate Industry”, Journal of Agrarian Change, Vol 2 no 2, April 2002, pp 228-247
G. Gereffi and M. Korzeniewicz (eds.), Commodity Chains and Global Capitalism, London: Praeger.
Gereffi, G. (1994), “The Organization of Buyer-Driven Global Commodity Chains: How U. S. Retailers Shape Overseas Production Networks”, in
ICCO Quarterly Bulletin of Cocoa Statistics IDS Bulletin, (2001), Special Issue on The Value of Value Chains, Vol. 32,
No. 3, Kaplinsky, R. (2000), “Spreading the gains from globalisation: What can be
learned from value chain analysis?”, Journal of Development Studies, Vol. 37, No. 2., pp 117-146
Kaplinsky, R. and M. Morris (2001), A Handbook for Value Chain Research,

31
www.ids.ac.uk/ids/global/valchn.html#manuals Kaplinsky, R. and M. Morris (2001), A Handbook for Value Chain Research,
www.ids.ac.uk/ids/global/valchn.html#manuals Kaplinsky, R. (forthcoming), Between a Rock and a Hard Place: Globalisation,
Poverty and Inequality, (under preparation). Kieffer, G. A. (2000), “Cargill relance la Guerre du Cacao en Cote d’Ivoire”, La
Tribune, 11 November. Losch, B (2002), “Global Restructuring and Liberalisation: Cote d’Ivoire and
the End of the International Cocoa Market”, Journal of Agrarian Change, Vol 2, no 2, April 2002, pp206-227
McCorriston, S (2003), Imperfect Competition and International Agricultural Commodity Markets, paper prepared for FAO Symposium, December 2003
Montavon, R. (1994), Nestle and the Buying of Green Coffee, Vevey: Nestle S. A.
Porter, M. E (1990), The Competitive Advantage of Nations, London: Macmillan.
Nadvi, K. (2004,), “The effect of global standards on local producers”, in H.
Schmitz (ed.) (2004), Local Enterprise in the Global Economy: Issues of Governance and Upgrading, Cheltenham: Edward Elgar.
Talbot, J (2002), “Tropical commodity chains, forward integration strategies and international inequality: coffee, cocoa and tea”, Review of International Political Economy, 9:4 November 2002, pp 701-734
USDA Economic Research Service (2000), “Consolidation in Food Retailing: Prospects for Consumers & Grocery Suppliers”, Agricultural Outlook, August, pp 18-22.
Vorley, B (2003), Food, Inc.: Corporate concentration from farm to consumer, UK Food Group, International Institute for Environment and Development, 2003
Wrigley, N (2001), “Transforming the Corporate Landscape of US Food Retailing: Market Power, Financial Re-engineering and Regulation”, Tijdschrift voor Economische en Sociale Geografie, 2002, Vol 93, No 1, pp62-82