Compendium of WHS and workers' compensation · PDF file2 COMCARE Compendium of WHS and...
58
COMPENDIUM OF WHS AND WORKERS’ COMPENSATION STATISTICS March 2015 6th Edition
Transcript of Compendium of WHS and workers' compensation · PDF file2 COMCARE Compendium of WHS and...

COMPENDIUM OF WHS ANDWORKERS’ COMPENSATIONSTATISTICS
March 2015
6th Edition

2 COMCARE Compendium of WHS and Workers’ Compensation Statistics (version 1.1)
DISCLAIMER
This information is for guidance only and is not to be taken as an expression of the law. It should be read in conjunction with the relevant legislation. For more information contact your local workplace health and safety authority.
PUBLICATION DETAILS
Published by Comcare
© Commonwealth of Australia 2015
All material presented in this publication is provided under a Creative Commons Attribution 3.0 Australia
(http://creativecommons.org/licenses/by/3.0/au/deed.en) licence.
For the avoidance of doubt, this means this licence only applies to material as set out in this document.
The details of the relevant licence conditions are available on the Creative Commons website (accessible using the links provided) as is the full legal code for the CC BY 3.0 AU licence (http://creativecommons.org/licenses/by/3.0/legalcode).
USE OF THE COAT OF ARMS
The terms under which the Coat of Arms can be used are detailed on the It’s an Honour website (http://www.itsanhonour.gov.au/coat-arms/index.cfm).
CONTACT US
Inquiries regarding the licence and any use of this document are welcome at:
Communications and Media Comcare GPO Box 9905 Canberra ACT 2601
Ph: 1300 366 979 Email: [email protected] www.comcare.gov.au
Version Detail Date
1.0 Initial release April 2015
1.1 Minor correction to labels Figure 4.13Minor amendments to commentary in Section 4.4.3Corrections to Table 4.4
July 2015
COMCARE Compendium of WHS and Workers’ Compensation Statistics (version 1.1) 3
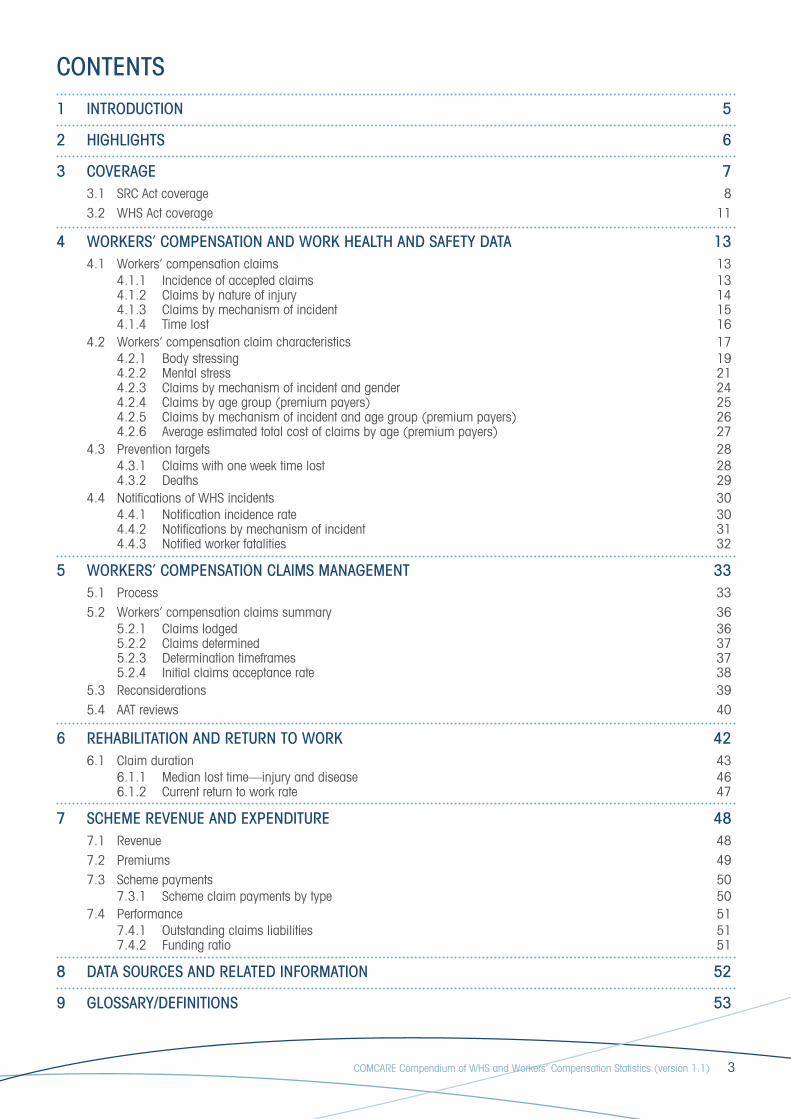
CONTENTS
1 INTRODUCTION 5
2 HIGHLIGHTS 6
3 COVERAGE 73.1 SRC Act coverage 83.2 WHS Act coverage 11
4 WORKERS’ COMPENSATION AND WORK HEALTH AND SAFETY DATA 134.1 Workers’ compensation claims 13
4.1.1 Incidence of accepted claims 134.1.2 Claims by nature of injury 144.1.3 Claims by mechanism of incident 154.1.4 Time lost 16
4.2 Workers’ compensation claim characteristics 174.2.1 Body stressing 194.2.2 Mental stress 214.2.3 Claims by mechanism of incident and gender 244.2.4 Claims by age group (premium payers) 254.2.5 Claims by mechanism of incident and age group (premium payers) 264.2.6 Average estimated total cost of claims by age (premium payers) 27
4.3 Prevention targets 284.3.1 Claims with one week time lost 284.3.2 Deaths 29
4.4 Notifications of WHS incidents 304.4.1 Notification incidence rate 304.4.2 Notifications by mechanism of incident 314.4.3 Notified worker fatalities 32
5 WORKERS’ COMPENSATION CLAIMS MANAGEMENT 335.1 Process 335.2 Workers’ compensation claims summary 36
5.2.1 Claims lodged 365.2.2 Claims determined 375.2.3 Determination timeframes 375.2.4 Initial claims acceptance rate 38
5.3 Reconsiderations 395.4 AAT reviews 40
6 REHABILITATION AND RETURN TO WORK 426.1 Claim duration 43
6.1.1 Median lost time—injury and disease 466.1.2 Current return to work rate 47
7 SCHEME REVENUE AND EXPENDITURE 487.1 Revenue 487.2 Premiums 497.3 Scheme payments 50
7.3.1 Scheme claim payments by type 507.4 Performance 51
7.4.1 Outstanding claims liabilities 517.4.2 Funding ratio 51
8 DATA SOURCES AND RELATED INFORMATION 52
9 GLOSSARY/DEFINITIONS 53
4 COMCARE Compendium of WHS and Workers’ Compensation Statistics (version 1.1)
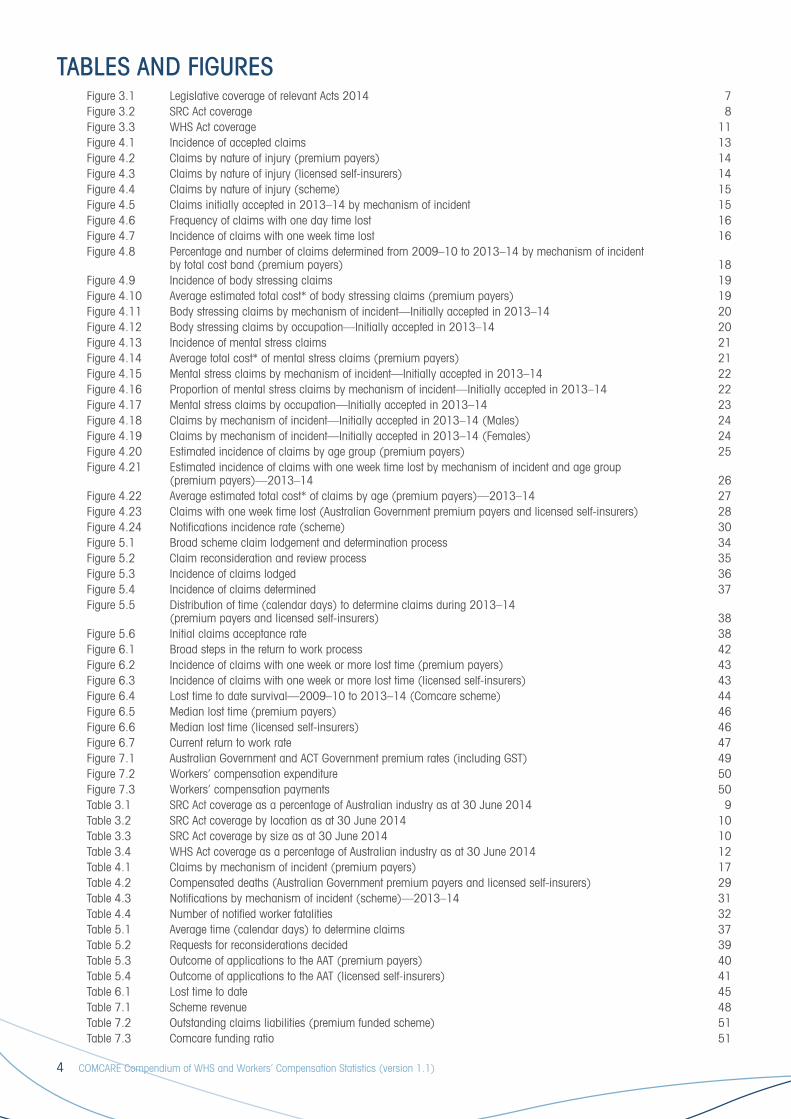
TABLES AND FIGURESFigure 3.1 Legislative coverage of relevant Acts 2014 7Figure 3.2 SRC Act coverage 8Figure 3.3 WHS Act coverage 11Figure 4.1 Incidence of accepted claims 13Figure 4.2 Claims by nature of injury (premium payers) 14Figure 4.3 Claims by nature of injury (licensed self-insurers) 14Figure 4.4 Claims by nature of injury (scheme) 15Figure 4.5 Claims initially accepted in 2013–14 by mechanism of incident 15Figure 4.6 Frequency of claims with one day time lost 16Figure 4.7 Incidence of claims with one week time lost 16Figure 4.8 Percentage and number of claims determined from 2009–10 to 2013–14 by mechanism of incident by total cost band (premium payers) 18Figure 4.9 Incidence of body stressing claims 19Figure 4.10 Average estimated total cost* of body stressing claims (premium payers) 19Figure 4.11 Body stressing claims by mechanism of incident—Initially accepted in 2013–14 20Figure 4.12 Body stressing claims by occupation—Initially accepted in 2013–14 20Figure 4.13 Incidence of mental stress claims 21Figure 4.14 Average total cost* of mental stress claims (premium payers) 21Figure 4.15 Mental stress claims by mechanism of incident—Initially accepted in 2013–14 22Figure 4.16 Proportion of mental stress claims by mechanism of incident—Initially accepted in 2013–14 22Figure 4.17 Mental stress claims by occupation—Initially accepted in 2013–14 23Figure 4.18 Claims by mechanism of incident—Initially accepted in 2013–14 (Males) 24Figure 4.19 Claims by mechanism of incident—Initially accepted in 2013–14 (Females) 24Figure 4.20 Estimated incidence of claims by age group (premium payers) 25Figure 4.21 Estimated incidence of claims with one week time lost by mechanism of incident and age group (premium payers)—2013–14 26Figure 4.22 Average estimated total cost* of claims by age (premium payers)—2013–14 27Figure 4.23 Claims with one week time lost (Australian Government premium payers and licensed self-insurers) 28Figure 4.24 Notifications incidence rate (scheme) 30Figure 5.1 Broad scheme claim lodgement and determination process 34Figure 5.2 Claim reconsideration and review process 35Figure 5.3 Incidence of claims lodged 36Figure 5.4 Incidence of claims determined 37Figure 5.5 Distribution of time (calendar days) to determine claims during 2013–14 (premium payers and licensed self-insurers) 38Figure 5.6 Initial claims acceptance rate 38Figure 6.1 Broad steps in the return to work process 42Figure 6.2 Incidence of claims with one week or more lost time (premium payers) 43Figure 6.3 Incidence of claims with one week or more lost time (licensed self-insurers) 43Figure 6.4 Lost time to date survival—2009–10 to 2013–14 (Comcare scheme) 44Figure 6.5 Median lost time (premium payers) 46Figure 6.6 Median lost time (licensed self-insurers) 46Figure 6.7 Current return to work rate 47Figure 7.1 Australian Government and ACT Government premium rates (including GST) 49Figure 7.2 Workers’ compensation expenditure 50Figure 7.3 Workers’ compensation payments 50Table 3.1 SRC Act coverage as a percentage of Australian industry as at 30 June 2014 9Table 3.2 SRC Act coverage by location as at 30 June 2014 10Table 3.3 SRC Act coverage by size as at 30 June 2014 10Table 3.4 WHS Act coverage as a percentage of Australian industry as at 30 June 2014 12Table 4.1 Claims by mechanism of incident (premium payers) 17Table 4.2 Compensated deaths (Australian Government premium payers and licensed self-insurers) 29Table 4.3 Notifications by mechanism of incident (scheme)—2013–14 31Table 4.4 Number of notified worker fatalities 32Table 5.1 Average time (calendar days) to determine claims 37Table 5.2 Requests for reconsiderations decided 39Table 5.3 Outcome of applications to the AAT (premium payers) 40Table 5.4 Outcome of applications to the AAT (licensed self-insurers) 41Table 6.1 Lost time to date 45Table 7.1 Scheme revenue 48Table 7.2 Outstanding claims liabilities (premium funded scheme) 51Table 7.3 Comcare funding ratio 51

COMCARE Compendium of WHS and Workers’ Compensation Statistics (version 1.1) 5
1 INTRODUCTIONComcare was established as a body under the Safety, Rehabilitation and Compensation Act 1988 (SRC Act) and reports to the responsible Minister. Comcare administers both the Commonwealth’s statutory framework for rehabilitation and workers’ compensation under the SRC Act, and is the regulator under the Work Health Safety Act 2011 (Cth) (WHS Act).
The Comcare scheme is a national safety, rehabilitation and workers’ compensation system that covers the Australian Government, the Australian Capital Territory (ACT) Government and licensed self-insurers.
Comcare partners with workers, their employers and unions to keep workers healthy and safe and reduce the incidence and cost of workplace injury and disease. There are three outcomes that guide Comcare:
> Outcome 1: The protection of the health, safety and welfare at work of workers covered by the Comcare scheme through education, assurance and enforcement.
> Outcome 2: An early and safe return to work and access to compensation for injured workers covered by the Comcare scheme through working in partnership with employers to create best practice in rehabilitation and quick and accurate management of workers’ compensation claims.
> Outcome 3: Access to compensation for people with asbestos-related diseases where the Commonwealth has a liability through the management of claims.
Scheme performance information presented in this Compendium has been compiled from a variety of sources including workers’ compensation claims, WHS incident notifications, survey data and financial reports. Claims based data can be subject to development and performance information and may therefore be updated when reported in future editions of this Compendium.

6 COMCARE Compendium of WHS and Workers’ Compensation Statistics (version 1.1)
2 HIGHLIGHTS
Over the five years to 30 June 2014, the Comcare scheme experienced:
> a 19 per cent reduction in the incidence of accepted claims
> a six per cent decrease in the number of full-time equivalent (FTE) employees covered by the SRC Act
> a five per cent decrease in the number of FTE employees covered by the WHS Act.
In 2013–14, the Comcare scheme recorded the lowest standardised average premium rate in Australia for 2012–13 (Comparative Performance Monitoring Report, Sixteenth Edition, 2014).

COMCARE Compendium of WHS and Workers’ Compensation Statistics (version 1.1) 7
3 COVERAGEFigure 3.1 provides an overview of the Comcare scheme and shows the differences in coverage between the SRC Act and the WHS Act.
The WHS Act covers premium payers, licensed self-insurers and the Australian Defence Force (ADF). Since 1 July 2004 ADF members have been covered for workers’ compensation by the Military Rehabilitation and Compensation Act 2004 (MRC Act).
The SRC Act covers Australian Government and ACT Government premium payers and licensed self-insurers.
Figure 3.1 Legislative coverage of relevant Acts 2014Commonwealth safety, rehabilitation and compensation scheme
SRC Act4 SRCC/Comcare
co-regulators
As at November 2014
WHS Act1 Comcare regulator
MRC Act3 MRCC regulator
ARC Act2Comcare manages
the Commonwealth’s asbestos claims
> Employer protects health and safety of its employees at work
> Employer manages claims
> Employer meets liabilities
> Employer protects health and safety of its employees at work
> Comcare delivers recovery and support services
> Comcare meets liabilities
> Employer manages rehabilitation
> Employer manages rehabilitation
Discharging of liabilities
* Pre 2004 injuries determined under the SRC Act
Defence manages rehabilitation
> DVA manages claims*
> DVA meets liabilities
> Defence manages rehabilitation
Licensed self-insurers157 000 FTE
ACT Government premium payers
21 000 FTE
Australian Government
premium payers193 000 FTE
Commonwealth public authorities
covered only by the WHS Act 5000 FTE
Australian Defence Force
62 000 FTE5
Duties of care
1. Work Health and Safety Act 2011.
2. Asbestos-related Claims (Management of Commonwealth Liabilities) Act 2005.
3. Military Rehabilitation and Compensation Act 2004.
4. Safety, Rehabilitation and Compensation Act 1988.
5. ADF coverage estimated includes reservist and cadets on a FTE basis consistent with other coverage estimates as at 22 September 2014. Previously this component of the ADF had been included on a headcount basis. This change has resulted in a lower coverage estimate for this sector of Comcare’s WHS jurisdiction.
Commonwealth safety, rehabilitation and compensation scheme
SRC Act4 SRCC/Comcare
co-regulators
As at November 2014
WHS Act1 Comcare regulator
MRC Act3 MRCC regulator
ARC Act2Comcare manages
the Commonwealth’s asbestos claims
> Employer protects health and safety of its employees at work
> Employer manages claims
> Employer meets liabilities
> Employer protects health and safety of its employees at work
> Comcare delivers recovery and support services
> Comcare meets liabilities
> Employer manages rehabilitation
> Employer manages rehabilitation
Discharging of liabilities
* Pre 2004 injuries determined under the SRC Act
Defence manages rehabilitation
> DVA manages claims*
> DVA meets liabilities
> Defence manages rehabilitation
Licensed self-insurers157 000 FTE
ACT Government premium payers
21 000 FTE
Australian Government
premium payers193 000 FTE
Commonwealth public authorities
covered only by the WHS Act 5000 FTE
Australian Defence Force
62 000 FTE5
Duties of care
1. Work Health and Safety Act 2011.
2. Asbestos-related Claims (Management of Commonwealth Liabilities) Act 2005.
3. Military Rehabilitation and Compensation Act 2004.
4. Safety, Rehabilitation and Compensation Act 1988.
5. ADF coverage estimated includes reservist and cadets on a FTE basis consistent with other coverage estimates as at 22 September 2014. Previously this component of the ADF had been included on a headcount basis. This change has resulted in a lower coverage estimate for this sector of Comcare’s WHS jurisdiction.

8 COMCARE Compendium of WHS and Workers’ Compensation Statistics (version 1.1)
3.1 SRC ACT COVERAGE
The Comcare scheme covers a relatively small number of employers and employees (compared to state and territory schemes) with a large geographic span. This section summarises scheme demographics including industry classification, employer size and the geographical location of employers covered by the SRC Act.
Figure 3.2 shows the number of full time equivalent (FTE) employees covered by the SRC Act as at 30 June 2014.
The Comcare scheme includes all Australian and ACT Government premium payers and licensed self-insurers. Section 100 of the SRC Act enables the Minister for Employment to declare a corporation eligible to be granted a self-insurance licence if satisfied that the corporation:
a) is, but is about to cease to be, a Commonwealth authority; or
b) was previously a Commonwealth authority; or
c) is carrying on business in competition with a Commonwealth authority or with another corporation that was previously a Commonwealth authority.
As at 30 June 2014 there were 29 licensed self-insurers in the Comcare scheme with Colonial First State Property Management leaving the scheme in March 2014.
As at 30 June 2014, there were approximately 371 000 FTE employees covered by the SRC Act, which is approximately three per cent of all employed persons in Australia1. There were 214 000 FTE employees from premium payers (including the ACT Government) and 157 000 from licensed self-insurers. This represents a six per cent decrease in the number of FTE employees covered by the SRC Act since 30 June 2010. As at 30 June 2014, licensed self-insurers accounted for around 40 per cent of total FTE employees covered by the SRC Act.
Figure 3.2 SRC Act coverage
1 ABS catalogue 6202-0, Labour Force, Australia, July 2014.
500
400
300
200
100
02010 2011 2012 2013 2014
Premium payers Licensed self-insurers
As at 30 June
Num
ber o
f FTE
em
ploy
ees
(’00
0)
42% 42% 41% 41%42%
58% 58% 59% 59%58%

COMCARE Compendium of WHS and Workers’ Compensation Statistics (version 1.1) 9
Table 3.1 provides a breakdown of FTE employees covered under the SRC Act by ANZSIC2 industrial classification as a percentage of all Australian industry as at 30 June 2014.
The data shows that the SRC Act coverage is three per cent of all Australian industry. The highest proportion are employed in the ‘Information media and telecommunications’ industry (25.5 per cent) followed by those employed in the ‘Public administration and safety’ industry (18.8 per cent) and ‘Financial and insurance services’ industry (14.8 per cent).
Table 3.1 SRC Act coverage as a percentage of Australian industry as at 30 June 2014
Industry
Comcare scheme FTE at 30 June 2014Australian
industry FTE at November
2013‘000
Comcare as percentage of total industry
Australian and ACT
Government‘000
Licensed self-insurers
‘000
Comcare scheme‘000
Information media and telecommunications 9.4 39.2 48.6 190 25.5%
Public administration and safety 154.2 0.7 154.9 826 18.8%
Financial and insurance services 3.3 55.6 58.9 397 14.8%
Transport, postal and warehousing 6.2 46.1 52.3 598 8.7%
Professional, scientific and technical services 16.5 0.2 16.7 880 1.9%
Education and training 11.1 0 11.1 908 1.2%
Health care and social assistance 9.9 0 9.9 1418 0.7%
Manufacturing 0.4 4.8 5.2 949 0.5%
Construction 0 4.6 4.6 1027 0.4%
All other industries 2.9 5.3 8.2 4442 0.2%
All industries 214 157 371 11 636 3.2%
Notes:1. All other industries includes: Accommodation and food services, Administration and support services, Arts and recreation services,
Electricity, gas, water and waste services, Other services, Rental, hiring and real estate services and Wholesale trade.2. Australian industry FTE estimate includes ADF.3. Australian industry FTE source: ABS 6105.0 Australian Labour Market Statistics.4. Totals may not sum from components due to rounding.
2 ANZSIC 2006—Australian & New Zealand Standard Industrial Classification (ANZSIC) 2006 (ABS cat no. 1292.0)

10 COMCARE Compendium of WHS and Workers’ Compensation Statistics (version 1.1)
Table 3.2 shows the geographic distribution of employees covered by the SRC Act across all Australian states and territories as at 30 June 2014. Comcare has offices in each capital city (except Hobart and Darwin) and in Newcastle to service the needs of the scheme. Comcare officers travel to worksites across Australia and internationally as required conducting audits, inspections and investigations, providing training and advice and assisting in issue resolution.
Table 3.2 SRC Act coverage by location as at 30 June 2014
State Premium payers (‘000)
Licensed self-insurers
(‘000)Total
(‘000)% of Total
New South Wales 43.0 59.3 102.3 27.6
Victoria 34.3 52.2 86.5 23.3
Queensland 22.3 19.6 41.9 11.3
South Australia 12.2 7.9 20.2 5.4
Western Australia 9.3 12.0 21.2 5.7
Tasmania 4.0 2.3 6.2 1.7
Northern Territory 24.9 1.2 26.1 7.0
Australian Capital Territory 64.5 2.3 66.7 18.0
Total 214 157 371 100%
Note:1. Totals may not sum from components due to rounding.
Table 3.3 provides a breakdown of employers covered by the SRC Act according to employer size (small, medium and large) as at 30 June 2014.
Approximately 99 per cent of employees from licensed self-insurers worked for large employers.
Table 3.3 SRC Act coverage by size as at 30 June 2014
Employer sizePremium payers Licensed self-insurers Scheme
Number % of total Number % of total Number % of total
Small(less than 100 FTE employees)
Employers 73 35.4% 0 0.0% 73 30.9%
FTE employees 3000 1.4% 0 0.0% 3000 0.8%
Medium(100 to 499 FTE employees)
Employers 69 33.5% 6 20.0% 75 31.8%
FTE employees 16 000 7.5% 2000 1.3% 18 000 4.9%
Large(500 or more FTE employees)
Employers 64 31.1% 24 80.0% 88 37.3%
FTE employees 195 000 91.1% 155 000 98.7% 350 000 94.3%
All employersEmployers 206 100% 30 100% 236 100%
FTE employees 214 000 100% 157 000 100% 371 000 100%
Note:
1. Totals may not sum from components due to rounding.

COMCARE Compendium of WHS and Workers’ Compensation Statistics (version 1.1) 11
3.2 WHS ACT COVERAGE
Figure 3.3 shows the total number of FTE employees covered by the Occupational Health and Safety Act 1991 (OHS Act) and the WHS Act between 30 June 2010 and 30 June 2014.
Employers covered by the OHS and WHS Acts include the Australian Government premium payers, licensed self-insurers and the Australian Defence Force (ADF). Employers covered by the WHS Act pay an annual contribution for the regulatory, policy and advisory functions administered by Comcare.
As at 30 June 2014, approximately 418 000 FTE employees were covered under the WHS Act. This coverage consisted of 199 000 FTE employees from the Australian Government, 157 000 from licensed self-insurers, and 62 000 from the ADF, representing a five per cent decrease in the number of FTE employees covered since 30 June 2010.
Figure 3.3 WHS Act coverage
500
400
300
200
100
02010
Australian Government Licensed self-insurers
Num
ber o
f FTE
em
ploy
ees
(’00
0)
2011 2012 2013 2014
17%
36%
47%
17%
36%
47%
17%
36%
47%
17%
35%
48%
15%
38%
47%
ADF
As at 30 June

12 COMCARE Compendium of WHS and Workers’ Compensation Statistics (version 1.1)
Table 3.4 provides a breakdown of FTE employees covered under the WHS Act by ANZSIC3 industrial classification as a percentage of all Australian industry as at 30 June 2014.
The data shows that the Comcare scheme’s WHS jurisdiction covers four per cent of all Australian industry. The highest proportion being employed in the ‘Information media and telecommunications’ industry and the ‘Public administration and safety’ industry (each with 25.5 per cent) followed by those employed in the ‘Financial and insurance services’ industry (14.8 per cent).
Table 3.4 WHS Act coverage as a percentage of Australian industry as at 30 June 2014
Industry
Comcare WHS Jurisdiction FTE at 30 June 2014Australian
Industry FTE at November
2013‘000
Comcare as percentage of total industry
Australian Gov’t FTE*
‘000
Licensed self-insurers
‘000ADF‘000
Comcare WHS
Jurisdiction‘000
Public administration and safety 148.1 0.7 62 210.8 826 25.5%
Financial and insurance services 3.3 55.6 58.9 397 14.8%
Transport, postal and warehousing 6.2 46.1 52.3 598 8.7%
Information media and telecommunications 9.4 39.2 48.6 190 25.5%
Professional, scientific and technical services 16.4 0.3 16.7 880 1.9%
Manufacturing 5 4.9 9.9 949 1.0%
All other industries 4.8 5.3 10.1 4 442 0.2%
Construction 0 4.7 4.7 1 027 0.5%
Education and training 4.4 0.0 4.4 908 0.5%
Health care and social assistance 1.7 0.0 1.7 1 418 0.1%
All industries 199 157 62 418 11 636 3.6%
Notes:1. All other industries includes: Accommodation and food services, Administration and support services, Arts and recreation services,
Electricity, gas, water and waste services, Other services, Rental, hiring and real estate services and Wholesale trade.2. Australian industry FTE estimate includes ADF.3. Totals may not sum from components due to rounding.4. *includes a small number of employees within prescribed Australian Government entities.5. ADF coverage estimated includes reservist and cadets on a FTE basis consistent with other coverage estimates as at 22 September 2014.
Previously this component of the ADF had been included on a headcount basis. This change has resulted in a lower coverage estimate for this sector of Comcare’s WHS jurisdiction.
3 ANZSIC 2006—Australian & New Zealand Standard Industrial Classification (ANZSIC) 2006 (ABS cat no. 1292.0)

COMCARE Compendium of WHS and Workers’ Compensation Statistics (version 1.1) 13
4 WORKERS’ COMPENSATION AND WORK HEALTH AND SAFETY DATA
The data in this section is sourced from workers’ compensations claims lodged under the SRC Act and notifiable WHS incidents.
4.1 WORKERS’ COMPENSATION CLAIMS
Comcare maintains a data warehouse on behalf of the Safety, Rehabilitation and Compensation Commission (SRCC) which contains unit claims data supplied by licensed self-insurers and Comcare for all claims lodged under the SRC Act. The records include, but are not limited to, occurrence details, incapacity determinations, claim payments, medical, rehabilitation and disputation data. The data warehouse does not contain data for pre-2004 Defence Force claims managed by the Department of Veterans’ Affairs.
While total claim costs and estimates of outstanding liability are available for claims managed by Comcare, only actual claim payments are recorded for claims managed by licensed self-insurers. As a result, it is not possible to report aggregate scheme data relating to total claims costs within this Compendium.
4.1.1 Incidence of accepted claims
Figure 4.1 shows the incidence of claims accepted during the period 2009–10 to 2013–14 for premium payers, licensed self-insurers and for the overall scheme.
There has been a reduction of approximately 15 per cent in the incidence of claims accepted across the scheme since 2009–10. In the most recent period, the incidence of claims accepted by licensed self-insurers remained higher than that of the premium payers.
In 2013–14, licensed self-insurers accepted approximately 24 claims per 1000 FTE employees, compared to approximately 14 claims per 1000 FTE employees for premium payers.
Figure 4.1 Incidence of accepted claims
40
35
30
25
20
15
10
5
02009–10 2010–11 2011–12 2012–13 2013–14
Premium payers Licensed self-insurers
Year of initial determination
Clai
ms
per 1
000
FTE
empl
oyee
s
12.9
33.8
14.1
30.8
14.3
32.5
13.3
26.224.3
Scheme
14.1

14 COMCARE Compendium of WHS and Workers’ Compensation Statistics (version 1.1)
4.1.2 Claims by nature of injury
Figures 4.2, 4.3 and 4.4 show the incidence of claims accepted during the period 2009–10 to 2013–14 by condition claimed. Workers’ compensation claims are coded using the Type of Occurrence Classification System (TOOCS). See the glossary for more information.
An injury is generally the result of a single identifiable incident, such as tripping over a bin at work or having a heart attack, whilst a disease usually results from repeated or long-term exposure to an agent or event, such as repetitive typing or driving for long periods in a static position. Under the SRC Act, psychological conditions are determined using the disease provisions.
The scheme has observed a decrease in the incidence of injury claims but increases in both disease and psychological claims between 2009–10 and 2013–14.
Since 2009–10, premium payers have shown a decrease in injury claims but an increase in both disease and psychological claims, while licensed self-insurers show a decrease in all categories.
Figure 4.2 Claims by nature of injury (premium payers)
Figure 4.3 Claims by nature of injury (licensed self-insurers)
20
18
16
14
12
10
8
6
4
2
02009–10 2010–11 2011–12 2012–13 2013–14
Year of initial determination
Clai
ms
per 1
000
FTE
empl
oyee
s
Injury Disease Psychological
36%
54%
41% 36%36% 37%
46%52% 47% 47%
10%13% 12%
17% 16%
40
35
30
25
20
15
10
5
02009–10 2010–11 2011–12 2012–13 2013–14
Injury Disease
Year of initial determination
Clai
ms
per 1
000
FTE
empl
oyee
s
Psychological
21%
77%
67% 65% 71%
2%
31%
2%
33%
2%
27%
2%
25%
1%
74%

COMCARE Compendium of WHS and Workers’ Compensation Statistics (version 1.1) 15
Figure 4.4 Claims by nature of injury (scheme)
4.1.3 Claims by mechanism of incident
Figure 4.5 shows the per-centage of claims by mechanism of incident for claims accepted during 2013–14 for both premium payers and licensed self-insurers. The mechanism of incident identifies the overall action, exposure or event that best describes the circumstances that resulted in the most serious injury or disease.
Body stressing was the most prevalent mechanism of incident over the reporting period. During 2013–14 around half of all accepted claims for both premium payers and licensed self-insurers were due to body stressing. Falls, trips and slips also represented a significant proportion of claims, accounting for 19 per cent of both premium payers’ and licensed self-insurers’ claims. Being hit by moving objects accounted for nine per cent of premium payers’ and 11 per cent of licensed self-insurers’ claims.
Mental stress was a significant cause of claims for premium payers, accounting for 16 per cent of claims, compared to two per cent of claims for licensed self-insurers.
Figure 4.5 Claims initially accepted in 2013–14 by mechanism of incident
60
50
40
30
20
10
02009–10 2010–11 2011–12 2012–13 2013–14
Injury Disease
Year of initial determination
Clai
ms
per 1
000
FTE
empl
oyee
s
Psychological
26%
69%
59% 60% 61%
5%
35%
6%
34%
6%
31%
8%
30%
8%
62%
50%
45%
40%
35%
30%
25%
20%
15%
10%
5%
0%Body
stressingFalls, tripsand slips
Mentalstress
Hit bymovingobjects
Hittingobjects with
body
Vehicleincidentsand other
Mechanism of incident
All other
Perc
enta
ge o
f acc
epte
d cl
aim
s 45%
19% 19%
46%
16%
9% 11%
3% 6% 3%
12%
5% 4%2%
Premium payers Licensed self-insurers

16 COMCARE Compendium of WHS and Workers’ Compensation Statistics (version 1.1)
4.1.4 Time lost
Figure 4.6 shows the frequency of claims that first reached one day time lost during the period 2009–10 to 2013–14.
In 2013–14, the scheme recorded 6.6 claims with one day time lost per million hours worked—a similar result has been experienced since 2009–10. The higher frequency rate recorded by licensed self-insurers reflects, in part, differences in risk profile between premium payers and licensed self-insurers.
Figure 4.6 Frequency of claims with one day time lost
Figure 4.7 shows the incidence rate of claims that first reached one week time lost during the period 2009–10 to 2013–14.
Since 2009–10, the incidence rate of claims that reached one week time lost increased by seven per cent for premium payers and decreased by 11 per cent for licensed self-insurers.
Figure 4.7 Incidence of claims with one week time lost
12
10
8
6
4
2
02009–10 2010–11 2011–12 2012–13 2013–14
Premium payers Licensed self-insurers
Year claim reached 1 day incapacity
Clai
ms
per m
illio
n ho
urs
wor
ked
5.1
7.8
5.0
7.9
4.9
7.7
5.1
7.1
5.0
6.6
Scheme
12
10
8
6
4
2
02009–10 2010–11 2011–12 2012–13 2013–14
Premium payers Licensed self-insurers
Year claim reached 1 week incapacity
Clai
ms
per 1
000
FTE
empl
oyee
s
7.5
9.5
7.7
9.5
7.5
10.0
8.09.0
8.0 8.5
Scheme

COMCARE Compendium of WHS and Workers’ Compensation Statistics (version 1.1) 17
4.2 WORKERS’ COMPENSATION CLAIM CHARACTERISTICS
Table 4.1 shows, for claims accepted during the period 2009–10 to 2013–14, a breakdown of total cost (cost to date plus estimated outstanding liability) by mechanism of incident. The data below covers premium payers only as total claim costs are not available for licensed self-insurers. It should be noted that the average total cost per claim is an estimate which may change as the claims mature.
During the period 2009–10 to 2013–14, body stressing injuries/diseases accounted for 46 per cent of all claims for premium payers and 34 per cent of total cost with an average total cost per claim of approximately $64 000. During 2013–14 body stressing injuries/diseases represented 45 per cent of claims and 38 per cent of total cost, with an average total cost per claim of approximately $129 000.
Between 2009–10 to 2013–14 mental stress claims accounted for 13 per cent of all claims, however these claims represented 43 per cent of total cost, with an average total cost per claim of approximately $291 000. During 2013–14, mental stress claims accounted for 16 per cent of all claims and 37 per cent of total claim costs, with an average total cost per claim of $342 000.
Table 4.1 Claims by mechanism of incident (premium payers)
Mechanism of incident % of all accepted claims % of total claim costs* Average total cost per claim ($)
2009–10 to 2013–14**
Body stressing 46% 34% 64 000
Falls, trips and slips 20% 11% 49 000
Mental stress 13% 43% 291 000
Hit by moving objects 8% 4% 46 000
Hitting objects with the body 4% 2% 33 000
Vehicle incidents and other 3% 3% 78 000
Sound and pressure 2% Less than 1% 24 000
Chemicals and other substances 2% 3% 119 000
Heat, radiation and electricity 1% Less than 1% 42 000
Biological factors Less than 1% Less than 1% 68 000
All mechanisms of incident 100% 100% 88 000
12 months to 30 June 2014**
Body stressing 45% 38% 129 000
Falls, trips and slips 19% 13% 108 000
Mental stress 16% 37% 342 000
Hit by moving objects 9% 5% 92 000
Hitting objects with the body 3% 1% 56 000
Vehicle incidents and other 3% 3% 151 000
Sound and pressure 2% Less than 1% 49 000
Chemicals and other substances 2% Less than 1% 87 000
Heat, radiation and electricity Less than 1% Less than 1% 79 000
Biological factors Less than 1% Less than 1% 166 000
All mechanisms of incident 100% 100% 152 000
* Total cost is the cost to date plus estimated outstanding liability (estimated at May 2014).** Year of initial determination.

18 COMCARE Compendium of WHS and Workers’ Compensation Statistics (version 1.1)
Figure 4.8 shows the distribution of costs of claims for the three most common categories and all claims during 2009–10 to 2013–14.
> Six per cent of claims had a total cost of more than $500 000 with 33 per cent of these claims costing less than $5000.
> Twenty-two per cent of mental stress claims had a total cost of more than $500 000 while only seven per cent of these claims have a cost of less than $5000.
> Body stressing and falls, trips and slips of a person had approximately three per cent of claims with total cost greater than $500 000 and 31 and 40 per cent of claims with total costs less than $5000 respectively.
> These three categories of claim account for approximately three quarters of the total claims.
Figure 4.8 Percentage and number of claims determined from 2009–10 to 2013–14 by mechanism of incident by total cost band (premium payers)
0% 20% 40% 60% 80% 100%10% 30% 50% 70% 90%
Mental stress
Falls, trips and slips of a person
Body stressing
All claims
Total cost<5k
5k to <20k
20k to <50k
50k to <200k
200k to <500k
≥500k
Percentage of claims
7401235 80157426454
17542281 25550212271274
35905239 914116525012436
333154 475362520299

COMCARE Compendium of WHS and Workers’ Compensation Statistics (version 1.1) 19
4.2.1 Body stressing
Figure 4.9 shows the incidence of body stressing claims accepted during the period 2009–10 to 2013–14. The data shows that the incidence of these claims across the scheme has reduced in the past three years, with the reduction most evident in workers’ compensation claims for licensed self-insurers.
Figure 4.9 Incidence of body stressing claims
Figure 4.10 shows that since 2009–10, despite an increase in the average total cost* of accepted body stressing claims, the average total cost of these claims remained below that of all other claims. Latest estimates indicate that the average total cost of body stressing claims is approximately $129 000 per claim. The data below covers premium payers only as total claim costs are not available for licensed self-insurers.
Figure 4.10 Average estimated total cost* of body stressing claims (premium payers)
* Average total cost is the cost to date plus estimated outstanding liability (estimated at May 2014).
16
14
12
10
8
6
4
2
02009–10 2010–11 2011–12 2013–142012–13
Clai
ms
per 1
000
FTE
empl
oyee
s
Premium payers Licensed self-insurers
Year of initial determination
Scheme
200
150
100
50
02009–10 2010–11 2011–12 2012–13 2013–14
Aver
age
estim
ated
tota
l cla
im c
ost*
$(’
000)
Year of initial determination
Body stressing All claims (excluding body stressing)

20 COMCARE Compendium of WHS and Workers’ Compensation Statistics (version 1.1)
Figure 4.11 shows a breakdown, by mechanism of incident, of body stressing claims accepted during 2013–14 for both premium payers (1355 claims) and licensed self-insurers (1748 claims).
Significant differences in the mechanism of incident sub-groups for body stressing claims between premium payers and licensed self-insurers are apparent. Approximately 51 per cent of body stressing claims for premium payers were due to ‘repetitive movement with low muscle loading’ (which includes occupational overuse), with a further 24 per cent due to ‘muscular stress while lifting, carrying or putting down objects’. ‘Repetitive movement with low muscle loading’ was less significant for licensed self-insurers, with only 10 per cent of body stressing claims attributed to this cause. The predominant cause of body stressing claims for licensed self-insurers was ‘muscular stress while lifting, carrying or putting down objects’ accounting for 41 per cent with ‘muscular stress while handling objects (other than lifting, carrying or putting down)’ accounting for 35 per cent and ‘muscular stress with no objects being handled and ‘repetitive movement, low muscle loading’ both accounting for 14 and 10 per cent respectively of all body stressing claims for licensed self-insurers.
Figure 4.11 Body stressing claims by mechanism of incident—Initially accepted in 2013–14
Figure 4.12 shows a breakdown of body stressing claims accepted during 2013–14 by occupation group. ‘Clerical and administration’ workers accounted for the largest number of body stressing claims (approximately 46 per cent of all body stressing claims across the scheme). Licensed self-insurers also recorded a significant number of body stressing claims in the ‘machinery operators and drivers’, ‘technicians and trades workers’ and ‘labourers’ occupational groups.
Figure 4.12 Body stressing claims by occupation—Initially accepted in 2013–14
0 200 400 600 800 1000 1200 1400
870
Muscular stress whilelifting, carrying,
putting down objects
Muscular stress whilehandling objects excluding
lift, carry, putting down
Repetitive movement,low muscle loading
Muscular stress with noobjects being handled
Premium payers Licensed self-insurers
Number of claims
769
415
1049
0 200 400 600 800 1000 1200 1400 1600
235
217
182
36
Clerical and administrative
Machinery operators/drivers
Technical and trades workers
Community/personal service
Professionals
Labourers
Managers
Sales workers
Premium payers Licensed self-insurers
Number of claims
171
1420
531
311

COMCARE Compendium of WHS and Workers’ Compensation Statistics (version 1.1) 21
4.2.2 Mental stress
Figure 4.13 shows the incidence of mental stress claims accepted during the period 2009–10 to 2013–14.
During the period the incidence of mental stress claims across the scheme increased by 61 per cent, with an 88 per cent increase seen for premium payers and a 24 per cent decrease for licensed self-insurers. The incidence of mental stress claims has been consistently lower for licensed self-insurers than for premium payers in the scheme.
Figure 4.13 Incidence of mental stress claims
Figure 4.14 shows that during the reporting period the average total cost* of accepted mental stress claims remained high compared to all other claims. Latest estimates indicate that the average total cost of mental stress claims was approximately $342 000. The data below covers premium payers only as total claim costs are not available for licensed self-insurers.
Figure 4.14 Average total cost* of mental stress claims (premium payers)
* Average total cost is the cost to date plus estimated outstanding liability (estimated at May 2014).
3.0
2.5
2.0
1.5
1.0
0.5
0.02009–10 2010–11 2011–12 2013–142012–13
Clai
ms
per 1
000
FTE
empl
oyee
s
Premium payers Licensed self-insurers
Year of initial determination
Scheme
350
300
250
200
150
100
50
02009–10 2010–11 2011–12 2013–142012–13
Aver
age
estim
ated
tota
l cla
im c
ost*
$(’
000)
Mental stress All claims (excl. mental stress
Year of initial determination

22 COMCARE Compendium of WHS and Workers’ Compensation Statistics (version 1.1)
Figure 4.15 shows a breakdown, by mechanism of incident, of the number of mental stress claims accepted during 2013–14 for both premium payers (496 claims in total) and licensed self-insurers (60 claims in total). This figure shows the similarities in the mechanism of incident sub-groups for mental stress claims between premium payers and licensed self-insurers.
For both premium payers and licensed self-insurers, the most significant sub-groups for mental stress claims were ‘work pressure’ and ‘work-related harassment and/or bullying’ (39 and 25 per cent of claims respectively).
Figure 4.15 Mental stress claims by mechanism of incident—Initially accepted in 2013–14
Figure 4.16 shows that licensed self-insurers, when compared to premium payers, had higher proportions of claims in the sub-groups of ‘exposure to workplace and/or occupational violence’ (17 per cent of claims compared to eight per cent respectively) and ‘exposure to traumatic event’ (17 per cent of claims compared to four per cent of claims respectively).
Figure 4.16 Proportion of mental stress claims by mechanism of incident—Initially accepted in 2013–14
0 20 40 60 80 100 120 140 160 180 200 220 240
51
Work pressure
Work-related harassmentand/or bullying
Exposure to traumaticevent
Exposure to workplaceor occupational violence
Other mental stressfactors
Premium payers Licensed self-insurers
Number of Claims
32
53
211
209
0% 10% 20% 30% 40% 50%
Work pressure
Work-related harassment and/or bullying
Exposure to traumatic event
Other mental stress factors
Exposure to workplace oroccupational violence
Premium payers Licensed self-insurers
Percentage of claims
10%
9%
4%
25%
39%
32%
39%
8%
17%
17%

COMCARE Compendium of WHS and Workers’ Compensation Statistics (version 1.1) 23
Figure 4.17 shows the number of mental stress claims accepted during 2013–14 by occupation group. The largest number of claims for premium payers was for employees classified as ‘clerical and administration’ workers followed by ‘managers’, ‘professionals’ and ‘community and personal service workers’. The largest number of mental stress claims for licensed self-insurers was also for ‘clerical and administration’ workers with the second highest groups being ‘managers’ and ‘machinery operators and drivers’.
Figure 4.17 Mental stress claims by occupation—Initially accepted in 2013–14
0 20 40 60 80 100 120 140 160 180 200 220 240 260 280 300
17
15
2
Clerical andadministrative workers
Machinery operators/drivers
Technical and trades workers
Community and personalservice workers
Professionals
Labourers
Managers
Sales workers
Premium payers Licensed self-insurers
Number of claims
3
297
94
76
52
24 COMCARE Compendium of WHS and Workers’ Compensation Statistics (version 1.1)
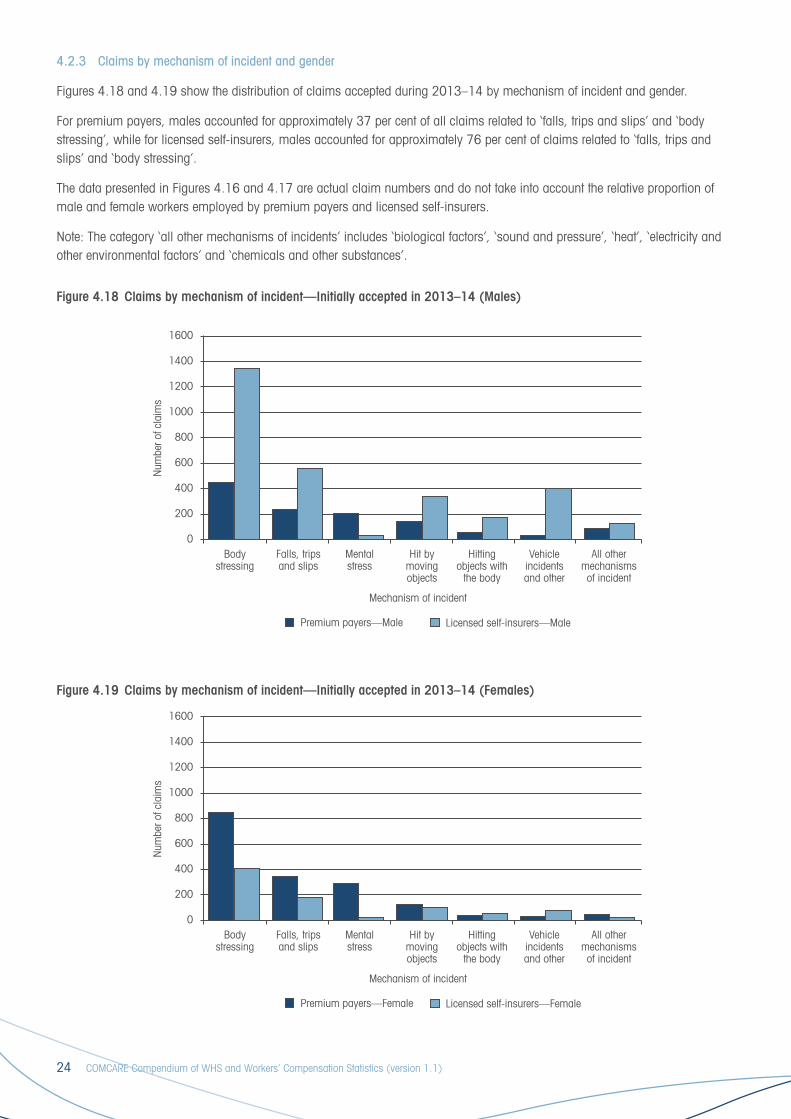
4.2.3 Claims by mechanism of incident and gender
Figures 4.18 and 4.19 show the distribution of claims accepted during 2013–14 by mechanism of incident and gender.
For premium payers, males accounted for approximately 37 per cent of all claims related to ‘falls, trips and slips’ and ‘body stressing’, while for licensed self-insurers, males accounted for approximately 76 per cent of claims related to ‘falls, trips and slips’ and ‘body stressing’.
The data presented in Figures 4.16 and 4.17 are actual claim numbers and do not take into account the relative proportion of male and female workers employed by premium payers and licensed self-insurers.
Note: The category ‘all other mechanisms of incidents’ includes ‘biological factors’, ‘sound and pressure’, ‘heat’, ‘electricity and other environmental factors’ and ‘chemicals and other substances’.
Figure 4.18 Claims by mechanism of incident—Initially accepted in 2013–14 (Males)
Figure 4.19 Claims by mechanism of incident—Initially accepted in 2013–14 (Females)
1600
1400
1200
1000
800
600
400
200
0Body
stressingFalls, tripsand slips
Mentalstress
Hit bymovingobjects
Hittingobjects with
the body
Vehicleincidentsand other
Mechanism of incident
All othermechanismsof incident
Num
ber o
f cla
ims
Premium payers—Male Licensed self-insurers—Male
1600
1400
1200
1000
800
600
400
200
0Body
stressingFalls, tripsand slips
Mentalstress
Hit bymovingobjects
Hittingobjects with
the body
Vehicleincidentsand other
Mechanism of incident
All othermechanismsof incident
Num
ber o
f cla
ims
Premium payers—Female Licensed self-insurers—Female

COMCARE Compendium of WHS and Workers’ Compensation Statistics (version 1.1) 25
4.2.4 Claims by age group (premium payers)
Figure 4.20 shows the estimated incidence of claims accepted during the period 2009–10 to 2013–14 by age group. The data covers claims for the Australian and ACT Government premium payers only as age distribution data is not available for licensed self-insurers. The incidence rates shown below were estimated using age distribution data for the ACT Government and the Australian Public Service4 which accounts for approximately 82 per cent of workers employed within ACT Government and Australian Government premium payers.
The data shows a reduction in the incidence of claims for all age groups with the exception of the under 25s in 2013–14 from 2012–13. This 34 per cent increase can be attributed to a 22 per cent decrease in the number of employees in this category.
Figure 4.20 Estimated incidence of claims by age group (premium payers)
4 Australian Public Service Commission, Australian Public Service Employee Database internet interface (APSEDii)
30
25
20
15
10
5
02009–10 2010–11 2011–12 2012–13 2013–14
Clai
ms
per 1
000
FTE
empl
oyee
s
Under 25 25–34 35–44
Year of initial determination
45–54 55 and over

26 COMCARE Compendium of WHS and Workers’ Compensation Statistics (version 1.1)
4.2.5 Claims by mechanism of incident and age group (premium payers)
Figure 4.21 shows the estimated incidence of claims accepted during 2013–14 by mechanism of incident and age group. The data covers claims for Australian and ACT Government premium payers only as age distribution data is not available for licensed self-insurers. The incidence rates shown below were estimated using age distribution data for the ACT Government and the Australian Public Service5 which accounts for approximately 82 per cent of workers employed within Australian Government premium payers.
The data shows that the incidence of claims for ‘body stressing’ peaks for those workers aged 45 and over. The incidence of claims for ‘falls, trips and slips’ generally increases with age, and ‘mental stress’ is more prevalent within the under 25 age group.
Figure 4.21 Estimated incidence of claims with one week time lost by mechanism of incident and age group (premium payers)—2013–14
Note: 1. All Other category is a sub-total of biological factors, chemicals and other substances, heat, radiation and electricity, and sound
and pressure.
5 Australian Public Service Commission, Australian Public Service Employee Database internet interface (APSEDii)
109876543210
Bodystressing
Falls, tripsand slips
Hittingobject with
body
Vehicleincidentsand other
Hit by movingobjects
Mentalstress
All other
Under 25 25–34
Clai
ms
per 1
000
FTE
empl
oyee
s
35–44 45–54
Mechanism of incident
55 and over Average

COMCARE Compendium of WHS and Workers’ Compensation Statistics (version 1.1) 27
4.2.6 Average estimated total cost of claims by age (premium payers)
Figure 4.22 shows the average total cost* of claims accepted during 2013–14 by age group. The data covers claims for the Australian and ACT Government premium payers only.
The data indicates that the age groups 35–44 years and 45–54 have the highest average total cost of claims.
Figure 4.22 Average estimated total cost* of claims by age (premium payers)—2013–14
* Average total cost is the cost to date plus estimated outstanding liability (estimated at May 2014).
200
180
160
140
120
100
80
60
40
20
0Under 25 25–34 35–44 45–54 55 and over
Aver
age
tota
l cla
im c
ost*
$(’
000)
Average of all claims
110.3
149.7
188.5
158.3
111.5

28 COMCARE Compendium of WHS and Workers’ Compensation Statistics (version 1.1)
4.3 PREVENTION TARGETS
The Australian Work Health Safety Strategy 2012–2022 (Australian Strategy), implemented by Safe Work Australia (succeeds the previous National OHS Strategy (National Strategy)) and sets three National targets for a reduction of at least:
> 20 per cent in the number of worker fatalities due to injury
> 30 per cent in the incidence rate of claims resulting in one or more weeks off work
> 30 per cent in the incidence rate of claims for musculoskeletal disorders resulting in one or more weeks off work.
Comcare scheme targets based on the Australian Strategy were approved by the Safety, Rehabilitation and Compensation Commission and reviewed and implemented during 2013–14. The 2013–14 target for the incidence of claims resulting in one or more weeks off work has been set at 7.3.
4.3.1 Claims with one week time lost
Performance against both the Australian Strategy and previous National Strategy are based on the incidence of claims (excluding commuting claims) that first reached one week time lost during the period.
Figure 4.23 shows scheme performance against the National Strategy targets over a ten-year period. The scheme achieved a 27 per cent reduction between 2002 and 2012 with 8.3 claims per 1000 FTE employees. This was less than the target of 6.8 claims per 1000 FTE employees, a 40 per cent reduction over ten years under the previous National Strategy. Performance has reduced in 2013–14 to 7.5.
Figure 4.23 Claims with one week time lost (Australian Government premium payers and licensed self-insurers)
14
12
10
8
6
4
2
0
Year claim reached 1 week time lost
2004
–05
2005
–06
2006
–07
2007
–08
2008
–09
2009
–10
2010
–11
2011
–12
Clai
ms
per 1
000
FTE
empl
oyee
s
National strategyResult Australian strategy
11.0 10.5
7.58.3 8.2
8.3 8.5 8.37.5
2012
–13
2013
–14
12.1

COMCARE Compendium of WHS and Workers’ Compensation Statistics (version 1.1) 29
4.3.2 Deaths
The number of deaths reported in Table 4.2 is based on accepted claims lodged under the SRC Act (i.e. compensated deaths). Due to the different statutory definitions which apply to compensated deaths under the SRC Act, compared to notifiable deaths under the WHS Act, the number of compensated deaths reported may not correlate with the number of notified deaths in each year. For example, incidents resulting in bystander deaths are notifiable under the WHS Act, whereas compensated deaths only relate to employees under the SRC Act.
No compensable injury death claims were accepted by the scheme during 2013–14.
There were 11 compensable disease death claims accepted by the scheme in 2013–14. Premium payers reported 10 of these deaths and one was reported by licensed self-insurers.
Table 4.2 Compensated deaths (Australian Government premium payers and licensed self-insurers)
2009–10 2010–11 2011–12 2012–13 2013–14
Australian Government premium payers
Injury 6 0 2 2 0
Disease 9 25 12 21 10
Licensed self-insurers
Injury 7 2 2 2 0
Disease 1 2 6 6 1
Total
Injury 13 2 4 4 0
Disease 10 27 18 27 11
30 COMCARE Compendium of WHS and Workers’ Compensation Statistics (version 1.1)
4.4 NOTIFICATIONS OF WHS INCIDENTS
A person conducting a business or undertaking (PCBU) is required to notify Comcare of dangerous incidents that expose a person to a serious risk to that person’s health or safety, and incidents that result in a death, serious injury or illness of a person. For these incidents to be notifiable, they must have arisen out of the conduct of the PCBU’s business or undertaking. Dangerous incidents must also be attributed to a workplace. Since the introduction of the WHS Act from 1 January 2012, death, serious injury or illness and dangerous incident notifications relate to workers and third parties such as bystanders. Under the WHS Act, the term, ‘worker’, is broader than ‘employee’ and includes in addition to employees, contractors, subcontractors, employees of labour hire companies working for the PCBU, outworkers, apprentices, trainees and volunteers.
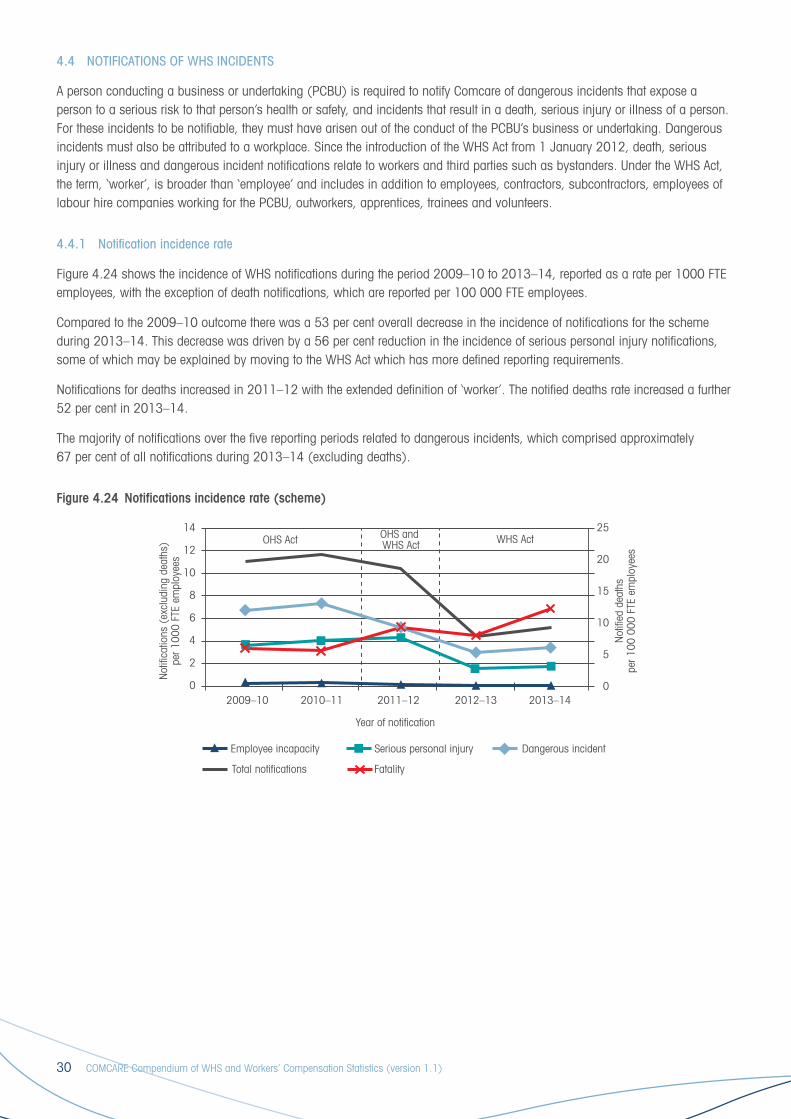
4.4.1 Notification incidence rate
Figure 4.24 shows the incidence of WHS notifications during the period 2009–10 to 2013–14, reported as a rate per 1000 FTE employees, with the exception of death notifications, which are reported per 100 000 FTE employees.
Compared to the 2009–10 outcome there was a 53 per cent overall decrease in the incidence of notifications for the scheme during 2013–14. This decrease was driven by a 56 per cent reduction in the incidence of serious personal injury notifications, some of which may be explained by moving to the WHS Act which has more defined reporting requirements.
Notifications for deaths increased in 2011–12 with the extended definition of ‘worker’. The notified deaths rate increased a further 52 per cent in 2013–14.
The majority of notifications over the five reporting periods related to dangerous incidents, which comprised approximately 67 per cent of all notifications during 2013–14 (excluding deaths).
Figure 4.24 Notifications incidence rate (scheme)
14
12
10
8
6
4
2
0
25
20
15
10
5
0
OHS Act WHS ActOHS and WHS Act
2009–10 2010–11 2011–12 2012–13 2013–14
Not
ifica
tions
(ex
clud
ing
deat
hs)
per 1
000
FTE
empl
oyee
s
Not
ified
dea
ths
per 1
00 0
00 F
TE e
mpl
oyee
s
Year of notification
Employee incapacity Serious personal injury Dangerous incident
Total notifications Fatality
COMCARE Compendium of WHS and Workers’ Compensation Statistics (version 1.1) 31
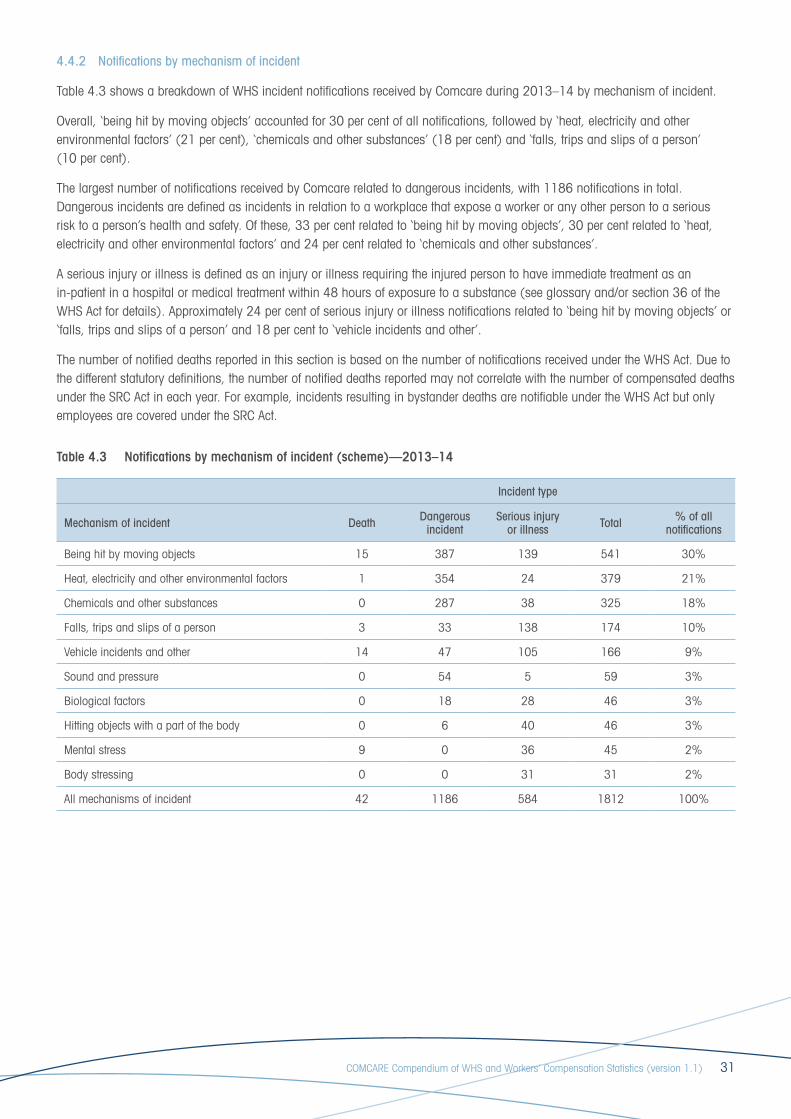
4.4.2 Notifications by mechanism of incident
Table 4.3 shows a breakdown of WHS incident notifications received by Comcare during 2013–14 by mechanism of incident.
Overall, ‘being hit by moving objects’ accounted for 30 per cent of all notifications, followed by ‘heat, electricity and other environmental factors’ (21 per cent), ‘chemicals and other substances’ (18 per cent) and ‘falls, trips and slips of a person’ (10 per cent).
The largest number of notifications received by Comcare related to dangerous incidents, with 1186 notifications in total. Dangerous incidents are defined as incidents in relation to a workplace that expose a worker or any other person to a serious risk to a person’s health and safety. Of these, 33 per cent related to ‘being hit by moving objects’, 30 per cent related to ‘heat, electricity and other environmental factors’ and 24 per cent related to ‘chemicals and other substances’.
A serious injury or illness is defined as an injury or illness requiring the injured person to have immediate treatment as an in-patient in a hospital or medical treatment within 48 hours of exposure to a substance (see glossary and/or section 36 of the WHS Act for details). Approximately 24 per cent of serious injury or illness notifications related to ‘being hit by moving objects’ or ‘falls, trips and slips of a person’ and 18 per cent to ‘vehicle incidents and other’.
The number of notified deaths reported in this section is based on the number of notifications received under the WHS Act. Due to the different statutory definitions, the number of notified deaths reported may not correlate with the number of compensated deaths under the SRC Act in each year. For example, incidents resulting in bystander deaths are notifiable under the WHS Act but only employees are covered under the SRC Act.
Table 4.3 Notifications by mechanism of incident (scheme)—2013–14
Incident type
Mechanism of incident Death Dangerous incident
Serious injury or illness Total % of all
notifications
Being hit by moving objects 15 387 139 541 30%
Heat, electricity and other environmental factors 1 354 24 379 21%
Chemicals and other substances 0 287 38 325 18%
Falls, trips and slips of a person 3 33 138 174 10%
Vehicle incidents and other 14 47 105 166 9%
Sound and pressure 0 54 5 59 3%
Biological factors 0 18 28 46 3%
Hitting objects with a part of the body 0 6 40 46 3%
Mental stress 9 0 36 45 2%
Body stressing 0 0 31 31 2%
All mechanisms of incident 42 1186 584 1812 100%

32 COMCARE Compendium of WHS and Workers’ Compensation Statistics (version 1.1)
4.4.3 Notified worker fatalities
Table 4.4 shows a breakdown of worker fatalities notified to Comcare under the WHS Act.
Overall, there has been approximately a 43 percent decrease in the number of worker fatalities from 2009–10. Of the eight fatalities notified to Comcare, 50 per cent were from the ADF, 37.5 per cent from Australian Government premium payers and 12.5 per cent from licensed self-insurers.
This data excludes fatalities to third parties as well as those that are assessed by Comcare as not-notifiable. Prior to the implementation of the WHS Act on 1 January 2012, contractor fatalities were reported separately.
The number of notified deaths reported in this section is based on the number of notifications received under the WHS Act. Due to the different statutory definitions, the number of notified deaths reported may not correlate with the number of compensated deaths under the SRC Act in each year. For example, incidents resulting in some bystander deaths are notifiable under the WHS Act but not compensable under the SRC Act.
Table 4.4 Number of notified worker fatalities
2009–10 2010–11 2011–12 2012–13 2013–14
Australian Government premium payers
Worker fatalities 2 0 3 2 3
Contractor fatalities 3 0 4
Total fatalities 5 0 7 2 3
Licensed self-insurers
Worker fatalities 6 1 3 3 1
Contractor fatalities 0 1 2
Total fatalities 6 2 5 3 1
ADF
Worker fatalities 3 4 2 3 4
Contractor fatalities 0 0 0
Total fatalities 3 4 2 3 4
Total
Worker fatalities 11 5 8 8 8
Contractor fatalities 3 1 6
Total fatalities 14 6 14 8 8
Note:1. Reporting is impacted due to the introduction of the WHS Act on 1 January 2012. Contractors are considered workers and are not reported
separately from that date.

COMCARE Compendium of WHS and Workers’ Compensation Statistics (version 1.1) 33
5 WORKERS’ COMPENSATION CLAIMS MANAGEMENTThe Comcare workers’ compensation scheme is a ‘no fault’ scheme, with limited access to common law. This means that an injured employee does not have to prove negligence on behalf of the employer to be eligible to receive compensation for a work-related injury/disease. The scheme provides employees who have an accepted claim for work-related injury or illness access to:
> compensation for incapacity for 45 weeks at 100 per cent of their pre-injury salary and a reduced rate thereafter until age 65 (if injured after 63 years of age employees are entitled to a maximum of 104 weeks of compensation, 45 weeks at 100 per cent and then at a reduced rate thereafter)
> rehabilitation and return to work assistance from their rehabilitation authority (normally the employer)
> reasonable medical treatment
> lump sum payment for permanent impairment of at least 10 per cent
> death and funeral benefits for dependants and weekly benefits for dependent children.
5.1 PROCESS
Compensation is only payable under the SRC Act if the determining authority accepts liability for an employee’s injury or illness. The determining authority considers, but is not limited to, the following factors when determining liability:
> employment relationship—whether the injury arose out of or in the course of employment or, if a disease, the development of the condition was significantly contributed to by employment
> medical evidence
> exclusionary provisions—compensation is not payable where the condition:
− was suffered as a result of reasonable administrative action taken in a reasonable manner in relation to the employee’s employment
− was intentionally self-inflicted or resulted from unreasonable submission to an abnormal risk of injury
− was a result of serious and wilful misconduct (unless the injury results in death or serious and permanent impairment)
− occurred when commuting between home and usual place of work.
34 COMCARE Compendium of WHS and Workers’ Compensation Statistics (version 1.1)
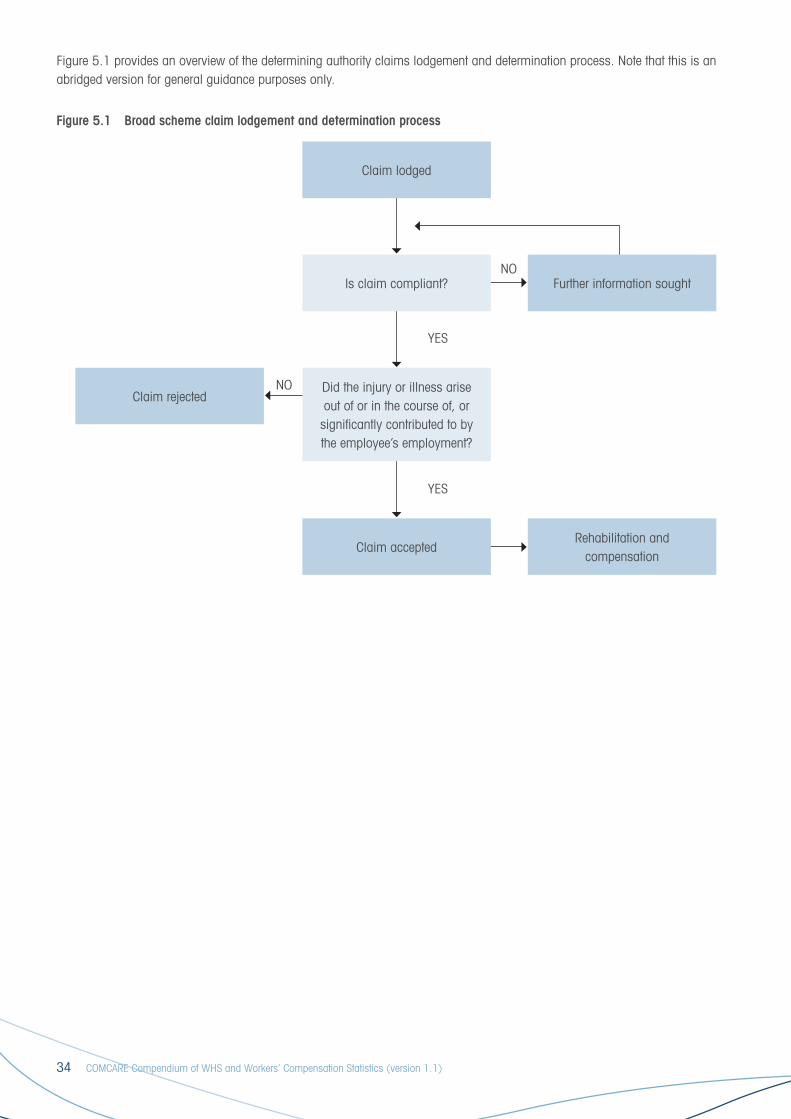
Figure 5.1 provides an overview of the determining authority claims lodgement and determination process. Note that this is an abridged version for general guidance purposes only.
Figure 5.1 Broad scheme claim lodgement and determination process
Claim lodged
Is claim compliant? Further information sought
Did the injury or illness arise out of or in the course of, or significantly contributed to by the employee’s employment?
Claim rejected
Claim acceptedRehabilitation and
compensation
NO
NO
YES
YES

COMCARE Compendium of WHS and Workers’ Compensation Statistics (version 1.1) 35
The SRC Act provides a three-tiered review process:
1. Internal review (reconsideration) of the decision by the determining authority, by a party independent of the original decision.
2. External merits review of a determining authority’s reviewable decision, by the Administrative Appeals Tribunal (AAT).
3. Judicial review of the AAT’s decision, on a question of law, by the Federal Court or Federal Magistrates Court.
Employees or employers may choose to request a review if they are dissatisfied with a decision on a claim made by the determining authority. An employee may also request a review of a decision made by their rehabilitation authority (generally the employer).
The determining authority may also reconsider a matter of its ‘own motion’ where it considers the original determination was incorrect or if it receives information that changes its view of the original determination.
Once a reconsideration has been completed, that decision then becomes a ‘reviewable decision’ and either the employee or the employer may choose to apply to the AAT for an external review. Once the AAT has undertaken a merits review, the reviewable decision is either affirmed, revoked or varied.
Figure 5.2 provides an overview of the review and reconsideration process.
Figure 5.2 Claim reconsideration and review process
Claim determined
Reconsideration requested/undertaken
Determining authority reconsideration Reviewable decision
AAT merits review Appeal affirmed/revoked/varied
Federal Court Appeal allowed/disallowed
Appeal allowed/disallowedFull Federal Court
High Court
Appeal allowed/disallowed

36 COMCARE Compendium of WHS and Workers’ Compensation Statistics (version 1.1)
5.2 WORKERS’ COMPENSATION CLAIMS SUMMARY
5.2.1 Claims lodged
Figure 5.3 shows the incidence of claims lodged during the period 2009–10 to 2013–14. The data shows there has been a decrease of approximately 20 per cent in the incidence of claims across the scheme; the most recent period has seen a three per cent reduction.
Comcare premium payers experienced a five per cent decrease in the incidence of claims, from approximately 17 claims lodged per 1000 FTE employees during 2009–10 to approximately 16 claims per 1000 FTE employees during 2013–14.
The data shows that licensed self-insurers had a 30 per cent decrease in the incidence of claims, from approximately 40 claims per 1000 FTE employees during 2009–10 to 28 claims per 1000 FTE employees during 2013–14. Since 2009–10, the incidence of claims for licensed self-insurers has remained higher than that for premium paying employers.
Figure 5.3 Incidence of claims lodged
45
40
35
30
25
20
15
10
5
02009–10 2010–11 2011–12 2012–13 2013–14
Premium payers Licensed self-insurers
Year claim lodged
Clai
ms
lodg
ed p
er 1
000
FTE
empl
oyee
s
16.8 16.1
40.2
16.9
38.5
16.0
36.1
16.0
30.628.3
Scheme

COMCARE Compendium of WHS and Workers’ Compensation Statistics (version 1.1) 37
5.2.2 Claims determined
Figure 5.4 shows the number of claims determined per 1000 FTE during the period 2009–10 to 2013–14. The claims received pattern for the scheme outlined at 5.2.1 broadly mirrors the claims determined.
Figure 5.4 Incidence of claims determined
45
40
35
30
25
20
15
10
5
02009–10 2010–11 2011–12 2012–13 2013–14
Premium payers Licensed self-insurers
Year of initial determination
Clai
ms
dete
rmin
ed p
er 1
000
FTE
empl
oyee
s
15.7 16.6
38.4
16.5
37.5
15.9
35.6
17.8
31.629.8
Scheme
5.2.3 Determination timeframes
Table 5.1 shows the average time taken to determine new claims, from date of receipt by the determining authority, for all claims determined in the period 2009–10 to 2013–14. The data shows significant differences in the claim determination time between Comcare and licensed self-insurers.
Table 5.1 Average time (calendar days) to determine claims
Nature of claimYear of initial determination
2009–10 2010–11 2011–12 2012–13 2013–14
Comcare (premium payers)
Injury 23 16 11 15 18
Disease (excluding psychological) 53 43 33 48 54
Psychological 117 82 62 79 77
Licensed self-insurers
Injury 10 14 13 15 16
Disease (excluding psychological) 20 25 26 32 33
Psychological 29 44 41 46 48
Scheme
Injury 14 14 12 15 17
Disease (excluding psychological) 36 33 29 40 44
Psychological 88 71 55 70 69

38 COMCARE Compendium of WHS and Workers’ Compensation Statistics (version 1.1)
Figure 5.5 shows the distribution of time taken to determine new claims, from date of receipt by the determining authority, for all claims determined in 2013–14. The data shows significant differences in the claim determination time depending on nature of injury.
Figure 5.5 Distribution of time (calendar days) to determine claims during 2013–14 (premium payers and licensed self-insurers)
100
80
60
40
20
0
Det
erm
inat
ion
perc
enta
ge
0 20 40 60 80 100 120 140
26 weeks
Time to determine (days)
Disease (excluding psychological)Injury Psychological
5.2.4 Initial claims acceptance rate
Figure 5.6 shows the percentage of claims determined during the period 2009–10 to 2013–14 that were accepted. This includes claims that were accepted following reconsideration or review. This data is subject to development as claims may still be going through the review process.
As at 30 June 2014, 81 per cent of claims determined in 2013–14 were accepted. In the latest four years, licensed self-insurers and Comcare (i.e. for premium paying employers) have accepted a similar proportion of claims.
Figure 5.6 Initial claims acceptance rate
100
90
80
70
60
50
40
30
20
10
02009–10 2010–11 2011–12 2012–13 2013–14
Premium payers Licensed self-insurers
Year of initial determination
Perc
enta
ge o
f det
erm
ined
cla
ims
82%88% 87% 84%86%86%86%
80%83% 81%
Scheme

COMCARE Compendium of WHS and Workers’ Compensation Statistics (version 1.1) 39
5.3 RECONSIDERATIONS
Table 5.2 provides data relating to requests for reconsideration decided during the period 2009–10 to 2013–14. The table also shows the percentage of determining authorities’ original decisions which were upheld following a request for reconsideration (affirmation rate).
There has been a five per cent increase in the number of reconsideration requests since 2009–10. The average time taken to decide requests for reconsideration has increased six per cent over the same period. The affirmation rate for both Comcare and licensed self-insurers remained relatively stable over the period 2009–10 to 2013–14.
Table 5.2 Requests for reconsiderations decided
2009–10 2010–11 2011–12 2012–13 2013–14
Number of requests decided
Comcare (premium payers) 1251 992 1061 1033 1319
Licensed self-insurers 982 1025 1005 1160 1216
Scheme 2233 2017 2066 2193 2535
Average time (calendar days) to decide requests for reconsideration
Comcare (premium payers)*
Injury 36 47 43 40 49
Disease (excluding psychological) 42 44 47 39 49
Psychological 38 46 48 41 54
Licensed self-insurers
Injury 18 21 25 20 21
Disease (excluding psychological) 18 20 21 20 21
Psychological 18 20 21 27 21
Scheme
Injury 26 31 32 27 32
Disease (excluding psychological) 33 32 33 28 36
Psychological 32 38 40 37 45
Affirmation rate at reconsideration
Comcare (premium payers) 69% 70% 68% 72% 72%
Licensed self-insurers 80% 80% 78% 76% 85%
Scheme 74% 75% 73% 74% 79%
* Based on the number of calendar days from the date of commencement of the reconsideration to the decision date for a reviewable decision. A delay between receipt and commencement of a review may occur when the injured worker has indicated they will follow-up their request for reconsideration at a later date with further evidence (e.g. additional medical report) to support their claim.
40 COMCARE Compendium of WHS and Workers’ Compensation Statistics (version 1.1)
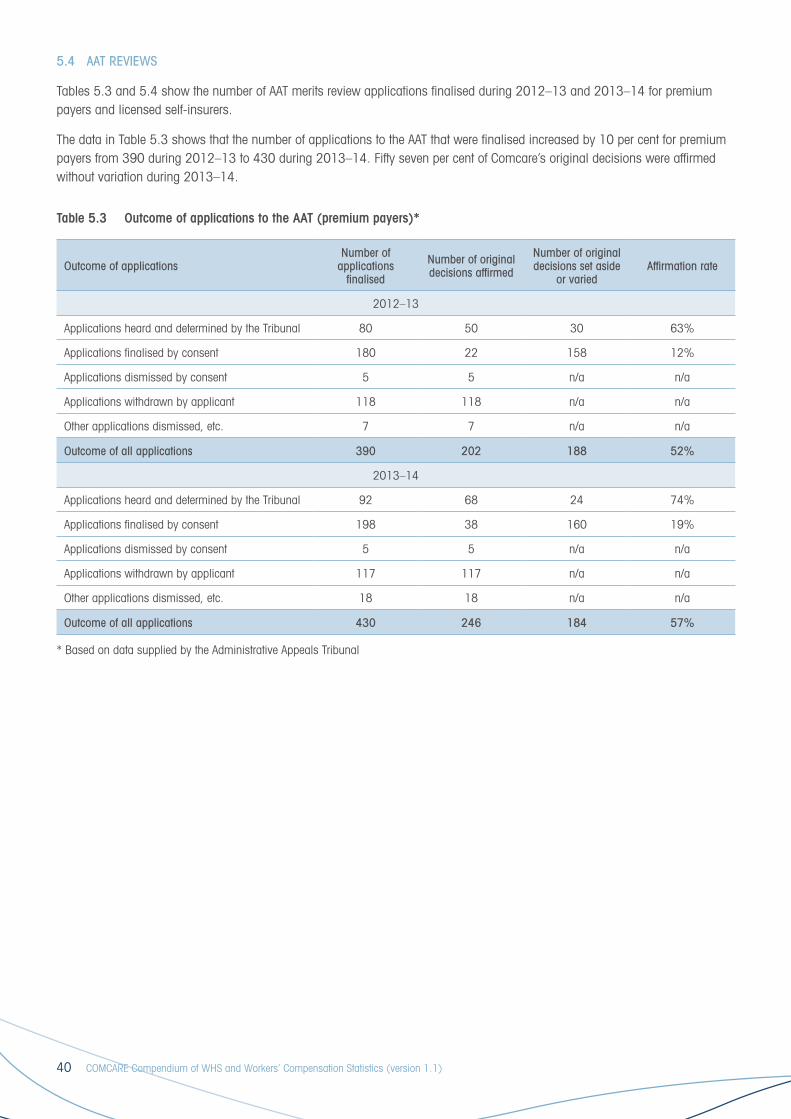
5.4 AAT REVIEWS
Tables 5.3 and 5.4 show the number of AAT merits review applications finalised during 2012–13 and 2013–14 for premium payers and licensed self-insurers.
The data in Table 5.3 shows that the number of applications to the AAT that were finalised increased by 10 per cent for premium payers from 390 during 2012–13 to 430 during 2013–14. Fifty seven per cent of Comcare’s original decisions were affirmed without variation during 2013–14.
Table 5.3 Outcome of applications to the AAT (premium payers)*
Outcome of applicationsNumber of
applications finalised
Number of original decisions affirmed
Number of original decisions set aside
or variedAffirmation rate
2012–13
Applications heard and determined by the Tribunal 80 50 30 63%
Applications finalised by consent 180 22 158 12%
Applications dismissed by consent 5 5 n/a n/a
Applications withdrawn by applicant 118 118 n/a n/a
Other applications dismissed, etc. 7 7 n/a n/a
Outcome of all applications 390 202 188 52%
2013–14
Applications heard and determined by the Tribunal 92 68 24 74%
Applications finalised by consent 198 38 160 19%
Applications dismissed by consent 5 5 n/a n/a
Applications withdrawn by applicant 117 117 n/a n/a
Other applications dismissed, etc. 18 18 n/a n/a
Outcome of all applications 430 246 184 57%
* Based on data supplied by the Administrative Appeals Tribunal

COMCARE Compendium of WHS and Workers’ Compensation Statistics (version 1.1) 41
Table 5.4 shows the outcome of applications to the AAT for licensed self-insurers. The number of applications finalised increased by 14 per cent from 627 during 2012–13 to 715 during 2013–14.
Licensed self-insurers’ original decisions were affirmed without variation in 76 per cent of cases during 2013–14.
Table 5.4 Outcome of applications to the AAT (licensed self-insurers)*
Outcome of applicationsNumber of
applications finalised
Number of original decisions affirmed
Number of original decisions set aside
or variedAffirmation rate
2012–13
Applications heard and determined by the Tribunal 51 36 15 71%
Applications finalised by consent 460 294 166 64%
Applications dismissed by consent 3 3 n/a n/a
Applications withdrawn by applicant 98 98 n/a n/a
Other applications dismissed, etc. 15 15 n/a n/a
Outcome of all applications 627 446 181 71%
2013–14
Applications heard and determined by the Tribunal 73 41 32 56%
Applications finalised by consent 484 342 142 71%
Applications dismissed by consent 3 3 n/a n/a
Applications withdrawn by applicant 138 138 n/a n/a
Other applications dismissed, etc. 17 17 n/a n/a
Outcome of all applications 715 541 174 76%
* Based on data supplied by the Administrative Appeals Tribunal

42 COMCARE Compendium of WHS and Workers’ Compensation Statistics (version 1.1)
6 REHABILITATION AND RETURN TO WORKA key objective of the Comcare scheme is the early and safe return to work of injured employees covered by the scheme. While employers are responsible for managing the rehabilitation and return to work of their injured or ill employees, Comcare provides support and advice to employers on how to manage their responsibilities.
Figure 6.1 sets out the general steps in the return to work process.
Figure 6.1 Broad steps in the return to work process
Supervisor becomes aware of injury and meets with the employee to discuss prevention of further injury and how the agency can support them to remain at or return to work
Supervisor notifies case manager
Supervisor, case manager and employee discuss the injury and support needed from the agency
Case manager decides if a workplace rehabilitation provider (WRP) should be engaged (s.36 SRC Act)
Case manager or WRP consult with the treating doctor
Case manager decides if further assessment is needed (s.36 SRC Act)
Rehabilitation program developed to assist injured employee to return to work quickly and safely
Case manager, employee, WRP and doctor monitor and review implementation of rehabilitation program
When employee returns to work, case manager may close the program
YES—assessment required
Case manager refers to a WRP, legally qualified medical practitioner
or panel for assessment
NO—assessment not required
Case manager initiates rehabilitation planning based on medical advice
and in consultation with the employee and supervisor (s.37 SRC Act)

COMCARE Compendium of WHS and Workers’ Compensation Statistics (version 1.1) 43
6.1 CLAIM DURATION
Figures 6.2 and 6.3 show the incidence of claims that first reached one, 12, 26 and 52 weeks lost time during the period 2009–10 to 2013–14 for premium payers and licensed self-insurers.
Premium payers experienced a slight increase in the incidence of claims across the lost time categories from 2009–10 to 2013–14.
Licensed self-insurers recorded an increase in lost time during the period 2009–10 to 2013–14 in all periods of lost time experienced with the exception of the one week category.
Figure 6.2 Incidence of claims with one week or more lost time (premium payers)
Figure 6.3 Incidence of claims with one week or more lost time (licensed self-insurers)
12
10
8
6
4
2
0
1 week 12 weeks
Year incapacity threshold reached
Clai
ms
per 1
000
FTE
empl
oyee
s
26 weeks 52 weeks
2009–10 2010–11 2011–12 2012–13 2013–14
12
10
8
6
4
2
0
1 week 12 weeks
Year incapacity threshold reached
Clai
ms
per 1
000
FTE
empl
oyee
s
26 weeks 52 weeks
2009–10 2010–11 2011–12 2012–13 2013–14

44 COMCARE Compendium of WHS and Workers’ Compensation Statistics (version 1.1)
In the Comcare scheme, not all accepted claims have lost time. This varies according to the nature of injury, with only approximately 50 per cent of injury and physical disease claims having some lost time. For psychological claims the number is much higher with approximately 80 per cent having some lost time.
For claims with some lost time, the typical duration of incapacity varies depending on the nature of injury. Figure 6.2 illustrates that psychological injury claims continue on incapacity for longer periods than claims for injury or physical disease.
Figure 6.4 Lost time to date survival—2009–10 to 2013–14 (Comcare scheme)
100
80
60
40
20
0
Perc
enta
ge o
f acc
epte
d cl
aim
s w
ith lo
st ti
me
0 4 8 12 16 20 24 28 32 36 40 44 48 52
6 weeks 12 weeks 26 weeks
Lost time to date (weeks)
Disease (excl Psych)Injury Psychological

COMCARE Compendium of WHS and Workers’ Compensation Statistics (version 1.1) 45
Table 6.1 shows the percentage of lost time claims accepted during the period 2009–10 to 2013–14 that reached selected incapacity durations. The data shows that claim durations for premium payers are longer than for licensed self-insurers. It should be noted that these figures may change as claims mature, in particular for the most recent reporting periods.
Table 6.1 Lost time to date
Lost time claims accepted in the period
Lost time to date 2009–10 2010–11 2011–12 2012–13 2013–14
Premium payers—injury
Accepted claims 1023 1014 1078 940 762
One week or more 71% 72% 76% 76% 77%
Six or more weeks 32% 36% 37% 39% 36%
12 or more weeks 21% 23% 23% 26% 22%
26 or more weeks 12% 14% 13% 13% 5%
Premium payers—disease
Accepted claims 1087 1284 1104 1129 906
One week or more 85% 88% 88% 90% 87%
Six or more weeks 53% 60% 62% 64% 58%
12 or more weeks 41% 45% 47% 49% 43%
26 or more weeks 29% 29% 33% 33% 20%
Licensed self-insurers—injury
Accepted claims 2078 1776 1730 1606 1483
One week or more 52% 56% 57% 57% 58%
Six or more weeks 20% 22% 25% 26% 22%
12 or more weeks 12% 13% 15% 15% 10%
26 or more weeks 6% 7% 8% 7% 3%
Licensed self-insurers—disease
Accepted claims 610 869 846 606 461
One week or more 73% 71% 71% 68% 67%
Six or more weeks 34% 32% 35% 32% 32%
12 or more weeks 20% 18% 23% 19% 18%
26 or more weeks 12% 10% 12% 8% 6%

46 COMCARE Compendium of WHS and Workers’ Compensation Statistics (version 1.1)
6.1.1 Median lost time—injury and disease
Figures 6.5 and 6.6 show the median duration of lost time to date for claims accepted during the period 2009–10 to 2013–14. This is based on lost time claims only (i.e. claims which have resulted in one day or more lost time from work). It should be noted that data for more recent periods is relatively immature and the median duration of accepted disease claims in particular is expected to increase.
For premium payers, the median duration of lost time to date for injury claims has increased from 2.6 weeks during 2009–10 to 3.4 weeks during 2013–14. For disease claims, the median duration of time lost has increased from 7.4 to 9.1 over the same period.
Figure 6.5 Median lost time (premium payers)
Figure 6.6 shows that during the period 2009–10 to 2013–14, the median duration of incapacity for licensed self-insurers’ claims was consistently lower than for premium payers.
Figure 6.6 Median lost time (licensed self-insurers)
14
12
10
8
6
4
2
02009–10 2010–11 2011–12 2012–13 2013–14
Injury Disease
Year of initial determination
Tim
e lo
st fr
om w
ork
(wee
ks)
2.6
7.4
9.7
2.83.6
4.03.4
9.1
12.1
10.8
5
4
3
2
1
02009–10 2010–11 2011–12 2012–13 2013–14
Injury Disease
Year of initial determination
Tim
e lo
st fr
om w
ork
(wee
ks)
1.5
3.53.2
1.71.8
2.01.8
3.43.0
3.5

COMCARE Compendium of WHS and Workers’ Compensation Statistics (version 1.1) 47
6.1.2 Current return to work rate
Figure 6.7 shows the proportion of injured employees who had returned to work and were working seven to nine months after lodging their claim (current return to work rate). The return to work performance reported below is from the Safe Work Australia National Return to Work Survey6 which has replaced the National Return to Work Monitor previously published by the Heads of Workers’ Compensation Authorities.
This measure is equivalent to the previously reported ‘durable return to work rate’. From 2012–13, the current return to work estimate for licensed self-insurers has been derived from applying the ratio of the premium payers’ historic outcome to the outcome from the new method, this was then applied to the new figure reported for licensed self-insurers.
The return to work performance of both premium payers and licensed self-insurers has remained at a consistently high level over the five periods reported.
Noting that the return to work performance is based on a survey of injured workers, and may be influenced to some extent by the survey sample, these results show only minor differences in the performance of licensed self-insurers, where available or derived, compared to the premium payers.
The National Return to Work Survey, which excludes self-insurers, reported that Comcare’s 2013–14 current return to work rate for premium payers was 81 per cent and remains above the national average (77 per cent).
Figure 6.7 Current return to work rate
6 Safe Work Australia—National Return to Work Survey 2014 (http://www.safeworkaustralia.gov.au/sites/swa/about/publications/pages/national-return-to-work-survey)
100
90
80
70
60
50
40
30
20
10
0
2009–10 2010–11 2011–12 2012–13 2013–14
Premium payers Licensed self-insurers
Year of survey
Perc
enta
ge (
%)
81%86%
80%
90%
81%
88%
80% 79%
89%
National
81%

48 COMCARE Compendium of WHS and Workers’ Compensation Statistics (version 1.1)
7 SCHEME REVENUE AND EXPENDITURE
7.1 REVENUE
The Comcare scheme revenue sources include a combination of premiums, licence fees and regulatory contributions under the SRC Act and the WHS Act. Premium payers pay a workers’ compensation premium and a regulatory contribution, while licensed self-insurers pay a licence fee.
Under the SRC Act, Comcare managed workers’ compensation liabilities of $3.2 billion and held assets of $2.3 billion (as at 30 June 2014) on behalf of Commonwealth premium payers.
Comcare does not manage such liabilities or hold assets for the self-insured component of the scheme, which has estimated workers’ compensation liabilities of $467 million (June 2014). Each licensed self-insurer is required to make provisions in its audited accounts for these liabilities. In addition, these liabilities are backed by bank guarantees of some $719 million as well as other prudential safeguards.
The revenue from premiums in 2013–14 was $411.1 million, compared to $341.7 million in 2012–13.
Table 7.1 Scheme revenue
2009–10 2010–11 2011–12 2012 13 2013 14
Premium revenue $M 212.8 221.4 271.3 341.7 411.1
Licence fee revenue $M 12.8 13.3 13.8 14.8 14.8
Government appropriations $M 120.2 572.8 338.2 56.9 69.7
Interest $M 15.6 19.6 21.0 21.4 21.7
Sales of goods and rendering of services $M (including regulatory contribution) 23.0 19.6 21.1 20.3 22.1
Note:Government appropriations in 2010–11 and 2011–12 have been adjusted to reflect additional revenue available to Comcare following a change in accounting policy on the provision for outstanding claims liabilities. Refer to 7.4.1 Outstanding claims liabilities for additional information.

COMCARE Compendium of WHS and Workers’ Compensation Statistics (version 1.1) 49
7.2 PREMIUMS
Figure 7.1 shows the average premium rates for Australian Government employers and the ACT Government. Employers are financially accountable for the cost of work-related injury and disease through the payment of an annual premium. The premium rate that Comcare sets for each employer reflects that employer’s claim frequency and average claim cost as a percentage of their payroll.
In 2013–14 there was an increase in the average premium rate for premium payers in the Comcare scheme. Australian Government premium payers have seen an average increase of 20 per cent. Over the same period, the ACT Government experienced an increase of 14 per cent.
In addition, the CPM Report7 states that in 2013–14 the standardised Australian average premium rate was 1.52 per cent of payroll, with the Australian Government scheme recording the lowest standardised premium rate of all jurisdictions at 0.99 per cent of payroll.
Figure 7.1 Australian Government and ACT Government premium rates (including GST)
7 Comparative Performance Monitoring Report (CPM Report), Sixteenth Edition, 2014 www.swa.gov.au. Note that these data are different from Comcare published rates due to the adjustments made to the data to enable more accurate jurisdictional comparisons.
4.0
3.5
3.0
2.5
2.0
1.5
1.0
0.5
0.0
2.74 3.00 3.39
1.41
1.77
3.92 3.91
1.81
1.201.25
2009–10 2010–11 2011–12 2012–13 2013–14
Prem
ium
rate
(%
of p
ayro
ll)
Australian Government ACT Government

50 COMCARE Compendium of WHS and Workers’ Compensation Statistics (version 1.1)
7.3 SCHEME PAYMENTS
Figure 7.2 shows total payments made for workers’ compensation claims for the financial years 2009–10 to 2013–14. These figures include payments to injured workers and payments for medical, rehabilitation, legal and administrative costs.
The total payments for workers’ compensation claims in 2013–14 was $410.5 million, which represents an increase of approximately 25 per cent from 2009–10.
Figure 7.2 Workers’ compensation expenditure
450
400
350
300
250
200
150
100
50
02010 2011 2012 2013 2014
Tota
l exp
endi
ture
$(M
)
Financial year
329.7 342.8364.2
399.5410.5
7.3.1 Scheme claim payments by type
Figure 7.3 provides a breakdown of claim payments by payment type for the financial years 2009–10 to 2013–14.
Figure 7.3 Workers’ compensation payments
Note: ‘Other’ includes: Death benefits, lump sum payments and non-compensation payments such as general investigation and travel (excluding ambulance) costs.
100%
90%
80%
70%
60%
50%
40%
30%
20%
10%
0%
Perc
enta
ge o
f all
paym
ents
Paid in the financial year
2010 2011 2012 2013
Incapcity Medical Rehabilitation Legal Other
2014
53%
9%
24%
4%
10%
54%
8%
24%
5%
9%
54%
6%
25%
5%
10%
55%
6%
23%
5%
10%
55%
7%
21%
6%
10%

COMCARE Compendium of WHS and Workers’ Compensation Statistics (version 1.1) 51
7.4 PERFORMANCE
7.4.1 Outstanding claims liabilities
Table 7.2 shows the value of outstanding claims liabilities for the premium-funded scheme for the period 30 June 2010 to 30 June 2014.
In 2012–13 Comcare changed its accounting policy on the provision for outstanding claims liabilities. The change was made in response to recommendations from an internal financial framework review, which was supported by the 2013 review of the SRC Act by Mr Peter Hanks QC and Dr Allan Hawke AC. The change involves reporting claims provisions on the basis of the actuarial estimate at a 75 per cent probability of sufficiency instead of the central estimate (50 per cent probability of sufficiency).
In line with this change all previous years’ liability figures have been adjusted to enable comparability.
The liability estimates are provided by independent consulting actuaries.
The increase in liability reflects the changes in valuation assumptions to take account of the most recent claims experience and changing economic conditions.
Table 7.2 Outstanding claims liabilities (premium funded scheme)
30 June 2010 30 June 2011 30 June 2012 30 June 2013 30 June 2014
Premium payers $M 1430 1695 2458 2658 2766
7.4.2 Funding ratio
Table 7.3 sets out the funding ratio of assets to net outstanding claim liabilities (at 75 per cent probability of sufficiency). The measure indicates Comcare’s ability to meet future claim payments from assets currently available.
Comcare’s funding ratio saw a modest increase in 2013–14. This improvement is the result of a concerted and ongoing effort to enhance its claims management practices and partnering with employers to improve return to work outcomes. The initial decline was due to a substantial increase in the value of total claim liabilities.
Table 7.3 Comcare funding ratio
30 June 2010 30 June 2011 30 June 2012 30 June 2013 30 June 2014
Funding ratio 104% 91% 65% 64% 68%
52 COMCARE Compendium of WHS and Workers’ Compensation Statistics (version 1.1)
8 DATA SOURCES AND RELATED INFORMATIONWorkers’ compensation claims data presented in this report are extracted from the SRC Commission Data Warehouse using data as at 31 August 2014. The Commission Data Warehouse is maintained by Comcare and holds unit record claims information for all determining authorities covered under the SRC Act. This includes the Australian and ACT Governments and licenced self-insurers.
The Safety, Rehabilitation and Compensation and Other Legislation Amendment Act 2007 amended the provisions of the Safety, Rehabilitation and Compensation Act 1988 to remove coverage for injuries sustained during non-work related journeys. Therefore, injuries sustained while travelling to and from work are not included in this report.
Work health safety notification and notified fatalities data presented in this report are extracted from Comcare’s Regulatory Management System. The Regulatory Management System holds information on all notifiable incidents that result in death, serious injury or illness or dangerous incident.
Full-time equivalent (FTE) employee data are collected by Comcare from all Australian and ACT Government and licenced self-insurers. Australian Defence Force (ADF) FTE is obtained from the ADF Annual Report or directly from the Department of Defence.
Related data sources:
Comcare Annual Reports http://www.comcare.gov.au/Forms_and_Publications/publications/corporate_publications/comcare_annual_reports
List of current licenced self-insurers under the SRC Act http://www.srcc.gov.au/self_insurance/current_licensees
Safe Work Australia national jurisdictional data:
Safe Work Australia’s Comparative Performance Monitoring Report (CPM) http://www.safeworkaustralia.gov.au/sites/swa/about/publications/pages/cpm-16
Comparison of Workers’ Compensation Arrangements in Australia and New Zealand http://www.safeworkaustralia.gov.au/sites/swa/about/publications/pages/comparison
National Return to Work Survey—Headline Measures Report http://www.safeworkaustralia.gov.au/sites/swa/about/publications/pages/national-return-to-work-survey-2014
Australian Bureau of Statistics data:
Employment and Earnings, Public Sector, Australia, 2013–14 #6248.0.55.002 http://www.abs.gov.au/AUSSTATS/[email protected]/allprimarymainfeatures/389EBF5407C7D5AACA25755A000D09CC? opendocument
Australian Labour Market Statistics #6105.0 http://www.abs.gov.au/ausstats/[email protected]/mf/6105.0
Australian and New Zealand Standard Industrial Classification (ANZSIC), 2006 http://www.abs.gov.au/AUSSTATS/[email protected]/allprimarymainfeatures/A77D93484DC49D63CA25712300056842?opendocument
Type of Occurrence Classification System (TOOCS) http://www.safeworkaustralia.gov.au/sites/swa/about/publications/pages/sr20080501toocs3rdeditionrevision
Australian Public Service Employment Database internet interface (APSEDii) https://apsc.gov.au/apsedii/APSEDIIFirstPage_index.shtm

COMCARE Compendium of WHS and Workers’ Compensation Statistics (version 1.1) 53
9 GLOSSARY/DEFINITIONSAAT Administrative Appeals Tribunal, which can on request, review administrative decisions by
most Australian and ACT Government departments and authorities. This includes reviewing reconsideration decisions made by Comcare. Either an employee or an employer may request a review of a decision.
Accepted claim A claim for compensation where liability has been accepted under the SRC Act.
ACT Australian Capital Territory
ADF Australian Defence Force
Administrative Appeals Tribunal
See AAT
Affirmation rate (appeals) The percentage of the AAT’s affirmation of a determining authority’s original decision following an appeal.
Affirmation rate (reconsiderations)
The percentage of the determining authority’s affirmation of its original decision following a reconsideration.
ANZSIC 2006 The industry in which an occupational injury or disease occurred is classified in accordance with the Australian and New Zealand Standard Industrial Classification 2006 (ANZSIC) (cat no. 1292.0).
Average claim cost to date Average cost per claim (for a defined period of time) as at a specified date.
Average lost time to date Average amount of time lost accumulated per claim as at a specified date for a defined period of time.
Case manager Responsible for workplace-based management of an injured employee’s return to work plan, including initiating, coordinating and monitoring the rehabilitation process. The employer is responsible for providing case managers, who are usually employees of the organisation.
Central estimate An estimate of the liability for outstanding claims which is intended to be the expected value of the liabilities, with no margin for the uncertainty of the estimation.
Claim Any compliant claim for compensation, for example, the initial liability claim, claim for payment of medical expenses, claim for impairment payments, claim for cost of services rendered or claim for incapacity benefits.
Claim received A claim for compensation where liability has not yet been determined under the SRC Act.
Claims acceptance rate Accepted claims expressed as a percentage of determined claims.
Claims management The management of an injured person’s claim, including registration of a claim, decision making, benefit payment and return to work planning. For a claim lodged with Comcare, a Comcare employee manages the claim.
Comcare scheme The Commonwealth work health and safety, rehabilitation and workers’ compensation scheme.
Commission See Safety, Rehabilitation and Compensation Commission
CPM Report Comparative Performance Monitoring report, which is produced annually and provides a comparison of work health and safety and workers’ compensation schemes in Australia and New Zealand.
Commuting Travel to or from work as defined in section 6 of the SRC Act. This does not include travel associated with employment. That is where travel is part of an employee’s duties or where the cost of travel is met by the employer.

54 COMCARE Compendium of WHS and Workers’ Compensation Statistics (version 1.1)
Dangerous incident Under section 37 of the Work Health and Safety Act 2011, a ‘dangerous incident’ means an incident in relation to a workplace that exposes a worker or any other person to a serious risk to a person’s health and safety.
Date of determination The date upon which a decision was made regarding liability to pay a claim or to provide rehabilitation. For a new claim the date of determination means the date upon which the first decision was taken to either accept or deny liability.
Date of injury or date of disease
Date when medical treatment was first sought, or first resulted in incapacity or impairment (disease) as defined by section 7(4) of the SRC Act.
Date of receipt Refers to the date on which the claim or request for reconsideration, being compliant with legislative requirements, was received in the area responsible for determining claims.
Determination A decision regarding liability for compensation or rehabilitation under the SRC Act. For a new claim, determination means the initial decision regarding liability.
Determining authority An entity with legislative responsibility to receive, determine and pay workers’ compensation claims under the SRC Act, namely:
> Comcare
> corporations or Commonwealth authorities holding a self-insurance licence
> the Military, Rehabilitation and Compensation Commission.
Disease claim Workers’ compensation claim coded with a nature of injury of between 401 and 599, or 721 and 949, using the Type of Occurrence Classification System 3rd Edition.
Disease From 13 April 2007 any ailment suffered by an employee, or the aggravation of such an ailment, that is contributed to, to a significant degree (previously ‘contributed to in a material degree’), by the employee’s employment. Disease is defined by the Nature of Injury classification in the Type of Occurrence Classification System 3rd Edition.
Frequency rate The number of cases expressed as a rate per million hours worked by employees.
Full-time equivalent (FTE) employees
The total hours worked by all employees in the reporting period divided by the average/standard hours worked in full-time jobs.
HWCA Heads of Workers’ Compensation Authorities
Impairment The loss, the loss of use, or the damage or malfunction, of any bodily system or function or part of such system or function. A permanent impairment is one that is likely to continue indefinitely.
Incapacity A diminished ability to engage in any work; or to engage in work at the same level at which he or she was engaged immediately before the injury happened.
Incapacity benefit A payment made by a determining authority to compensate for a period of incapacity.
Incidence rate The number of cases expressed as a rate per 1000 FTE employees. Incidence rates for deaths are expressed as a rate per 100 000 FTE employees.
Injury claim Workers’ compensation claim coded with a nature of injury of between 101 and 399, or 951 and 999, using the Type of Occurrence Classification System 3rd Edition.
Injured worker An employee who makes a claim for compensation benefits in accordance with the SRC Act.
Liability The effect of a determination. Where liability is accepted a legal obligation is created to pay compensation under the SRC Act.

COMCARE Compendium of WHS and Workers’ Compensation Statistics (version 1.1) 55
Licensed self-insurers A Commonwealth authority or a corporation that is a holder of a licence under Part VIII of the SRC Act.
Mechanism of incident Type of Occurrence Classification System classification that identifies the overall action, exposure or event that best describes the circumstances that resulted in the most serious injury or disease.
Median The median is a measure of central tendency of a sample and is the value for which one half (50 per cent) of the observations when ranked will lie above that value and one half will lie below that value.
MOI See mechanism of incident
MRC Act Military Rehabilitation and Compensation Act 2004
Non-commuting injury An injury sustained other than when travelling to or from work, as defined in s. 6 of the SRC Act. This includes travel associated with employment. That is where the travel is part of an employee’s duties or where the cost of travel is met by the employer (see commuting).
Notifiable incident Under section 35 of the Work Health and Safety Act 2011 a ‘notifiable incident’ means:
(a) the death of a person; or
(b) a serious injury or illness of a person; or
(c) a dangerous incident.
Occupational rehabilitation A managed process involving early intervention with appropriate, adequate and timely services based on assessed needs, and which is aimed at maintaining injured or ill employees in, or returning them to, suitable employment.
Person Conducting Business or Undertaking (PCBU)
A person who conducts the business or undertaking. This could be an individual undertaking or a business working with others. The definition of a PCBU focuses on the work arrangements and the relationships to carry out the work.
Premium A contribution made to Comcare in respect of the estimated costs of an employer’s workers’ compensation costs for a given financial year. It is based on fully funded principles and is designed to be responsive to the employer’s claims experience.
Premium claim Claim with a date of injury after the introduction of Comcare’s premium system on 1 July 1989. Also referred to as an ‘insured’ claim.
Premium rate Rate expressed as a percentage of wage/salary dollar, which when multiplied by the estimate of wage/salary, will provide the premium payable by that employer.
Pre-premium claim Claim with a date of injury prior to the introduction of Comcare’s premium system on 1 July 1989. These claims and the resultant expenditure may also be called ‘uninsured’.
Provider Person or organisation providing medical, rehabilitation or health services in relation to a work-related injury or disease.
Psychological Disease claim Workers’ compensation claim coded with a nature of injury of between 702 and 719 ‘Mental Diseases’ using the Type of Occurrence Classification System 3rd Edition
Reconsideration An employee or employer, who is dissatisfied with a decision made by Comcare, may ask for that decision to be reviewed by an officer not involved in the making of the decision in question. The result of such a review is a reviewable decision.
Rehabilitation See occupational rehabilitation
Return to work plan (RTWP) A document detailing an injured worker’s rehabilitation program including return to work objectives, timeframes, a breakdown of proposed services and costs.

56 COMCARE Compendium of WHS and Workers’ Compensation Statistics (version 1.1)
Reviewable decision The term used to describe a decision reconsidered by Comcare under s. 38 or s. 62 of the SRC Act. Only when there is a reviewable decision can there be an application to the AAT (see also reconsideration and AAT).
Safe Work Australia Safe Work Australia was established by the Safe Work Australia Act 2008 with primary responsibility to lead the development of policy to improve work health and safety and workers’ compensation across Australia.
Safety, Rehabilitation and Compensation Act 1988 (SRC Act)
The legislation which established Comcare and defines how the workers’ compensation function is to be administered for the Australian Government or ACT Government and any corporation that is a holder of a licence under Part VIII of the SRC Act.
Safety, Rehabilitation and Compensation Commission (SRCC or the Commission)
Is responsible for issuing licences for self-insurance and claims management. It reports to the Minister for Employment and Workplace Relations.
Scheme See Comcare scheme
Serious injury or illness Under section 36 of the Work Health and Safety Act 2011, a ‘serious injury or illness’ of a person means an injury or illness requiring the person to have:
(a) immediate treatment as an in-patient in a hospital; or
(b) immediate treatment for:
(i) the amputation of any part of his or her body; or
(ii) a serious head injury; or
(iii) a serious eye injury; or
(iv) a serious burn; or
(v) the separation of his or her skin from an underlying tissue (such as degloving or scalping); or
(vi) a spinal injury; or
(vii) the loss of a bodily function; or
(viii) serious lacerations; or
(c) medical treatment within 48 hours of exposure to a substance;
and includes any other injury or illness prescribed by the regulations but does not include an illness or injury of a prescribed kind.
SRC Act See Safety, Rehabilitation and Compensation Act 1988
SRCC See Safety, Rehabilitation and Compensation Commission
Time lost claims All accepted claims which have resulted in one day or more time lost from work.
TOOCS See Type of Occurrence Classification System
Type of Occurrence Classification System (TOOCS)
Provides a system for coding the circumstances surrounding an injury/disease occurrence. Current classification system in use is the Type of Occurrence Classification System 3rd Edition—TOOCS 3.1.
WHS Act Work Health and Safety Act 2011
WHS Code 2011 Work Health and Safety Approved Codes of Practice 2011
Work Health and Safety Act 2011 (WHS Act)
Provides a balanced and consistent framework to secure the health and safety of workers and workplaces for Australian Government departments and authorities, and licensed self-insurers.
COMCARE Compendium of WHS and Workers’ Compensation Statistics (version 1.1) 57
Work-related The incident arose out of the conduct of the employer's undertaking, or work performed by an employee in connection with the employer's undertaking.
Workers’ compensation expenditure
Expenditure under the SRC Act. Includes expenditure on incapacity, medical and associated travel, rehabilitation costs, certain legal costs and other claim related expenses.
Workplace A workplace under section 8 of the Work Health and Safety Act 2011, a ‘workplace’ is:
(1) A place where work is carried out for a business or undertaking and includes any place where a worker goes, or is likely to be, while at work.
(2) In this section, place includes:
> a vehicle, vessel, aircraft or other mobile structure; and
> any waters and any installation on land, on the bed of any waters or floating on any waters.
WRP Workplace Rehabilitation Provider under the SRC Act. Employers may only engage rehabilitation providers that have been approved by Comcare. Rehabilitation providers assist the employer’s case manager to identify medically suitable duties as part of the return to work plan.
Year of initial determination Financial year in which liability is first accepted for a claim.

1300 366 979 | COMCARE.GOV.AU