Compendium Of Workers Compensation Statistics 2007-08€¦ · Web viewCompendium of Workers’...
208
COMPENDIUM OF WORKERS’ COMPENSATION STATISTICS AUSTRALIA 2007–08 January 2010
Transcript of Compendium Of Workers Compensation Statistics 2007-08€¦ · Web viewCompendium of Workers’...

COMPENDIUM OF WORKERS’ COMPENSATION STATISTICS AUSTRALIA 2007–08
January 2010


Safe Work Australia
Compendium of Workers’ Compensation Statistics
Australia 2007–08
January 2010
Disclaimer
The information provided in this document can only assist you in the most general way. This document does not replace any statutory requirements under any relevant State and Territory legislation. Safe Work Australia is not liable for any loss resulting from any action taken or reliance made by you on the information or material contained on this document. Before relying on the material, users should carefully make their own assessment as to its accuracy, currency, completeness and relevance for their purposes, and should obtain any appropriate professional advice relevant to their particular circumstances.
To the extent that the material on this document includes views or recommendations of thirdparties, such views or recommendations do not necessarily reflect the views of Safe Work Australia or indicate its commitment to a particular course of action.
Online Publication Copyright notice
© Commonwealth of Australia 2010
ISBN 978-0-642-32931-8 (Online PDF)ISBN 978-0-642-32932-5 (Online Word document)
This work is copyright. You may download, display, print and reproduce this material for your personal, non-commercial use or use within your organisation, provided that an appropriate acknowledgement is made (retaining this notice), and the material is not altered or subjected to derogatory treatment. Apart from any use as permitted under the Copyright Act 1968, allother rights are reserved. Requests and inquiries concerning reproduction and rights should be addressed to Commonwealth Copyright Administration, Attorney-General’s Department, Robert Garran Offices, National Circuit, Barton ACT 2600 http://www.ag.gov.au/cca

Foreword
This publication is the seventeenth in the annual Compendium series. While the Compendium is restricted to the analysis of accepted workers’ compensation claims, it nevertheless provides a good indicator of Australia’s Occupational Health and Safety (OHS) performance in 2007–08 and allows trends in OHS performance over time to be analysed. Data are presentedby key variables such as industry, occupation, age and sex with supporting information on the circumstances surrounding work-related injury and disease occurrences. The data in this report were compiled according to the concepts and definitions set out in the National Data Set for Compensation- based Statistics (NDS).
Changes to data reported for prior years will be evident for median time lost and median payments. This is due to a revision in the way these medians are calculated, resulting in lower estimates in this report.
Additional NDS-based information may be obtained from the National Online Statistics Interactive database (NOSI). This web-based statistics database can be interrogated to provide the data shown in this publication and in more detail. The NOSI database (http://nosi.ascc.go v .au/ ), as well as reports using other sources of national OHS statistics, can be found on the Safe Work Australia website http://safeworkaustralia.go v .au/ .
While data is collected at the jurisdictional level it is not shown in this report as there are many factors which impact on the comparabilityof these data. These factors are taken into consideration in the Comparative Performance Monitoring (CPM) report which is published annually. The CPM report presents comparable jurisdictional information on the incidence and frequency of work-related injuries, disease and fatalities and is available at http://ww w .deew r .go v .au/ W orkplaceRelations/WRMC/Pages/Reports.a spx .
iii


Contents
Foreword ............................................................................................ iii
Standard symbols and abbreviations.............................................. vi
Summary of findings........................................................................ vii
Part A: Serious claims, 2007–08p ..................................................... 1
Part B: Serious claims, trends over time ....................................... 13
Part C: Compensated fatalities ....................................................... 33
Part D: Priority industry profiles ..................................................... 43Agriculture, forestry & fishing .......................................... 43Construction....................................................................... 50Health & community services........................................... 57Manufacturing .................................................................... 63Mining ................................................................................. 71Transport & storage........................................................... 78
Appendixes ....................................................................................... 87Appendix 1 — Definitions and explanatory notes .......... 87Appendix 2 — Reliability of the data................................ 95Appendix 3 — Contact information.................................. 96
v

Standard symbols and abbreviations
The following standard symbols are used in this publication: ABS Australian Bureau of StatisticsANZSIC Australian and New Zealand Standard Industrial Classification ASCO Australian Standard Classification of Occupations, 2nd edition CPM Comparative Performance Monitoringn.a. not applicableNDS National Data Set for Compensation-based Statistics n.e.c. not elsewhere classifiedp preliminary dataTOOCS Type of Occurrence Classification System* Asterisked incidence and frequency rates in tables are
calculated on the basis of denominator estimates with a relative standard error of 25% or more, but less than 50%.
** data is not suitable for publication because the relative standard error is 50% or more
vi

Summary of findings
Part A: Summary of serious claims, 2007–08pSummary Preliminary data show there were 131 110 serious workers’
compensation claims in 2007–08, which equates to 13.5 claims per 1000 employees or 8.0 claims per million hours worked.
Sex Men accounted for 68% of all serious claims with incidence rates formale employees almost twice that of females: 17.4 claims per 1000 male employees compared with 9.1 claims per 1000 female employees.
Age Incidence rates increased progressively with age. There were 8.4 claims per 1000 employees aged 15–19 years, which increased to 17.6 claims per 1000 employees aged 60–64 years.
Industry The Transport & storage; Agriculture, forestry & fishing; Manufacturing; and Construction industries had incidence rates substantially above the national rate. Rates for these industries ranged between 21.6 and 24.4 claims per 1000 employees.
Occupation The occupational group with the highest incidence rate of serious claims was Labourers & related workers (37.7 claims per 1000 employees). Intermediate production & transport workers had the second highest rate with 28.2 claims per 1000 employees.
Nature of injury or diseaseThe most common injury leading to serious claims was Sprains & strains of joints & adjacent muscles, which accounted for 43% of all serious claims. The most common diseases resulting in serious claims were Disorders of muscle, tendons & other soft tissues (6% of all serious claims), Dorsopathies – disorders of spinal vertebrae (6% of all serious claims) and Mental disorders (5% of all serious claims).
Location of injury or diseaseAlmost one-quarter (23%) of all serious claims involved the Back. Other common locations were Hand (13%), Shoulder (9%) and Knee (9%).
Mechanism of injury or diseaseManual handling mechanisms (Body stressing) were the cause of 41%of all serious claims. These included Muscular stress while lifting objects (18% of all serious claims) and Muscular stress while handling objects (15%). Falls on the same level accounted for 13% of all serious claims.
Breakdown agency of injury or diseaseNon-powered handtools, appliances & equipment was the most common breakdown agency leading to an injury or illness, representing 26% ofall serious claims. The second most common breakdown agency was Environmental agencies, which accounted for 16% of all serious claims. Included in this category are factors such as steps and stairways, floor conditions and weather and ground conditions.
Compendium of Workers’ Compensation Statistics Australia 2007–08.. vii

Part B: Trends over time, 2002–03 to 2006–07Over the period 2002–03 to 2006–07, the number of serious claims decreased 4% from 140 305 claims to 134 105. At the same time, the incidence rates for serious injuries fell 15%, from 16.5 serious claims per1000 employees in 2002–03 to 14.1 in 2006–07, and the frequency rates13%, from 9.6 serious claims per million hours worked in 2002–03 to8.4 serious claims per million hours worked in 2006–07. This was due to decreasing numbers of serious claims over the six-year period, combined with increasing employee numbers.
All industries recorded falls in incidence rates over the period. The Communication services industry recorded the greatest percentage decrease, 36%, followed by the Mining industry (33%); the Finance & insurance industry (24%) and the Construction industry (22%).
Payments and time lostOver the period 2002–03 to 2006–07 the median time lost from work fell slightly from 4.0 working weeks to 3.9. In 2006–07 median time lost for male employees was 3.6 working weeks and for female employees 4.5 working weeks. This difference between claims lodged by males and females has remained relatively constant over the six years.
Median payments for female employees were $5500 in 2006–07. This is lower than the $6000 recorded for male employees with the higher time lost for female employees more than offset by lower wages. The median payment for all serious claims rose 18% from $4900 to $5800 over the six year period.
Part C: Compensated fatalitiesSummary Preliminary data show that in 2007–08 there were 232 compensated
fatalities. This is equivalent to an incidence rate of 2.4 fatalities per100 000 employees. Of these, 218 (94%) were male employees. Over the period from 2002–03 and 2006–07, the number of fatalities fell 14% from303 to 260. Over the same period, incidence rates fell by 25% from 3.6 compensated fatalities per 100 000 employees to 2.7.
Industry The Transport & storage industry recorded the highest number of fatalities in 2007–08p, 68, of which 52 were in Road freight transport. The Transport& storage industry also recorded the highest fatality incidence rate in2007–08p (15.1 compensated fatalities per 100 000 employees). This was followed by the Agriculture, forestry & fishing industry with a compensated fatality incidence rate of 12.6 and the Construction industry with 5.6.
Occupation Intermediate production & transport workers accounted for 40% (93 compensated fatalities) of the fatalities in 2007–08p. Almost two-thirds of these fatalities (61) were of Truck drivers. This was followed by Tradespersons & related workers with 41 fatalities and Labourers & related workers with 38 fatalities.
Mechanism of injury or diseaseA third of the fatalities in 2007–08p (98) were due to Vehicle accident followed by 24 deaths due to Long term contact with chemicals or substances, 16 due to Falls from a height and 15 due to Being hit by falling objects.
viii ... Safe Work Australia

Part ASerious claims, 2007–08p
The preliminary data for 2007–08 shows there were 131 110 claims accepted for workers’ compensation which involved a serious claim. Serious claims are those lodged in the reference year and accepted by the date at which the data are extracted and involve either a death; a permanent incapacity; or a temporary incapacity requiring an absence from work of one working week or more.
This number of claims equates to 13.5 serious claims per 1000 employees or 8.0 serious claims per million hours worked. However, as these data are preliminary (denoted throughout this publication by the letter ‘p’), they are subject to change as more claims are accepted or the absence from work increases to be equal or greater to one working week. Consequently, 2007–08p data understate the number of serious claims that will eventually be recorded for that year.
Serious claims by sexTable 1 shows that of the 131 110 serious claims lodged during 2007–08p,68% were from male employees and 32% from female employees.
Table 1 Serious claims: number, percentage of total, incidence rate and frequency rate by sex, 2007–08p
Sex Number of serious claims
Percentage Incidence ratea
Frequency rateb
Females 42 245 32% 9.1 6.4Males 88 865 68% 17.4 9.1Total 131 110 100% 13.5 8.0
a Calculated as a rate per 1000 employees.b Calculated as a rate per million hours worked.
Incidence ratesDifferences in the number of serious claims for male and female employees reflect underlying differences in both work safety outcomes and labour force participation for men and women. The incidence rate — measured as the number of serious claims per 1000 employees — takes into account differences in labour force participation, and can be used to compare the relative likelihood of work-related injury or disease between men and women.
Table 1 shows that male employees were almost twice as likely as female employees to lodge a serious claim for an injury or disease (17.4 serious claims for men per 1000 male employees compared with 9.1 serious claims for women per 1000 female employees).
The overall higher incidence rates of serious claims among male employees can primarily be attributed to the predominance of male employees in the more hazardous industries such as Construction
Compendium of Workers’ Compensation Statistics Australia 2007–08 ... 1

(7 males to every female); Mining (6 males to every female); Agriculture, forestry & fishing, Manufacturing and Transport & storage (all with an employee sex ratio of 3 males to every female).
Frequency ratesAnother way to examine differences in workplace injury or disease between different groups of employees — such as men and women — isto use frequency rates. This measure relates the number of serious claims reported among a given group of employees to the total time they spent working. This negates differences in the proportion of part-time employees between one group and another.
Table 1 shows that in 2007–08p frequency rates differed less between male and female employees than did incidence rates. This reflects the higher level of part-time work among women than among men. Using this measure, male employees were 1.4 times more likely than female employees to lodge a serious claim for injury or disease (9.1 seriousclaims per million hours worked by men compared with 6.4 serious claims per million hours worked by women).
Serious claims by age and sexTable 2 shows that serious claims were spread fairly evenly across the age groups in 2007–08p. Only 5% of serious claims involved employees aged less than 20 years, and a further 5% involved employees aged60–64 years. Since claims made by male employees constitute two thirds of all serious claims, the pattern by age for male employees drives the pattern for all claims. However, the pattern of claims lodged by female employees is different, with lower proportions in the younger age groups and the highest proportion (17% of female serious claims) recorded by the45–49 years age group.
Table 2 Serious claims: number, percentage of total, incidence rate and frequency rate by age and sex, 2007–08p
Number of serious claims Percentage of serious claims Incidence FrequencyAge group Females Males Total Females Males Total ratea rateb
15–19 years 1 685 4 855 6 540 4% 5% 5% 8.4 8.2
20–24 years 3 400 9 135 12 535 8% 10% 10% 10.6 6.7
25–29 years 3 440 9 085 12 530 8% 10% 10% 11.0 6.0
30–34 years 3 275 9 635 12 915 8% 11% 10% 12.1 6.8
35–39 years 4 535 10 630 15 165 11% 12% 12% 13.6 7.6
40–44 years 5 625 10 645 16 270 13% 12% 12% 14.8 8.3
45–49 years 7 090 10 850 17 940 17% 12% 14% 15.7 8.8
50–54 years 6 595 9 430 16 025 16% 11% 12% 16.7 9.4
55–59 years 4 315 8 015 12 330 10% 9% 9% 16.9 9.8
60–64 years 1 875 5 020 6 890 4% 6% 5% 17.6 11.2
Totalc 42 245 88 865 131 110 100% 100% 100% 13.5 8.0a Calculated as a rate per 1000 employees.b Calculated as a rate per million hours worked.c Includes claims from employees aged 65 years & over
2 ... Safe Work Australia
Part A: Serious claims, 2007–08p
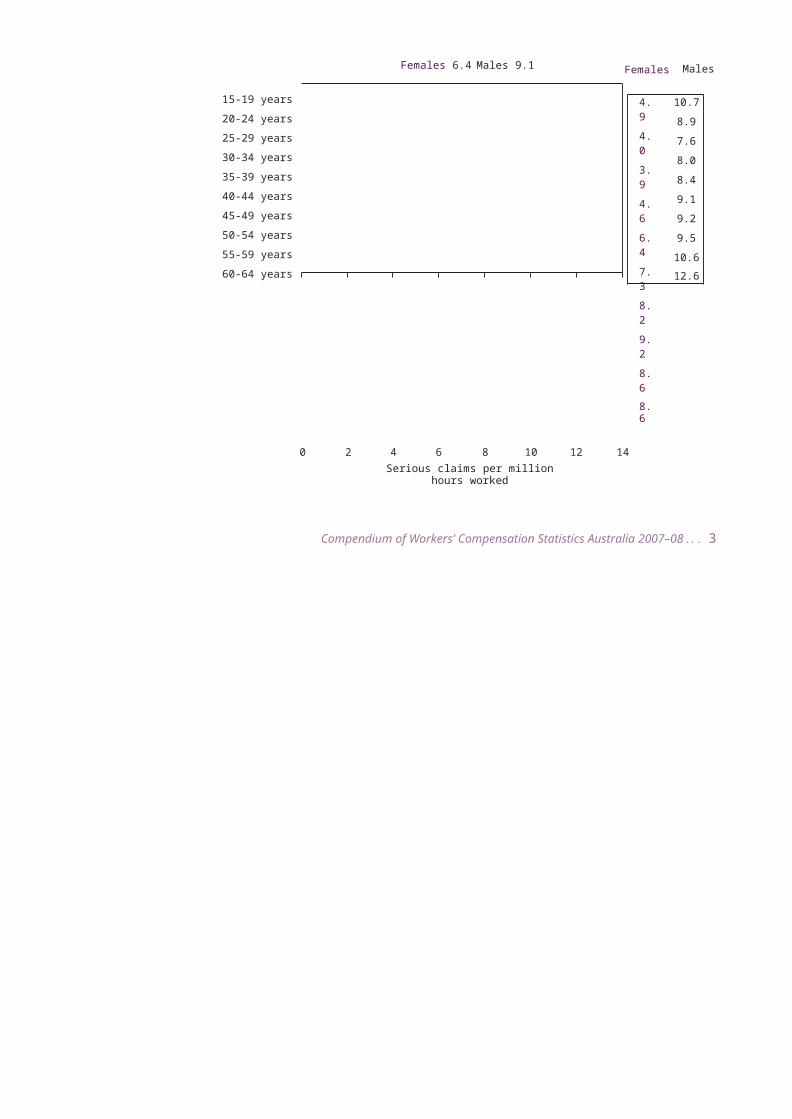
Incidence ratesTable 2 also shows that incidence rates increased progressively with age from 15–19 years (8.4 serious claims per 1000 employees) until 60–64 years (17.6 serious claims per 1000 employees). This pattern is broadly similar for men and women with incidence rates generally increasingwith age: up to a peak at 60–64 years of age for men and 50–54 years for women. Figure 1 shows that in 2007–08p incidence rates for male employees in each age group substantially exceeded the rate for female employees.
Figure 1 Serious claims: incidence rate by sex and age, 2007–08pFemales 9.1 Males 17.4 Females Males
15-19 years
20-24 years
25-29 years
30-34 years
35-39 years
40-44 years
45-49 years
50-54 years
55-59 years
60-64 years
4.3
5.9
6.5
6.9
9.0
10.4
12.4
13.9
12.6
11.1
12.7
15.2
14.9
16.4
17.4
19.1
19.2
19.3
20.8
22.6
0 5 10 15 20 25
Serious claims per 1000 employees
Frequency ratesIn contrast, there was substantially less variation in frequency rates than in incidence rates across age groups (Table 2). This indicates that, on a‘per hour’ basis, there is not a large difference in the frequency of workers’ compensation serious claims due to the age of the employee, although the smaller scale in Figure 2 may obscure this.
Figure 2 shows the frequency rates for male employees in 2007–08p exceeded the rate for female employees in all age groups, although the difference was very small in the 50–54 years age group.
Figure 2 Serious claims: frequency rate by sex and age, 2007–08p
Females 6.4 Males 9.1 Females Males
15-19 years
20-24 years25-29 years
30-34 years
35-39 years
40-44 years
45-49 years
50-54 years
55-59 years
60-64 years
4.9
4.0
3.9
4.6
6.4
7.38.2
9.2
8.6
8.6
10.7
8.9
7.6
8.0
8.4
9.19.2
9.5
10.6
12.6
0 2 4 6 8 10 12 14Serious claims per million hours worked
Compendium of Workers’ Compensation Statistics Australia 2007–08 ... 3

In common with the pattern of incidence rates across age groups, the highest frequency rates occurred among men aged 60–64 years and women aged 50–54 years (12.6 and 9.2 serious claims per million hours worked respectively). However, while the incidence rate for male employees aged 15–19 years was the lowest of all male age groups,when the part time nature of work was taken into account, their frequency rate (10.7 serious claims per million hours worked) was second only to male employees aged 60–64 years.
The data above are based on workers’ compensation claims and are therefore biased towards the groups of people who are more likely to lodge claims. A survey conducted by the Australian Bureau of Statisticson work-related injuries highlighted that young people in particular are the most unlikely to apply for compensation even for injuries which required more than one week off work (Australian Bureau of Statistics 2006, Work- related Injuries, Australia, 2005–06 (Cat. No. 6324.0)). The survey data showed that young workers incurred the highest rates of injury of all age groups.
Safe Work Australia has published a range of reports from these data that can be found at safeworkaustralia.gov.au. These reports show that compensation data provides a good picture of the industries in which injuries occur and the characteristics of those injuries but understates the full extent of even serious injuries.
Serious claims by industryTable 3 shows that just over half of all serious claims (52%) involved four industries: Manufacturing; Health & community services; Construction; and Retail trade.
Table 3 Serious claims: number and percentage of total by industry and sex, 2007–08pNumber of serious claims Percentage
Industry Females Males Total Females Males TotalManufacturing 3 595 20 715 24 315 9% 23% 19%
Health & community services 12 785 3 230 16 015 30% 4% 12%
Construction 330 14 080 14 410 1% 16% 11%
Retail trade 5 840 6 770 12 610 14% 8% 10%
Transport & storage 1 145 9 845 10 990 3% 11% 8%
Property & business services 3 245 7 300 10 545 8% 8% 8%
Education 4 335 2 175 6 510 10% 2% 5%
Wholesale trade 1 190 5 305 6 500 3% 6% 5%
Accommodation, cafes & restaurants 3 250 2 895 6 145 8% 3% 5%
Government administration & defence 1 770 3 315 5 090 4% 4% 4%
Personal & other services 1 450 3 635 5 085 3% 4% 4%
Agriculture, forestry & fishing 885 3 370 4 255 2% 4% 3%
Cultural & recreational services 1 050 1 725 2 775 2% 2% 2%
Mining 100 2 380 2 480 0% 3% 2%
Communication services 315 905 1 220 1% 1% 1%
Finance & insurance 815 270 1 085 2% 0% 1%
Electricity, gas & water supply 60 650 705 0% 1% 1%
Totala 42 245 88 865 131 110 100% 100% 100%
a Includes claims for which Industry was not stated
4 ... Safe Work Australia

Part A: Serious claims, 2007–08p
However the pattern for male and female employees is quite different. For female employees, 30% of serious claims were reported in the Health & community services industry with a further 14% in Retail trade and 10% in Education. For male employees, the highest proportions of serious claims were recorded in the Manufacturing industry (23%), the Construction industry (16%) and the Transport & storage industry (11%).
Incidence ratesFigure 3 shows that in 2007–08p, five industries had incidence rates substantially above the national rate of 13.5 serious claims per 1000 employees. These were Transport & storage; Agriculture, forestry & fishing; Manufacturing; Construction and Mining (ranging between 17.8 and 24.4 serious claims per 1000 employees). More information on these industries is available in Part D Priority Industry Profiles.
Figure 3 Serious claims: incidence rate by industry, 2007–08pAustralia 13.5
Transport & storage Agriculture, forestry & fishing
ManufacturingConstruction
Mining Wholesale trade
Personal & other services Health & community services
Accommodation, cafes & restaurants Government administration & defence
Cultural & recreational services Property & business services
Retail trade Electricity, gas & water supply
EducationCommunication services
Finance & insurance
24.424.324.121.617.815.514.514.411.610.310.28.88.48.18.17.12.9
0 5 10 15 20 25
Serious claims per 1000 employees
Frequency ratesWhen rates are calculated using hours worked, the five industries mentioned above continue to record rates well above the national rateof 8.0 serious claims per million hours worked. The only exception is the Mining industry, where the frequency rate was just below the national rate, reflecting longer hours worked in Mining compared to other industries.
The Accommodation, cafes & restaurants industry moved the other way, with incidence rates below the national average but frequency rates above the average, reflecting the shorter hours of work per employee. Therefore, due to the different patterns of work, frequency rates are considered the better measure for comparison purposes.
Figure 4 shows that the Agriculture, forestry & fishing; Transport & storage; and Manufacturing industries had the highest frequency rates ranging from 12.4 serious claims per million hours worked to 12.6. Similar to incidence rates, the Finance & insurance industry (1.6 serious claims per million hours worked) had the lowest rate of all industries.
Compendium of Workers’ Compensation Statistics Australia 2007–08 ... 5

Figure 4 Serious claims: frequency rate by industry, 2007–08pAustralia 8.0
Agriculture, forestry & fishing Transport & storage
Manufacturing Construction
Health & community services Personal & other services
Accommodation, cafes & restaurants Wholesale trade
MiningCultural & recreational services
Retail trade Government administration & defence
EducationProperty & business services
Electricity, gas & water supply Communication services
Finance & insurance
12.612.412.410.710.08.98.28.17.97.46.26.15.14.94.13.81.6
0 2 4 6 8 10 12 14
Serious claims per million hours worked
Serious claims by occupationTable 4 shows that approximately one-quarter of all serious claims were made by employees working as Labourers & related workers (30 870 serious claims). Tradespersons & related workers accounted for 20% of all serious claims and Intermediate production & transport workers, a further18% of all serious claims.
As claims from male employees accounted for two-thirds of all serious claims, the pattern for male employees is similar to the total. However, the pattern for female employees is different with the largest percentage of claims coming from employees working as Intermediate clerical, sales & service workers (26%) followed by Labourers & related workers (19%) and Professionals (19%).
Table 4 Serious claims: number and percentage of total by occupation and sex,2007–08p
Number of serious claims Percentage of serious claimsOccupation Females Males Total Females Males TotalLabourers & related workers 8 140 22 730 30 870 19% 26% 24%
Tradespersons & related workers 1 880 24 535 26 415 4% 28% 20%
Intermediate production & transport workers 2 210 21 770 23 980 5% 25% 18%
Intermediate clerical, sales & service workers 11 070 4 090 15 160 26% 5% 12%
Professionals 8 220 5 655 13 870 19% 6% 11%
Elementary clerical, sales & service workers 5 210 3 485 8 695 12% 4% 7%
Associate Professionals 3 825 4 660 8 485 9% 5% 6%
Managers & administrators 990 1 725 2 710 2% 2% 2%
Advanced clerical & service workers 690 200 890 2% 0% 1%
Total 42 245 88 865 131 110 100% 100% 100%
6 ... Safe Work Australia

Part A: Serious claims, 2007–08p
Incidence ratesFigure 5 shows that in 2007–08p, Labourers & related workers had the highest incidence rate, 37.7 serious claims per 1000 employees — nearly three times the national rate of 13.5 serious claims per 1000 employees. Intermediate production & transport workers and Tradespersons & related workers had rates around double the national rate (28.2 and 24.8 serious claims per 1000 employees respectively). All other occupation groups had rates below the national rate, with the lowest rate recorded by Advanced clerical & service workers (2.7 serious claims per 1000 employees).
Figure 5 Serious claims: incidence rate by occupation, 2007–08p
Australia 13.5
Labourers & related workers
Intermediate production & transport workers
Tradespersons & related workers
Elementary clerical, sales & service workers
Intermediate clerical, sales & service workers
Associate Professionals
Professionals
Managers & administrators
Advanced clerical & service workers
37.7
28.2
24.8
8.6
8.5
7.3
6.8
4.0
2.7
0 5 10 15 20 25 30 35 40Serious claims per 1000 employees
Table 5 shows the occupation sub-categories with the highest incidence rates in 2007–08p. Together, these sub-categories accounted for 29%of all serious claims. The highest incidence rate (70.4 serious claims per1000 employees) occurred among Skilled agricultural workers: more thanfive times the national rate. Skilled agricultural workers accounted for0.1% of all employees and 1% of Tradespersons & related workers.
Table 5 Serious claims: number, percentage of total, and incidence rate by occupation sub- categoriesa with the highest incidence rates, 2007–08p
Occupation sub-category Number of Percentage of Percentage of serious claims serious claims employees Incidence Rate
b
Skilled agricultural workers 600 0.5% 0.1% 70.4
Process workers 7 975 6.1% 1.5% 54.1
Fabrication engineering tradespersons 3 495 2.7% 0.8% 43.0
Mining, construction & related labourers 4 325 3.3% 1.1% 40.4
Road & rail transport drivers 9 945 7.6% 2.7% 37.6
Agricultural & horticultural labourers 2 850 2.2% 0.9% 33.5
Structural construction tradespersons 4 115 3.1% 1.4% 31.0
Intermediate mining & construction workers 1 640 1.3% 0.6% 29.5
Police officers 1 300 1.0% 0.5% 28.8
Welfare associate professionals 660 0.5% 0.3% 25.9
Plumbers 1 330 1.0% 0.5% 25.8
a Compiled at the 3rd level of the Australian Standard Classification of Occupations (ASCO), 2nd Edition. Occupations limited to those involving more than 500 serious claims, ‘Miscellaneous’ categories are excluded. Occupations for which the estimate of employees had a relative standard error exceeding 25% are excluded.b Calculated as a rate per 1000 employees.
Compendium of Workers’ Compensation Statistics Australia 2007–08 ... 7

The next highest incidence rate (54.1 serious claims per 1000 employees)occurred among Process workers: more than four times the national rate. Process workers accounted for 1.5% of all employees and 17% of Labourers & related workers.
Of the occupation sub-categories with the highest incidence rates, Road& rail transport drivers represented the greatest proportion of employees,2.7%, and recorded the fifth highest incidence rate (37.6 serious claims per 1000 employees).
Frequency ratesFigure 6 shows that in 2007–08p, the frequency rate pattern by occupation was quite similar to that displayed in the graph of incidence rates (Figure5). This similarity between the two measures indicates that at this broad level of aggregation, differences in hours worked between occupation groups were small.
Figure 6 also shows that Labourers & related workers had the highest frequency rate, 24.9 serious claims per million hours worked — more than three times the national rate of 8.0 serious claims per million hours worked. This rate was considerably higher than the rates for the second and third-ranking occupation groups: Intermediate production & transport workers and Tradespersons & related workers (15.2 and 12.7 seriousclaims per million hours worked respectively). All other occupation groups had rates below the national rate, with Advanced clerical & service workers having the lowest rate (1.8 serious claims per million hours worked).
Figure 6 Serious claims: frequency rate by occupation, 2007–08pAustralia 8.0
Labourers & related workers
Intermediate production & transport workers
Tradespersons & related workers
Elementary clerical, sales & service workers
Intermediate clerical, sales & service workers
Professionals
Associate Professionals
Managers & administrators
Advanced clerical & service workers
24.9
15.2
12.7
7.5
5.8
3.9
3.9
1.8
1.8
0 5 10 15 20 25 30Serious claims per million hours worked
Serious claims by the nature of injury or diseaseThe Nature of injury or disease classification is used to categorise the most serious injury or disease sustained by the employee. In 2007–08p, there were 97 000 serious claims for injury, accounting for 74% of all serious claims, and 34 105 serious claims for disease. However, the work-related disease figures shown in this publication may not be an accurate count of the full extent of work-related disease, because for avariety of reasons some diseases may not result in a compensation claim. In particular, the long latency period of many diseases means that it is
8 ... Safe Work Australia

b
Part A: Serious claims, 2007–08p
not always possible to conclusively establish a relationship between the disease and prior workplace exposure.
Figure 7 shows that claims for Sprains & strains of joints & adjacent muscles predominated, accounting for 43% of all serious claims. The next most common categories of injury-related claims were Fractures (9% of serious claims) and Open wound not involving traumatic amputation (8% of serious claims).
The most common diseases involved in serious claims were Disorders of muscle, tendons & other soft tissues (6% of serious claims); Dorsopathies— disorders of spinal vertebrae (6% of all serious claims); and Mental disorders (5% of serious claims).
Figure 7 Serious claims: percentage of claims by nature of injury or disease, 2007–08p
Sprains & strains of joints & adjacent musclesFractures
Open wound not involving traumatic amputation Contusion & crushing, excl. fractures
Disorders of muscle, tendons & other soft tissues Dorsopathies - disorders of the spinal vertebrae
Mental disordersDeafness
Hernia Burns
DislocationOther & unspecified injuries
Other diseases* Other injuries*
42.99.08.16.76.35.84.72.82.41.61.41.24.03.2
0 10 20 30 40
Percentage of serious claims
* These groupings are not formal Nature of injury or disease classifications. They include logical groupings of injuries and diseases that individually accounted for less than 1% of claims. For example, Other injuries includes Superficial injury, Multiple injuries and Other & unspecified injuries and Other diseases includes Contact dermatitis and Other diseases of skin & subcutaneous tissue.
Table 6 shows that in 2007–08p male employees were twice as likely to lodge a serious claim for injury and 1.7 times more likely to lodge a serious claim for a disease than female employees. Frequency rates show a closer pattern with male employees 1.5 times more likely to have a serious claim for injury and 1.2 times more likely to have a claim for a disease than female employees.Table 6 Serious claims: number, percentage of total, incidence rate and frequency rate by nature of injury or disease by sex, 2007–08p
Nature/Sex Number of serious claims
Percentage of serious claims
Incidenceratea Frequency rate
Injury claims 96 995 74% 10.0 5.9
Male 66 855 51% 13.0 6.8
Female 30 140 23% 6.5 4.6
Disease claims 34 110 26% 3.5 2.1
Male 22 005 17% 4.3 2.2
Female 12 105 9% 2.6 1.8
Total 131 110 100% 13.5 8.0a Calculated as a rate per 1000 employees.b Calculated as a rate per million hours worked.
Compendium of Workers’ Compensation Statistics Australia 2007–08 ... 9

Serious claims by bodily location of injury or diseaseThe Bodily location of injury or disease classification is used to identify the part of the body affected by the most serious injury or disease. At the broadest level of the classification, the most common bodily locations were Upper limbs (33% of serious claims) and Trunk (28% of serious claims).
Figure 8 shows the percentage distribution of serious claims in 2007–08p across bodily locations classified at a finer level of detail. The Back was the most common location of injury or disease, representing almostone-quarter (23%) of serious claims (among these claims 72% involved a problem in the lower back). The next most common bodily locations were Hand (13%), Shoulder (9%), Knee (9%), and Ankle (5%). Thenon-physical category Psychological systems was specified for 5%of all serious claims: this category covers conditions such as nervous breakdown, anxiety and depression.Figure 8 Serious claims: percentage of claims by bodily location of injury or disease, 2007–08p
Back Hands
Shoulder Knee Ankle
Psychological systemWristFoot
Abdomen and pelvic region Ear
ElbowLower leg
Neck Chest
ForearmMultiple locations*
Head excluding ear* Lower limbs other* Upper limbs other*
Other and unspecified locations*
22.712.99.28.54.84.74.63.43.43.02.22.22.21.81.74.72.92.12.11.0
0 5 10 15 20 25
Percentage of serious claims
* These categories are not formal Bodily location of injury or disease classifications. They are logical groupings of locations that individually accounted for less than 1% of claims.
Serious claims by mechanism of injury or diseaseThe Mechanism of injury or disease classification is used to describe the action, exposure or event that was the direct cause of the most serious injury or disease. The National OHS Strategy 2002–2012 identified four mechanisms whose prevalence demanded close monitoring. These mechanisms are Body stressing (also referred to as Manual handling); Falls, trips & slips of a person; Hitting objects with a part of the body; and Being hit by moving objects. In 2007–08p, these four mechanisms together accounted for 84% of serious claims. Each of these mechanisms has been the subject of a feature article in earlier publications.
Figure 9 shows the percentage distribution of serious claims in 2007–08p across mechanisms classified at a finer level of detail. Manual-handling mechanisms accounted for 41% of all serious claims. Within this group
10 ... Safe Work Australia
Part A: Serious claims, 2007–08p
Muscular stress while lifting, carrying or putting down objects accounted for 18% of serious claims and Muscular stress while handling objects, other than lifting, carrying or putting down a further 15%. The most common mechanism not related to manual handling was Falls on the same level, accounting for 13% of serious claims.
Figure 9 Serious claims: percentage of claims by mechanism of injury or disease, 2007–08p
Muscular stress while lifting objects Muscular stress while handling objects
Falls on the same levelFalls from a height
Muscular stress with no objects being handled Being hit by moving objects
Hitting moving objects Being hit by falling objects
Hitting stationary objectsLong term exposure to sounds
Repetitive movement, low muscle loading Vehicle accident
Being trapped between stationary & moving objectsWork pressure
Being assaulted by a person or persons Being trapped by moving machinery
Contact with hot objectsStepping, kneeling or sitting on objects
Work related harassment and/or workplace bullying Other
17.815.113.06.65.54.63.93.83.62.72.52.52.41.61.51.21.21.11.08.2
0 5 10 15 20
Percentage of serious claims
Serious claims by breakdown agency of injury or diseaseBreakdown agency refers to the object, substance or circumstance principally involved in, or most closely associated with, the point at which things started to go wrong, and which ultimately led to the most serious injury or disease. Figure 10 shows that 26% of serious claims in 2007–08p involved Non-powered handtools, appliances & equipment at the broad level of the classification. Out of these claims, the two most common sub- groups were Fastening, packing & packaging equipment and Furniture & fittings, accounting for 9% and 6% of serious claims respectively.
The second most common breakdown agency specified at the broad classification level was Environmental agencies (16% of serious claims). These claims were split almost equally at the sub-group level between Indoor environment and Outdoor environment with 7% and 9% of serious claims respectively. These sub-agencies include such factors as steps and stairways, floor conditions, weather and ground conditions.
Compendium of Workers’ Compensation Statistics Australia 2007–08 ... 11

Figure 10 Serious claims: percentage of claims by breakdown agency of injury or disease, 2007–08p
Non-powered handtools, appliances & equipment
Environmental agencies
Materials & substances
Animal, human & biological agencies
Mobile plant & transport
Machinery & (mainly) fixed plant
Powered equipment, tools & appliances
Chemicals & chemical products
Other & unspecified agencies
26.0
16.1
13.2
10.9
9.6
6.0
5.2
0.9
12.1
0 5 10 15 20 25 30
Percentage of serious claims
12 ... Safe Work Australia

Part BSerious claims, trends over time
The following analysis of trends uses data from 2002–03 to 2006–07. Data for the most recent available year (2007–08) is not used because it is preliminary (denoted throughout the publication with the letter‘p’). Data for 2006–07 has been revised since the last compendium was published, and may undergo further minor revisions in following years. However, data for this year provides a good reference point for identifying trends in the number and rate of workers’ compensation claims. The reader should also note that some of the changes in serious claim numbers and rates identified in this section may be related to changes in workers’ compensation legislation within the jurisdictions.
This report shows a decrease in incidence and frequency rates forall years, compared to the previous publication. This is the result of a review of how the estimates of the number of employees and number of hours worked were compiled by the Australian Bureau of Statistics. There have also been revisions to the claims data provided byjurisdictions, resulting in differences to the number of serious claims for all years back to 2002–03. More details can be found in the Explanatory notes.
The data show there has been a 4% decrease in the number of serious claims from 140 305 claims lodged in 2002–03 to 134 105 claims lodged in 2006–07 (see Figure 11). Serious claims are defined as accepted claims involving either a death, a permanent incapacity, or a temporary incapacity involving one working week or more absence from work but exclude claims which result from journeys to and from work.
The overall decrease in the number of serious claims over the five-year period, combined with increasing employee numbers (up from 8.5 million in 2002–03 to 9.5 million in 2006–07), has seen the incidence rate for compensated work-related injury or disease fall 15% from 16.5 serious claims per 1000 employees in 2002–03 to 14.1 in 2006–07 (Figure 12). Similarly, the frequency rate has fallen 13% over the same period from9.6 serious claims per million hours worked by employees to 8.4 serious claims per million hours worked by employees (Figure 13).
While similar, these numbers should not be confused with the target measurement under the National OHS Strategy 2002–2012. The OHS Strategy includes a target to reduce the incidence of work-related injury (including musculoskeletal disorders) by at least 40% by June 2012 with an interim target of a 20% reduction by June 2007. The base period for this target is the three-year period 2000–01 to 2002–03. Data from the Comparative Performance Monitoring Report, 11th Edition shows that there has been a 20% improvement recorded from the base period up to2007–08. More information on the National OHS Strategy can be found at http://ww w .safeworkaustralia.go v .au/NR/rdonlyres/E8D707CF-9E69- 4C61-A063-F04519170EF7/0/NationalOHSStrategy200212.pdf.
Compendium of Workers’ Compensation Statistics Australia 2007–08 ... 13

Cla
ims
per m
illio
n ho
urs
wor
ked
Cla
ims
per 1
000
empl
oyee
sN
umbe
r of s
erio
us c
laim
s ('0
00)
Trends by sexFigure 11 shows that over the period 2002–03 to 2006–07, the number of serious claims decreased by 5% for male employees and 3% for female employees. Claim numbers rose slightly from 2002–03 to 2004–05 before falling in 2005–06 and 2006–07. There has been little change in the split between serious claims lodged by females (32% of serious claims) and those lodged by males (68% of serious claims) over this period.Figure 11 Serious claims: number of claims by sex, 2002–03 to 2006–07
160
120
80
40
02002–03 2003–04 2004–05 2005–06 2006–07
Total 140 305 141 800 142 465 135 950 134 105
Male 95 950 96 200 96 435 92 340 90 945
Female 44 355 45 595 46 030 43 610 43 160
Figure 12 Serious claims: incidence rate by sex, 2002–03 to 2006–0725
20
15
10
5
02002–03 2003–04 2004–05 2005–06 2006–07
Total 16.5 16.4 16.0 14.8 14.1
Male 21.5 21.1 20.6 19.2 18.3
Female 11.0 11.2 10.9 10.0 9.6
Figure 13 Serious claims: frequency rate by sex, 2002–03 to 2006–0712
10
8
6
4
2
02002–03 2003–04 2004–05 2005–06 2006–07
Total 9.6 9.7 9.4 8.8 8.4
Male 10.9 10.9 10.6 10.0 9.5
Female 7.7 7.9 7.6 7.0 6.7
14 ... Safe Work Australia

Med
ian
time
lost
(wor
king
wee
ks)
Part B: Serious claims, trends over time
The number of employees has grown over the 2002–03 to 2006–07 period, with both male and female employee numbers increasing by12%. This growth, combined with decreases in the number of claims, has resulted in a 15% decrease in the incidence rate of serious claims for male employees, and a 13% decrease for female employees (see Figure 12). Incidence rates fell in most years, but more significantly in 2005–06 and2006–07.
Frequency rates also fell by 13% for both male and female employees over the five-year period (see Figure 13). Frequency rates fell in most years, most dramatically in 2005–06 and 2006–07.
Payments and time lostFigure 14 shows that median time lost from work for a serious claim ranged from 3.6 to 4.0 working weeks over the five-year period. The pattern for claims made by males and females followed a similar trend. In 2006–07, male employees required 3.6 working weeks off work while female employees required 4.5 working weeks. This difference between the sexes has been similar across the years showing that femaleemployees tend to take one more week off work than male employees for serious claims.
Figure 14 Serious claims: median time lost by sex, 2002–03 to 2006–07
5
4
3
2
1
02002–03 2003–04 2004–05 2005–06 2006–07
Total 4.0 3.7 3.6 3.8 3.9
Male 3.6 3.4 3.4 3.4 3.6
Female 4.7 4.4 4.3 4.5 4.5
Figure 15 shows that median payments increased 18% from $4900 in2002–03 to $5800 in 2006–07. In contrast to the median time lost, median payments showed less difference between male and female employee claims. Median payments to female employees were generally lower than median payments to male employees. This is most probably due to lower wages earned by females, which is partly offset by the longer time lost.
These figures show a decrease in all years from those published in the previous Compendium. This is due to a change in the number of claims used in the calculation of the medians. See Explanatory notes for details.
The reader should keep in mind that while a claim remains open, the time lost and associated payments can increase. Therefore, the next Compendium may also show updates to all years.
Compendium of Workers’ Compensation Statistics Australia 2007–08 ... 15

Med
ian
paym
ent (
$)
Figure 15 Serious claims: median payment by sex, 2002–03 to 2006–077000
6000
5000
4000
3000
2000
1000
02002–03 2003–04 2004–05 2005–06 2006–07
Total 4 900 5 200 5 300 5 600 5 800
Male 4 800 5 200 5 400 5 600 6 000
Female 5 000 5 200 5 100 5 500 5 500
Trends by age of employeeTable 7 presents information on the age of employees who lodged serious claims in the period 2002–03 to 2006–07. The age used in this report is the age of the employee on the date on which the injury occurred or, ifthe claim involved an occupational disease, when the disease was first reported to the employer. The proportion of claims lodged by employees in each age group has remained relatively stable over the six year period with similar proportions in the age groups from 20–24 years through to50–54 years (from 10% to 14% of all claims).
While the proportions of claims in each age group have not changedover time, the actual number of serious claims within each age group has shown differing results by group. The 55–59 years age group has shown a substantial increase over time (up 14%), whereas the largest percentage drops were recorded in the 30–34 years age group (down 18%) and the25–29 age group (down 14%).
Incidence rateWhile claims rose in some age groups and fell in others, the incidence rate in all age groups fell between 10% and 22%. This is the result of increases in the number of employees in each age group offsetting any increases in the number of claims.
Incidence rates, measured as serious claims per 1000 employees, can be used to compare the relative likelihood of work-related injury or disease at different ages. Table 7 shows that incidence rates generally increased with employees’ age. The lowest incidence rates were recorded by the 15–19 years age group (8.7 serious claims per 1000 employees in 2006–07) with the highest incidence rates generally recorded by the 55–59 years and60–64 years age groups (each 17.6 serious claims per 1000 employees in2006–07).
Over the period 2002–03 to 2006–07, there was a steady decline in incidence rates in all age groups. The largest decline (22%) occurred among employees aged 25–29 years: the rate fell from 14.8 serious claims per 1000 employees in 2002–03 to 11.6 in 2006–07. This age group recorded a 14% decrease in claim numbers. The 20–24 years age
16 ... Safe Work Australia

Part B: Serious claims, trends over time
group experienced a 18% fall in incidence rate due to a 6% decrease in claim numbers and a greater than average increase in employee numbers. The smallest decline, 10%, was recorded by both the 15–19 years and50–54 years age groups. These groups recorded little change in claim numbers and had a smaller than average increase in employee numbers.
Table 7 Serious claims: number of claims, incidence rate and frequency rate by age,2002–03 to 2006–07Age group 2002–03 2003–04 2004–05 2005–06 2006–07 % changea
Number of serious claims15–19 years 6 715 6 715 6 795 6 390 6 535 -3%
20–24 years 13 535 13 770 13 555 13 020 12 780 -6%
25–29 years 14 880 14 265 13 765 13 120 12 725 -14%
30–34 years 17 090 16 775 16 505 15 140 13 925 -18%
35–39 years 17 235 17 265 17 155 15 980 15 845 -8%
40–44 years 19 580 19 450 19 445 18 215 17 195 -12%
45–49 years 18 135 18 615 18 945 18 545 18 360 1%
50–54 years 16 285 16 600 16 635 15 910 16 330 0%
55–59 years 10 910 11 700 12 195 12 085 12 390 14%
60–64 years 4 775 5 195 5 670 5 870 6 240 31%
Total claimsb 140 305 141 800 142 465 135 950 134 105 -4%
Incidence rate (serious claims per 1000 employees)15–19 years 9.7 9.4 9.3 8.6 8.7 -10%
20–24 years 13.6 13.3 12.6 11.7 11.1 -18%
25–29 years 14.8 14.2 13.5 12.6 11.6 -22%
30–34 years 16.3 16.0 15.6 14.3 13.3 -18%
35–39 years 17.4 17.5 17.4 15.6 14.4 -17%
40–44 years 18.5 18.4 18.0 16.5 15.7 -15%
45–49 years 18.5 18.5 18.3 17.5 16.5 -11%
50–54 years 19.4 19.5 18.7 17.5 17.4 -10%
55–59 years 19.9 20.0 19.5 17.9 17.6 -12%
60–64 years 20.3 20.0 19.4 18.3 17.6 -13%
All claimsb 16.5 16.4 16.0 14.8 14.1 -15%
Frequency rate (serious claims per million hours worked)15–19 years 9.4 9.2 8.9 8.5 8.6 -9%
20–24 years 8.5 8.4 7.9 7.4 7.0 -18%
25–29 years 8.1 7.9 7.4 7.0 6.4 -21%
30–34 years 9.0 8.9 8.6 8.0 7.4 -18%
35–39 years 9.7 9.9 9.8 8.8 8.1 -16%
40–44 years 10.2 10.3 10.0 9.4 8.8 -14%
45–49 years 10.1 10.2 10.0 9.7 9.2 -9%
50–54 years 10.6 10.8 10.4 9.9 9.8 -8%
55–59 years 11.4 11.5 11.1 10.3 10.3 -10%
60–64 years 12.4 12.5 11.8 11.2 10.9 -12%
All claimsb 9.6 9.7 9.4 8.8 8.4 -13%a Percentage change from 2002–03 to 2006–07.b Totals include claims from employees aged 65 years & over. These data have not been shown separately, as they are not strictly comparable to other age groups.
Compendium of Workers’ Compensation Statistics Australia 2007–08 ... 17

Frequency rateAnother way to examine workplace injury and disease is in relation to the total time employees spent at their workplaces. This negates differences in the proportion of workers who are part-time in each of the age groupsand changes in those proportions over time. While incidence rates showed a marked increase with age (from 8.7 to 17.6 serious claims per 1000 employees), the increase in frequency rates with age was smaller, from6.4 to 10.9 serious claims per million hours worked, reflecting the effect of removing the differences in hours worked. The youngest employees, aged 15–19 years, experienced higher frequency rates than any other age group below 40 years.
Despite the smaller range, the percentage decreases in the frequency rates for serious claims were about the same as the decrease for incidence rates. The largest decreases (21%) occurred among employees in the same age group as for incidence rates, 25–29 years. The smallest decrease in frequency rate (8%) also occurred in the age group with oneof the smallest decreases in incidence rate: the 50–54 years age group.
The data above are based on workers’ compensation claims and are therefore biased towards the groups of people who are more likely tolodge claims. A survey conducted by the Australian Bureau of Statistics on work-related injuries highlighted that young people are less likely to apply for compensation even for injuries which required more than one weekoff work (ABS 2006, Work-related Injuries, Australia, 2005–06 (Cat. No.http://www.abs.gov.au/ausstats/[email protected]/mf/6324.0 The survey data showed that young workers incurred the highest rates of injury of all age groups.
Safe Work Australia has published a range of reports from these data that can be found at http://www.safeworkaustralia.gov.au/swa/AboutUs/ Publications/Work-relatedInjuriesinAustralia.htm. These reports showthat compensation data provides a good picture of the industries in which injuries occur and the characteristics of those injuries but understates the full extent of even serious injuries.
Time lost and paymentsTable 8 shows that the median amount of time taken off work increased with age from 2.4 working weeks for those in the 15–19 years age group to 4.6 working weeks for those in the 45–49 and 50–54 years age group before falling off slightly for the oldest age groups. Over the past fiveyears, the amount of time lost from work has not changed for six of the ten age groups with the others only changing by 0.1 or 0.2 working weeks.
Median payments have also shown an increase with age, however, the range is much larger with employees aged 15–19 years receiving $1800 while those aged 60–64 receiving $8500. This difference is due to the combination of increasing time lost with age and increasing earnings. The greatest increase in median payments was recorded by the 20–24 years age group which increased 25% from $2400 to $3000 over the five years. This median payment is still only around half the median payment for all serious claims. The smallest increase was recorded by the 50–54 years age group which increased 7% followed by the 60–64 years age group which increased 8%.
18 ... Safe Work Australia

Part B: Serious claims, trends over time
Table 8 Serious claims: number of claims, incidence rate and frequency rate by age,2002–03 to 2006–07Age group 2002–03 2003–04 2004–05 2005–06 2006–07 % changea
Median time lost (working weeks)15–19 years 2.4 2.2 2.2 2.2 2.4 0%
20–24 years 2.9 2.7 2.7 2.8 2.7 -7%
25–29 years 3.4 3.2 3.2 3.2 3.2 -6%
30–34 years 3.9 3.6 3.6 3.6 3.8 -3%
35–39 years 4.2 4.0 4.0 4.0 4.2 0%
40–44 years 4.4 4.0 4.1 4.2 4.4 0%
45–49 years 4.6 4.3 4.3 4.4 4.6 0%
50–54 years 4.6 4.4 4.2 4.6 4.6 0%
55–59 years 4.3 4.2 4.2 4.4 4.4 2%
60–64 years 4.0 4.0 4.0 3.8 4.0 0%
Total claimsb 4.0 3.7 3.6 3.8 3.9 -2%
Median payment ($)15–19 years 1 500 1 600 1 700 1 800 1 800 20%
20–24 years 2 400 2 600 2 800 2 900 3 000 25%
25–29 years 3 500 3 700 3 800 4 100 4 100 17%
30–34 years 4 500 4 800 4 700 4 900 5 300 18%
35–39 years 5 200 5 600 5 800 5 700 6 300 21%
40–44 years 5 900 5 800 6 000 6 400 6 800 15%
45–49 years 6 500 6 700 6 700 6 900 7 300 12%
50–54 years 7 200 7 100 7 300 7 800 7 700 7%
55–59 years 7 200 8 000 7 900 8 100 8 500 18%
60–64 years 7 900 8 500 8 700 8 100 8 500 8%
All claimsb 4 900 5 200 5 300 5 600 5 800 18%a Percentage change from 2002–03 to 2006–07.b Totals include claims from employees aged 65 years & over and whose age was unstated. These data have not been shown separately, as they are not strictly comparable to other age groups.
Trends by industryTable 9 shows that over the five-year period from 2002–03 to 2006–07, the number of serious claims decreased in 11 of the 17 industry groups. The largest decrease in the number of claims over this period occurred among employees in the Communication services industry, which fell by19%, followed by the Agriculture, forestry & fishing industry, which fell by17%.
Notable increases were recorded in the Mining industry (up 15%) and theConstruction industry (up 10%).
Incidence rateDespite some industries recording increased claim numbers, incidence rates have fallen in all industries since 2002–03. The largest fall in incidence rate over the six year period occurred in the Communication services industry, which fell by 34%, followed by the Mining industry (down26%), the Finance & insurance industry (down 24%) and the Construction industry (down 23%).
The smallest improvements occurred in the Education industry (down 3%) followed by the Manufacturing industry (down 6%) and the Wholesale Trade industry (down 8%).
Compendium of Workers’ Compensation Statistics Australia 2007–08 ... 19

Table 9 Serious claims: number of claims, incidence rate and frequency rate by industry,2002–03 to 2006–07Industry 2002–03 2003–04 2004–05 2005–06 2006–07 % changea
Number of serious claimsAgriculture, forestry & fishing 5 535 5 190 4 960 4 675 4 585Mining 2 275 2 365 2 420 2 390 2 615Manufacturing 28 980 28 295 28 175 26 585 26 185Electricity, gas & water supply 790 820 905 750 820Construction 12 755 13 995 14 375 13 860 14 020Wholesale trade 6 330 6 505 6 645 6 740 6 360Retail trade 13 880 14 055 13 720 13 060 12 905Accommodation, cafes & restaurants 6 695 6 610 6 625 6 250 6 245Transport & storage 11 360 11 430 11 225 11 045 10 950Communication services 1 525 1 520 1 380 1 315 1 235Finance & insurance 1 415 1 380 1 250 1 265 1 205Property & business services 11 105 11 520 12 015 11 385 10 265Government administration & defence 5 845 5 615 5 545 4 890 5 205Education 6 680 6 635 6 825 6 815 6 845Health & community services 16 345 17 180 17 585 16 345 16 235Cultural & recreational services 2 865 2 685 2 740 2 750 2 710Personal & other services 5 820 5 930 5 995 5 555 5 320Total claims 140 305 141 800 142 465 135 950 134 105
-17%15%-10%
4%10%
0%-7%-7%-4%
-19%-15%-8%
-11%2%1%
-5%-9%-4%
Incidence rate (serious claims per 1000 employees)Agriculture, forestry & fishing 30.4 27.8 26.9 26.0 25.2Mining 27.5 26.0 24.2 19.4 20.3Manufacturing 28.5 28.8 28.4 27.3 26.7Electricity, gas & water supply 11.0 11.2 12.2 9.0 10.0Construction 28.2 27.7 26.1 24.2 21.8Wholesale trade 15.8 16.1 16.7 16.7 14.6Retail trade 10.3 10.4 9.8 9.2 9.0Accommodation, cafes & restaurants 14.3 13.7 12.7 12.4 11.7Transport & storage 32.3 29.8 28.1 26.9 26.2Communication services 10.9 10.3 9.3 8.1 7.2Finance & insurance 4.2 4.2 3.7 3.5 3.2Property & business services 11.1 11.1 11.5 10.2 8.9Government administration & defence 13.0 12.2 11.7 10.3 10.4Education 9.4 9.1 9.7 9.1 9.1Health & community services 17.5 18.1 17.9 15.7 14.9Cultural & recreational services 12.2 11.4 10.6 10.3 9.7Personal & other services 18.7 19.5 19.1 17.1 16.2All claims 16.5 16.4 16.0 14.8 14.1
-17%-26%
-6%-9%
-23%-8%
-13%-18%-19%-34%-24%-20%-20%
-3%-15%-20%-13%-15%
Frequency rate (serious claims per million hours worked)Agriculture, forestry & fishing 15.3 14.7 14.1 13.9 13.1Mining 11.7 11.3 10.5 8.6 8.8Manufacturing 14.3 14.7 14.4 14.0 13.8Electricity, gas & water supply 5.6 5.7 6.1 4.7 5.1Construction 13.8 13.6 12.9 12.1 10.7Wholesale trade 8.0 8.3 8.5 8.6 7.5Retail trade 7.5 7.6 6.9 6.6 6.6Accommodation, cafes & restaurants 10.2 10.1 9.3 9.1 8.7Transport & storage 15.9 14.9 14.2 13.9 13.4Communication services 5.6 5.5 4.9 4.3 3.9Finance & insurance 2.3 2.2 2.0 1.9 1.7Property & business services 6.1 6.2 6.3 5.7 4.9Government administration & defence 7.3 7.2 6.8 6.0 6.1Education 5.8 5.6 5.9 5.7 5.7Health & community services 12.0 12.5 12.3 10.8 10.4Cultural & recreational services 8.6 8.3 7.7 7.6 7.3Personal & other services 11.3 11.7 11.3 10.3 9.9All claims 9.6 9.7 9.4 8.8 8.4
-14%-25%
-3%-9%
-22%-6%
-12%-15%-16%-30%-26%-20%-16%
-2%-13%-15%-12%-13%
a Percentage change from 2002–03 to 2006–07.
20 ... Safe Work Australia

Part B: Serious claims, trends over time
Frequency rateFrequency rates by industry show a similar pattern to that observed for incidence rates, with frequency rates falling in all industries over the five- year period. Between 2002–03 and 2006–07, working hours have fallen significantly in the Agriculture, forestry & fishing industry and the Cultural & recreational services industry. Consequently, the frequency rates of these industries have fallen by less than their incidence rates. The largest falls in frequency rates occurred in the Communications industry (down 30%), the Mining industry (down 25%), and the Finance & insurance industry (down26%).
Incidence and frequency rates by industry are different from those published in previous Compendiums. This is due to the Australian Bureau of Statistics revising the estimates of the number of employees and hours worked plus the way it records the industry for workers who hold more than one job. See Explanatory Notes for further details.
Time lostTable 10 shows that the Agriculture, forestry & fishing industry recorded the highest or equal highest median time lost from work, each year from2002–03 to 2005–06. However, in 2006–07, the Personal & other services industry recorded the highest median time lost from work, at 5.0 working weeks. The lowest median time lost was consistently recorded by the Electricity, gas & water supply industry, generally recording time lost in the range 2.0 to 2.2 working weeks.
Increases in median time lost were recorded in 6 of the 17 industries. The greatest increase was recorded by the Mining industry, which rose 40%, from a historically low 3.0 working weeks lost in 2002–03 to 4.2 weeks in2006–07. The greatest decrease was recorded by the Education industry, which fell 14% from 4.4 working weeks lost in 2002–03 to 3.8 weeks in2006–07.
PaymentsTable 10 shows that median payments increased in all industries. The smallest rise of 3% was recorded by both the Communication services industry and the Accommodation, cafes & restaurants industry. The Accommodation, cafes & restaurants industry has consistently recorded the lowest or second lowest median payments for serious claims over the five-year period ($3400 in 2006–07 compared to the median for all industries of $5800). Since the time lost in this industry is only a little lower than the median for all industries, the low payments are mostprobably linked to the relatively lower salaries in this industry and the high proportion of part-time employees (A verage weekly earnings ABS Cat. no. 6302.0 (http://www.abs.gov.au/AUSSTATS/[email protected]/mf/6302.0) and Australian labour market statistics ABS Cat. no. 6105.0 (http://www.abs.gov.au/AUSSTATS/[email protected]/mf/6105.0)).
In contrast, the Mining industry has consistently recorded the highest median payments ($12 800 in 2006–07). This is linked to the relatively high salaries in the Mining industry, since the median time lost from work by employees in this industry is only slightly higher than the median for all industries.
The highest percentage increases in median payments were recorded by the Cultural & recreational services industry (up 34%), and the Retail trade
Compendium of Workers’ Compensation Statistics Australia 2007–08 ... 21

and Transport & storage industries, which each rose 31%. Increases in payments reflect increases in wages and salaries and the cost of medical treatment.
Median payments are based on the cumulative costs of serious claims lodged in a particular year: they are not a summary of the payments ofall open claims in any one year. Median payments are subject to revision as updated data on open claims are received in subsequent years. The payments tabulated are those current at the time of publication andare not adjusted for inflation (expressed as constant prices) because compensation is generally paid in cumulative sums over a period.
Table 10 Serious claims: median time lost and median payments by industry,2002–03 to 2006–07Industry 2002–03 2003–04 2004–05 2005–06 2006–07
Median time lost (working weeks)% changea
Agriculture, forestry & fishing 4.7 4.2 4.4 4.6 4.6
Mining 3.0 3.8 3.6 3.8 4.2
Manufacturing 3.4 3.0 3.0 3.2 3.2
Electricity, gas & water supply 2.1 2.0 2.0 2.2 2.0
Construction 4.2 4.0 3.8 4.0 4.0
Wholesale trade 3.8 3.4 3.7 3.6 3.6
Retail trade 3.5 3.4 3.4 3.5 3.6
Accommodation, cafes & restaurants 3.6 3.4 3.4 3.3 3.2
Transport & storage 3.8 3.8 3.9 4.0 4.0
Communication services 3.4 3.1 3.6 3.8 4.0
Finance & insurance 4.0 4.0 3.8 4.0 4.2
Property & business services 4.5 4.0 4.0 3.8 4.2
Government administration & defence 3.6 3.5 3.2 3.6 3.4
Education 4.4 4.2 3.8 3.8 3.8
Health & community services 4.7 4.2 4.2 4.6 4.7
Cultural & recreational services 4.2 4.2 4.2 4.0 4.1
Personal & other services 4.4 4.0 4.0 4.4 5.0
All serious claimsb 4.0 3.7 3.6 3.8 3.9
-2%
40%
-6%
-5%
-5%
-5%
3%
-11%
5%
18%
5%
-7%
-6%
-14%
0%
-2%
14%
-3%
Median payment ($)Agriculture, forestry & fishing 4 300 4 500 4 700 5 100 5 300
Mining 9 900 11 100 10 900 10 800 12 800
Manufacturing 4 900 5 300 5 400 5 600 5 800
Electricity, gas & water supply 7 200 7 500 8 200 7 700 7 900
Construction 6 300 6 500 6 700 6 900 7 100
Wholesale trade 4 800 4 800 5 300 5 200 5 700
Retail trade 3 200 3 500 3 700 4 100 4 200
Accommodation, cafes & restaurants 3 300 3 400 3 700 3 400 3 400
Transport & storage 4 200 4 900 5 300 5 400 5 500
Communication services 9 400 8 700 8 300 8 700 9 700
Finance & insurance 5 400 5 700 5 900 6 600 6 900
Property & business services 4 800 4 700 4 600 4 700 5 400
Government administration & defence 6 200 7 100 6 700 7 900 7 500
Education 6 600 7 200 7 100 7 400 7 500
Health & community services 4 500 4 400 4 500 5 000 5 100
Cultural & recreational services 4 100 4 500 4 300 4 400 5 500
Personal & other services 6 700 6 500 6 300 7 400 7 900
All serious claimsb 4 900 5 200 5 300 5 600 5 800
23%
29%
18%
10%
13%
19%
31%
3%
31%
3%
28%
13%
21%
14%
13%
34%
18%
18%
a Percentage change from 2002–03 to 2006–07. b Includes claims where industry was not stated.
22 ... Safe Work Australia

Part B: Serious claims, trends over time
Trends by occupationTable 11 shows that over the five-year period from 2002–03 to 2006–07, the number of serious claims decreased in five of the nine occupation groups. The largest percentage decrease in the number of claims over this period (30%) occurred among Advanced clerical & service workers. This group represented 3.6% of employees and accounted for 0.7% of claims in 2006–07. The Labourers & related workers group recorded the next largest decrease (16%). The greatest increase in serious claims was recorded by the Professionals group, which rose by 9%. This group accounted for the greatest proportion of employees (20%), but only 10% of claims in 2006–07.
Table 11 Serious claims: number of claims, incidence rate and frequency rate by occupation,2002–03 to 2006–07Occupation 2002–03 2003–04 2004–05 2005–06 2006–07 % changea
Number of serious claimsManagers & administrators 3 425 3 355 3 215 2 795 3 050 -11%
Professionals 11 790 11 525 11 880 12 145 12 905 9%
Associate professionals 9 800 9 695 10 115 9 300 8 980 -8%
Tradespersons & related workers 26 565 27 035 26 725 26 910 27 595 4%
Advanced clerical & service workers 1 330 1 290 1 325 1 090 930 -30%
Intermediate clerical, sales & service workers 15 580 16 800 16 635 16 455 15 910 2%
Intermediate production & transport workers 24 580 25 065 24 945 23 990 24 525 0%
Elementary clerical, sales & service workers 10 140 10 135 10 380 9 385 9 105 -10%
Labourers & related workers 36 760 36 545 37 055 33 775 30 940 -16%
Total serious claimsb 140 305 141 800 142 465 135 950 134 105 -4%
Incidence rate (serious claims per 1000 employees)Managers & administrators 7.4 7.0 5.7 4.3 4.7 -36%
Professionals 7.2 6.8 6.9 6.6 6.8 -6%
Associate professionals 10.3 9.8 9.5 8.6 7.6 -26%
Tradespersons & related workers 30.1 28.9 28.2 27.2 26.9 -11%
Advanced clerical & service workers 4.0 3.9 4.2 3.2 2.7 -33%
Intermediate clerical, sales & service workers 9.3 10.0 9.8 9.7 9.1 -2%
Intermediate production & transport workers 33.9 34.7 33.0 32.0 30.1 -11%
Elementary clerical, sales & service workers 10.3 10.1 10.1 9.2 9.1 -12%
Labourers & related workers 45.3 45.0 45.9 42.6 37.3 -18%
All serious claimsb 16.5 16.4 16.0 14.8 14.1 -15%
Frequency rate (serious claims per million hours worked)Managers & administrators 3.2 3.1 2.5 2.0 2.1 -34%
Professionals 3.9 3.8 3.9 3.7 3.8 -3%
Associate professionals 5.1 5.0 4.9 4.6 4.1 -20%
Tradespersons & related workers 15.0 14.6 14.2 14.0 13.8 -8%
Advanced clerical & service workers 2.6 2.6 2.8 2.2 1.9 -27%
Intermediate clerical, sales & service workers 6.2 6.7 6.6 6.6 6.2 0%
Intermediate production & transport workers 17.7 18.2 17.3 17.0 16.2 -8%
Elementary clerical, sales & service workers 8.8 8.9 8.7 8.0 8.0 -9%
Labourers & related workers 31.2 31.2 30.9 28.5 25.0 -20%
All serious claimsb 9.6 9.7 9.4 8.8 8.4 -13%
a Percentage change from 2002–03 to 2006–07.b Includes claims where occupation was not stated.
Compendium of Workers’ Compensation Statistics Australia 2007–08 ... 23

Incidence rateSince 2002–03, incidence rates have fallen in all occupation groups. Managers & administrators recorded the largest decrease in incidence rates (36%) due to a 40% increase in the number of employees in this occupation. This was followed by Advanced clerical & service workers with a 33% fall.
The smallest decrease in incidence rate was recorded by Intermediate clerical, sales & service workers (2%), with the increase in claim numbers offset by a slightly larger rise in employee numbers.
Frequency rateFrequency rates by occupation showed a similar pattern to that observed for incidence rates, with all occupations showing a fall except for Intermediate clerical, sales & service workers which recorded no change. The largest decrease in frequency rates was experienced by Managers & administrators (34%) followed by Advanced clerical & service workers (27%).
Time lostTable 12 shows that the median time lost rose in only three of the nine occupations between 2002–03 and 2006–07. Managers & administrators recorded the highest or second highest median time lost from work from2002–03 to 2006–07, recording time lost between 4.2 working weeks and 4.8 working weeks. The occupation with the highest mean time lost in 2006–07 was Advanced clerical & service workers, with 4.8 working weeks. The lowest median time lost in all six years was recorded by Tradespersons & related workers, recording time lost between 3.2 to 3.4 working weeks.
Advanced clerical & service workers recorded the largest increase in median time lost (20%) due to a major increase from 4.0 working weeks in2005–06 to 4.8 in 2006–07. There were very few claims made by workers in this group and caution should be used in interpreting these data.
The largest decreases in median time lost were recorded for Professionals (down 7%), Labourers & related workers (down 5%), and Managers & administrators (down 4%).
PaymentsTable 12 shows that median payments increased in all occupation groups over the five-year period. Advanced clerical & service workers recorded the largest increase, rising 44% from $5900 in 2002–03 to $8500 in2006–07, in part due to the increase in the amount of time lost from work. Intermediate clerical, sales & service workers recorded the smallest increase (8%).
Table 12 also shows that Managers & administrators consistently had the highest median payments for serious claims: 1.7 times greater than the median payment for all serious claims, reflecting the high salaries associated with this occupation and the longer time lost.
The lowest median payment was recorded for Elementary clerical, sales& service workers ($4400), which has consistently recorded the lowest
24 ... Safe Work Australia

Part B: Serious claims, trends over time
median payment for serious claims for the last five years. This group also had relatively lower time lost from work.
Median payments are based on the cumulative payments for serious claims lodged in a particular year: they are not a summary of thepayments of all open claims in any one year. Median payments are subject to revision as updated data on open claims are received in subsequent years. The payments tabulated are those current at the time of publication and are not adjusted for inflation (expressed as constant prices) because compensation is generally paid in cumulative sums over a period.
Table 12 Serious claims: median time lost and median payments by occupation,2002–03 to 2006–07Occupation 2002–03 2003–04 2004–05 2005–06 2006–07 % changea
Median time lost (working weeks)Managers & administrators 4.8 4.2 4.4 4.6 4.6
Professionals 4.5 4.3 4.0 4.3 4.2
Associate Professionals 4.2 4.0 4.0 4.2 4.2
Tradespersons & related workers 3.4 3.2 3.2 3.2 3.3
Advanced clerical & service workers 4.0 3.8 3.8 4.0 4.8
Intermediate clerical, sales & service workers 4.4 4.2 4.1 4.2 4.2
Intermediate production & transport workers 3.9 3.6 3.8 3.8 4.0
Elementary clerical, sales & service workers 3.6 3.5 3.6 3.8 3.9
Labourers & related workers 3.9 3.6 3.4 3.6 3.7
All serious claims 4.0 3.7 3.6 3.8 3.9
-4%
-7%
0%
-3%
20%
-5%
3%
8%
-5%
-2%
Median payment ($)Managers & administrators 8 700 9 200 9 300 9 700 9 700
Professionals 6 500 6 800 6 600 7 500 7 400
Associate Professionals 6 100 6 200 6 000 6 900 6 900
Tradespersons & related workers 4 800 5 000 5 300 5 400 5 600
Advanced clerical & service workers 5 900 6 200 6 000 7 100 8 500
Intermediate clerical, sales & service workers 4 900 5 100 5 200 5 300 5 300
Intermediate production & transport workers 5 200 5 500 5 900 5 900 6 400
Elementary clerical, sales & service workers 3 300 3 500 3 700 4 000 4 400
Labourers & related workers 4 200 4 500 4 500 4 700 5 000
All serious claimsb 4 900 5 200 5 300 5 600 5 800
11%
14%
13%
17%
44%
8%
23%
33%
19%
18%
a Percentage change from 2002–03 to 2006–07. b Includes claims where occupation was not stated.
Trends by nature of injury or diseaseSerious workers’ compensation claims are coded by the Nature of injury or disease classification. This classification identifies the most serious injury or disease sustained by the employee and allows claims to be divided into those involving injuries and those involving diseases. However, due to changes in this classification affecting data from 2003–04, claims involving Diseases of the musculoskeletal system have been combined with Strains& sprains and reported as injuries rather than disease. This amalgamation is only shown in this section (for further explanation see Appendix 1 — Explanatory note 8).
Claims for Injury & musculoskeletal disorders represented on average 87% of all serious claims. Serious claims coded to this nature fell 5% over the five-year period from 122 045 claims in 2002–03 to 116 395 in 2006–07. This was mostly the result of the significant fall in the number of claims due
Compendium of Workers’ Compensation Statistics Australia 2007–08 ... 25

to Sprains, strains & musculoskeletal disorders, which represented 64% of all Injury claims. Serious claims involving Other disease (diseases excluding Musculoskeletal disorders) fell by 550 claims, from 18 260 claims in 2002–03 to 17 710 in 2006–07.
Other notable falls occurred for Mental disorders, which fell by 1170 claims (from 8015 claims to 6845); and Contusions with intact skin surface & crushing injuries, which fell by 530 claims (from 9505 claims to 8975).The decrease in the number of claims due to Mental disorders may bethe result of legislative changes in a few jurisdictions which require claims to show that the injury or disease has a greater connection to work than was previously required. More information can be found in Comparison of Workers’ Compensation Arrangements in Australia and New Zealand.
Table 13 Serious claims: number of claims by nature of injury or disease, 2002–03 to 2006–07Nature of injury or disease 2002–03 2003–04 2004–05 2005–06 2006–07 Diffa
Injury & musculoskeletal disordersb 122 045 122 645 122 840 117 555 116 395 -5 650Sprains, strains & musculoskeletal disordersb 80 930 81 790 80 950 76 395 74 990 -5 940Fractures 11 020 11 145 11 275 11 450 11 225 205Open wound not involving traumatic
amputation 11 170 11 295 11 390 10 820 10 815 -355
Contusion with intact skin surface & crushing injuryc 9 505 9 365 9 885 9 290 8 975 -530
Burns 2 185 1 905 1 935 2 030 2 180 -5Dislocation 1 030 1 140 1 215 1 690 1 850 820Superficial injury 1 130 935 1 020 840 755 -375Traumatic amputation (inc loss of eyeball) 665 625 640 725 680 15Foreign body in eye, ear, nose etc.d 730 655 625 580 580 -150Intracranial injury, including concussion 485 440 425 595 525 40Fracture of vertebral column 370 345 405 430 435 65Multiple injuries 700 715 565 440 330 -370Poisoning & toxic effects of substances 385 340 345 295 300 -85
Other disease 18 260 19 155 19 630 18 400 17 710 -550
Mental disorders 8 015 8 135 7 950 6 965 6 845 -1 170
Diseases of the nervous system & sense organs 4 770 5 110 5 640 5 495 5 200 430
Deafness 3 085 3 245 3 610 3 590 3 320 235Disorders of nerve roots, plexuses & single
nerves 1 380 1 475 1 645 1 555 1 490 110
Diseases of the digestive system 3 140 3 465 3 695 3 710 3 515 375
Hernia 3 130 3 440 3 685 3 700 3 490 360
Diseases of the skin & subcutaneous tissue 915 945 925 955 920 5
Contact dermatitis 325 295 345 305 270 -55
Diseases of the respiratory system 495 530 590 405 400 -95
Common cold, flu, bronchitis & pneumoniae 180 175 220 205 165 -15Asbestosis 190 170 220 95 120 -70Asthma 70 85 65 45 55 -15
Infectious & parasitic diseases 335 365 335 385 300 -35
Neoplasms (cancers & benign tumours) 165 255 245 235 230 65
Malignant neoplasm of pleura (mesothelioma) 80 115 110 85 95 15
Diseases of the circulatory system 280 235 170 160 185 -95
Ischaemic heart disease 110 90 60 60 60 -50
Other diseases 145 115 85 80 120 -25
Total serious claims 140 305 141 800 142 465 135 950 134 105 -6 200
a Difference in the number of serious claims between 2002–03 and 2006–07.b Total Injury & musculoskeletal disorders includes categories not separately tabulated. See Appendix 1 — Explanatory note 8, p.78 for more details of this classification combination.c Excluding those with fractures.d Including respiratory, digestive or reproductive systems.e Classified as Other diseases of the respiratory system in TOOCS2.1.
26 ... Safe Work Australia
Part B: Serious claims, trends over time
The largest increase in the number of serious claims over the five years occurred for Dislocations, which increased by 820 claims (from 1030 claims in 2002–03 to 1850 claims in 2006–07). This was followed by Diseases of the nervous system & sense organs, which increased by 430 claims (from4770 claims to 5200) mainly due to the increase in claims for Deafness.
Time lostTable 14 shows that in 2002–03, the median time lost for Injury &musculoskeletal disorder claims was 3.9 working weeks. This fell to3.6 working weeks in 2003–04, and rose back to 3.8 working weeks by2006–07. Median time lost for claims involving Other diseases decreased from 4.4 working weeks lost in 2002–03 to 4.2 weeks in 2004–05, and has remained stable since then.
Among claims involving injuries, Fracture of vertebral column resulted in the longest time lost from work: around 14 weeks across the period 2002–03 to2006–07 and rising to 17.0 weeks in 2006–07. This was more than double the next highest injury categories, Traumatic amputation, Fractures and Dislocation, which recorded median times lost of 7.0, 6.8 and 6.6 working weeks respectively in 2006–07.
Time lost due to Traumatic amputation rose by 0.6 working weeks and for Multiple injuries increased by 0.5 working weeks. The median time lost in all other injury categories changed by 0.2 weeks or less.
Among claims involving disease, Mental diseases recorded the largest increase in time lost, rising 1.6 working weeks, from 9.1 weeks in 2002–03 to 10.6 weeks in 2006–07. Other diseases rose 0.5 working weeks, from3.0 weeks in 2002–03 to 3.5 weeks in 2006–07. This category is used for a range of conditions that cannot be classified elsewhere, the constitution of which can change from year to year.
Serious claims involving Diseases of the nervous system & sense organs had a zero median time lost. This is because of the very high proportion of Deafness claims in this category which generally involve no absence from work. Neoplasms (cancers & benign tumours) also recorded no time lost possibly due to claimants no longer being in the workforce.
PaymentsTable 14 shows that the injuries with the highest median paymentwere Fractures of the vertebral column ($28 000), followed by Multiple injuries ($23 300) and Traumatic amputation ($19 100). Diseases of the respiratory system had the highest median payment in 2002–03 ($23 600), but payments fell sharply in 2003–04 and have risen and fallen in theyears since. Of claims relating to Other diseases, Neoplasms (cancers &benign tumours) had the highest median payment in 2006–07 ($15 800).

Compendium of Workers’ Compensation Statistics Australia 2007–08 ... 27

Table 14 Serious claims: median time lost and median payments by nature of injury or disease, 2002–03 to 2006–07Nature of injury or disease 2002–03 2003–04 2004–05 2005–06 2006–07 Diffa
Median time lost (working weeks)Injury & musculoskeletal disordersb 3.9 3.6 3.6 3.7 3.8
Sprains, strains & musculoskeletaldisordersb 4.1 3.8 3.8 4.0 4.1
Fractures 6.6 6.6 6.6 6.6 6.8Open wound not involving traumatic
amputation 2.2 2.0 2.0 2.0 2.0
Contusion with intact skin surface &crushing injuryc 2.6 2.3 2.4 2.4 2.4
Burns 2.0 1.8 2.0 2.0 2.0Dislocation 6.4 6.2 6.4 6.8 6.6Superficial injury 2.0 2.0 2.0 2.0 2.1Traumatic amputation (inc loss of eyeball) 6.4 6.4 6.6 6.2 7.0Foreign body in eye, ear, nose etc.d 1.6 1.2 1.4 1.4 1.4Intracranial injury, including concussion 2.2 2.6 2.0 2.8 2.3Fracture of vertebral column 14.0 14.7 13.2 13.4 17.0Multiple injuries 4.9 4.4 3.8 4.2 5.4Poisoning & toxic effects of substances 2.0 1.8 1.9 2.0 1.8
Other disease 4.4 4.3 4.2 4.2 4.2Mental disorders 9.1 9.4 9.0 10.7 10.6Diseases of the nervous system & senseorganse 0.0 0.0 0.0 0.0 0.0Diseases of the digestive system 5.4 5.6 5.5 5.4 5.4Diseases of the skin & subcutaneous tissue 2.2 2.2 2.4 2.2 2.2Diseases of the respiratory system 1.4 1.4 1.2 2.3 1.6Infectious & parasitic diseases 2.6 1.9 2.0 2.0 2.0Neoplasms (cancers & benign tumours)f 0.0 0.0 0.0 0.0 0.0Diseases of the circulatory system 6.8 8.8 7.6 6.0 6.8Other diseases 3.0 3.7 3.0 3.4 3.5
All claims 4.0 3.7 3.6 3.8 3.9
-0.1
0.0
0.2
-0.2
-0.2
0.00.20.10.6
-0.20.13.00.5
-0.2-0.21.6
0.0
0.0-0.10.3
-0.60.0
-0.10.5
-0.1Median payment ($)
Injury & musculoskeletal disordersb 4 300 4 500 4 600 4 800 5 100Sprains, strains & musculoskeletal
disordersb 5 000 5 100 5 100 5 300 5 600
Fractures 6 500 7 000 7 300 7 500 8 100Open wound not involving traumatic
amputation 2 100 2 400 2 500 2 700 2 700
Contusion with intact skin surface &crushing injuryc 2 100 2 300 2 500 2 600 2 700
Burns 1 300 1 400 1 600 1 600 1 600Dislocation 8 100 7 200 8 200 9 700 9 900Superficial injury 1 900 2 100 2 400 2 300 2 900Traumatic amputation (inc loss of eyeball) 16 000 17 300 18 700 18 600 19 100Foreign body in eye, ear, nose etc.d 1 000 1 100 1 200 1 400 1 400Intracranial injury, including concussion 3 100 3 200 3 900 3 900 3 100Fracture of vertebral column 19 600 27 800 18 700 20 200 28 000Multiple injuries 13 700 15 400 19 500 20 200 23 300Poisoning & toxic effects of substances 1 800 2 000 1 900 2 200 2 000
Other disease 8 500 8 900 9 000 9 200 9 400Mental disorders 10 900 10 900 11 200 13 600 13 800Diseases of the nervous system & sense
organs 9 700 10 200 9 800 9 300 9 500
Diseases of the digestive system 7 200 7 700 7 800 8 400 8 700Diseases of the skin & subcutaneous tissue 2 000 2 100 2 400 2 800 2 500Diseases of the respiratory system 23 600 13 800 18 000 11 900 7 700Infectious & parasitic diseases 1 800 1 500 1 800 1 600 2 000Neoplasms (cancers & benign tumours) 14 700 16 500 20 000 16 800 15 800Diseases of the circulatory system 16 900 17 300 18 900 14 100 11 700Other diseases 4 500 10 700 7 600 9 300 8 700
All claims 4 900 5 200 5 300 5 600 5 800
800600
1 600
600
600
3001 8001 0003 100
4000
8 4009 600
200900
2 900
-200
1 500500
-15 900200
1 100-5 2004 200
900a Difference in median time lost and median payment between 2002–03 and 2006–07.b See Appendix 1 — Explanatory note 8, p.78 for more details of these classification combination.c Excluding those with fractures. d Including respiratory, digestive or reproductive systems.e Mainly hearing loss claims involving no time off work. f Mainly Mesothelioma claims by claimants who are no longer working.
28 ... Safe Work Australia

Part B: Serious claims, trends over time
Table 14 also shows that median payments increased slightly more forInjury & musculoskeletal disorders (up 19% from $4300 in 2002–03 to$5100 in 2006–07) than Other disease claims (up 11% from $8500 in2002–03 to $9400 in 2006–07). Other disease claims are more expensive because they typically involve more time off work and may require longer and more expensive medical treatment.
Of claims relating to Injury & musculoskeletal disorders, the largest increase in median payments was in the Multiple injuries category, with payments rising $9600, from $13 700 in 2002–03 to $23 300 in 2006–07. There has been a substantial decrease in claims coded to this naturewith only 330 serious claims in 2006–07. The next largest increase was recorded by Fractures of the vertebral column which increased from$19 600 to $28 000 over the five years, partly due to the additional 3.0 working weeks of time lost recorded on these claims.
Of the disease categories, only minor increases were recorded. However, a substantial decrease in payments was recorded for Diseases of the respiratory system falling $15 900, from $23 600 in 2002–03 to $7700 in2006–07 in part due to a decrease in the number of Asbestosis claims.The next largest decrease occurred for Diseases of the circulatory system, which fell $5200, from $16 900 in 2002–03 to $11 700 in 2006–07 in part due to a fall in the number and cost of claims for Ischaemic heart disease.
Trends by bodily location of injury or diseaseBodily location refers to the part of the body affected by the most serious injury or disease. Table 15 shows that Upper limbs consistently recorded the highest number of claims in all five years accounting for around one- third of claims. The number of claims in this group has changed little over the past five years. The bodily location with the second largest number of serious claims was the Trunk, which accounted for around 30% of claims in all years. This location had the greatest decrease in claim numbers, falling 4385 claims, from 42 180 claims in 2002–03 to 37 795 claims in2006–07.
The only increase in claim numbers occurred for injuries to the Lower limbs. Claims for these injuries rose by 1295, from 26 710 claims in 2002–03 to28 005 claims in 2006–07.
Table 15 Serious claims: number of claims by bodily location of injury or disease,2002–03 to 2006–07Bodily location 2002–03 2003–04 2004–05 2005–06 2006–07 Diffa
Upper limbs 43 990 44 415 44 845 43 595 43 615
Trunk 42 180 42 785 42 000 39 565 37 795
Lower limbs 26 710 27 040 27 770 27 655 28 005
Head 7 400 7 460 7 700 7 725 7 380
Non-physical locations 8 000 8 100 7 935 6 970 6 865
Multiple locations 7 210 7 520 7 720 6 195 6 350
Neck 3 605 3 420 3 485 3 270 3 040
Systemic locations 855 845 830 740 735
Unspecified locations 350 200 175 230 310
Total serious claims 140 305 141 800 142 465 135 950 134 105
- 375
-4 385
1 295
- 20
-1 135
- 860
- 565
- 120
- 40
-6 200
a Difference in the number of serious claims between 2002–03 and 2006–07.
Compendium of Workers’ Compensation Statistics Australia 2007–08 ... 29
Trends by mechanism of injury or diseaseThe Mechanism of injury or disease classification is used to identify the action, exposure or event which was the direct cause of the most serious injury or disease. Table 16 shows that Body Stressing was the most prevalent mechanism of injury, consistently accounting for around 40% of serious claims and recording the largest fall in the claim numbers (down2475 claims) of all mechanisms over the five year period. More than one- third of the decrease in all serious claims are due to the reduction in Body stressing claims.
The next largest decrease was recorded by Other & unspecified mechanisms, which fell by 1475 claims. This mechanism includes Vehicle accident; cases where there were multiple mechanisms; and caseswhere the mechanism was not known. This latter group — Unspecified mechanism of injury — produced the largest fall over time for a mechanism subcategory (675 claims). It is possible this is due to better coding practices with increases or smaller falls in the other mechanism categories occurring as a result. The number of claims due to Vehicle accident has shown little change over the five years, accounting for around 3000 claims each year.
Time lost and paymentsTable 16 shows that between 2002–03 and 2006–07, there was very little change in median time lost in nearly all categories. The only significant change in time lost occurred for injuries due to Mental stress, which increased by 1.7 working weeks from 9.2 working weeks lost in 2002–03 to10.9 weeks in 2006–07. Serious claims involving Mental stress consistently had the longest median time lost from work and in 2006–07, was over three times the median for all serious claims of 3.9 weeks.
The high median time lost for Mental stress claims resulted in those claims also having the highest median payment ($14 300 in 2006–07) more than double the median for all serious claims of $5800. The median paymentfor these claims increased by the largest amount for any mechanism:$3200, from $11 200 in 2002–03 to $14 300 in 2006–07.
The next largest increase in median payment occurred for Falls, trips &slips of a person and Being hit by moving objects, each of which rose by$1000. Other & unspecified mechanisms rose by $900 due in part to a rise in the payments made for Vehicle accident, which increased by $1700, from $7000 in 2002–03 to $8700 in 2006–07.
Claims involving Sound & pressure recorded zero median time lost. This is because of the very high proportion of deafness claims in this category which generally involve no absence from work. This mechanism however, recorded the second highest median payments in all six years, most likely due to the payment of lump sum compensation for permanent hearing loss. Sound & pressure and Chemicals & other substances were the only categories for which payments fell over the five years.
30 ... Safe Work Australia

Part B: Serious claims, trends over time
Table 16 Serious claims: median time lost and median payments by mechanism of injury or disease, 2002–03 to 2006–07 (ordered by number of claims)Mechanism of injury or disease 2002–03 2003–04 2004–05 2005–06 2006–07 Diffa
Number of serious claimsBody stressing 58 225 60 065 60 335 56 775 55 750 -2 475
Falls, trips & slips of a person 27 655 27 485 28 060 27 355 27 125 -530
Being hit by moving objects 19 590 19 425 19 410 19 430 19 300 -290
Hitting objects with a part of the body 10 020 9 985 10 190 10 030 9 840 -180
Mental stress 7 705 7 850 7 700 6 705 6 580 -1 125
Sound & pressure 3 320 3 515 3 825 3 735 3 540 220
Heat, radiation & electricity 2 060 1 875 1 900 1 990 2 040 -20
Chemicals & other substances 1 780 1 735 1 800 1 505 1 485 -295
Biological factors 510 540 530 535 485 -25
Other & unspecified mechanisms 9 440 9 315 8 710 7 890 7 965 -1 475
Unspecified mechanisms of injury 3 965 3 715 3 505 3 130 3 290 -675
Vehicle accident 3 130 2 975 3 280 3 030 3 090 -40
Total claims 140 305 141 800 142 465 135 950 134 105 -6 200
Median time lost (working weeks)Body stressing 4.5 4.2 4.2 4.3 4.5 0.1
Falls, trips & slips of a person 4.4 4.2 4.2 4.4 4.4 0.0
Being hit by moving objects 3.2 3.0 3.0 3.1 3.2 0.0
Hitting objects with a part of the body 2.4 2.2 2.2 2.2 2.2 -0.2
Mental stress 9.2 9.6 9.2 11.0 10.9 1.7
Sound & pressureb 0.0 0.0 0.0 0.0 0.0 0.0
Heat, radiation & electricity 2.0 1.8 2.0 2.0 2.0 0.0
Chemicals & other substances 1.8 1.6 1.6 1.8 1.6 -0.2
Biological factors 2.6 1.9 2.0 2.0 2.2 -0.5
Other & unspecified mechanisms 4.4 4.4 4.4 4.6 4.6 0.1
Unspecified mechanisms of injury 4.4 4.2 4.2 4.3 4.2 -0.2
Vehicle accident 5.0 4.9 4.6 5.0 5.2 0.2
All claims 4.0 3.7 3.6 3.8 3.9 -0.1
Median payment ($)Body stressing 5 500 5 500 5 600 5 900 6 300 800
Falls, trips & slips of a person 5 000 5 100 5 300 5 600 6 000 1 000
Being hit by moving objects 3 300 3 700 3 900 4 100 4 300 1 000
Hitting objects with a part of the body 2 300 2 500 2 600 2 900 2 900 500
Mental stress 11 200 11 400 11 600 14 000 14 300 3 100
Sound & pressure 9 700 10 300 9 800 8 800 9 000 -600
Heat, radiation & electricity 1 400 1 600 1 700 1 800 1 800 400
Chemicals & other substances 2 500 2 500 2 700 2 400 2 300 -100
Biological factors 1 900 1 600 1 800 2 100 2 400 500
Other & unspecified mechanisms 6 600 6 900 7 100 7 300 7 500 900
Unspecified mechanisms of injury 6 300 6 400 6 600 6 600 6 700 300
Vehicle accident 7 000 7 800 7 200 7 700 8 700 1 700
All claims 4 900 5 200 5 300 5 600 5 800 900a Difference from 2002–03 to 2006–07.b Sound & pressure claims generally involve hearing loss where no time is taken off work.
Compendium of Workers’ Compensation Statistics Australia 2007–08 ... 31

Trends by breakdown agency of injury or diseaseBreakdown agency of injury or disease refers to the object, substance or circumstance principally involved in, or most closely associated with, the point at which things started to go wrong, and ultimately led to the most serious injury or disease. Table 17 shows that Non-powered handtools, appliances & equipment consistently recorded the highest number of claims across the five years with very little change in claim numbers. Of this group, packing containers such as crates and boxes accounted for around one-quarter of claims.
The most notable change occurred with claims that involved Other & unspecified agencies with a fall of 5435 claims recorded, from 22 135 claims in 2002–03 to 16 700 in 2006–07. This agency is used for claims where sufficient information has not been obtained to accurately code to a specific agency or where a non-physical agency was associated with the injury. As the majority of the fall in claim numbers recorded against this agency occurred in the first of these groups, the fall is most likely linked to better coding practices.
Claims for Animal, human & biological agencies fell by 870 claims,from 15 655 claims in 2002–03 to 14 785 claims in 2006–07. Claims forMachinery & mainly fixed plant fell by 590 claims, from 8985 claims in2002–03 to 8395 claims in 2006–07. Within this agency, claims for Cutting, slicing & sawing machinery; Crushing, pressing & rolling machinery and Other plant & machinery recorded the greatest falls.
The agency that recorded the greatest increase in claim numbers was Materials & substances which increased by 875 claims, from 16 575 claims in 2002–03 to 17 450 in 2006–07. Increases in claims involving Ferrous & non-ferrous metal accounted for nearly half of the increase due to this agency.
Table 17 Serious claims: number of claims by breakdown agency of injury or disease,2002–03 to 2006–07Breakdown agency 2002–03 2003–04 2004–05 2005–06 2006–07 Diffa
Non-powered handtools, appliances &equipment 35 505 36 035 37 200 36 105 35 475
Environmental agencies 20 845 20 925 21 600 21 250 20 870
Materials & substances 16 575 16 525 17 025 16 680 17 450
Animal, human & biological agencies 15 655 16 130 15 895 14 965 14 785
Mobile plant & transport 12 300 12 525 12 895 12 355 12 370
Machinery & mainly fixed plant 8 985 8 985 9 055 8 555 8 395
Powered equipment, tools & appliances 6 905 7 010 7 315 7 125 6 865
Chemicals & chemical products 1 390 1 315 1 345 1 250 1 180
Other & unspecified agencies 22 135 22 335 20 130 17 650 16 700
Total claimsb 140 305 141 800 142 465 135 950 134 105
-30
25
875
-870
70
590
-40
-210
-5 435
-6 200
a Difference in the number of serious claims between 2002–03 and 2006–07. b Includes ‘Not stated’.
32 ... Safe Work Australia

b
Part CCompensated fatalities
Preliminary data from 2007–08 has 232 accepted workers’ compensation claims for the death of an employee due to work-related causes. However as workers’ compensation schemes do not generally coverself-employed workers and workers’ compensation claims can only be lodged where there is a dependant to do so, this number is not an accurate count of all work-related deaths in Australia. To address this situation, an analysis of other sources of information on work- related deaths has been undertaken, with results published in thereport Work-related T raumatic Injury Fatalities, Australia available on the Safe Work Australia website (http://www.safeworkaustralia.gov.au/NR/rdonlyres/C31DA698-BD85-45BC-9677-4D926980C4B0/0/TraumaticInjuryFatalities200607corrected.pdf). This chapter presents an analysis of the 232 accepted compensation claims for work-related fatality lodged in 2007–08p.
Compensated fatalities by age and sexThe 232 fatalities compensated in 2007–08p equate to an incidence rate of 2.4 compensated fatalities per 100 000 employees. However, as the2007–08 data are preliminary, the rate is expected to rise with the final determination on claims lodged during this year.
The preliminary data for 2007–08 show that compensated fatalities mainly involved male employees. Of the 232 compensated fatalities,218 were male employees (94%) and 14 were female employees (6%). Table 18 shows that male employees had a fatality incidence rate 14 times that of female employees in 2007–08p and a frequency rate 11 times that of females when expressed as a rate per 100 million hours worked.Table 18 Compensated fatalities: number, incidence rate and frequency rate by sex, 2007–08p
Number Percentage of claimsIncidence
ratea Frequency rate
Males 218 94 4.3 2.2
Females 14 6 0.3 0.2
Total 232 100 2.4 1.4a Calculated as a rate per 100 000 employees.b Calculated as a rate per 100 million hours worked.
Table 19 shows how the number, incidence and frequency rates vary by age for the 232 compensated fatalities recorded in 2007–08p. The40–44 years age group recorded the highest number of fatalities (14% of all compensated fatalities), however, the incidence and frequency rates for this age group were not the highest because of the relatively large number of employees. The highest incidence and frequency rates were recorded by the three oldest age groups: 55–59 years, 60–64 years and65 years and over.
Compendium of Workers’ Compensation Statistics Australia 2007–08 ... 33
There were 24 compensated fatalities recorded where the employee was aged 65 years and over. However, because relatively few employees continue working beyond 65 years of age, this age group recorded the highest incidence and frequency rates (15.7 compensated fatalities per100 000 employees and 11.6 compensated fatalities per 100 million hours worked respectively), over seven times the rate for all age groups.Table 19 Compensated fatalities: number, incidence rate and frequency rate by age and sex, 2007–08p
Number of compensated fatalities Incidence FrequencyAge group Males Females Total ratea rateb
15-19 years 3 0 3 0.4 0.4
20-24 years 17 0 17 1.4 0.9
25-29 years 14 1 15 1.3 0.7
30-34 years 12 2 14 1.3 0.7
35-39 years 27 4 31 2.8 1.6
40-44 years 31 2 33 3.0 1.7
45-49 years 23 2 25 2.2 1.2
50-54 years 30 0 30 3.1 1.8
55-59 years 25 2 27 3.7 2.2
60-64 years 12 1 13 3.3 2.1
65 years & over 24 0 24 15.7 11.6
Total 218 14 232 2.4 1.4a Compensated fatalities per 100 000 employees.b Compensated fatalities per 100 million hours worked.
Compensated fatalities by industryTable 20 shows that in 2007–08p, the Transport & storage industry recorded the highest number of compensated fatalities in any industry (68 fatalities, 21% of all compensated fatalities). The second highest numberof fatalities occurred in the Construction industry (37 fatalities), followed by the Manufacturing industry (25 fatalities) and the Agriculture, Forestry & Fishing industry (22 fatalities).
When the number of compensated fatalities is expressed as an incidence rate, the Transport & storage industry recorded the highest rate of 15 compensated fatalities per 100 000 employees, over six times the rate for all industries of 2.4 compensated fatalities per 100 000 employees. While the Agriculture, forestry & fishing industry recorded the fourth highest number of fatalities, the lower number of employees resulted in this industry recording the second highest incidence rate (12.6 compensated fatalities per 100 000 employees). The Construction industry recorded the third highest incidence rate (5.6).
The highest number of female compensated fatalities (3) occurred in the Property & business services industry. This was followed by 2 female fatalities each in the Health & community services and the Personal & other services industries.
34 ... Safe Work Australia

Industry Males Females Total ratea rate
Transport & storage 67 1 68 15.1 7.7
Agriculture, forestry & fishing 22 0 22 12.6 6.5
Construction 36 1 37 5.6 2.8
Mining 7 0 7 5.0 2.2
Personal & other services 7 2 9 2.6 1.6
Manufacturing 24 1 25 2.5 1.3
Communication services 3 1 4 2.3 1.2
Electricity, gas & water supply 2 0 2 2.3 1.2
Government administration & defence 9 1 10 2.0 1.2
Property & business services 16 3 19 1.6 0.9
Cultural & recreational services 4 0 4 1.5 1.1
Wholesale trade 6 0 6 1.4 0.7
Finance & insurance 5 0 5 1.3 0.7
Retail trade 5 1 6 0.4 0.3
Accommodation, cafes & restaurants 2 0 2 0.4 0.3
Education 1 1 2 0.2 0.2
Health & community services 0 2 2 0.2 0.1
Not stated 2 0 2 ** **
Total 218 14 232 2.4 1.4
Part C: Compensated fatalities
Table 20 Compensated fatalities: number, incidence rate and frequency rate by industry(ranked on incidence rate), 2007–08p
Number of compensated fatalitiesIncidence Frequency
b
a Compensated fatalities per 100 000 employees.b Compensated fatalities per 100 million hours worked.
Figure 16 shows the industry groups in which the highest numbers of compensated fatalities occurred in 2007–08p. Together, the sixteen industry groups shown accounted for more than half of all compensated fatalities. At this level of detail, the highest number of compensated fatalities (52 (22%) of all compensated fatalities) involved employees in the Road freight transport group and mainly involved vehicle accidents.
Figure 16 Compensated fatalities: sixteen highest industry groups,2007–08p
Road freight transport 52
Building construction 9
Non-building construction 8
Other business services * 7
Public order & safety services 7
Site preparation services 7
Government administration 6
Grain, sheep & beef cattle farming 6
Horticulture & fruit growing 6
Services to agriculture 6
Building completion services 5
Machinery & equipment hiring & leasing 5
Cement & concrete product manufacturing 4
Other insurance* 4
Other mining services* 4Rail transport 4
0 10 20 30 40 50 60
Compensated fatalities
* Other business services includes Employment placement services, Secretarial services and Cleaning services; Other insurance includes Health insurance and General insurance; and Other mining services includes Contract mining services.
Compendium of Workers’ Compensation Statistics Australia 2007–08 ... 35

The second highest number of compensated fatalities (9 fatalities) involved employees in the Building construction services industry (which includes house construction, alteration, renovation and general repair). The third highest number of fatalities (8 fatalities) occurred in the Non- building construction group.
Compensated fatalities by industry over timeTable 21 Compensated fatalities: number and incidence rate by industry division,2002–03 to 2006–07Industry 2002–03 2003–04 2004–05 2005–06 2006–07
Number of compensated fatalitiesAgriculture, forestry & fishing 26 29 30 26 14
Mining 13 8 7 15 7
Manufacturing 32 35 42 40 37
Electricity, gas & water supply 2 3 2 9 0
Construction 48 51 47 45 53
Wholesale trade 13 16 9 7 10
Retail trade 11 11 12 12 12
Accommodation, cafes & restaurants 5 13 9 4 7
Transport & storage 68 46 51 48 50
Communication services 5 4 3 3 5
Finance & insurance 3 2 1 4 2
Property & business services 19 22 15 31 17
Government administration & defence 22 15 11 6 13
Education 11 5 5 4 3
Health & community services 8 7 6 3 4
Cultural & recreational services 7 4 5 3 5
Personal & other services 9 9 9 11 13
Industry not stated 1 0 2 5 8
Total fatalities 303 280 266 276 260
Incidence rate (compensated fatalities per 100 000 employees)Agriculture, forestry & fishing 14.3 15.5 16.3 14.5 7.7
Mining 15.7 8.8 7.0 12.2 5.4
Manufacturing 3.2 3.6 4.2 4.1 3.8
Electricity, gas & water supply 2.8 4.1 2.7 10.8 0.0
Construction 10.6 10.1 8.5 7.8 8.2
Wholesale trade 3.2 4.0 2.3 1.7 2.3
Retail trade 0.8 0.8 0.9 0.8 0.8
Accommodation, cafes & restaurants 1.1 2.7 1.7 0.8 1.3
Transport & storage 19.3 12.0 12.8 11.7 12.0
Communication services 3.6 2.7 2.0 1.8 2.9
Finance & insurance 0.9 0.6 0.3 1.1 0.5
Property & business services 1.9 2.1 1.4 2.8 1.5
Government administration & defence 4.9 3.3 2.3 1.3 2.6
Education 1.6 0.7 0.7 0.5 0.4
Health & community services 0.9 0.7 0.6 0.3 0.4
Cultural & recreational services 3.0 1.7 1.9 1.1 1.8
Personal & other services 2.9 3.0 2.9 3.4 4.0
All fatalitiesa 3.6 3.2 3.0 3.0 2.7
aIncludes compensated fatalities where industry was not stated.
36 ... Safe Work Australia
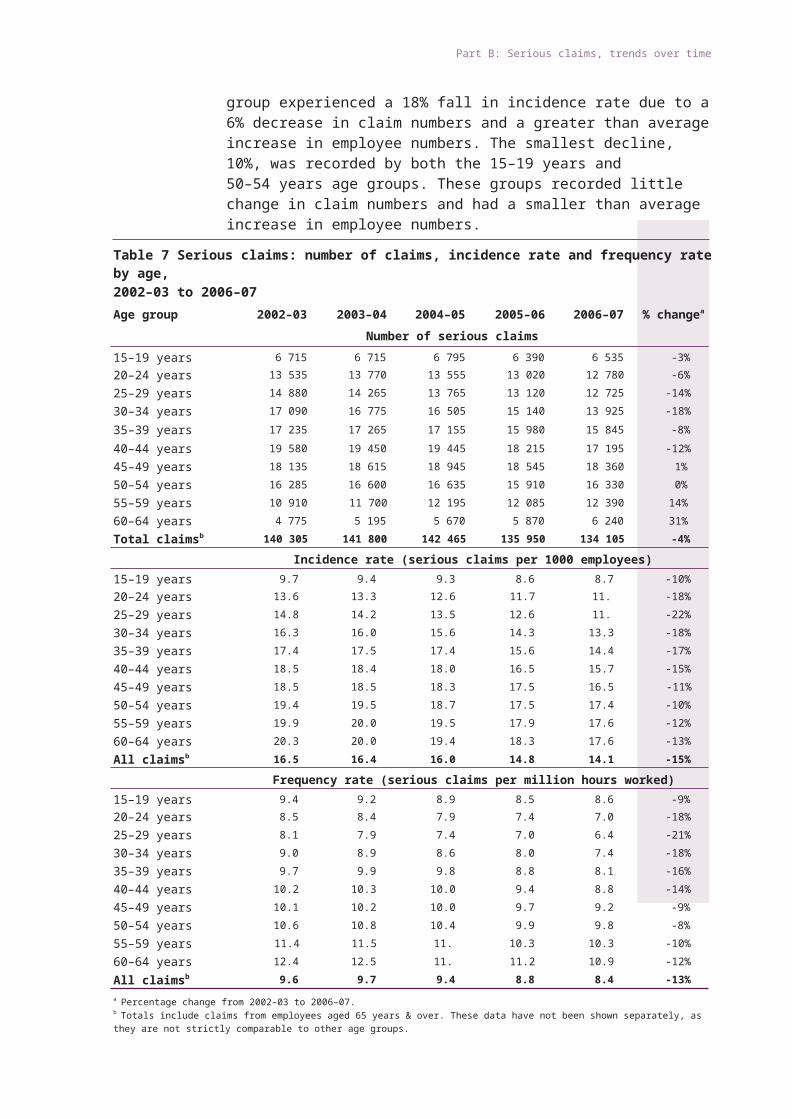
a
Part C: Compensated fatalities
In the analysis of trends, data from the most recent year are not used for comparison as these data are preliminary data and are likely to increase. It should also be noted that data for early years can also be revised as claims data in this publication are based on the date the claim was first lodged and there can be many years between a claim being lodged for ill health and the death of the employee.
Table 21 shows that over the period 2002–03 to 2006–07, the number of compensated fatalities in Australia decreased 14% — from 303 deaths down to 260. The decrease was also reflected in the overall incidence rate reducing from 3.6 compensated fatalities per 100 000 employees to 2.7.
While Table 21 shows that fatality incidence rates improved in most industries over the period 2002–03 to 2006–07, four industries continued to record considerably higher rates than the national rate. In 2006–07, theTransport & storage industry recorded 12.0 compensated fatalities per 100000 employees; Construction 8.2; Mining 5.4; Personal & other services4.0 and Manufacturing 3.8. Of these industries, the Mining industry improved the most over this time period, reducing its incidence rate from15.7 compensated fatalities per 100 000 employees in 2002–03 to 5.4 in2006–07.
Compensated fatalities by occupationTable 22 shows the number of compensated fatalities recorded in each major occupation group in 2007–08p. Intermediate production & transport workers accounted for 40% of compensated fatalities in 2007–08p (93 fatalities). This group also recorded the highest incidence and frequency rates: both more than four times the respective rate for all compensated fatalities. Within this group, almost three quarters of compensated fatalities (67) involved Road & rail transport drivers.
Table 22 Compensated fatalities: number, incidence rate and frequency rate by occupation major group (ranked on incidence rate), 2007–08p
Occupation Males Females Total Incidence rate
Frequency rateb
Intermediate production & transport workers 92 1 93 10.9 5.9
Labourers & related workers 36 2 38 4.6 3.1
Tradesperson & related workers 41 0 41 3.8 2.0
Managers & administrators 10 3 13 1.9 0.9
Professionals 22 4 26 1.3 0.7
Associate professionals 6 1 7 0.6 0.3
Elementary clerical, sales & service workers 5 1 6 0.6 0.5
Intermediate clerical, sales & service workers 6 2 8 0.4 0.3
Advanced clerical & service workers 0 0 0 0.0 0.0
Total fatalities 218 14 232 2.4 1.4a Compensated fatalities per 100 000 employees.b Compensated fatalities per 100 million hours worked.
The second highest number of fatality claims (41) was recorded by Tradesperson & related workers representing 18% of all compensated fatalities. This group includes mechanical engineering, automotive, electrical, food and skilled agricultural workers (11 fatalities wereidentified as Electrical & electronics tradespersons and 8 as Construction tradespersons, of which 6 were carpenters). This occupation group recorded the third highest incidence rate.
Compendium of Workers’ Compensation Statistics Australia 2007–08 ... 37

There were 38 fatalities involving employees who worked as Labourers & related workers which resulted in the second highest incidence rate of all occupation groups (4.6 compensated fatalities per 100 000 employees), almost twice the national rate.
As the majority of fatalities involved male employees, the pattern for male employees by occupation is similar to the national pattern described above.
Four of the 14 fatalities of female employees occurred among Professionals followed by three among Managers & administrators
Figure 17 provides occupation data at a more detailed level with the fifteen groups shown together accounting for 59% of all compensated fatalitiesin 2007–08p. This figure shows that Truck drivers recorded the highest number of fatalities (61 fatalities) accounting for 26% of all compensated fatalities. Of the 61 Truck driver deaths, 51 were due to vehicle accidents.
Figure 17 Compensated fatalities: fifteen highest occupation unit groups, 2007–08p
Truck drivers 61
Other miscellaneous labourers & related workers 10
Other professionals 9
Air transport professionals 8
Carpentry & joinery tradespersons 6
Communications tradespersons 5
Storepersons 5
Crop farmers 4
Electricians 4
Farm hands 4
General clerk 4
Metal fitters & machinists 4
Other agricultural & horticultural labourers* 4
Other mining, construction & related labourers* 4
Police officers 4
0 10 20 30 40 50 60
Compensated fatalities
* Other agricultural & horticultural labourers includes shooters-trappers and agricultural trainees and Other mining, construction & related labourers includes earthmoving labourers, survey hands, railway labourers and concreters.,
Other miscellaneous labourers & related workers experienced the second highest number of compensated fatalities (10). Of this group, three died from Being hit by a falling object and two from Falls from a height.
Compensated fatalities over time by occupationIn the analysis of trends, data for 2007–08 are not used for comparison, as they are preliminary data likely to increase. Table 23 shows that overthe period 2002–03 to 2006–07, the fatality frequency rate decreased 22%from 2.1 compensated fatalities per 100 million hours worked down to1.6. Frequency rates have been chosen for this analysis as this measure takes into account differences in hours worked across the occupation categories.
Table 23 also shows that fatality frequency rates decreased in all occupation categories except for Intermediate clerical, sales & service workers which increased from 0.2 to 0.6 compensated fatalities per 100 million hours worked. This category has one of the smallest numbers of fatalities accounting for 3% of all fatalities in 2006–07.
38 ... Safe Work Australia

Part C: Compensated fatalities
Labourers & related workers recorded the greatest decrease falling by29% from 5.2 to 3.7 compensated fatalities per 100 million hours worked over the period from 2002–03 to 2006–07. This category accounted for the third highest number of compensated fatalities (46 fatalities) and also had the second highest frequency rate, more than twice the rate for all occupation categories in 2006–07.
Intermediate production & transport workers has consistently recorded the highest fatality frequency rate since 2002–03. In 2006–07, the frequency rate for this category (5.2 compensated fatalities per 100 million hours worked) was over three times the rate for all occupation categories. While this category recorded an 8% decrease in frequency rates over the period from 2002–03 to 2006–07, this decrease is the smallest of all occupation major groups.
Table 23 Compensated fatalities: number and frequency rate by occupation major group, 2002–03 to 2006–07Occupation major group 2002–03 2003–04 2004–05 2005–06 2006–07
Number of compensated fatalitiesManagers & administrators 23 15 10 17 15
Professionals 27 14 23 32 19
Associate professionals 21 16 19 18 14
Tradespersons & related workers 69 65 66 61 63
Advanced clerical & service workers 4 2 1 3 1
Intermediate clerical, sales & service workers 6 13 3 9 16
Intermediate production & transport workers 79 77 90 78 79
Elementary clerical, sales & service workers 12 8 7 6 7
Labourers & related workers 61 69 47 52 46
Total fatalitiesa 303 280 266 276 260
Frequency rate (compensated fatalities per 100 million hours worked)Managers & administrators 2.1 1.4 0.8 1.2 1.0
Professionals 0.9 0.5 0.7 1.0 0.6
Associate professionals 1.1 0.8 0.9 0.9 0.6
Tradespersons & related workers 3.9 3.5 3.5 3.2 3.1
Advanced clerical & service workers 0.8 0.4 0.2 0.6 0.2
Intermediate clerical, sales & service workers 0.2 0.5 0.1 0.4 0.6
Intermediate production & transport workers 5.7 5.6 6.3 5.5 5.2
Elementary clerical, sales & service workers 1.0 0.7 0.6 0.5 0.6
Labourers & related workers 5.2 5.9 3.9 4.4 3.7
All fatalitiesa 2.1 1.9 1.8 1.8 1.6a Includes fatalities where occupation was not stated.
Compensated fatalities by nature of injury or diseaseThe Nature of injury or disease classification is used to categorise the most serious injury or disease sustained by the employee. Of the 232 compensated fatalities in 2007–08p, 187 (80%) were caused by aninjury and 45 (20%) were the result of a disease caused by work-related exposure to a hazardous substance or other agent.
Figure 18 shows that the most common category was Multiple injuries which accounted for 81 fatalities (35% of all compensated fatalities). This category is used when no principal injury could be identified as the cause of death. The second most common category of injury, with 10 fatalities,
Compendium of Workers’ Compensation Statistics Australia 2007–08 ... 39

was Internal injury of chest, abdomen & pelvis. There were 61 fatalities where the nature of injury was not identified.
Among disease fatalities, apart from 13 due to Ischaemic heart disease. there were 13 compensated fatalities in 2007–08p due to Mesothelioma (malignant neoplasm of the pleura) and 7 fatalities due to the related Asbestosis. However, it is known that workers’ compensation data does not provide an accurate measure of the incidence of these diseases in thecommunity. More information on these diseases can be found in the reportMesothelioma in Australia, available from the Safe Work Australia website.
The most common Nature of injury or disease recorded for male employees was Multiple injuries which accounted for 78 of the 218 male fatalities followed by Malignant neoplasms of the pleura (mesothelioma) which accounted for a further 13 male fatalities. For female employees, three of the 14 fatalities were due to Multiple injuries.
Figure 18 Compensated fatalities: number by nature of injury or disease, 2007–08pMultiple injuries 81
Ischaemic heart disease 13Malignant neoplasm of pleura (mesothelioma) 13
Internal injury of chest, abdomen and pelvis 10Asbestosis 7
Intracranial injury, including concussion 7Sprains and strains of joints & adjacent muscles 6
Fractures 6Contusion with intact skin surface & crushing injury 4
Electrocution or shock from electric currents 4Burns 2
Effects of weather, exposure, air pressure 2Malignant neoplasm of lymphatic & haematopoietic tissue 2
Other heart disease excluding ischaemic heart disease 2Other injuries* 63
Other diseases* 10
0 20 40 60 80
Compensated fatalities
* Other injuries includes fatal injuries with no other information and specific injuries that cannot be classified to another category. Other diseases iincludes Diabetes, diseases of blood and blood-forming organs, nose bleed and loss of smell or taste.
Half (22 fatalities) of the disease-related fatalities involved employees aged 55 years & over. A greater proportion of disease-related fatalities is expected in the older age groups compared with the younger agegroups because of the greater length of exposure by older employees to work-related conditions and the long latency period of some work-related diseases.
Compensated fatalities by mechanism of injury or diseaseThe Mechanism of injury or disease classification is used to describe the action, exposure or event that was the direct cause of the injury or disease. Figure 19 shows that 42% of fatalities (98 deaths) in 2007–08p were due to Vehicle accident with Long term contact with chemicals or substances accounting for a further 10% (24 deaths). There were 16 fatalities that involved Falling from a height and 15 fatalities that occurred due to Being hit by falling objects, including three cases where Ferrous and non-ferrous metal objects could be identified. There were 24 deaths were the mechanism was not identified and a further six where multiple mechanisms were the cause. These have been included in the Other & multiple mechanisms category.
40 ... Safe Work Australia

Part C: Compensated fatalities
Figure 19 Compensated fatalities: number by mechanism of injury or disease, 2007–08p
Vehicle accident 98
Long term contact with chemicals or substances 24
Falls from a height 16
Being hit by falling objects 15
Being hit by moving objects 11
Being trapped by moving machinery or equipment 7
Contact with electricity 5
Muscular stress while handling objects 5
Being trapped between stationary & moving objects 3
Falls on the same level 3
Contact with hot objects 2
Contact with biological factors of non-human origin 2
Single contact with chemical or substance 2
Other 30
0 20 40 60 80 100
Compensated fatalities
Table 24 shows the mechanisms with highest number of fatalities overthe past six years. While the total number of fatalities fell by 15% over this period, consistent improvement across all mechanisms has not occurred with increases in four of the nine mechanisms shown.
The data for Vehicle accident show a decrease in the number of fatalities from a high of 91 deaths in 2002–03 to 83 in 2006–07. A steady decline in numbers (except in 2005–06) occurred in claims due to Long term contact with chemicals or substances: from 57 fatalities down to 45, though there were substantially higher numbers in the intervening years.Of note is that while Figure 19 shows that Being hit by moving objects recorded 11 fatalities in 2007–08, the fifth highest cause of fatalities in that year, Table 24 shows that this mechanism usually accounts for many more fatalities each year and hence data from a single year should not be taken to represent the pattern for all years.
Table 24 Compensated fatalities: number of fatalities by selected mechanism of injury or disease, 2002–03 to 2006–07Mechanism 2002–03 2003–04 2004–05 2005–06 2006–07Vehicle accident 91 84 91 87 83
Long term contact with chemicals or substances 57 55 51 42 45
Being hit by falling objects 13 6 18 18 20
Being hit by moving objects 17 21 14 23 20
Falls from a height 16 24 13 18 13
Being trapped by moving machinery or equipment 8 5 3 2 11
Falls on the same level 2 5 3 3 8
Being assaulted by a person or persons 6 4 5 3 5
Contact with electricity 11 6 9 13 5
Other 82 70 59 67 50
Total compensated fatalities 303 280 266 276 260
Compendium of Workers’ Compensation Statistics Australia 2007–08 ... 41

Compensated fatalities by breakdown agencyThe Breakdown agency identifies ‘the object, substance or circumstance that was principally involved in, or most closely associated with, the point at which things started to go wrong and which ultimately led to the most serious injury or disease’. Figure 20 shows the most common breakdown agency for compensated fatalities in 2007–08p was Mobile plant & transport. Of the 107 fatalities attributed to this agency, 83 involved Road transport: mostly comprising Cars, station wagons, vans, utilities (30 fatalities) and Trucks, semi-trailers, lorries (47 fatalities).
Of the 31 fatalities involving Materials & substances, 21 involved asbestos. The third highest number of fatalities (16) involved Machinery & (mainly) fixed plant. Within this group Conveyors & lifting plant accounted for six fatalities and Electrical installation four fatalities.
Figure 20 Compensated fatalities: number by breakdown agency of injury or disease,2007–08p
Mobile plant & transport
Materials & substances
Machinery & (mainly) fixed plant
Environmental agencies
Non-powered handtools, appliances & equipment
Animal, human & biological agencies
Chemicals & chemical products
Powered equipment, tools & appliances
Other & unspecified agencies
108
31
16
15
13
12
3
3
31
0 20 40 60 80 100
Compensated fatalities
42 ... Safe Work Australia

Part DPriority industry profilesAgriculture, forestry & fishing
OverviewDuring 2007–08, the Agriculture, forestry & fishing industry employed360 000 people, 3% of the Australian workforce. The following statistics relate to the 50% of workers in this industry who were classified as employees in that year (i.e. excluding self-employed workers) and who lodged a workers’ compensation claim. Caution should be exercisedin using these data to represent workers in this industry who are not employees. Information on injuries incurred by all workers in this industry can be found in a report titled Work-related injuries in Australia:Agriculture, forestry and fishing industry which can be found on the SafeWork Australia website.
The preliminary data for 2007–08 show there were 4255 serious workers’ compensation claims in the Agriculture, forestry & fishing industry, representing 3% of all serious claims. This equates to 12 serious claims per day or 24.3 serious claims per 1000 employees. The Agriculture, forestry & fishing industry recorded the second highest incidence rate of all industries in 2007–08, 80% higher than the incidence rate for all industries (13.5 serious claims per 1000 employees).
Characteristics of serious claims in the preliminary data
Industry profileThe Agriculture, forestry & fishing industry division comprises four subdivisions, divided into a total of 11 groups. In 2007–08, the Horticulture & fruit growing and Grain, sheep & beef cattle farming groups together accounted for 59% of employees in this industry. Figure 21 shows that although the Other livestock farming group accounted for only 3% of employees, it recorded 6% of the serious claims. In the Services to agriculture industry group, the group that includes Shearing services, the proportion of claims (14%) alsoexceeded the proportion of employees (10%) by a wide margin. Another four of the 11 groups in the division also experienced a larger proportion of serious claims than their share of employees in the division as a whole.
Table 25 shows that the industry groups which experienced the lowest incidence rates in 2007–08p were Dairy cattle farming and Othercrop growing, with 14.8 and 14.9 serious claims per 1000 employees respectively. The group which recorded the highest incidence rate was Other livestock farming (49.2 serious claims per 1000 employees), with most claims arising from the Pig farming industry. The second highest incidence rate of 34.9 serious claims per 1000 employees was in the
Compendium of Workers’ Compensation Statistics Australia 2007–08 ... 43

Services to agriculture group. Most of the claims within this group (54%) were in the Services to agriculture nec category, which includes crop harvesting, fruit picking, hay bailing, land clearing, livestock drafting and droving, and pest control services. A further 41% of claims in this group were in the Shearing services industry.
Figure 21 Agriculture, forestry & fishing industry: proportion of employees and serious claims by industry group, 2007–08p
Grain, sheep & beef cattle farming
Horticulture & fruit growing
Services to agriculture
Dairy cattle farming
Forestry & logging
Other crop growing
Poultry farming
Other livestock farming
Aquaculture
Marine fishing
Hunting & trapping
Employees
Serious claims
0 10 20 30
Percentage of employees/serious claims
OccupationAlthough only 35% of employees in the Agriculture, forestry & fishing industry division were Labourers & related workers in the 2006 Census, employees in this occupation group lodged 57% of claims in 2007–08p. Among these were Agricultural & horticultural labourers, who lodged 46% of the claims, including Farm hands, who alone lodged 41%.
Sex and ageIn 2007–08, 29% of employees in the Agriculture, forestry & fishing industry were female, but female employees lodged only 21% of the serious claims. This equates to an incidence rate of 17.8 serious claims per 1000 female employees compared to 26.9 serious claims per 1000 male employees.
Figure 22 shows that male employees had considerably higher incidence rates than female employees in all age groups apart from the 15–24 years group, in which female employees recorded 30 serious claims per 1000 employees, compared with 29 serious claims per 1000 employees formale employees. It is worth noting that although the incidence rate for male employees was half again as high as for female employees, female employees experienced a higher frequency rate of 13.1 serious claims per million hours worked, as compared to 12.5 per million hours male employees in the industry worked.
44 ... Safe Work Australia
Part D: Priority industry profiles: Agriculture, forestry & fishing
Figure 22 Agriculture, forestry & fishing industry: incidence rate by sex and age, 2007–08p
Females 17.8 Males 26.9 Females Males
15–24 years
25–34 years
35–44 years
45–54 years
55–64 years
65 years & over
30.0
18.7
16.8
15.8
11.8
**
29.0
28.5
29.8
28.7
22.7
10.3
0 10 20 30
Serious claims per 1000 employees
** An incidence rate for women aged 65 years and over is not shown as the estimated number of employees in this cohort is unreliable.
Common causes of serious claimsMuscular stress while handling objects other than lifting, carrying or putting down was the most common cause of claims in the Agriculture, forestry & fishing industry in 2007–08p, accounting for 13% of claims. Other common causes were Falls on the same level and Falls from a height (with 11% and 10% of claims, respectively); and Muscular stress while lifting, carrying or putting down objects (10%). Being hit by an animal caused a further 8% of claims, more than half of them in the Grain, sheep& beef cattle farming group. In another 8% of claims, Vehicle accident was the causal mechanism, 61% of which were also in Grain, sheep & beef cattle farming, as well.
Common types of injury and diseaseIn 2007–08p, 83% of compensated claims in the Agriculture, forestry & fishing industry arose from injuries with the remainder being disease- related (17%). Sprains & strains of joints & adjacent muscles accounted for the greatest percentage of claims (44%) followed by Fractures (17%) and Open wounds not involving traumatic amputation (11%). Diseases of the musculoskeletal system & connective tissue accounted for a further10% of serious claims. These claims mainly involved Disorders of muscle, tendons & other soft tissues and Dorsopathies - disorders of the spinal vertebrae & intervertebral discs.
Common breakdown agenciesIn 2007–08p, Live four-legged animal was the Breakdown agency responsible for 18% of claims in the Agriculture, forestry & fishing industry as a whole. This breakdown agency accounted for 38% of claims in the Dairy cattle farming group, 37% in Other livestock farming and 34% in Grain, sheep & beef cattle farming. Outdoor environment, which includes buildings and other structures; fencing; vegetation; weather and water; and holes in the ground, accounted for a further 14% of claims across the industry division, but 23% of claims in the Forestry & logging group. Road transport was responsible for 9% of claims.
Compendium of Workers’ Compensation Statistics Australia 2007–08 ... 45

Changes in characteristics of serious claims over timeSince the 2007–08p data are preliminary, the time series comparisons extend only to 2006–07.
Table 25 shows that the incidence rate for the Agriculture, forestry & fishing industry fell from 30.4 serious claims per 1000 employees in 2002–03 to 25.2 in 2006–07 — a decrease of 17%, slightly more than the 15% decline across all industries over the period. Over the same period, the incidence rate in the Agriculture industry subdivision declined by 16%.
The largest employing sector, Grain, sheep & beef cattle farming recorded a 10% fall in incidence rates over the five year period but this was almost solely due to the fall in 2006–07. The preliminary data for 2007–08 indicates a continuing downward trend. The next highest employing sector, Horticulture & fruit growing has recorded steady falls over the five years.
Table 25 Agriculture, forestry & fishing industry: serious claims and incidence rate by industry subdivision and group, 2002–03 to 2007–08pIndustry subdivision and group 2002–03 2003–04 2004–05 2005–06 2006–07 2007–08p % changea
Number of serious claimsAgriculture 4 050 3 765 3 615 3 410 3 415 3 085
Horticulture & fruit growing 1 405 1 360 1 280 1 165 1 125 1 085
Grain, sheep & beef cattle farming 1 600 1 555 1 440 1 355 1 425 1 245
Dairy cattle farming 255 210 200 210 200 190
Poultry farming 225 200 215 160 160 180
Other livestock farming 335 285 285 325 315 260
Other crop growing 230 155 195 200 190 130
Services to agriculture, hunting &trapping 665 660 695 685 630 610
Forestry & logging 400 385 350 360 300 320
Commercial fishing 420 380 300 220 240 245
Marine fishing 200 165 135 95 115 110
Aquaculture 220 215 160 130 125 135
Total Agriculture, forestry & fishing 5 535 5 190 4 960 4 675 4 585 4 255
-16%
-20%
-11%
-22%
-29%
-6%
-17%
-5%
-25%
-43%
-43%
-43%
-17%
Incidence rate (claims per 1000 employees)Agriculture 27.2 25.1 24.5 23.7 22.8 22.5
Horticulture & fruit growing 22.4 19.4 19.6 18.8 18.8 21.3
Grain, sheep & beef cattle farming 28.5 28.6 30.6 28 25.5 23.7
Dairy cattle farming 28.1 31.3 17.9 17.6 19.9 14.8
Poultry farming 24.2 24.4 22.3 18.6 17.7 25.0
Other livestock farming 55.3 53.7 44.7 37.7 44.0 49.2
Other crop growing 43.0 30.2 24.0 41.4 24.2 14.9
Services to agriculture, hunting &trapping 47.0 42.8 43.9 40.4 41.4 34.9
Forestry & logging 45.7 33.2 30.8 32.8 28.6 26.7
Commercial fishing 41.1 38.9 31.3 29.0 38.3 28.8
Marine fishing 40.3 36.0 33.3 21.9 38.9 30.2
Aquaculture 42.2 41.5 29.8 3.08 37.9 27.7
Agriculture, forestry & fishing 30.4 27.8 26.9 26.0 25.2 24.3
-16%
-16%
-11%
-29%
-27%
-20%
-44%
-12%
-37%
-7%
-3%
-10%
-17%
a Percentage change from 2002–03 to 2006–07 due to potential volatility of the preliminary data for 2007–08.
46 ... Safe Work Australia

2002–03 2003–04 2004–05 2005–06 2006–07
Agriculture, forestry & fishing 4.7 4.2 4.4 4.6 4.6
All claims 4.0 3.7 3.6 3.8 3.9
Med
ian
time
lost
(w
eeks
)
Part D: Priority industry profiles: Agriculture, forestry & fishing
Marine fishing was the only group to record an increase in incidence rates over the five years despite a notable decrease in the number of claims. This is due to volatility in the estimate of employees and should be used with caution. Indeed, incidence rates for industries recording low numbers of claims and low estimates of employees should be interpreted with caution as annual fluctuations can lead to random volatility in incidence rates.
Payments made and duration of serious claimsFigure 23 shows that between 2002–03 and 2006–07, the median time lost from work for serious claims in the Agriculture, forestry & fishing industry fell slightly from 4.7 working weeks to 4.6, after falling to a low of4.2 weeks in 2003–04. The median time lost for claims across all industry divisions also fell from its 2002–03 high of 4.0 weeks to 3.6 weeks in2004–05, increasing again to 3.9 weeks in 2006–07.
The median payment for serious claims in the Agriculture, forestry & fishing industry increased by 23% from $4300 in 2002–03 to $5300 in 2006–07. As Figure 24 shows, although median payments in theAgriculture, forestry & fishing industry have remained below the overal median for each year, they have increased more than the median for all serious claims over this period (18%). Factors influencing the level of payments include the employee’s salary, the length of absence from work and medical expenses.
Notably, even though the median time lost figure for employees in the Agriculture, forestry & fishing industry was 18% higher than the corresponding figure for all industries in 2006–07, the median payment was 9% lower than the median payment for all industries. This is partially explained by the lower average salaries for employees in this industry compared with all industries.Figure 23 Agriculture, forestry & fishing industry: median time lost from work, 2002–03 to 2006–07
5
4
3
2
1
0
Compendium of Workers’ Compensation Statistics Australia 2007–08 ... 47

2002–03 2003–04 2004–05 2005–06 2006–07
Agriculture, forestry & fishing 4300 4500 4700 5100 5300
All claims 4900 5200 5300 5600 5800
Med
ian
cost
($)
Figure 24 Agriculture, forestry & fishing industry: median payment,2002–03 to 2006–07
6000
5000
4000
3000
2000
1000
0
Compensated fatalitiesThe Agriculture, forestry & fishing industry accounted for 10% of all compensated fatalities in 2007–08. Table 26 shows that between 2002–03 and 2005–06, the total number of compensated fatalities in the Agriculture, forestry & fishing industry was in the range of 26 and 30, falling dramatically to 14 in 2006–07. The preliminary result for 2007–08 is 22.
Incidence rates have followed the same pattern as the number of fatalities, rising from 14.3 compensated fatalities per 100 000 employees in 2002–03 to a high of 16.3 compensated fatalities per 100 000 employees in 2005–06. The low number of fatalities in 2006–07 resulted in a low fatality incidence rate of 7.7. The fatality incidence rate of 12.6 compensated fatalities per100 000 employees in 2007–08p is five times the all industries rate of 2.4 compensated fatalities per 100 000 employees.
Table 26 Agriculture, forestry & fishing industry: compensated fatalities and fatality incidence rate by industry subdivision and group, 2002–03 to 2007–08pIndustry subdivision and group 2002–03 2003–04 2004–05 2005–06 2006–07 2007–08p
Number of compensated fatalitiesAgriculture 18 18 11 13 12 14
Horticulture & fruit growing 1 6 2 1 2 6
Grain, sheep & beef cattle farming 10 7 7 9 6 6
Dairy cattle farming 1 2 1 0 2 0
Poultry farming 1 0 0 0 0 0
Other livestock farming 1 1 0 2 0 1
Other crop growing 4 2 1 1 2 1
Services to agriculture; hunting & trapping 3 8 10 5 2 6
Forestry & logging 3 8 10 5 2 6
Commercial fishing 2 2 1 3 0 0
Marine fishing 2 1 1 2 0 0
Aquaculture 0 1 0 1 0 0
Total Agriculture, forestry & fishing 26 29 30 26 14 22
Incidence rate (compensated fatalities per 100 000 employees)Agriculture, forestry & fishing 14.3 15.5 16.3 14.5 7.7 12.6
48 ... Safe Work Australia

Part D: Priority industry profiles: Agriculture, forestry & fishing
Characteristics of compensated fatalitiesDue to the small numbers of fatalities, this analysis of fatality characteristics is based on aggregated data for the three years, 2005–06 to 2007–08p. Over these three years, there were 62 compensated fatalities in the Agriculture, forestry & fishing industry, 39 (63%) in the Agriculture subdivision. Of the 21 compensated deaths specifically in the Grain, sheep& beef cattle farming group, eight were employees in the Grain-sheep &grain-beef cattle farming industry and another six in Beef cattle farming.
A further 13 deaths (21%) were of employees in the Services to agriculture group, including eight engaged in Services to agriculture nec, the industry that provides harvesting, fruit picking, hay bailing, land clearing, droving and pest control services.
Vehicle accident accounted for 28 deaths (45% of fatalities) in this industry between 2005–06 and 2007–08p. Other common causes were Being hitby falling objects (seven deaths, 11% of fatalities) and Being trapped by moving machinery (four deaths, 7%).
Between 2005–06 and 2007–08p, 54 of the deaths (87%) were due to injury, of which 21 were attributed to Multiple injuries. There were a further16 fatalities where the nature of injury was not defined and hence these were coded to Other & unspecified injuries. Of the eight disease–related fatalities, five involved Ischaemic heart disease.
Figure 25 shows that Employees in the 15–24 and 45–54 years agegroups experienced the lowest fatality rates (8.9 and 8.8 fatality claims per100 000 employees respectively) and those in the 35–44 years age group, the highest (16.3 fatality claims per 100 000 employees).
Employees in the 35–44 years age group recorded the highest proportion of all fatalities, 31%, and the 55 years and over age group recorded the lowest proportion, 6%.Figure 25 Agriculture, forestry & fishing industry: compensated fatality incidence rate by age group, 2003–04 to 2007–08p combined
Agriculture, forestry & fishing 11.6
15–24 years
25–34 years
35–44 years
45–54 years
55 years & over
8.9
10.3
16.3
8.8
12.8
0 5 10 15 20
Compensated fatalities per 100 000 employees
Compendium of Workers’ Compensation Statistics Australia 2007–08 ... 49

Construction
OverviewThe Construction industry employed 961 000 people in Australia in 2007–08,9% of the Australian workforce. Workers’ compensation statistics pertain only to the 71% of workers in this industry classified as employees in that year (i.e. excluding self-employed workers). Caution should be exercised in using these data to represent workers in this industry who are not employees. Information on injuries incurred by all workers in this industrycan be found in Work-related injuries in Australia: Construction industry on the Safe Work Australia website.
The preliminary data for 2007–08 show there were 14 410 serious workers’ compensation claims in the Construction industry, accounting for 11% of all serious claims. This equates to 39 serious claims per day or 21.6 serious claims per 1000 employees. The Construction industry recorded the fourth highest incidence rate of all industries in 2007–08p.
Characteristics of serious claims in the preliminary dataIndustry profileAs Figure 26 shows, within the Construction industry division, the largest number of employees worked in the Building construction industry group (30%), but lodged a smaller proportion of serious claims (20%), resulting in the lowest incidence rate of all groups in the Construction industry (14.7 serious claims per 1000 employees). Employees in the Installation trade services group, who comprised 25% of Construction employees, lodged 21% of the serious claims, giving them an incidence rate of 18.1 serious claims per 1000 employees, the second lowest in the division.
On the other hand, the Non-building construction and Building structure services groups lodged higher proportions of serious claims than their proportion of employees, resulting in the highest incidence rates of all groups in the industry (41.3 and 33.0 serious claims per 1000 workers, respectively).Figure 26 Construction industry: proportion of employees and serious claims by industry group, 2007–08p
Building construction
Installation trade services
Building completion services
Other construction services
Building structure services
Employees
Serious claims
Non-building construction
Site preparation services
0 10 20 30Percentage of employees/serious claims
50 ... Safe Work Australia
Part D: Priority industry profiles: Construction
OccupationMore than 60% of serious claims in the Construction industry were lodged by employees from five Occupation minor groups: Structural construction tradespersons (20%, including Carpentry & joinery tradespersons 13%); Mining, construction & related labourers (17%, including Construction& plumbers assistants 8% and Concreters 4%); Electrical & electronics tradespersons (9%, including Electricians 6%); Miscellaneous labourers & related workers (9%); and Plumbers (7%).
Sex and ageIn 2007–08p, although 12% of employees in the Construction industry were female, they lodged only 2% of the serious claims, resulting in an incidence rate of 4.0 serious claims per 1000 female employees, one sixth the rate for male employees (24.1 serious claims per 1000 employees).
Figure 27 shows that incidence rates for female employees in all age ranges were consistently much lower than those for their male counterparts, ranging between 3.2 and 5.1 serious claims per 1000 female employees. For male employees, incidence rates ranged from19.7 serious claims per 1000 employees for those aged 15–24 years to35.5 serious claims per 1000 employees for those aged 55–64 years. This difference between male and female incidence rates in part reflects the different types of work men and women undertake in this industry. Specifically, according to 2006 Census data, 58% of women in the Construction industry work in clerical occupations and another 25% in Professional and Associate professional occupations. Only 3% work as Tradespersons & related workers and 4% as Labourers & related workers, the occupation groups lodging the largest numbers of serious claims.
Figure 27 Construction industry: incidence rate by sex and age, 2007–08p
Females 4.0 Males 24.1 Females Males
15–24 years
25–34 years
35–44 years
45–54 years
55–64 years
65 years and over
5.1
4.1
3.2
4.6
3.3
**
19.7
21.7
26.3
25.0
35.5
30.4
0 10 20 30
Serious claims per 1000 employees
** An incidence rate for females aged 65 years and over is not shown as the estimated number of employees in this cohort is unreliable.
Common causes of serious claimsBody stressing was the Mechanism group that caused 34% of serious claims in the Construction industry in 2007–08p. The most common individual Mechanisms were Muscular stress while lifting, carrying or putting down objects (16%) and Muscular stress while handling objects other than lifting, carrying or putting down (13%). Falls, trips and slips of a person were responsible for 26% of serious claims, including Falls from a height (13%)and Falls on the same level (12%).
Compendium of Workers’ Compensation Statistics Australia 2007–08 ... 51

Unsurprisingly, in the Roofing services industry, Falls from a height were responsible for 26% of serious claims, twice the rate for the Construction industry division as a whole. Falls from a height caused an even higher proportion of serious claims in Painting and decorating services (32%). Body stressing claims were double the overall rate in Concreting services (70%) and well above average in Glazing services (42%), Bricklaying services (43%) and Tiling & carpeting services (43%).
Common types of injury and diseaseIn 2007–08p, three-quarters of serious claims (77%) in the Construction industry resulted from injury. Sprains & strains of joints & adjacentmuscles accounted for 38% of serious claims followed by Open wound not involving traumatic amputation and Fractures both with 12%.
Diseases of the musculoskeletal system & connective tissue (MSDs) caused 11% of all serious claims, including Dorsopathies—disorders of the spinal vertebrae & intervertebral discs (5%) and Disorders of muscle, tendons & other soft tissues (4%). Deafness was the cause of 6% of serious claims.
Common breakdown agenciesOne-quarter of claims in the Construction industry in 2007–08p involved Non powered handtools, of which Ladders and Scaffolding accounted for the greatest proportions: 5% and 3% of serious claims respectively.
Materials & substances accounted for a further 22% of claims of which Ferrous & non-ferrous metal, the category that includes pipes and girders, accounted for 7% of all serious claims. Vehicles such as trucks and cars accounted for 4% of serious claims.
The impact of the various breakdown agencies varied across the industry groups within the Construction industry. Road transport and Self-propelled plant, for example, were each the breakdown agencies involved in 13% of serious claims in Site preparation services, but only 3% or less in Building completion services, Building construction, Building structure services and Installation trade services. Ferrous & non-ferrous metal was responsible for 11% of serious claims in Building structure services, but only 4% in Building completion services and Site preparation services. Ladders accounted for 11% of serious claims in Installation trade services, 7% in Building completion services and 5% in Building construction, but only1-3% in the other groups. Scaffolding was the breakdown agency in 7% of serious Other construction services claims and 5% in Building completion services, but between 1% and 3% in the other groups.
Changes in characteristics of serious claims over timeSince the 2007–08p data are preliminary, they are excluded from time series comparisons to avoid overstatement of any percentage falls. Table 27 shows that between 2002–03 and 2006–07, the incidence rate in the Construction industry decreased 22% from 28.1 serious claims per 1000 employees to 21.6. This is greater than the decrease in the incidence rate for all industries (15%).
52 ... Safe Work Australia

Part D: Priority industry profiles: Construction
Within the Construction industry, all groups recorded decreasesin incidence rates over the five years. Incidence rates in the Other construction services industry group, which includes landscaping services, sandblasting and scaffolding construction, decreased 33% from 30.1 serious claims per 1000 employees in 2002–03 to 20.2 in 2006–07, the largest decrease of all groups in the Construction industry division overthe five-year period. Over the same period, Site preparation services andBuilding structure services also experienced declines in incidence rates of 30% and 32%, respectively. In the Non-building construction group, which has experienced the highest incidence rates in each year, the rate decreased by 26% over the five-year period, but 35% from its peak of 57.4 serious claims per 1000 employees in 2003–04 to 37.4 in 2006–07.
Incidence rates for groups containing relatively low numbers of serious claims should be interpreted with caution as comparatively smallrandom annual fluctuations in claim numbers can lead to dramatic shifts in incidence rates that may not be indicative of trends. Estimates of employee numbers in smaller groups can also fluctuate from year to year, with similar impact on incidence rates.
Table 27 Construction industry: serious claims and incidence rate by industry subdivision and group, 2002–03 to 2007–08pIndustry subdivision and group 2002–03 2003–04 2004–05 2005–06 2006–07 2007–08p %changea
Number of serious claimsGeneral construction 4 730 5 340 5 570 5 245 5 125 5 250
Building construction 2 445 2 755 2 945 2 705 2 760 2 930
Non-building construction 2 285 2 590 2 625 2 540 2 365 2 320
Construction trade services 8 020 8 655 8 805 8 620 8 890 9 160
Site preparation services 830 885 955 950 970 1 095
Building structure services 1 670 1 885 1 800 1 690 1 740 1 885
Installation trade services 2 635 2 820 2 925 2 890 3 000 2 975
Building completion services 1 765 1 905 1 850 1 880 1 935 1 885
Other construction services 1 120 1 160 1 270 1 215 1 240 1 315
Construction 12 755 13 995 14 375 13 860 14 015 14 410
8%
13%
4%
11%
17%
4%
14%
10%
11%
10%
Incidence rate (serious claims per 1000 employees)General construction 26.5 27.6 27.6 23.6 21.3 20.5
Building construction 18.3 18.5 19.2 15.5 15.5 14.7
Non-building construction 50.4 57.4 54.4 53.0 37.4 41.3
Construction trade services 29.3 27.8 25.3 24.5 22.1 22.3
Site preparation services 33.7 35.1 27.1 28.5 23.3 26.8
Building structure services 44.3 36.8 31.3 30.8 30.1 33.0
Installation trade services 23.5 24.1 22.9 20.9 18.6 18.1
Building completion services 28.2 24.9 21.6 25.6 24.1 21.4
Other construction services 30.1 27.8 30.0 23.4 20.2 22.2
Construction 28.2 27.7 26.1 24.2 21.8 21.6
-20%
-15%
-26%
-25%
-31%
-32%
-21%
-14%
-33%
-23%
a Percentage change from 2002–03 to 2006–07 due to potential volatility of the preliminary data for 2007–08.
Payments made and duration of serious claimsFigure 28 shows that between 2002–03 and 2006–07, the median time lost from work in the Construction industry decreased slightly from 4.2 working weeks to 4.0 in 2005–06 and remained at that level in 2006–07. Median time lost in 2007–08p remained at 4.0 weeks. This is higher than
Compendium of Workers’ Compensation Statistics Australia 2007–08 ... 53

2002–03 2003–04 2004–05 2005–06 2006–07
Construction 4.2 4.0 3.8 4.0 4.0
All industries 4.0 3.7 3.6 3.8 3.9
2002–03 2003–04 2004–05 2005–06 2006–07
Construction 6300 6500 6700 6900 7100
All industries 4900 5200 5300 5600 5800
Med
ian
cost
($)
Med
ian
time
lost
(wee
ks)
the rate for serious claims across all industry divisions, which declined from 4.0 weeks in 2002–03 to 3.6 weeks in 2004–05, rising again to 3.9 weeks in 2006–07.Figure 28 Construction industry: median time lost from work, 2002–03 to2006–07
5
4
3
2
1
0
While the median time lost fell slightly, Figure 29 shows that the median payment increased 11% (from $6300 to $7100) for serious claims in the Construction industry. This was a smaller increase than that recorded for all industries which increased 18% (from $4900 to $5800).
Factors influencing the payments made include the employee’s salary level, the length of absence from work, and medical expenses. The higher median payment in the Construction industry arises in part from higher salaries in this industry and the slightly higher median time lost figures (see Figure 29).
Figure 29 Construction industry: median payment, 2002–03 to 2006–07
8000
6000
4000
2000
0
Compensated fatalitiesTable 28 shows that between 2002–03 and 2006–07, the number of compensated fatalities in the Construction industry increased by 10% from48 to 53. Preliminary data for 2007–08 show 37 compensated fatalities so far. While the Construction industry employed 7% of Australian employees, it accounted for 20% of all compensated fatalities in 2006–07 and 16% of the preliminary number of fatalities compensated in 2007–08.
In 2006–07, the compensated fatality incidence rate in the Construction industry was 8.2 compensated deaths per 100 000 employees, a 5% increase over the previous year and three times the rate for all industries (2.7 deaths per 100 000 employees). The compensated fatality incidence rate for 2007–08p was 5.6 compensated deaths per 100 000 employees.
54 ... Safe Work Australia

Part D: Priority industry profiles: Construction
In 2007–08p, there were nine compensated fatalities in the Building construction industry group, the highest number in the Construction division. In Non-building construction, there were eight compensated fatalities in 2007–08p, lower than the two previous years. In the Site preparation services group, on the other hand, there were seven compensated fatalities in 2007–08p, the highest number in this group over the past six years.
Table 28 Construction industry: compensated fatalities and fatality incidence rate by industry subdivision and group, 2002–03 to 2007–08pIndustry subdivision and group 2002–03 2003–04 2004–05 2005–06 2006–07 2007–08p
Number of compensated fatalitiesGeneral construction 10 19 18 16 18 17
Building construction 1 11 9 5 8 9
Non-Building onstruction 9 8 9 11 10 8
Construction Trade Services 38 32 29 29 35 20
Building Completion Services 17 13 13 8 9 5
Building Structure Services 6 5 1 2 4 2
Installation Trade Services 11 6 10 10 16 3
Other Construction Services 1 3 2 7 4 3
Site Preparation Services 3 5 3 2 2 7
Construction 48 51 47 45 53 37
Incidence rate (compensated fatalities per 100 000 employees)Construction 10.6 10.1 8.5 7.8 8.2 5.6
Characteristics of compensated fatalitiesIn order to produce a more robust analysis of fatality characteristics, data from the three years, 2005–06 to 2007–08p, are aggregated in the following analysis. There were 135 compensated fatalities in the industry over this period.
Construction trade services subdivision accounted for 84 of the compensated fatalities during this period — 29 of these within Installation trade services. The remaining 51 compensated fatalities occurred inthe General construction subdivision — 29 of these within Non-building construction (which includes the construction of roads, bridges, dams and pipelines), and 22 in Building construction.
Long term contact with chemicals or substances was the most common cause of compensated fatalities in the Construction industry between2005–06 and 2007–08p, accounting for 45 deaths. Other common causes were Vehicle Accident (32 deaths), Falls from a height (15 deaths), Being hit by falling objects (10 deaths) and Contact with electricity (nine deaths).
Between 2005–06 and 2007–08p, 62% of compensated fatalities in the Construction industry were injury-related and 38% were disease-related. This is the highest proportion of disease claims of all industries.
Apart from unspecified Multiple injuries (32 deaths) and Other & unspecified injuries (15 deaths), the most common causes of injury-related compensated fatalities were, Electrocution or shock from electric currents (10 deaths) and Intracranial injury, including concussion (seven deaths). Malignant neoplasm of pleura (mesothelioma) was the most common disease causing compensated fatalities over the three year period (32
Compendium of Workers’ Compensation Statistics Australia 2007–08 ... 55

deaths), followed by Asbestosis (12 deaths). Workers’ compensation data do not provide an accurate measure of the incidence of these diseases in the community. More information on these diseases can be found in the report Mesothelioma in Australia (http://www.safeworkaustralia.gov.au/NR/rdonlyres/6BFF2004-8889-4978-97EB-EF648BA0C005/0/Annual_Meso_Report2009.pdf).
Figure 30 shows that fatality incidence rates generally increased with age. The much higher fatality incidence rate recorded for employees aged 55 years and over is mostly attributable to Mesothelioma and Asbestosis, which are responsible for 35 of the 48 deaths in this age group. It is important to note that Mesothelioma and Asbestosis have a long latency period, typically resulting in death 20 to 30 years after the initial exposure. Therefore the date of claim lodgement upon which ‘age’ is assigned in these data do not correspond to the age at which the exposure occurred but rather the date at which diagnosis was made. For other compensated fatalities, particularly for injuries, the date of lodgement much better reflects the age at which the incident causing death occurred.Figure 30 Construction industry: compensated fatality incidence rate by age group, 2005–06 to 2007–08p combined
Construction 7.2
15–24 years
25–34 years
35–44 years
45–54 years
55 years and over
5.1
2.8
6.8
6.5
24.9
0 5 10 15 20 25
Compensated fatalities per 100 000 employees
56 ... Safe Work Australia

Health & community services
OverviewThe Health & community services industry employed 1 111 000 people in 2007–08, 11% of employed persons in Australia. The following workers’ compensation statistics relate to the 95% of workers in this industry division classified as employees in that year (i.e. excluding self- employed workers).
The preliminary data for 2007–08p show there were 16 015 serious claims in the Health & community services industry division, 12% of the serious claims across all industries. This equates to 44 serious claims per day or 14.4 serious claims per 1000 employees. The incidence rate in the Health & community services industry was the eighth highest of all industries, slightly higher than the national rate of 13.5.
Characteristics of serious claims in the preliminary data
Industry profileWithin the Health & community services industry, although 47% of the employees worked in the Hospitals & nursing homes industry group,they lodged 57% of serious workers’ compensation claims in the industry division as a whole. As Figure 31 shows, the proportion of serious claims lodged in the Community care services group was also greater than expected from its proportion of employees (17% of employees and 25% of claims). (See Figure 31)
In contrast, the Medical & dental services group had the third largest proportion of employees (14%), but the second lowest proportion of serious claims, resulting in the lowest incidence rate of serious claims in the Health & community services industry (2.3 serious claims per 1000 workers). Table 29 shows employees in the Community care services group experienced the highest rate of serious claims (20.9 serious claims per 1000 workers).
Half of all serious claims were lodged by employees in the Carers & aides (33%, including Personal care & nursing assistants 22%) and Nursing professionals (18%) occupation groups.Figure 31 Health & community services industry: proportion of employees and serious claims by industry group, 2007–08p
Hospitals & nursing homes
Community care services
Other health services
Child care services
Medical & dental services
Veterinary services
Employees
Serious claims
0 15 30 45 60
Percentage of employees/serious claims
Compendium of Workers’ Compensation Statistics Australia 2007–08 ... 57

Sex and ageWomen comprised 80% of all employees in the Health & community services industry in 2007–08p, the highest proportion of any industry division. As female employees lodged 80% of serious claims, men and women in the industry experienced similar incidence rates: 14.3 serious claims per 1000 female employees and 14.8 per 1000 male employees. It is worth noting that although the incidence rate for male employees was a little higher than for female employees, female employees experienced a higher frequency rate of 10.4 serious claims per million hours worked, as compared to 8.6 per million hours male employees in the industry worked.Figure 32 Health & community services industry: Incidence rate by sex and age, 2007–08p
Females 14.3 Males 14.8 Females Males
15–24 years
25–34 years
35–44 years
45–54 years
55–64 years
65 years & over
8.8
10.6
14.3
17.9
16.2
12.3
6.1
10.5
14.9
19.3
19.0
10.2
0 5 10 15 20
Serious claims per 1000 employees
Figure 32 shows that male and female employees recorded similar incidence rates across the age groups with female employees recording higher rates than male employees in the 15–24 years and 65 years and over age groups. The highest incidence rates were recorded by the 35–44 years and 45–54 years age groups.
Common causes of serious claimsBody stressing was the most common cause of serious claims in the Health & community services industry in 2007–08p, accounting for over half (53%) of all serious claims in the industry. A more detailed analysisof this mechanism shows that more than one-quarter (27%) of all serious claims were caused by Muscular stress while handling objects other than lifting, carrying or putting down, 17% by Muscular stress while lifting, carrying, or putting down objects and 14% by Falls on the same level.
Proportions were similar across most groups within this industry in 2007–08p. Predictably, however, the Veterinary services group lodged 71% ofthe serious claims caused by Being bitten by an animal (22% of Veterinary services claims) and 93% of those caused by Being hit by an animal (12% of Veterinary services claims). Employees in Veterinary services also lodged serious claims caused by Body stressing at less than half the rate across the industry as a whole (23% of claims).
Serious claims for Mental stress were much more prevalent in the Medical& dental services (15%) and Community care services (13%) groups than the industry average of 8%.
58 ... Safe Work Australia

Part D: Priority industry profiles: Health & community services
Common types of injury and diseaseIn 2007–08p, 70% of serious claims in Health & community services were injury-related, with Sprains & strains of joints & adjacent muscles alone causing 53% of all serious claims in the industry. The most common disease-related claims arose from Dorsopathies – disorders of the spinal vertebrae & intervertebral discs and Disorders of muscle, tendons & other soft tissues each of which caused 8% of all serious claims.
These proportions were similar for most industry groups within the Health& community services industry in 2007–08p. In the Veterinary services group, however, there was a much higher proportion of Open wound not involving amputation (23% of serious claims, ten times the 2% for the industry as a whole) and a lower proportion of Sprains & strains of joints & adjacent muscles (31% of serious claims).
Common breakdown agenciesThe breakdown agency most commonly associated with serious claims in this industry in 2007–08p was Other person, predominantly handling or lifting the person being cared, accounting for 34% of serious claims,with 56% of these claims lodged by employees in the Hospitals & nursing homes group and a further 28% lodged by employees in Community care services.
There was a similar distribution of these breakdown agencies across the industry groups within Health & community services in 2007–08p. In the Veterinary services group, however, 52% of serious claims were unsurprisingly attributed to Live four-legged animals, principally Dogs.A much higher than average (3%) proportion of serious claims lodged in Other health services, the group that includes Ambulance services, was due to Road transport (8%).
Changes in characteristics of serious claims over timeTable 29 shows that the incidence rate of serious claims in the Health & community services industry fell 15% from 17.5 serious claims per 1000 employees in 2002–03 to 14.9 in 2006–07. This is slightly less than the16% fall in the incidence rate for all industries.
Medical & dental services recorded the greatest percentage improvement in incidence rates (34%) over the five years. This group accounted for13% of employees. Other health services recorded the next highest percentage improvement (23%) over the five years though the rates have fluctuated from 13.1 serious claims per 1000 employees to 21.5. Incidence rates for groups containing relatively low numbers of serious claims should be interpreted with caution as random annual fluctuations in claim numbers can lead to shifts in incidence rates, posing difficultiesin comparing rates over time. Estimates of employee numbers in smaller groups can also fluctuate from year to year, impacting on incidence rates.
Compendium of Workers’ Compensation Statistics Australia 2007–08 ... 59

Table 29 Health & community services industry: serious claims and incidence rate by industry subdivision and group, 2002–03 to 2007–08p
Industry subdivision & group 2002–03 2003–04 2004–05 2005–06 2006–07 2007–08p %changea
Number of serious claimsHealth services 12 195 12 840 13 240 11 750 11 465 11 200
Hospitals & nursing homes 9 970 10 275 10 585 9 695 9 390 9 130
Medical & dental services 365 415 375 325 330 355
Other health services 1 775 2 060 2 165 1 605 1 635 1 595
Veterinary services 85 90 115 125 110 120
Community services 4 150 4 335 4 345 4 595 4 770 4 815
Child care services 605 750 755 790 870 810
Community care services 3 545 3 585 3 590 3 805 3 905 4 005
Health & community services 16 345 17 180 17 585 16 345 16 235 16 015
-6%
-6%
-10%
-8%
29%
15%
44%
10%
-1%
Incidence rate (serious claims per 1000 employees)Health services 17.3 17.9 18 15.1 14.3 13.6
Hospitals & nursing homes 21.6 21.4 22.3 19.5 18.2 17.4
Medical & dental services 2.9 3.2 2.8 2.2 2.2 2.3
Other health services 16.9 21.5 19.2 13.5 13.1 13.2
Veterinary services 7.3 7.4 7.4 8 7.5 6
Community services 18.1 18.6 17.7 17.5 16.8 16.7
Child care services 9.2 10.6 9.5 9.1 9.2 8.4
Community care services 21.7 22.1 21.6 21.7 20.5 20.9
Health & community services 17.5 18.1 17.9 15.7 14.9 14.4
-18%
-16%
-25%
-23%
2%
-7%
0%
-5%
-15%a Percentage change from 2002–03 to 2006–07 due to potential volatility of the preliminary data for 2007–08.
Payments made and duration of serious claimsFigure 33 shows that between 2002–03 and 2006–07, the median time lost from work for serious claims in the Health & community services industry decreased from 4.7 weeks to 4.2 weeks in 2003–04, then increased to 4.6 weeks in 2005–06 and returned to 4.7 weeks in the final year of the series. In contrast, the median time lost across all industries dropped from 4.0 to 3.6 weeks in 2004–05, then rose to 3.9 weeks in2006–07.
Over the same period, the median payment increased 13% from $4500 to $5100 for serious claims in the Health & community services industry, below the 14% increase recorded for all serious claims (Figure 34).
Factors influencing the payments made include employee’s salary level, the length of absence from work and medical expenses. Despite the longer periods off work for serious claims in the Health & community services industry, the costs of serious claims were lower, due to lower average pay of employees in this industry.
60 ... Safe Work Australia

2002–03 2003–04 2004–05 2005–06 2006–07
Health & community services 4.7 4.2 4.2 4.6 4.7
All industries 4.0 3.7 3.6 3.8 3.9
2002–03 2003–04 2004–05 2005–06 2006–07
Health & community services 4500 4400 4500 5000 5100
All industries 4900 5200 5300 5600 5800
Med
ian
cost
($)
Med
ian
time
lost
(wee
ks)
Part D: Priority industry profiles: Health & community services
Figure 33 Health & community services industry: median time lost from work, 2002–03 to 2006–07
5
4
3
2
1
0
Figure 34 Health & community services industry: median payment, 2002–03 to 2006–07
8000
6000
4000
2000
0
Compensated fatalitiesTable 30 shows that the number of compensated fatalities in the Health& community services industry declined steadily from eight in 2002–03 to three in 2005–06, rising to four in 2006–07. The preliminary data for2007–08p show two compensated fatalities.
The fatality incidence rate has closely tracked the number of fatalities over this period, remaining lower than the rate for all industries. In 2006–07, the compensated fatality incidence rate in the Health & community services industry division stood at 0.4 compensated fatalities per 100 000 employees, less than one-sixth the rate for all industries of 2.7 fatalities per 100 000 employees.
Characteristics of compensated fatalitiesIn order to produce a more robust analysis of compensated fatality characteristics, data from the five-year period, 2003–04 to 2007–08p are aggregated for the following analysis. During this period, there were 22 compensated fatalities in the Health & community services industry: eight in Other health services; six in Hospitals & nursing homes; four in Medical& dental services; and four in Community care services.
The most common specific cause of fatality in the Health & community services industry over the period was Vehicle accident, which causedsix of the 22 compensated fatalities while another five were attributed to
Compendium of Workers’ Compensation Statistics Australia 2007–08 ... 61

Unspecified mechanisms of injury. Similarly, five fatalities were due toOther & unspecified injuries and four to Multiple injuries.
Table 30 Health & community services industry: compensated fatalities and fatality incidence rate by industry subdivision and group,2002–03 to 2007–08p
Industry subdivision & group 2002–03 2003–04 2004–05 2005–06 2006–07 2007–08p
Number of compensated fatalitiesHealth services 2 5 5 3 4 1
Hospitals & nursing homes 2 0 3 1 1 1Medical & dental services 0 1 0 1 2 0Other health services 0 4 2 1 1 0Veterinary services 0 0 0 0 0 0
Community services 6 2 1 0 0 1Child care services 1 0 0 0 0 0Community care services 5 2 1 0 0 1
Health & community services 8 7 6 3 4 2
Incidence rate (compensated fatalities per 100 000 employees)Health & community services 0.9 0.7 0.6 0.3 0.4 0.2
Figure 35 shows that the 25–34 year age group experienced both highest number of compensated fatalities (9) and the highest fatality incidence rate over this five year period (0.9 compensated fatalities per100 000 employees). Although half of the compensated fatalities were women, because of the large proportion of women employed in Health& community services, they experienced a fatality incidence rate of 0.3 per 100 000 employees, less than one-third the 1.1 per 100 000 male employees.Figure 35 Health & community services industry: compensated fatality incidence rate by age group, 2003–04 to 2007–08p combined
Health & community services 0.4
15–24 years
25–34 years
35–44 years
45–54 years
55 years and over
0.2
0.9
0.2
0.4
0.4
0.0 0.2 0.4 0.6 0.8 1.0
Compensated fatalities per 100 000 employees
62 ... Safe Work Australia

Manufacturing
OverviewThe Manufacturing industry employed 1 096 000 people in 2007–08,10% of the Australian workforce. The following workers’ compensation statistics relate to the 93% of workers in this industry who were classified as employees in that year (i.e. excluding self-employed workers).
The preliminary data for 2007–08 show there were 24 315 serious workers’ compensation claims in the Manufacturing industry, 19% of serious claims across all industries. This equates to 66 serious claims per day or 24.1 serious claims per 1000 employees. This incidencerate is the third highest incidence rate of all industries in 2007–08p and nearly twice the national rate of 13.5 claims per 1000 employees.
Characteristics of serious claims in the preliminary data
Industry profileWithin the Manufacturing industry, the Machinery & equipment manufacturing subdivision accounted for the largest proportion of employees (23%) and the second largest proportion of serious claims (20%). Figure 36 shows that employees in the Food, beverage & tobacco manufacturing group lodged the largest proportion of serious claims (26%). The 6% of Manufacturing employees working in the Wood & paper product manufacturing group lodged 9% of claims, recording an incidence rate of 35.1 serious claims per 1000 employees, the highest in the Manufacturing division (see Table 31). In contrast, the Printing, publishing& recorded media manufacturing group accounted for 11% of employees but lodged only 4% of serious claims and therefore recorded the lowest incidence rate (8.8 serious claims per 1000 employees).
Figure 36 Manufacturing industry: proportion of employees and serious claims by Industry subdivision, 2007–08p
Machinery & equipment manufacturing
Food, beverage & tobacco manufacturing
Metal product manufacturing
Printing, publishing & recorded media
Petroleum, coal, chemical & associated product manufacturing
Wood & paper product manufacturing
Other Manufacturing
Textile, clothing, footwear & leather manufacturing
Non-metallic mineral product manufacturing
Employees
Serious claims
0 4 8 12 16 20 24
Percentage of employees/serious claims
Viewed in greater detail, discrepancies among the Manufacturing industry groups displayed stark contrasts. Employees in seven of the55 Manufacturing industry groups lodged fewer than 10 serious claims per 1000 employees, while in six groups, the incidence rate was over 50
Compendium of Workers’ Compensation Statistics Australia 2007–08 ... 63

serious claims per 1000 employees. The highest rate of all was in Sheet metal product manufacturing, with a rate of 84.8 serious claims per 1000 employees, while the lowest was in Clothing manufacturing, with 4.4.
OccupationEmployees in three occupation groups lodged 90% of the serious claims in the Manufacturing industry, Labourers & related workers (38%), Tradespersons & related workers (32%) and Intermediate production & transport workers (20%). Structural steel & welding tradespersons alone lodged 8% of the serious claims, and Meat & fish process workers, 7%.
Sex and ageWhile 26% of the employees in the Manufacturing industry in 2007–08 were female, they lodged only 15% of serious claims, resulting in a much lower incidence rate than for male employees (13.8 serious claims per1000 female employees compared with 27.6 serious claims per 1000 male employees).
Figure 37 shows that in 2007–08p, incidence rates among female employees varied widely from 8.7 serious claims per 1000 female employees in the 25–34 years age group to 15.0 in the 35–44 years and 55–64 years age groups. For male employees, incidence ratesvaried much less with age, averaging 27.6 serious claims per 1000 male employees. Men in the 55–64 year age group, however, lodged 33.5 serious claims per 1000 male employees.
Figure 37 Manufacturing industry: incidence rate by sex and age, 2007–08p
Females 13.8 Males 27.6 Females Males
15–24 years
25–34 years
35–44 years
45–54 years
55–64 years
65 years & over
10.6
8.7
15.0
18.8
15.0
**
29.3
26.4
26.0
26.5
33.5
26.7
0 10 20 30
Serious claims per 1000 employees
** An incidence rate for women aged 65 years and over is not shown as the estimated number of employees in this cohort is unreliable.
Common causes of serious claimsBody stressing was the most common cause of claims in the Manufacturing industry in 2007–08p, accounting for 43% of all claims, including 19% of claims in Muscular stress while lifting, carrying, or putting down objects and 16% of claims in Muscular stress while handling objects other than lifting, carrying or putting down. Other common causes were Falls on the same level (9%) and Being hit by moving objects (6%). These proportions were broadly consistent across the subdivisions within the Manufacturing industry.
64 ... Safe Work Australia

Part D: Priority industry profiles: Manufacturing
Common types of injury and diseaseIn 2007–08p, 71% of serious claims in the Manufacturing industry were injury-related, including the most common type of injury leading to a serious claim, Sprains & strains of joints & adjacent muscles (36% ofall serious claims), and Open wound not involving traumatic amputation (12%). The most common type of disease leading to a claim was Disorders of muscle, tendons & other soft tissues (8%) followed by Dorsopathies – disorders of the spinal vertebrae & intervertebral discs (6%) and Deafness (5%). These proportions were broadly consistent across the industry subdivisions. Unsurprisingly, however, Asbestosis, which comprised 0.3% of serious claims across the Manufacturing industry, accounted for 4% of claims in the Non-metallic mineral product manufacturing subdivision, principally in the Cement, lime, plaster & concrete product manufacturing group.
Common breakdown agenciesThe breakdown agency most commonly associated with serious claims in the Manufacturing industry in 2007–08p was Other materials and objects, representing 18% of claims. Nearly half (47%) of these claims involved Ferrous and non-ferrous metal which includes pipes and other metal objects other than tools and machinery. In the Metal product manufacturing subdivision, Ferrous & non-ferrous metal was responsible for 21% of serious claims. A further 9% involved Fastening, packing & packaging equipment, including Crates, cartons, boxes, cases, drums, kegs, barrels, cans, which alone were the breakdown agency in 5% of serious claims in the industry.
These were however some differences to these proportions for the subdivisions within the Manufacturing industry. In the Food, beverage & tobacco manufacturing subdivision Knives & cutlery were responsible for9% of serious claims, three times the industry average. In addition, Non- living animals were involved in 9% of serious claims in this subdivision, compared with 2% for all groups.
In the Printing, publishing & recording media subdivision, Crushing, pressing, rolling machinery was involved in 11% of serious claims compared with 2% industry-wide, including, unsurprisingly, Printing machinery which accounted for 8%.
In the Wood & paper product manufacturing subdivision Sawn or dressed timber caused 20% of serious claims compared to the industry averageof 3%. In addition, Cutting, slicing, sawing machinery, particularly Circular saws (2%) and Other powered saws (3%), caused 8% of serious claims, more than double the industry average.
It is unsurprising that Furniture & fittings accounted for 13% of serious claims in the Other manufacturing subdivision which includes the manufacture of furniture. The industry average for this agency was 4%. Similarly in the Non-metallic mineral product manufacturing subdivision, Non-metallic minerals & substances accounted for 16% of claims compared to 1% for the whole industry. In particular, Bricks accounted for 8% of claims in this subdivision compared to only 1% for the whole industry.
Compendium of Workers’ Compensation Statistics Australia 2007–08 ... 65

1 710 1 850 1 935 1 850 1 975 1 850 16%
32.6 35.9 41.3 33.6 40.7 34.4 25%
Changes in characteristics of serious claims over timeAs the 2007–08p data are preliminary, time series comparisons extend only to 2006–07. Table 31 shows that over the five-year period between2002–03 and 2006–07, the incidence rate decreased 6% from 28.5 claims per 1000 employees to 26.7, less than the 15% decrease in the incidence rate for all industries. The incidence rate for the Manufacturing industry in2006–07 was nearly double the rate for all industries (26.7 compared to14.1 claims per 1000 employees for all industries).
Table 31 Manufacturing industry: serious claims and incidence rate by industry subdivision and selected industry groups, 2002–03 to 2007–08pIndustry subdivision & group 2002–03 2003–04 2004–05 2005–06 2006–07 2007–08p % changea
Number of serious claimsFood, beverage & tobacco manufacturing 7 765 7 065 7 170 6 855 6 955 6 360 -10%
Meat & meat product manufacturing 3 785 3 280 3 230 3 225 3 390 3 155 -10%
Textile, clothing, footwear & leathermanufacturing 1 100 1 015 860 725 630 550 -43%
Wood & paper product manufacturing 2 455 2 435 2 380 2 205 2 145 2 160 -13%
Printing, publishing & recorded media 1 205 1 195 1 185 1 100 1 045 950 -13%
Petroleum, coal, chemical & associatedproduct manufacturing 2 130 2 080 2 030 1 915 1 960 1 840 -8%
Non-metallic mineral productmanufacturing 1 385 1 350 1 290 1 230 1 175 1 150 -15%
Metal product manufacturing 5 330 5 365 5 345 5 385 5 180 4 765 -3%
Fabricated metal product manufacturing 1 735 1 700 1 660 1 675 1 700 1 525 -2%
Iron & steel manufacturing 805 740 690 730 695 720 -13%
Structural metal product manufacturing 1 360 1 400 1 420 1 500 1 515 1 440 11%
Machinery & equipment manufacturing 5 665 5 730 5 795 5 455 5 355 4 960 -5%
Industrial machinery & equipment manufacturing
Motor vehicle & part manufacturing 1 885 2 015 2 025 1 895 1 720 1 445 -9%
Other manufacturing 1 940 2 060 2 120 1 715 1 745 1 580 -10%
Manufacturing 28 980 28 295 28 175 26 585 26 185 24 315 -10%
Incidence rate (serious claims per 1000 employees)Food, beverage & tobacco manufacturing 42.6 41.2 35.0 37.1 35.8 30.7 -16%
Meat & meat product manufacturing 76.5 67.0 55.4 63.9 59.0 53.1 -23%
Textile, clothing, footwear & leathermanufacturing 18.1 18.4 17.2 15.7 14.7 13.5 -19%
Wood & paper product manufacturing 36.2 33.0 34.6 33.3 31.9 35.1 -12%
Printing, publishing & recorded media 11.4 11.7 11.1 10.4 9.3 8.8 -19%
Petroleum, coal, chemical & associatedproduct manufacturing 19.0 20.5 20.4 21.1 21.0 18.0 11%
Non-metallic mineral productmanufacturing 33.8 33.1 40.1 34.6 34.8 28.2 3%
Metal product manufacturing 34.8 35.9 38.3 33.8 32.4 30.4 -7%
Fabricated metal product manufacturing 38.8 38.3 54.8 47.0 41.0 40.3 6%
Iron & steel manufacturing 23.0 22.9 16.4 14.7 15.0 14.9 -35%
Structural metal product manufacturing 46.8 45.6 55.6 52.4 62.9 54.7 35%
Machinery & equipment manufacturing 24.4 25.8 25.4 24.0 24.0 21.2 -2%
Industrial machinery & equipment manufacturing
Motor vehicle & part manufacturing 23.3 26.6 26.1 23.6 23.4 21.5 0%
Other manufacturing 32.0 31.6 34.1 30.5 32.7 26.8 2%
Manufacturing 28.5 28.8 28.4 27.3 26.7 24.1 -6%
a Percentage change from 2002–03 to 2006–07 due to potential volatility of the preliminary data for 2007–08.
66 ... Safe Work Australia

Part D: Priority industry profiles: Manufacturing
Between 2002–03 and 2006–07, six of the industry’s subdivisions experienced a decrease in incidence rates, while three increased. At the subdivision level, the most pronounced decreases were in the Textile, clothing, footwear & leather manufacturing (19%); Printing, publishing & recorded media (18%); and Food, beverage & tobacco manufacturing (16%) subdivisions.
The largest percentage increase in incidence rates was 11% inthe Petroleum, coal, chemical & associated product manufacturing subdivision, rising from 19.0 to 21.0 serious claims per 1000 employees over the five-year period.
Although there was a 2% increase from 32.0 to 32.7 in the Other manufacturing subdivision (which manufactures goods such as prefabricated building materials, furniture, jewellery, toys and sporting goods), the incidence rate in the Other manufacturing group (which manufactures goods such as jewellery, toys and sporting goods) decreased by 17%. Since its peak at 92.6 serious claims per 1000 employees in 2004–05 this group has shown a dramatic 30% decline.
Within the Machinery & equipment manufacturing subdivision, where the incidence rate declined by 2%, in the Electronic equipment manufacturing group, the rate fell by 32% over the same period. Similarly, the incidence rate in the Meat & meat product manufacturing group fell by 23%, more than the decrease of 16% in the Food, beverage & tobacco manufacturing subdivision.
On the other hand, while there was a 7% decrease in the incidence rate in the Metal product manufacturing subdivision, two of its component groups experienced marked increases – 35% in Structural metal product manufacturing and 23% in the Sheet metal product manufacturing group. Although this group has experienced the highest rates throughout the period, standing at 94.3 serious claims per 1000 employees in 2006–07, this still represents a dramatic decrease from the 2004–05 high of 148.6.
Payments made and duration of serious claimsFigure 38 shows that median time lost from work in the Manufacturing industry division fell from 3.4 working weeks in 2002–03 to 3.0 in 2003–04, rising to 3.2 in 2005–06, where it remained in 2006–07. While this issimilar to the pattern of median time lost across all industry divisions, the median time lost has remained below the average and experienced a larger decrease over the five years.
Median time lost in most of the Manufacturing subdivisions was near the division average in 2006–07, but it was a full week longer, 4.2 weeks,in the Petroleum, coal, chemical & associated product manufacturing subdivision and 4.0 weeks in the Printing, publishing & recorded media subdivision. Both of these subdivisions recorded increases in time lost over the period. The largest fall was recorded by the Textile, clothing, footwear & leather manufacturing subdivision which fell from 4.0 to 3.0 weeks, followed by the Non-metallic mineral product manufacturing subdivision which fell from 3.6 to 3.0 weeks.
Compendium of Workers’ Compensation Statistics Australia 2007–08 ... 67

2002–03 2003–04 2004–05 2005–06 2006–07
Manufacturing 3.4 3.0 3.0 3.2 3.2
All claims 4.0 3.7 3.6 3.8 3.9
2002–03 2003–04 2004–05 2005–06 2006–07
Manufacturing 4900 5300 5400 5600 5800
All claims 4900 5200 5300 5600 5800
Med
ian
time
lost
(wee
ks)
Med
ian
cost
($)
Figure 38 Manufacturing industry: median time lost from work, 2002–03 to2006–07
5
4
3
2
1
0
The median payment increased 18% from $4900 to $5800 for claims in the Manufacturing industry between 2002–03 and 2006–07, the same as the all industry rise (Figure 39). The highest median cost ($7500) was recorded by the Petroleum, coal, chemical & associated productmanufacturing subdivision with the lowest recorded by the Food, beverage& tobacco manufacturing subdivision ($4100). Increases in median costs were recorded in all but two of the subdivisions: Non-metallic mineral product manufacturing fell from $8500 to $6600 over the period and Textile, clothing, footwear & leather manufacturing fell from $6600 to$6200. These falls mirror the falls in time off work.
Factors influencing the payments made include the employee’s salary level, the length of absence from work and medical expenses.
Figure 39 Manufacturing industry: median payment, 2002–03 to 2006–076000
4000
2000
0
Compensated fatalitiesTable 32 shows the number of compensated fatalities in the Manufacturing industry has increased from a low of 32 in 2002–03 peaking at 42 in 2004–05 then declining to 37 in 2006–07. The preliminary data for 2007–08 show 25 fatalities compensated so far.
Although the Manufacturing industry experienced the third highest number of compensated fatalities over the period and in each individual year,the large number employed in the industry means that the incidence rate of 2.5 compensated fatalities per 100 000 employees in 2007–08p ranked sixth, just above the all industries rate of 2.4. Like the number of compensated deaths, the incidence rate in the Manufacturing industry peaked at 4.2 compensated fatalities per 100 000 employees in 2004–05 and has fallen since then to be 3.8 in 2006–07.
68 ... Safe Work Australia

Part D: Priority industry profiles: Manufacturing
Characteristics of compensated fatalitiesTo produce a more robust analysis of fatality characteristics, data from the three-year period 2005–06 to 2007–08p were aggregated for the following analysis.
There were 102 compensated fatalities within the industry between2005–06 and 2007–08p, more than half (52%) of which occurred in threeof the nine subdivisions: Machinery & equipment manufacturing (18); Food, beverage & tobacco manufacturing (18); and Non-metallic mineral product manufacturing (17). There were no compensated fatalities at all over the three-year period in Textile, clothing, footwear & leather manufacturing and one in Printing, publishing & recorded media.
Table 32 Manufacturing industry: compensated fatalities and fatality incidence rate by industry subdivision, 2002–03 to 2007–08pIndustry subdivision 2002–03 2003–04 2004–05 2005–06 2006–07 2007–08p
Number of compensated fatalitiesFood, beverage & tobacco manufacturing 6 4 8 7 6 5Textile, clothing, footwear & leather
manufacturing 0 0 0 0 0 0
Wood & paper product manufacturing 4 2 2 0 7 3
Log sawmilling 2 1 0 0 2 2
Printing, publishing & recorded media 1 1 1 1 0 0
Petroleum, coal, chemical & associated productmanufacturing 2 5 3 5 2 3
Non-metallic mineral product manufacturing 6 4 5 7 5 5
Concrete slurry manufacturing 0 1 1 1 1 3
Non-metallic mineral product manufacturingn.e.c.. 4 1 1 2 2 1
Metal product manufacturing 6 5 13 5 5 5
Fabricated metal product manufacturing n.e.c.. 2 2 4 1 1 1
Machinery & equipment manufacturing 5 9 6 5 11 2
Other manufacturing 2 5 4 10 1 2
Manufacturing n.e.c.. 1 4 1 10 1 0
Manufacturing 32 35 42 40 37 25
Incidence rate (compensated fatalities per 100 000 employees)Manufacturing 3.2 3.6 4.2 4.1 3.8 2.5
At the class level of the industry classification the highest number of compensated fatalities, 11, were paid to the Manufacturing n.e.c class. This class manufactures musical instruments, pens, staplers, and brushes. There were 5 compensated fatalities in each of Concrete slurry manufacturing and Non-metallic mineral product manufacturing n.e.c.,the industry class that includes the manufacture of bricks, tiles, insulation and stone products. Another 4 fatalities were compensated in the Log sawmilling industry class.
Of the 102 compensated fatalities in the Manufacturing industry between2005–06 and 2007–08p, 23 were due to Long term contact with chemicals or other substances (exposure to asbestos in 20 of the 23 cases). Afurther 18 involved a Vehicle accident. Being hit by moving objects caused13 of the compensated fatalities and Being hit by falling objects, 11.
Injury & poisoning was responsible for 70% of all compensated fatalities in the Manufacturing industry over the three-year period, with Multiple
Compendium of Workers’ Compensation Statistics Australia 2007–08 ... 69

injuries accounting for nearly one-third (32% — 32 of 102). Malignant neoplasm of pleura (mesothelioma) was responsible for 14 compensated fatalities and Asbestosis for seven. Internal injury of chest, abdomen& pelvis caused 8% of the fatalities. As is stated elsewhere in this publication, compensated fatalities dramatically underestimate the actual number of work-related fatalities due to exposure to asbestos. A more comprehensive source of information is the report Mesothelioma in Australia (http://www.safeworkaustralia.gov.au/NR/rdonlyres/6BFF2004-8889-4978-97EB-EF648BA0C005/0/Annual_Meso_Report2009.pdf).
Consistent with the Mechanism and Nature of injury or disease, Asbestos was the breakdown agency in 20 of the compensated fatalities, followed by Trucks, semi-trailers, lorries and Cars, station wagons, vans, utilities, which were the Breakdown agencies in nine and eight, respectively.
Figure 40 shows that fatality rates for individual age groups ranged between 2.0 and 3.1 compensated fatalities per 100 000 employees for employees aged below 55 but the rate was 9.0 fatalities per 100 000 employees for employees aged 55 years & over, bringing the fatalityrate for the three-year period for the industry to 3.4. One major cause for this high fatality rate of employees aged 55 years & over was exposureto asbestos, which accounted for 14 of the 36 compensated fatalities in this age group. The long latency of the diseases arising from asbestos exposure means that the dates on which claims are lodged do not relate well to the age of initial exposure. Most jurisdictions use Date ofclaim lodgement to determine employee age when incidents occur. This provides accurate data for the majority of fatalities where the interval between the incident causing the injury or illness and death is short but leads to inflated incidence rates in the older age groups for diseases with slow onset.Figure 40 Manufacturing industry: fatality incidence rate by age, years 2005–06 to 2007–08p combined
Manufacturing 3.4
15–24 years
25–34 years
35–44 years
45–54 years
55 years and over
2.0
3.1
2.9
2.1
9.0
0 2 4 6 8 10
Compensated fatalities per 100 000 employees
70 ... Safe Work Australia

Mining
OverviewThe Mining industry employed 146 000 people in 2007–08, 1% of employed persons in Australia. The following workers’ compensation statistics relate to the 99% of workers in this industry division classified as employees in that year (i.e. excluding self-employed workers).
The preliminary data for 2007–08p show there were 2 480 serious workers’ compensation claims in the Mining industry, 2% of serious claims across all industries. This equates to seven serious claims per day or 17.8 serious claims per 1000 employees. This incidence rate isthe fifth highest of all industries, and 32% higher than the national rate of13.5 serious claims per 1000 employees.
Characteristics of serious claims in the preliminary data
Industry profileWithin the Mining industry, although 37% of the employees worked in the Metal ore mining industry group, they lodged only 27% of serious workers’ compensation claims in the industry division as a whole. Conversely, the Coal mining group employed 21% of the employees and lodged 29% of the serious claims. Of all serious claims lodged,28% were from employees in the Black coal mining industry class. Figure 41 compares the proportion of serious claims to the proportion of employees in each group in the Mining industry.
Table 33 shows that the highest incidence rate of serious claims in the Mining industry in 2007-08p (55.4 serious claims per 1000 workers) was in the Mining n.e.c. group, the residual category that includes mining for gemstones and some other minerals. Although this group only accounted for 2% of employees in the Mining industry, it recordedthe highest or near the highest incidence rate in all six years. The small number of employees, however, results in considerable volatility in incidence rates over time and should be treated with caution. Employees in the Oil & gas extraction group experienced the lowest incidence rateof 9.4 serious claims per 1000 employees.
Compendium of Workers’ Compensation Statistics Australia 2007–08 ... 71

Figure 41 Mining industry: proportion of employees and serious claims by industry group, 2007–08p
Metal ore mining
Coal mining
Exploration
Other mining services
Oil & gas extraction
Construction material miningEmployeesSerious claims
Other mining
0 5 10 15 20 25 30 35 40
Percentage of employees/serious claims
OccupationNearly one-quarter of all serious claims were lodged by employees classified by occupation as Miners (24%). Mining support workers & drillers assistants lodged 14% of the claims; Metal fitters & machinists,10%; and Drillers and Truck drivers, each 6%.
Sex and ageOnly 14% of all employees in the Mining industry in 2007–08p were female, the lowest proportion of any industry division apart from Construction. The female employees lodged only 4% of the serious claims in the Mining industry, resulting in an incidence rate of 5.0 serious claims per 1000 female employees, well below the rate of 20.1 per 1000 male employees, as shown in Figure 42. The highest incidence rate (11.4) occurred among women in the 45–54 years age group, the same group that experienced the lowest incidence rate among men (18.6) in the industry. Caution should be used in interpreting the data for female employees due to the very small number of claims involved.
According to the 2006 Census, although 5% of female employees in the Mining industry were employed as Miners and 4% as Truck drivers, 82% were employed in clerical, professional and administrative occupations.
Figure 42 Mining industry: incidence rate by sex and age, 2007–08p
Females 5.0 Males 20.1 Females Males
15–24 years
25–34 years
35–44 years
45–54 years
55 years & over
5.6
2.6
6.1
11.4
**
23.4
19.7
18.6
18.6
24.9
0 5 10 15 20 25
Serious claims per 1000 employees
** An incidence rate for females aged 65 years and over is not shown as the estimated number of employees in this cohort is unreliable.
72 ... Safe Work Australia

Part D: Priority industry profiles: Mining
Common causes of serious claimsThe most common cause of serious claims in the Mining industry in 2007–08p was Muscular stress while handling objects other than lifting, carrying or putting down, which caused 16% of all serious claims. Falls on the same level caused 15%; Muscular stress while lifting, carrying, or putting down objects 10%; Long term exposure to sounds, 9%; and Falls from a height,7%.
There were generally similar proportions across most groups within this industry in 2007–08p, although there were differences. Muscular stress while handling objects other than lifting, carrying or putting down was responsible for 18% of claims lodged by employees in Exploration and Oil & gas extraction, but only 12% in Construction material mining. In theCoal mining group, Falls on the same level caused 19% of serious claims and Long term exposure to sounds, 13%, while in Exploration, these mechanisms accounted for 10% and less than 1%, respectively.
Common types of injury and diseaseIn 2007–08p, 81% of serious claims in the Mining industry arose from Injury & poisoning, with Sprains & strains of joints & adjacent muscles alone causing 48% of all serious claims in the industry and Fractures another 12%. The most common disease claims arose from Deafness, which caused 8% of all serious claims.
The overall pattern of injury and disease was fairly consistent across industry groups within the Mining industry in 2007–08p. But while the highest proportion of Sprains & strains of joints & adjacent muscles claims was in Coal mining (56%), Coal mining employees also lodged the lowest proportion of Fractures claims (9%). Fractures caused 19% of claims inthe Exploration industry group, but while 13% of Coal mining claims and12% of Metal ore mining claims were for Deafness, in Exploration, there were none.
Common breakdown agenciesNo particular breakdown agency or group of breakdown agencies stands out among the serious claims in this industry in 2007–08p. Ferrous & non- ferrous metal, the category that includes metal pipes, bars and girders, was involved in 12% of claims in Exploration. Oil, gas & water drillingrigs led to 13% of serious claims in Exploration and 10% in Oil & gas extraction. In Coal mining, Integrated mining plant was responsible for 5% of claims, and Roof bolting machines for 3%, but other than these, mining equipment and other heavy machinery played a surprisingly small role in Mining industry compensation claims.
Changes in characteristics of serious claims over timeTable 33 shows that the incidence rate of serious claims in the Mining industry fell 26% from 27.4 serious claims per 1000 employees in 2002–03 to 20.3 in 2006–07, the second highest decrease in any industry division and well above the 15% fall in incidence rate for all industries.
The most dramatic improvement in incidence rates over the five years was in the Oil & gas extraction group, where it fell by 61% from 21.1
Compendium of Workers’ Compensation Statistics Australia 2007–08 ... 73

to 8.3 serious claims per 1000 employees. Other mining services, the industry group that provides some contract services to mining, oil and gas operations, also recorded a fall of more than half, declining from 78.9 to38.1 serious claims per 1000 employees.
Incidence rates for industry groups lodging relatively few serious claims or employing smaller numbers should be interpreted with caution as random annual fluctuations in claim numbers can lead to dramatic shifts in incidence rates.
Table 33 Mining industry: serious claims and incidence rate by industry subdivision and group, 2002–03 to 2007–08pIndustry subdivision & group 2002–03 2003–04 2004–05 2005–06 2006–07 2007–08p % changea
Number of serious claimsCoal mining 775 835 785 795 910 720 17%
Oil & gas extraction 85 80 85 80 90 110 6%
Metal ore mining 760 665 645 610 650 665 -14%
Other mining 290 405 460 380 395 330 36%
Construction material mining 195 235 275 250 275 210 41%
Mining n.e.c. 95 170 185 130 115 120 21%
Services to mining 360 380 445 525 570 655 58%
Exploration 85 105 145 165 185 255 118%
Other mining services 280 280 300 360 385 395 38%
Mining 2275 2365 2420 2390 2615 2480 15%
Incidence rate (serious claims per 1000 employees)Coal mining 37.9 39.5 31.8 25.4 30.5 24.1 -20%
Oil & gas extraction 21.1 12.7 11.8 7.8 8.3 9.4 -61%
Metal ore mining 21.7 17.6 16.6 13.3 13.0 13.1 -40%
Other mining 35.1 51.5 43.2 35.8 37.9 31.7 8%
Construction material mining 36.9 45.3 53.0 36.1 37.3 25.4 1%
Mining n.e.c. *31.8 *63.6 33.8 35.2 39.4 55.4 24%
Services to mining 24.3 21.1 23.7 21.3 20.4 18.0 -16%
Exploration 7.4 7.8 10.8 10.9 10.3 11.1 40%
Other mining services 79.5 58.3 57.1 37.5 38.1 30.0 -52%
Mining 27.5 26.0 24.2 19.4 20.3 17.8 -26%
a Percentage change from 2002–03 to 2006–07 due to potential volatility of the preliminary data for 2007–08.
Payments made and duration of serious claimsFigure 43 shows that between 2002–03 and 2006–07, the median time lost from work for serious claims in the Mining industry increased by 40% from 3.0 weeks to 4.2 weeks. In contrast, the median time lost across all industries remained relatively stable decreasing only slightly from 4.0 in2002-03 to 3.9 weeks in 2006–07. Although median time lost was highest in the Exploration group in three of the five years, it is the only groupwhere the time lost decreased over the period, from 7.3 weeks in 2002–03 to 6.1 in 2007–08. In Metal ore mining, in contrast, median time lost increased by 75% from 2.3 to 4.0 weeks.
74 ... Safe Work Australia

2002–03 2003–04 2004–05 2005–06 2006–07
Mining 3.0 3.8 3.6 3.8 4.2
All industries 4.0 3.7 3.6 3.8 3.9
Med
ian
cost
($)
Med
ian
time
lost
(wee
ks)
Part D: Priority industry profiles: Mining
Figure 43 Mining industry: median time lost from work, 2002–03 to 2006–07
5
4
3
2
1
0
Over the same period, the median payment increased 29% from $9900 to$12 800 for serious claims in the Mining industry as a whole, more than double the 14% increase recorded for all serious claims (Figure 44). The35% increase in median cost in Coal mining is roughly consistent with the32% increase in time lost over the period. But median cost per serious claim in Metal ore mining only increased by 27%, barely one-third the increase in time lost in that industry group.
Figure 44 Mining industry: median payment, 2002–03 to 2006–0716 000
12 000
8 000
4 000
2002–03 2003–04 2004–05 2005–06 2006–07
Mining 9 900 11 100 10 900 10 800 12 800
All industries 4 900 5 200 5 300 5 600 5 800
Factors influencing the payments made include employees’ wages in the industry, the length of absence from work and medical expenses. Longer median periods off work for serious claims combined with the typically high wages paid mean that Mining has experienced the highest median cost of any industry over the entire period 2003–03 to 2006–07, as well as in the preliminary 2007–08 data.
Compensated fatalitiesTable 34 shows that the number of compensated fatalities has variedfrom year to year from a high of 15 in 2005–06 down to seven in 2004–05 and 2006–07. The preliminary data for 2007–08 show seven fatalities compensated so far.
Compendium of Workers’ Compensation Statistics Australia 2007–08 ... 75

Table 34 Mining industry: compensated fatalities and fatality incidence rate by industry subdivision and group, 2002–03 to 2007–08pIndustry subdivision and group 2002–03 2003–04 2004–05 2005–06 2006–07 2007–08p
Number of compensated fatalitiesCoal mining 0 2 0 3 0 0
Oil & gas extraction 0 0 0 0 0 0
Other mining 6 2 4 5 2 2
Construction material mining 3 2 1 4 1 1
Mining n.e.c. 2 2 1 2 1 1
Services to mining 1 0 0 2 0 0
Exploration 4 2 2 3 4 4
Other mining services 0 0 0 1 2 0
Mining 13 8 7 15 7 7
Incidence rate (compensated fatalities per 100 000 employees)Mining 15.7 8.8 7.0 12.2 5.4 5.0
Because the number of employees employed in the Mining industry has increased by 66% over the six-year period, the compensated fatality incidence rate has declined from 15.7 compensated fatalities per 100 000 employees in 2002–03 to 5.4 in 2006–07, with a spike of 12.2 in 2005–06. In 2007–08p, the compensated fatality incidence rate in the Mining industry stood at 5.0, the fourth highest rate of all industries and a little more than double the rate for all industries of 2.4 fatalities per 100 000 employees.
Characteristics of compensated fatalitiesIn order to produce a more robust analysis of compensated fatality characteristics, data from the five-year period, 2003–04 to 2007–08p are aggregated for the following analysis. Table 34 shows that the number of compensated fatalities in the Mining industry has been steady at seven or eight between 2003–04 and 2007–08 apart from a spike to 15 in 2005–06, bringing the total over the five year period to 44, all of whom were men.
More than three-quarters (77%) of these were in three industry groups: 15 in Metal ore mining, including five in Gold ore mining and four in Copper ore mining; 12 in Other mining services; and seven in Construction materials mining. All five of the Coal mining fatalities were in Black coal mining.
During the period 2003–04 to 2007–08p, Vehicle accident was the most common specific cause of fatality in the Mining industry, accounting for 13 (30%) of the 44 compensated fatalities, including two involving Passenger aircraft. A further six fatalities were due to Being hit by moving objects and five each from Long term contact with chemicals or substances and Slide or cave-in. While all five fatalities due to Long term contact with chemicals or substances had asbestos or other dust identified as the substance, workers’ compensation statistics are known to not capture all suchdeaths. More comprehensive information can be found in Mesothelioma inAustralia on the Safe Work Australia website.
Injury & poisoning was responsible for 36 of the 44 compensated fatalities (82%), principally Multiple injuries (17) and Other & unspecified injuries (7). Apart from these, the most common fatal injuries were Fractures,
76 ... Safe Work Australia
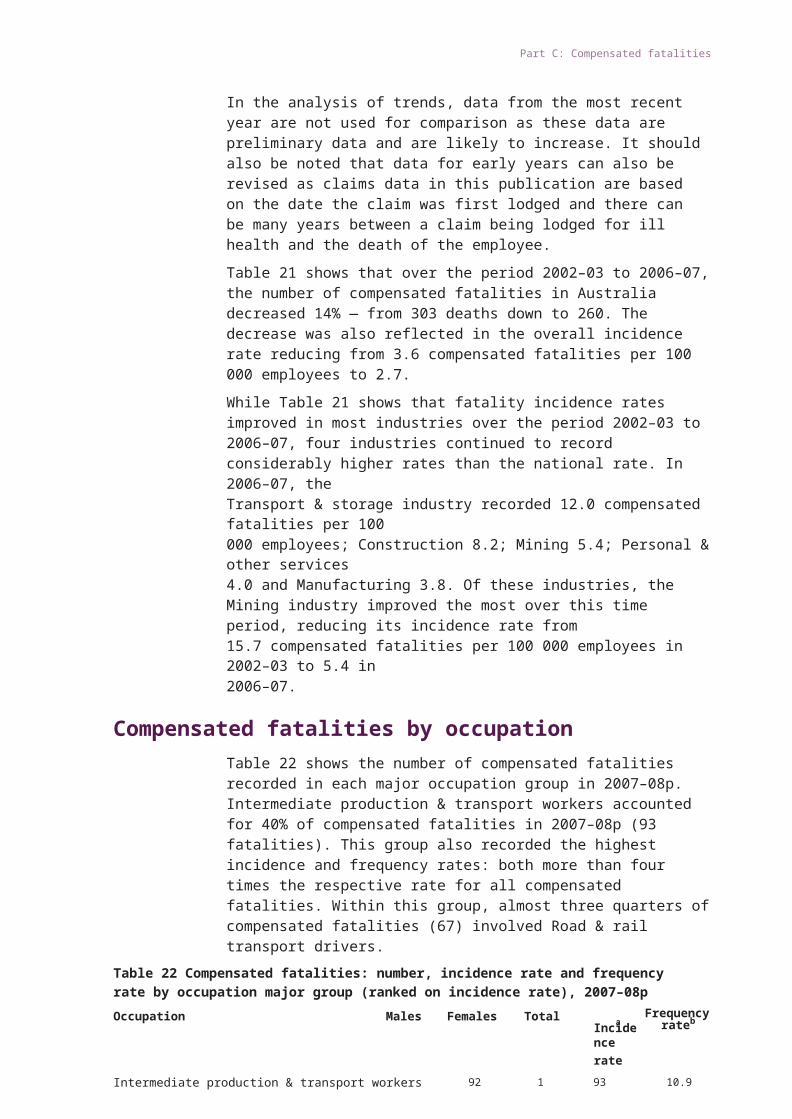
Part D: Priority industry profiles: Mining
Internal injury of chest, abdomen & pelvis and Intracranial injury, including concussion, each of which was responsible for three of the compensated fatalities.
The most common specific breakdown agency, Trucks, semi-trailers, lorries, was responsible for eight of the compensated fatalities and Cars, station wagons, vans, utilities were responsible for another four.
Figure 45 shows the fatality incidence rate for each age group over the five-year period 2003–04 to 2007–08p. As all fatalities compensated in the Mining industry over this period were men, the incidence rates are calculated per 100 000 male employees. While the highest numbersof compensated fatality claims were lodged for male employees aged35–44 years (13) and 25–34 years (11), the highest fatality incidence rates were among male employees aged 15–24 years who suffered 14.3 compensated fatalities per 100 000 male employees and aged 55 years and over (12.3 compensated fatalities per 100 000 male employees).Figure 45 Mining industry: male compensated fatality incidence rate by age group, 2003–04 to 2007–08p combined
Mining 8.8
15–24 years
25–34 years
35–44 years
45–54 years
55 years and over
14.2
8.9
8.6
5.5
12.1
0 2 4 6 8 10 12 14
Compensated fatalities per 100 000 male employees
Compendium of Workers’ Compensation Statistics Australia 2007–08 ... 77

Transport & storage
OverviewThe Transport & storage industry employed 499 000 people in Australia in 2007–08, 5% of the Australian workforce. The following workers’ compensation statistics relate to the 88% of workers in this industry who were classified as employees in that year (i.e. excluding self-employed workers). Caution should be exercised in using these data to represent workers in this industry who are not employees. Information on injuries incurred by all workers in this industry can be found in a report entitled Work-related injuries in Australia: Transport and storage industry which can be found on the Safe Work Australia website.
The preliminary data for 2007–08 show there were 10 990 serious workers’ compensation claims in the Transport & storage industry, 8%of claims across all industries. This equates to 30 claims per day or 24.4 serious claims per 1000 employees, the highest incidence rate of all industries in 2007–08p and nearly twice the national rate of 13.5 serious claims per 1000 employees.
Characteristics of serious claims in the preliminary data
Industry profileWithin the Transport & storage industry division, the largest proportion of employees (29%) and the largest proportion of serious claims (40%) were both in the Road freight transport group. Although the proportion of claims in this group was much higher than the proportion of employees, the incidence rate (33.0 serious claims per 1000 employees) was only the third highest in the Transport & storage industry as a whole, trailingServices to water transport (39.8 serious claims per 1000 employees) and Services to road transport (36.1 serious claims per 1000 employees)(see Figure 46).
Figure 46 Transport & storage industry: proportion of employees and serious claims by industry group, 2007–08p
In contrast, in Other services to transport, the group that includes travelRoad freight transport
Rail transport
Storage
Road passenger transport
Air & space transport
Other services to transport
Services to water transport
Other transport
Water transport
Services to road transport
Services to air transport
Employees
Serious claims
0 10 20 30 40
Percentage of employees/serious claims
78 ... Safe Work Australia

Part D: Priority industry profiles: Transport & storage
and customs agency services, there was a much smaller proportion of serious claims (7%) the proportion of employees (12%), to record an incidence rate of 12.9 serious claims per 1000 employees, second lowest in the industry, after Services to air transport, the group providing airport and navigation services, where the incidence rate was 10.3 serious claims per 1000 employees.
Sex and ageWhile female employees represented 25% of the employees in the Transport & storage industry in 2007–08p, they lodged only 10% of the serious claims, resulting in a much lower incidence rate than among male employees (10.0 serious claims per 1000 female employees compared with 29.4 serious claims per 1000 male employees).
Figure 47 shows that in 2007–08p incidence rates for male employees rose with age from 21.3 serious claims per 1000 male employees aged15–24 years to 32.9 serious claims per 1000 male employees aged 55–64 years. Although the incidence rate for employees aged 65 years andover was lower than for most age groups, this should be interpreted with caution due to the small number of men still at work in this industry after reaching 65 years (3%).
Incidence rates for female employees also increased with age, from6.0 serious claims per 1000 female employees aged 15–24 years to15.0 serious claims for female employees aged 45–54 years before falling slightly for females aged 55–64 years.
It is worth noting that 65% of the serious claims in Transport & storage were lodged by Intermediate production & transport workers, 31% among Truck drivers alone, by far the highest proportion of any single occupation unit group. According to the 2006 Census, the most recent available detailed occupation data, only 5% of Intermediate production & transport workers, and just 1% of Truck drivers, were women.Figure 47 Transport & storage industry: incidence rate by sex and age,2007–08p
Females 10.0 Males 29.4 Females Males
15–24 years
25–34 years
35–44 years
45–54 years
55–64 years
65 years and over
6.0
7.0
11.3
15.0
12.2
**
21.3
27.4
30.5
31.1
32.9
24.6
0 10 20 30
Serious claims per 1000 employees
** An incidence rate for women aged 65 years and over is not shown as the estimated number of employees in this cohort is unreliable.
Common causes of serious claimsBody stressing was the most common cause of serious claims in the Transport & storage industry in 2007–08p, accounting for 41% of all serous claims. Muscular stress while lifting, carrying or putting down
Compendium of Workers’ Compensation Statistics Australia 2007–08 ... 79
objects had the largest representation in the Body stressing group, with20% of all serious claims, followed by Muscular stress while handling objects other than lifting, carrying or putting down, with 15% of all claims.
Other common causes were Falls on the same level (11%) and Falls from a height (9%). A higher proportion of serious claims in this industry involved Vehicle accident (7%) compared with all industries (2% of claims).
There was considerable variation across the groups in the Transport& storage industry. Serious Body stressing claims in the Air & space transport (63%) and Storage groups (59%) far exceeded the industry average of 41%. The proportion of serious claims due to Vehicle accident was higher in Rail transport (11%) and Road transport (10%) than the industry average of 7%. Employees in Rail transport and Services to water transport lodged higher proportions of claims (10% and 7%, respectively) due to Long term exposure to sounds than the Transport & storageindustry average of 3%.
Common types of injury and diseaseIn 2007–08p, 74% of serious claims in the Transport & storage industry arose from Injury & poisoning, including Sprains and strains of joints and adjacent muscles, which were involved in 45% of serious claims in the industry, Fractures (9%), and Contusion with intact skin surface & crushing injury excluding those with fracture (8%).
The most common diseases leading to a serious claim involved Dorsopathies - disorders of the spinal vertebrae & intervertebral discs and Disorders of muscle, tendons & other soft tissues accounting for 7% and 6% of serious claims, respectively. Mental disorders accounted for a further 5% of serious claims.
Employees in the Rail transport group lodged a much higher proportion of serious claims for Mental disorders (23% of serious claims) and for Deafness (10%), as well as the lowest proportion for Sprains and strains of joints and adjacent muscles (38%). The Mental disorders claims in Rail transport were the result of Vehicle accident (39% of these claims) and Exposure to a traumatic event (20%), with 22% attributed to Other mental stress factors.
Common breakdown agenciesRoad transport was responsible for the greatest proportion of serious claims in the Transport & storage industry (18% of claims) followedby Fastening, packing and packaging equipment (17% of claims) and Outdoor environment (9% of claims). However, considerable differences occur at the industry group level.
In the largest subdivision, Road transport, the most common breakdown agency was Road transport (29%), including Trucks, semi-trailers, lorries (21%). Similarly, Trucks, semi-trailers, lorries were responsible for 26%of the serious claims in the Road freight transport group, 81% of claims for this breakdown agency; and Buses, trolleybuses, minibuses for 20% and Cars, station wagons, vans, utilities for 9% in the Road passenger transport group. Of all serious claims in the Transport & storage industry division attributed to Buses, trolleybuses, minibuses, 96% were lodged by employees in the Road passenger transport group.
80 ... Safe Work Australia

Part D: Priority industry profiles: Transport & storage
Similarly, in the Rail transport group, Rail transport was the breakdown agency in 19% of serious claims, including Trains (13%) and Locomotives (5%), in comparison to 2% for the industry as a whole. Other person was the breakdown agency in 15% of serious claims in the Rail transport group and 13% in Road passenger transport, compared with 4% of all serious claims in the Transport & storage division. Many of these claims (43%) resulted in Mental disorders.
The highest proportion of serious claims (40%) due to Fastening, packing and packaging equipment was in the Storage group. Three-quarters of these claims involved Crates, cartons, boxes, cases, drums, kegs, barrels, cans. Conveyors and lifting equipment accounted for the next highest proportion of serious claims (9%) in this group.
A high proportion of serious claims in Air & space transport were due to Fastening, packing and packaging equipment (37%), including Bags, bundles & bales (28%) — 60% of all serious claims lodged in the division attributed to this breakdown agency were by employees in the Air & space transport group, as were 93% of claims due to Passenger aircraft.
Changes in characteristics of serious claims over timeTable 35 shows that between 2002–03 and 2006–07, the incidence rate of serious claims in the Transport & storage industry decreased 19%: from32.3 to 26.2 serious claims per 1000 employees. Although this decrease exceeds the 15% decrease across all industries, in 2006–07 the Transport& storage industry retained the second highest incidence rate, nearly double the overall rate (13.5).
In 2006–07, the Rail transport subdivision had the highest incidence rate of all subdivisions within the Transport & storage industry (33.1 serious claims per 1000 employees), followed by the Storage (32.5)and Road transport (29.7) subdivisions. The subdivision with the lowest incidence rate was Air and space transport (13.9 serious claims per 1000 employees).
There were very high incidence rates in the Services to water transport group but this industry group only employed 3% of employees in the Transport & storage industry in 2007–08. Most (58%) of the serious claims in this group were lodged by employees in the Stevedoring class.
Incidence rates for groups containing relatively low numbers of claims should be interpreted with caution as random annual fluctuations in claim numbers can lead to apparently dramatic shifts in incidence rates, posing difficulties in comparing rates over time. Estimates of employee numbers in smaller groups can also fluctuate considerably from year to year with a similar impact on incidence rates.
Compendium of Workers’ Compensation Statistics Australia 2007–08 ... 81

Table 35 Transport & storage industry: serious claims and incidence rate by industry subdivision and group, 2002–03 to 2007–08pIndustry subdivision & group 2002–03 2003–04 2004–05 2005–06 2006–07 2007–08p % changea
Number of serious claimsRoad transport 5 315 5 225 5 155 5 115 5 085 5 445
Road freight transport 4 250 4 135 4 140 4 190 4 110 4 375
Road passenger transport 1 065 1 090 1 015 925 980 1 070
Rail transport 1 275 1 245 1 245 1 310 1 225 1 230
Water transport 290 350 295 300 310 275
Air & space transport 955 845 855 785 685 930
Other transport 290 250 130 115 310 295
Services to transport 1 805 1 980 1 885 1 845 1 820 1 600
Services to road transport 195 185 170 205 165 220
Services to water transport 665 675 605 620 605 545
Services to air transport 230 270 300 280 305 120
Other services to transport 710 845 810 745 740 720
Storage 1 430 1 540 1 670 1 575 1 515 1 215
Total Transport & storage 11 360 11 430 11 225 11 045 10 950 10 990
-4%
-3%
-8%
-4%
7%
-28%
7%
1%
-15%
-9%
33%
4%
6%
-4%
Incidence rate (serious claims per 1000 employees)Road transport 33.1 30.4 30.9 31.0 29.7 28.8
Road freight transport 37.1 32.7 36.4 36.9 34.6 33.0
Road passenger transport 23.3 23.9 19.0 18.0 18.5 19.0
Rail transport 33.2 29.7 29.7 31.1 33.1 29.0
Water transport 20.6 22.5 17.9 20.1 18.5 15.0
Air and space transport 20.2 17.9 16.8 14.6 13.9 18.8
Other transport ** ** ** 14.6 28.7 24.5
Services to transport 27.8 25.8 24.3 22.5 21.2 18.4
Services to road transport 37.5 28.0 34.9 41.4 33.2 36.1
Services to water transport 51.2 50.6 46.0 43.0 43.6 39.8
Services to air transport 28.5 30.5 35.0 23.6 28.0 10.3
Other services to transport 18.4 17.7 15.9 14.7 13.2 12.9
Storage 54.5 52.2 37.2 35.5 32.5 23.5
Transport and storage 32.3 29.8 28.1 26.9 26.2 24.4
-10%
-6%
-21%
0%
-10%
-31%
-24%
-11%
-15%
-2%
-28%
-40%
-19%
a Percentage change from 2002–03 to 2006–07 due to potential volatility of the preliminary data for 2007–08.
Payments made and duration of serious claimsFigure 48 shows that between 2002–03 and 2006–07, the median time lost from work for claims in this industry remained close to the median time lost for all industries. The median payment, however, increased at a greater rate: 31% from $4200 to $5500 compared with the 18% increase in median for all claims (Figure 49). Factors influencing the paymentsmade include the employee’s salary level, the length of absence from work and medical expenses.
82 ... Safe Work Australia

2002–03 2003–04 2004–05 2005–06 2006–07
Transport & storage 3.8 3.8 3.9 4.0 4.0
All claims 4.0 3.7 3.6 3.8 3.9
2002–03 2003–04 2004–05 2005–06 2006–07
Transport and storage 4200 4900 5300 5400 5500
All claims 4900 5200 5300 5600 5800
Med
ian
cost
($)
Med
ian
time
lost
(w
eeks
)
Part D: Priority industry profiles: Transport & storage
Figure 48 Transport & storage industry: median time lost from work, 2002–03 to 2006–07
5
4
3
2
1
0
Figure 49 Transport & storage industry: median payment, 2002–03 to 2006–07
6000
4000
2000
0
Compensated fatalitiesThe number of compensated fatalities in the Transport & storage industry declined from 68 fatalities in 2002–03 to 46 in 2003–04, and remained at51 or below until 2006–07. As Table 36 shows, preliminary data indicate that the number of compensated fatalities among Transport & storage employees returned to the 2002–03 level of 68 fatalities in 2007–08.
Fatality incidence rates tracked changes in the number of compensated fataltiies, but a 28% increase in employment in this industry over the period resulted in a 22% lower fatality incidence rate than 2002–03even though the number of compensated fatalities was the same (15.1 compensated fatalities per 100 000 employees in 2007–08p compared to 19.3 in 2002–03). The compensated fatality incidence rate of 15.1 inTransport & storage makes it the highest of any industry division in 2007–08p and six times the rate for all industries (2.4 compensated fatalities per100 000 employees).
Compendium of Workers’ Compensation Statistics Australia 2007–08 ... 83

Table 36 Transport & storage industry: compensated fatalities and fatality incidence rate by industry subdivision and group, 2002–03 to 2007–08pIndustry subdivision & group 2002–03 2003–04 2004–05 2005–06 2006–07 2007–08p
Number of fatalitiesRoad transport 45 37 38 37 38 55
Road freight transport 39 34 33 33 35 52
Road passenger transport 6 3 5 4 3 3
Rail transport 6 0 1 1 1 4
Water transport 2 0 1 0 1 0
Air and space transport 2 1 5 6 0 3
Other transport 1 2 1 0 3 2
Services to transport 9 5 4 3 7 2
Services to road transport 1 0 0 0 0 1
Services to water transport 5 3 2 2 4 1
Services to air transport 1 0 0 0 0 0
Other services to transport 2 2 2 1 3 0
Storage 3 1 1 1 0 2
Total Transport & storage 68 46 51 48 50 68
Incidence rate (compensated fatalities per 100 000 employees) Transport & storage 19.3 12.0 12.8 11.7 12.0 15.1
Characteristics of compensated fatalitiesIn order to produce a more robust analysis of fatality characteristics, data from the three years 2005–06 to 2007–08p were aggregated in the following analysis. Over this period there were 166 compensated fatalities within the industry, 72% of which occurred in the Road freight transport group.
Unsurprisingly, 63% of compensated fatalities in this industry between2005–06 to 2007–08p were due to a Vehicle accident (105 of the 166 fatalities), 94 (90%) of them in the Road freight transport group alone. Truck drivers were involved in 90% of the Road freight transport fatalities and 68% of all compensated fatalities in the Transport & storage industry over this three-year period.
The compensated fatality incidence rate over the three-year period was13.0 compensated fatalities per 100 000 employees, the highest of any industry and nearly five times the average of 2.7. In the Road freight transport group, the incidence rate was 32.9 compensated fatalities per100 000 employees.Over the three-year period, 89% of all compensated fatalities were caused by injuries, including Multiple injuries accounting for 45%. Ischaemic heart disease and Internal injury of chest, abdomen & pelvis each caused 4% of the compensated fatalities.
Incidence rates generally increased with employee age: from 5.9 compensated fatalities per 100 000 employees for those aged 15–24 years to 21.4 among those aged 55 years & over (Figure 50). Therewere eight fatalities in the youngest age group over the three-year period and 27 in the 25–34 years age group, while there were 43 or 44 in each of the other age groups. The compensated fatality incidence rate for women in the Transport & storage industry division over the three year
84 ... Safe Work Australia

Part D: Priority industry profiles: Transport & storage
period was 0.9 compensated fatalities per 100 000 employees, while men experienced a much higher rate of 17.3.Figure 50 Transport & storage industry: compensated fatality incidence rate by age group, 2003–04 to 2007–08p combined
Transport & storage 13.0
15–24 years
25–34 years
35–44 years
45–54 years
55 years and over
5.9
9.3
12.9
14.2
21.4
0 5 10 15 20 25
Compensated fatalities per 100 000 employees
Compendium of Workers’ Compensation Statistics Australia 2007–08 ... 85

86 ... Safe Work Australia

Appendixes
Appendix 1 — Definitions and explana- tory notes
Employee
Frequency rate
1. Definitions
Incidence and frequency rates for serious claims and compensated fatalities in this publication are calculated using denominators supplied by the Australian Bureau of Statistics (ABS). The denominators are derived from Labour Force Survey and other ABS sources but are nota count of persons and are therefore not entirely compatible with the standard ABS definition of the category Employee in the classification of Status in employment (http://www.abs.gov.au/AUSSTATS/[email protected]/Latestproducts/1F144422BA459EB8CA2572C100244D02?opendocument).
Specifically, rates in this publication are expressed as a proportion of the relevant number of jobs held by persons classified as employees in those jobs rather than of the number of persons holding jobs. Because a person holding two or more jobs (a multiple jobholder) may lodgea workers’ compensation claim with respect to an illness or injury sustained in any of those jobs, a count of jobs is a more appropriate denominator than a count of persons. According to the ABS denominator review, 5.7% of employees were multiple jobholders.
Furthermore, because different jurisdictions apply different rules to who is covered by workers’ compensation, there are additional adjustments to the denominator population. The most significant of these are:
• Police in Western Australia, who are covered by a separate scheme that does not report to Safe Work Australia, are excluded from the denominators.
• Under the Queensland legislation, Owner-managers of incorporated enterprises (OMIE), who are included in the standard definition of Employee, have the option of purchasing workers’ compensation insurance for themselves. Based on 2006 Census data, some9.9% of employed persons in Queensland were OMIE, an unknown number of whom were covered by workers’ compensation. This population has been excluded from the denominators, although there may in fact be some claims included in the numerators.
The frequency rate of occupational injuries and diseases is the number of serious claims expressed as a rate per million hours worked by employees. Frequency rates were calculated using the following formula:
number of serious occupational injury and disease claims x 1 000 000 number of hours worked by employees
Frequency rates for compensated fatalities are expressed as a rate per 100 million hours.
Compendium of Workers’ Compensation Statistics Australia 2007–08.. 87

Incidence rate
Median
The incidence rate of occupational injuries and diseases is the number of serious claims expressed as a rate per thousand employees. Incidence rates were calculated using the following formula:
number of serious occupational injury and disease claims x 1000 number of employees
Incidence rates for compensated fatalities are expressed as a rate per 100 000 employees.
The median is a measure of the central tendency of a sample and is the point at which one half (50%) of the observations (when ranked from smallest to largest) will lie above that value and one half will lie below that value. When the number of values in the sample is even, the median is computed as the average of the two middle values.
In this publication, median payment figures and median time lost from work are used to give some indication of a ‘typical’ claim. Mediansare used as the average is skewed by the inclusion of a few claims that involved long periods of time off work and/or large compensation payments. The average figures, particularly for the most recent years, are also subject to much greater revisions in future publications as the claims develop. As the ‘typical’ claim is finalised within a few months, revisions to medians are usually minor.
Medians shown in this publication are lower than in previous editions due to an improved methodology.
Occupational diseasesOccupational diseases are work-related diseases which result from repeated or long term exposure to an agent or event, or which result from a single traumatic event where there was a long latency period: for example, the development of hepatitis following a single exposure to the infection.
Workers’ compensation data are not an ideal measure of the extent ofwork-related disease since, for a variety of reasons, many diseases do not result in a compensation claim. This is particularly the case because long latency periods may prevent establishment of a conclusive relationship between the disease and workplace exposure. Therefore Safe Work Australia monitors other sources of information and publishes reports that are available on the Safe Work Australia website.
Occupational injuriesOccupational injuries are work-related injuries which result from a single traumatic event occurring while a person is on duty or during a recess period and where there was a short or non-existent latency period. This includes injuries which are the result of a single exposure to an agent causing an acute toxic effect.
The terms ‘occupational injuries’ and ‘occupational diseases’ are defined in the National Data Set for Compensation-based Statistics, 2nd edition, May 1999 (NDS). Their definitions and use are in accordance withthe resolutions of the Thirteenth International Conference of LabourStatisticians, October 1982.
88 ... Safe Work Australia

Appendixes
Payments
Reference year
Serious claims
Time lost
Working week
Payments include compensation or weekly benefits paid to a worker or the worker’s family; payments for goods and services (such as medical treatment, funeral expenses, rehabilitation services); and non- compensation payments (such as legal costs, transport and interpreter services). Payments do not include estimates of future liability or any indirect costs such as loss of productivity (except in the case of common law claims).
Within this publication the reference year refers to a claim lodged in a particular financial year. This figure will not include claims still open from previous years.
Only serious workers’ compensation claims are included in this publication. Serious claims are those lodged in the reference year and accepted for compensation by the jurisdiction by the date the data are extracted and involve a death; a permanent incapacity; or atemporary incapacity with an absence from work of one working week or more. Common law claims are included. Permanent incapacity is determined by each jurisdiction and can include a total incapacity for work or a permanent impairment which may require a change of tasks orresponsibilities. Because claims for injuries sustained on the journey to or from work are only compensable in some jurisdictions, they are excluded.
The number of compensated hours an employee was absent from work.
For the purpose of identifying serious claims, a working week is thenumber of ordinary time hours the employee usually works in a week,whether full-time or part-time.
2. Scope and coverageThe statistics presented in this publication are compiled annually from serious claims made under the state, territory and Australian Government workers’ compensation Acts. The data shown for 2007–08 refer to all accepted claims lodged from 1 July 2007 to 30 June 2008, extracted as at30 November 2008.
The statistics in this report do not cover all cases of occupational injuries and diseases for the following reasons:
• Occupational injuries and diseases involving temporary incapacity and resulting in an absence from work of less than one usual working week are excluded.
• Occupational injuries and diseases occurring on a journey to or from work are excluded.
• While the majority of employees are covered for workers’ compensation under general state, territory and Australian Government workers’ compensation legislation some specific groups of workers are covered under separate legislation. Every effort has been made to compile data from all groups ofemployees, but it is known that currently, claims lodged by police
Compendium of Workers’ Compensation Statistics Australia 2007–08 ... 89

in Western Australia and military personnel within the DefenceForces are excluded.
• Some mesothelioma cases (associated with work-related exposure to asbestos) are compensated through mechanisms other than workers’ compensation. Consequently, mesothelioma claims in this publication are known to be understated.
• Incidences not claimed as workers’ compensation or not acknowledged as work-related are excluded.
• Most occupational injuries to self-employed workers are excluded because they are generally not covered by workers’ compensation schemes. The exclusion of self-employed workers results in an understatement of the number of work-related injuries or diseases within industries where self-employed workers are common, for example, Agriculture, forestry & fishing; Construction; Transport & storage — Road transport; and Retail trade. However, incidence and frequency rates are calculated using estimates of employees and hours worked that excludeself-employed workers and hence are considered to accurately reflect the occurrence of work-related injury and disease in the workplace.
3. Age of employeeThe age of the employee used in this report is derived from date of birth and the date on which the injury occurred or, if the claim involved an occupational disease, the date when the disease was first reported to the employer. Data relating to the open ended age group 65 years & over should be interpreted with caution because of the limited eligibility for workers’ compensation among workers within this age group which may allow for medical costs to be paid but no weekly benefits. As time lost isnot recorded when weekly benefits are not paid, claims from older workers would not make it into the scope of this publication. Eligibility conditionsfor workers’ compensation by jurisdictions can be found in the publication Comparison of workers’ compensation arrangements in Australia and New Zealand, April 2009.
4. Time lost from workTime lost figures shown in this publication are presented in terms of working weeks lost from work.
Information relating to time lost from work should be examined with caution for the following reasons:
• Time lost from work refers to the total period for which compensation was paid — the time lost is not necessarily continuous. Where an injured employee has returned to work on a part-time basis, the time lost from work is the total amount of time for which compensation has been paid — it does not represent the total period of incapacity.
• Time lost from work does not include estimates of future absence. However, it is unlikely that this would affect the median figures presented in this publication.
90 ... Safe Work Australia

Appendixes
• Median working weeks lost have been calculated including claims where zero days have been lost, as is the case for some permanent disabilities such as deafness where the disability does not preclude the worker being at work.
5. PaymentsMedian figures for payments are rounded to the nearest $100 in this publication. Medians are used in preference to averages becausethe average is skewed by the few long-term claims that involve large compensation payments. The reader should not multiply the median payment by the number of claims to calculate the total cost of work-related injury and disease in Australia.
Unlike median time lost from work, median payments are calculated excluding claims where total payments are zero. There can be some delays in applying payment information to the claim record, so claims with no payments are excluded from the median calculation. As this particularly impacts on the preliminary year, payment information for this year is not presented in this publication.
6. Industry classificationThe industry shown in this publication is the industry of the employer of the injured worker. The industry is classified in accordance with the Australian and New Zealand Standard Industrial Class i fication (ANZSIC), 1993 edition (ABS Cat. No. 1292.0) (http://www.abs.gov.au/AUSSTATS/[email protected]/66f306f503e529a5ca25697e0017661f/7cd8aebba7225c4eca25697e0018faf3!OpenDocument). Injuries to workers employed under labour hire arrangements are shown under Property & business services as the industry of the employer of the worker regardless of the industry where the injury actually occurred. In addition, due to the limitations of the ABS in collecting detailed information on employment, some employee estimates can only be supplied at a higher level of the classification. Some pro-rating of estimates has been undertaken in Part D Priority Industry Profiles to ensure robust incidence rates are provided.
The ABS has also undertaken a review of the methodology used in estimating the number of employees covered by workers’ compensation. The incidence and frequency rates shown in this publication are using the new estimates supplied by the ABS. The new methodology has resulted in some changes to the industry estimates. See Explanatory Note 12.
7. Occupation classificationThe occupation of the worker has been classified in accordance with the Australian Standard Classification of Occupations (ASCO), Second Edition, July 1997(ABS Cat. No. 1222.0)(http://www.abs.gov.au/AUSSTATS/[email protected]/Previousproducts/1220.0Contents11997?opendocument&tabname=Summary&prodno=1220.0&issue=1997&num=&view=).
Compendium of Workers’ Compensation Statistics Australia 2007–08 ... 91

8. Type of occurrence dataDetails of the ‘description of the occurrence’ reported on the workers’compensation claim have been classified according to the T ype of Occurrence Classification System, Second Edition, (May 2002) (TOOCS2.1) which can be found on the Safe Work Australia website (http://www.safeworkaustralia.gov.au/swa/AboutUs/Publications/TOOCSTypesofOccurrenceClassificationSystem.htm). Throughout this publication, the Type of Occurrence Classification System categories have been italicised. The five variables used to describe the type of occurrence are:
Nature of Injury or DiseaseThe Nature of injury or disease refers to the most serious injury or disease sustained or suffered by the worker. In Part B: Trends over time, Disorders of the musculoskeletal system & connective tissue have been combined with occupational injuries when showing data by nature of injury or disease. This change has been necessitated by the introduction of a new coding system in Victoria in 2002–03 under which some claims that were previously coded as Sprains & strains of joints & adjacent muscles are now coded to Disorders of the musculoskeletal system & connective tissue. This coding change more accurately reflects the repetitive andlong term muscle stress that results from these conditions. By combining these categories, a useful time series can still be maintained. Thechange implemented in Victoria is similar to TOOCS3 which has been progressively implemented across the other jurisdictions since July 2005.
Bodily Location of Injury or DiseaseThe Bodily location of injury or disease refers to the part of the body affected by the most serious injury or disease.
Mechanism of Injury or DiseaseThe Mechanism of injury or disease is the action, exposure or event which was the direct cause of the most serious injury or disease, that is, how exactly the injury or disease was sustained.
Breakdown Agency of Injury or DiseaseThe Breakdown agency refers to the object, substance or circumstance that was principally involved in, or most closely associated with, the point at which things started to go wrong, and which ultimately led to the most serious injury or disease.
Agency of Injury and DiseaseThe Agency of injury or disease refers to the object, substance or circumstance directly involved in inflicting the injury or disease. The coding structure is the same as is used for breakdown agency.
It should be noted that the ‘Other’ category used in some graphs of type of occurrence does not necessarily represent occurrences which havenot been fully and/or appropriately classified, the category can be used to present the sum of remaining categories.
9. ‘Not stated’ dataA number of claims have not been fully coded for the various classifications used in this publication due to insufficient information onthe claim form. These claims are always included in the totals and in some cases are included in the Other & unspecified categories. Where numbers
92 ... Safe Work Australia

Appendixes
are significant they have been separately shown so that the readercan take this information into consideration when making comparisons, particularly across time.
10. ConfidentialityClaim numbers in this publication have been rounded to the nearest 5.This ensures that confidential information about employers and employees is protected. For this reason differences may occur between the totals and the sum of the row and column values. By agreement with the jurisdictions fatality numbers are not rounded since this information is a matter ofpublic record.
11. Time series analysisComparison of 2007–08 data with previous years should be undertaken with caution. Data shown for 2007–08 are preliminary (denoted by ‘p’) and are likely to be understated because they are taken from an earlier stage of claims processing than data for earlier years shown in this publication. This issue is addressed by not including the preliminary 2007–08 data in time series comparisons.
In addition, when analysing trends over time, consideration needs to be given to any changes to jurisdiction-specific legislation during the period concerned. Current workers’ compensation arrangements can be found in the publication Comparison of workers’ compensation arrangements, Australia & New Zealand (http://www.safeworkaustralia.gov.au/NR/rdonlyres/2F9B1EA6-7E2A-407C-AA52-99D0F6B2D0C5/0/Comparison_of_Workers_Compensation_Arrangements_in_Aust_and_NZ_2008.pdf).
The Victorian data have been factored to account for the different excess period operating in that jurisdiction. Details can be found in Explanatory note 13 — Adjustment of Victorian data.
12. Calculation of denominator data used to calculate incidence and frequency ratesEstimates of the number of employees and hours worked for each Australian workers’ compensation jurisdiction are supplied annually by the ABS. These estimates are provided by jurisdiction, sex and age separately for industry and occupation. This restricts the way incidence and frequency rates can be presented in this publication. In particular,industry information below the Division level should be treated with caution because the ABS cannot always accurately determine specific industriesof employment for all employees.
Denominator data are derived from Labour Force Survey data, adjusted to account for differences in scope between the denominators andthe workers’ compensation coverage for some jurisdictions. The largest adjustment is made for Commonwealth employees who are estimated using data from the Survey of Employment and Earnings. Other adjustments aim to ensure employees working under labour hire arrangements are allocated to the correct industry and employees with more than one job are counted in each job.
Compendium of Workers’ Compensation Statistics Australia 2007–08 ... 93

The ABS recently conducted a review of the methodology used to calculate the number of employees and hours worked and subsequently implemented a number of changes which increased these estimates. A major correction was also made to the way in which the second job ofa multiple job holder was allocated to an industry. This has resulted in some substantial changes to the industry incidence and frequency rates for industries with large numbers of workers with more than one job i.e. Agriculture, forestry & fishing; Retail trade; Accommodation, cafes & restaurants; Education; Health & community services; and Cultural & recreational services.
As the ABS were only able to supply new estimates back to 2005–06, estimates prior to 2005–06 were adjusted based on the movement between the old and new estimates for 2005–06 to avoid a break in time series.
13. Adjustment of Victorian dataThe use of claims involving one or more weeks of compensation in this publication generally takes account of the different employer excesses that exist in the various schemes. However, under the Victorian workers’ compensation scheme the employer is generally liable for the first 10 days of lost wages (equivalent to 2 weeks for full-time workers) by theinjured worker plus the first $546 (as at 30 June 2008) of medical services, unless the employer has elected the Excess Buyout option (http://ww w .worksafe.vic.go v .au/wps/wcm/connect/wsinternet/ W orkSafe/ Home/Insurance+and+Premiums/Calculating+Premiums/How+Do+I+Choose+The+Buy+Out+Option/). Information on claims paid solely by employers are not always provided to the Victorian Workcover Authority.
In order to compare Victorian claims data with other jurisdictions, adjustments have been made to estimate the full number of claims in Victoria with 1 to 2 weeks off work. To calculate the impact of the Victorian10 day excess, the percentage of claims of 1 to 2 weeks duration reported for Victoria was compared with the percentage of 1 to 2 weeks claims reported by other Australian jurisdictions. Based on this comparison, the number of Victorian 1 to 2 weeks claims was increased by a factor so that the percentage of such claims matched the Australian average for such claims. The factor increases the number of Victorian claims by around20 per cent. The analysis was undertaken at the industry division level to allow for a greater degree of homogeneity in respect of claim duration.
While South Australia has a 10 day excess per employee, information indicates that information on claims for less than 10 days is being sent to the workers’ compensation authority and no adjustment is necessary.
14. NOSI databaseMore detailed claims information can be accessed through the Compensation Statistics Online database, available via the Safe Work Australia website ww w .safeworkaustralia.go v .au . It should be noted that some data in the database will be different to that shown in this publication due to the aggregation of some claims information in this publication to present only the areas of most interest.
94 ... Safe Work Australia
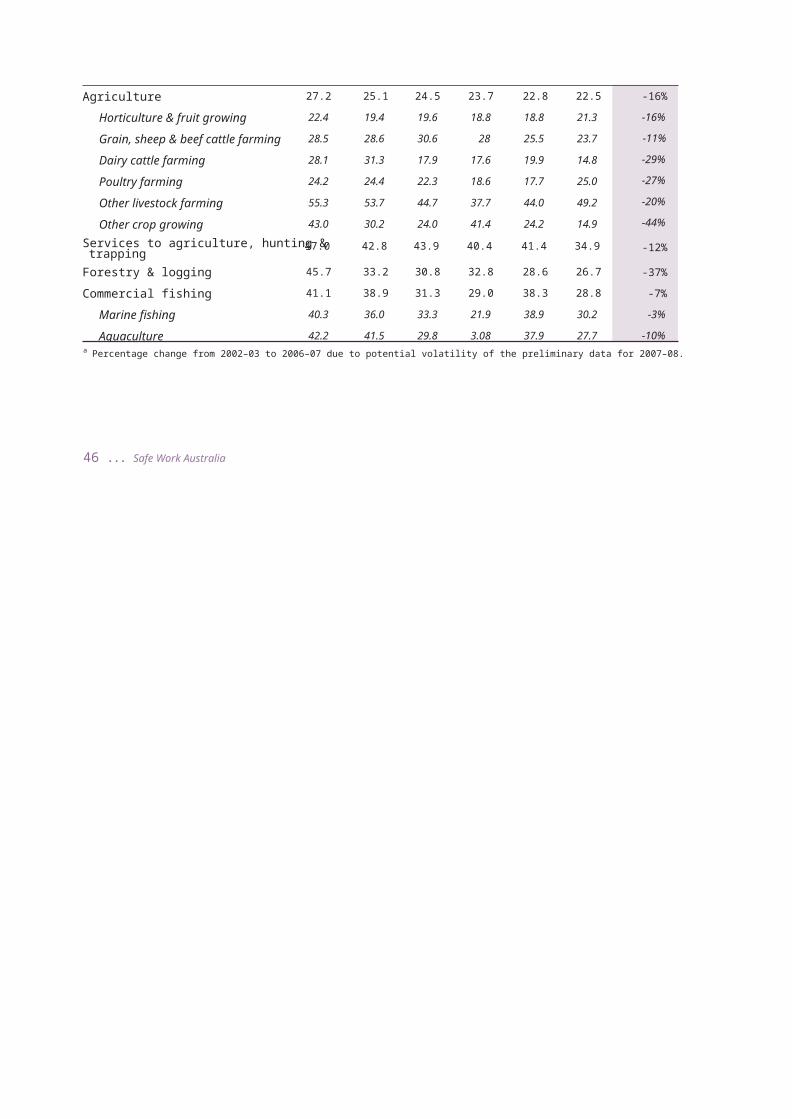
Appendix 2 — Reliability of the data
Appendixes
The statistical data provided in this publication are subject to two sources of error.
Non-sampling errorNon-sampling errors may occur in any statistical collection during data reporting, recording and processing. Non-sampling errors can be a result of one or more of the following:
• deficiencies in data collecting forms
• incorrect recording of answers by the respondent or the processing agency
• inaccurate coding
• non-response or omitted cases
• errors in collection procedures, and
• errors in data entry, editing and processing.
Non-sampling errors may affect both the numerator and denominator data. It is difficult to quantify non-sampling errors.
Attempts to edit data accurately, consistently and comparably are adopted by agencies to minimise non-sampling errors.
Sampling errorSampling error is a measure of the variability that occurs by chance because a sample, rather than the entire population, is surveyed. The likelihood of difference is measured by the standard error, which indicates the extent to which an estimate might have varied by chance because a sample was selected. Sampling variability is also measured by the relative standard error (RSE), which is obtained by expressing the standard error as a percentage of the estimate to which it refers.
In this publication, the denominator data used in the estimation of incidence and frequency rates are the only data which are subject to sampling error. Incidence and frequency rates based on denominator data with high relative standard errors are indicated in tables by annotation with one asterisk to indicate an RSE of the denominator greater than 25%.If the RSE is greater than 50% the figure is suppressed and replaced with two asterisks. In general, at the aggregate level at which most compendium data are presented, high RSEs are rare. However, readers should note that rates relating to groups with relatively small numbers of employees are likely to have relatively higher RSEs and should therefore be viewed with caution.
Compendium of Workers’ Compensation Statistics Australia 2007–08 ... 95

Appendix 3 — Contact informationNew South Wales WorkCover New South Wales 13 10 50
www.workcover.nsw.gov.au
Victoria Victorian WorkCover Authority 1800 136 089 www.workcover.vic.gov.au
Queensland Workplace Health and Safety Queensland 1300 369 915 www.worksafe.qld.gov.au
WorkCover Queensland 1300 362 128 http://www.workcoverqld.com.au/
Western Australia WorkSafe Western Australia 1300 307 877 www.worksafe.wa.gov.au
WorkCover Western Australia 1300 794 744 (inside WA only)ww w .workcove r .wa.go v .au
South Australia Safework South Australia 1300 365 255 ww w .safework.sa.go v .au
WorkCover Corporation South Australia 131 855 ww w .workcove r .com
Tasmania WorkCover Tasmania 1300 366 322 (inside Tas. only)ww w .workcove r .tas.go v .au
Workplace Standards Tasmania 1300 366 322 (inside Tas. only)ww w .wst.tas.go v .au
Australian Capital Territory ACT WorkCover (02) 6205 0200 ww w .workcove r .act.go v .au
Northern Territory NT WorkSafeDepartment of Employment, Education and Training1800 019 115 ww w .worksafe.nt.go v .au
Australian Government Comcare Australia 1300 366 979 http://ww w .comcare.go v .au/home
For further information about data in this publication contact:
Data & Analysis SectionTel: (02) 6121 9115
Safe Work AustraliaLoc C220NBG GPO Box 641Canberra ACT 2601
More detailed data is available at the Safe Work Australia website www.safeworkaustralia.gov.au

96 ... Safe Work Australia

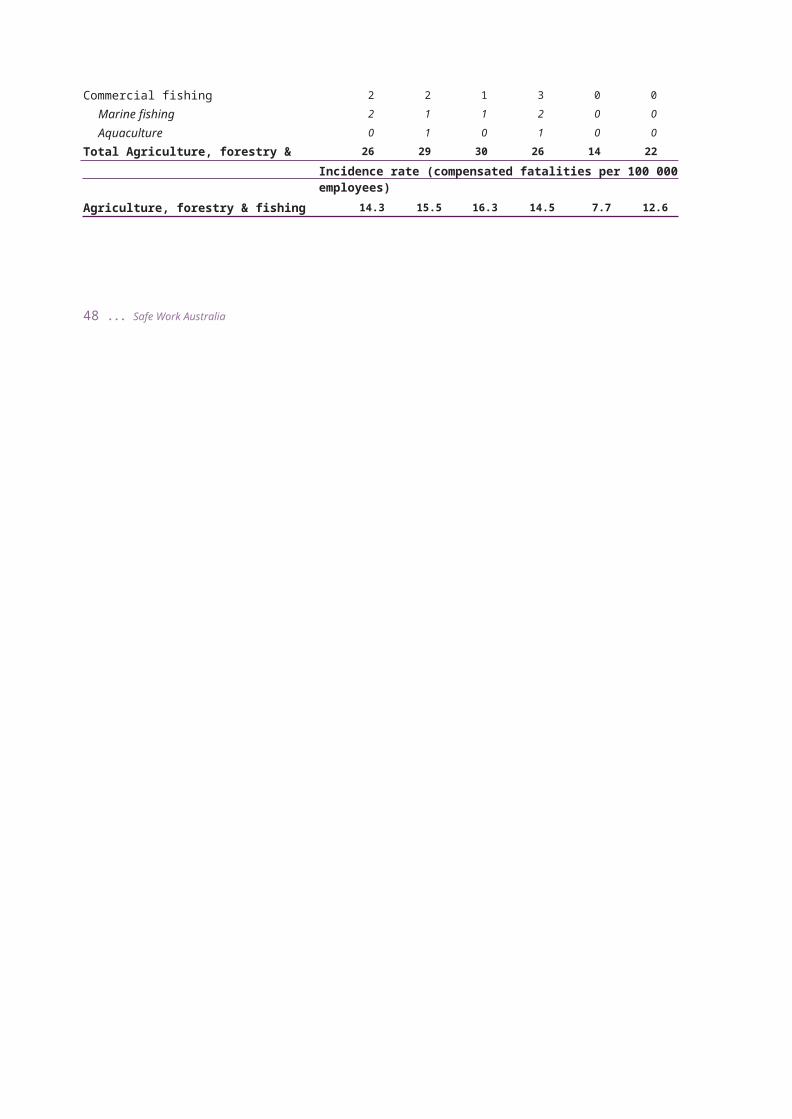
Inquires
For further information regarding the contents of this publication contact:
The Data & Analysis SectionSafe Work Australia
(02) 6121 9152