Comparison of the two-dimensional directional wave spectra ... · COMPARISON OF DIRECTIONAL WAVE...
14
COMPARISON OF DIRECTIONAL WAVE SPECTRA RETRIEVED FROM SAR IMAGES 317 SCI. MAR., 68 (3): 317-330 SCIENTIA MARINA 2004 Comparison of the two-dimensional directional wave spectra retrieved from spaceborne synthetic aperture radar images using the MPI scheme against directional buoy measurements* NELSON VIOLANTE-CARVALHO 1,2 and IAN S. ROBINSON 1 1 Southampton Oceanography Centre, University of Southampton, European Way, Southampton, SO14 3ZH, UK. 2 Present address: Marine Geology Lab LAGEMAR-UFF, Av. Litoranea s/n Boa Viagem, Campus Praia Vermelha 24210-310, Niteroi, Rio de Janeiro, Brazil. E-mail: [email protected] SUMMARY: Spaceborne Synthetic Aperture Radar (SAR) is to date the only source of two-dimensional directional wave spectra with continuous and global coverage when operated in the so-called SAR Wave Mode (SWM). Since the launch in 1991 of the first European Remote Sensing Satellite ERS-1, and more recently with ENVISAT, millions of SWM imagettes containing detailed spectral information are now available in quasi-real time. This huge amount of directional wave data has opened up many exciting possibilities for the improvement of our knowledge of the dynamics of ocean waves. However, the retrieval of wave spectra from SAR images is not a trivial exercise due to the nonlinearities involved in the mapping mechanism. In this paper we review the main features of the SAR ocean wave imaging mechanisms and give a detailed description of the Max-Planck Institut (MPI) retrieval algorithm which is running operationally at the European Centre for Medium-Range Weather Forecasts (ECMWF). Some examples of retrieved spectra are compared against directional buoy measurements obtained in deep water in the South Atlantic and against WAM spectra. The main characteristics of the MPI retrieval scheme are discussed and some of its deficiencies and strengths are identified. Key words: wind wave, SAR spectrum, MPI scheme, SAR Wave Mode, ERS SWM imagettes. RESUMEN: COMPARACIÓN DEL ESPECTRO DIRECCIONAL BIDIMENSIONAL DE OLEAJE OBTENIDO CON RADAR DE ABERTURA SIN- TÉTICA MEDIANTE EL ESQUEMA MPI RESPECTO A MEDIDAS CON BOYA DIRECCIONAL. – El radar de abertura sintética (SAR) ope- rado desde satélite es actualmente el único medio que permite calcular espectros direccionales de oleaje bidimensionales de forma global y continua, cuando se opera en el denominado modo SAR de oleaje (SWM). Desde el lanzamiento en 1991 del primer Satélite Europeo de Observación de la Tierra (ERS-1), y más recientemente con el ENVISAT, millones de peque- ñas imágenes SWM con información espectral detallada están disponibles en tiempo casi real. Esta enorme cantidad de datos de oleaje direccional ha abierto numerosas posibilidades a la mejora de nuestro conocimiento de la dinámica del oleaje oce- ánico. Sin embargo, la obtención del espectro de oleaje a partir de imágenes SAR no es un ejercicio trivial a causa de las no-linealidades que aparecen en el cálculo. En este artículo revisamos las principales características de los mecanismos de visualización del oleaje por parte del SAR, con una descripción detallada del algoritmo de recuperación del Instituto Max- Planck (MPI) que utiliza de forma operacional el Centro Europeo de Predicción del Tiempo a Medio Plazo (ECMWF). Algunos ejemplos de espectros obtenidos por este método son comparados con los obtenidos a partir de medidas realizadas por boyas de oleaje direccionales en aguas profundas del Atlántico sur. Palabras clave: olas de viento, espectro de SAR, esquema MPI, SAR en modo oleaje, imágenes SAR SWM. *Received January 7, 2003. Accepted February 27, 2004.
Transcript of Comparison of the two-dimensional directional wave spectra ... · COMPARISON OF DIRECTIONAL WAVE...
COMPARISON OF DIRECTIONAL WAVE SPECTRA RETRIEVED FROM SAR IMAGES 317
SCI. MAR., 68 (3): 317-330 SCIENTIA MARINA 2004
Comparison of the two-dimensional directional wavespectra retrieved from spaceborne synthetic aperture
radar images using the MPI scheme against directional buoy measurements*
NELSON VIOLANTE-CARVALHO1,2 and IAN S. ROBINSON1
1 Southampton Oceanography Centre, University of Southampton, European Way, Southampton, SO14 3ZH, UK.2 Present address: Marine Geology Lab LAGEMAR-UFF, Av. Litoranea s/n Boa Viagem, Campus Praia Vermelha
24210-310, Niteroi, Rio de Janeiro, Brazil. E-mail: [email protected]
SUMMARY: Spaceborne Synthetic Aperture Radar (SAR) is to date the only source of two-dimensional directional wavespectra with continuous and global coverage when operated in the so-called SAR Wave Mode (SWM). Since the launch in1991 of the first European Remote Sensing Satellite ERS-1, and more recently with ENVISAT, millions of SWM imagettescontaining detailed spectral information are now available in quasi-real time. This huge amount of directional wave data hasopened up many exciting possibilities for the improvement of our knowledge of the dynamics of ocean waves. However,the retrieval of wave spectra from SAR images is not a trivial exercise due to the nonlinearities involved in the mappingmechanism. In this paper we review the main features of the SAR ocean wave imaging mechanisms and give a detaileddescription of the Max-Planck Institut (MPI) retrieval algorithm which is running operationally at the European Centre forMedium-Range Weather Forecasts (ECMWF). Some examples of retrieved spectra are compared against directional buoymeasurements obtained in deep water in the South Atlantic and against WAM spectra. The main characteristics of the MPIretrieval scheme are discussed and some of its deficiencies and strengths are identified.
Key words: wind wave, SAR spectrum, MPI scheme, SAR Wave Mode, ERS SWM imagettes.
RESUMEN: COMPARACIÓN DEL ESPECTRO DIRECCIONAL BIDIMENSIONAL DE OLEAJE OBTENIDO CON RADAR DE ABERTURA SIN-TÉTICA MEDIANTE EL ESQUEMA MPI RESPECTO A MEDIDAS CON BOYA DIRECCIONAL. – El radar de abertura sintética (SAR) ope-rado desde satélite es actualmente el único medio que permite calcular espectros direccionales de oleaje bidimensionales deforma global y continua, cuando se opera en el denominado modo SAR de oleaje (SWM). Desde el lanzamiento en 1991del primer Satélite Europeo de Observación de la Tierra (ERS-1), y más recientemente con el ENVISAT, millones de peque-ñas imágenes SWM con información espectral detallada están disponibles en tiempo casi real. Esta enorme cantidad de datosde oleaje direccional ha abierto numerosas posibilidades a la mejora de nuestro conocimiento de la dinámica del oleaje oce-ánico. Sin embargo, la obtención del espectro de oleaje a partir de imágenes SAR no es un ejercicio trivial a causa de lasno-linealidades que aparecen en el cálculo. En este artículo revisamos las principales características de los mecanismos devisualización del oleaje por parte del SAR, con una descripción detallada del algoritmo de recuperación del Instituto Max-Planck (MPI) que utiliza de forma operacional el Centro Europeo de Predicción del Tiempo a Medio Plazo (ECMWF).Algunos ejemplos de espectros obtenidos por este método son comparados con los obtenidos a partir de medidas realizadaspor boyas de oleaje direccionales en aguas profundas del Atlántico sur.
Palabras clave: olas de viento, espectro de SAR, esquema MPI, SAR en modo oleaje, imágenes SAR SWM.
*Received January 7, 2003. Accepted February 27, 2004.
sm68n3317 10/9/04 12:57 Página 317
INTRODUCTION
Since the advent of spaceborne Synthetic Aper-ture Radar (SAR) in the early 1990s all weatherocean wave spectra are now available on a globalbasis and in quasi-real time. SAR is the only instru-ment so far deployed from satellites that is capableof measuring the two-dimensional directional wavespectrum and hence allowing the complete charac-terisation of a sea state. When operated in the SARWave Mode (SWM), the Advanced MicrowaveInstruments (AMI) on the European Remote Sens-ing satellites ERS-1 and ERS-2 acquire 10 x 5~kmimagettes every 30 seconds, yielding an along trackresolution of 200 km and a cross track resolution of1000-2000 km. The 1500 imagettes that are collect-ed daily bring enormous new possibilities for thestudy of wind generated waves providing globaldata with high temporal and spatial coverage.
From the practical point of view, this hugeamount of spectral data has applications such as inoptimisation of ship routing, wave climate atlases,offshore operations and coastal management. Butthis kind of information is also valuable for severalscientific investigations. Improving the understand-ing of the dynamics of surface ocean waves isimportant for a better knowledge of, for example,climate dynamics (Janssen and Viterbo, 1996),transfer of momentum from the wind (Donelan,1990) and exchange of gases through the air-seainterface (Csanady, 2001). The information extract-ed from SAR images has opened up new and excit-ing possibilities for wave modelers to assimilateobservations of directional spectra into third genera-tion wave models, an approach that has been hin-dered by the sparseness of directional wave mea-surements.
To retrieve the two-dimensional spectrum fromSAR images is not a simple exercise. There are twomain limitations in the images observed by SARwhich demand great care in the process of derivingthe wave spectrum. Firstly, there is a 180º direction-al ambiguity inherent in frozen images. This prob-lem has been overcome with the launch ofENVISAT carrying the Advanced Synthetic Aper-ture Radar (ASAR), which uses successive imagesto solve the direction of propagation. Secondly, theSAR imaging mechanism is strongly nonlinear dueto distortions induced by the orbital wave motions(the velocity bunching mechanism), causing degra-dation of the azimuthal (parallel to the satelliteflight) resolution. The result of this distortion is that
there is a loss of information beyond a cut-offwavenumber and waves with wavelengths shorterthan 150-200 m propagating in the azimuthal direc-tion are not mapped onto the SAR image directly.
Therefore, to extract the wave spectrum from aSAR image spectrum requires additional informa-tion to solve the directional ambiguity and to recov-er the spectral information at the higher wavenum-ber band corresponding in general to the wind-seapart of the spectrum. This problem has been tackledby three different methods. The basic difference intheir strategies lies in how they address the problemof reconstructing the directional spectrum beyondthe high wavenumber azimuthal cut-off and hencefilling in the spectral gap in the wind-sea part of thespectrum.
The first retrieval algorithm was developed at theMax-Planck Institut (MPI) by Hasselmann and Has-selmann (1991) and an improved version was pub-lished later by Hasselmann et al. (1996). Theyderived a closed expression for the mapping of awave spectrum onto a SAR image spectrum, the for-ward mapping relation, together with a computa-tionally efficient technique for inverting the map-ping relation. The main idea behind the MPI schemeis to use a first-guess wave spectrum, in generalfrom a wave model, and iteratively change itsinverted SAR image spectrum to match the observedSAR image spectrum. They claim that the retrievalis independent of the first-guess which is used just tosolve the directional ambiguity and to augment thespectrum beyond the azimuthal cut-off.
The second retrieval scheme to be proposed is asimplified version of the MPI scheme. Krogstad etal. (1994) applied a very similar approach but they
318 N. VIOLANTE-CARVALHO and I.S. ROBINSON
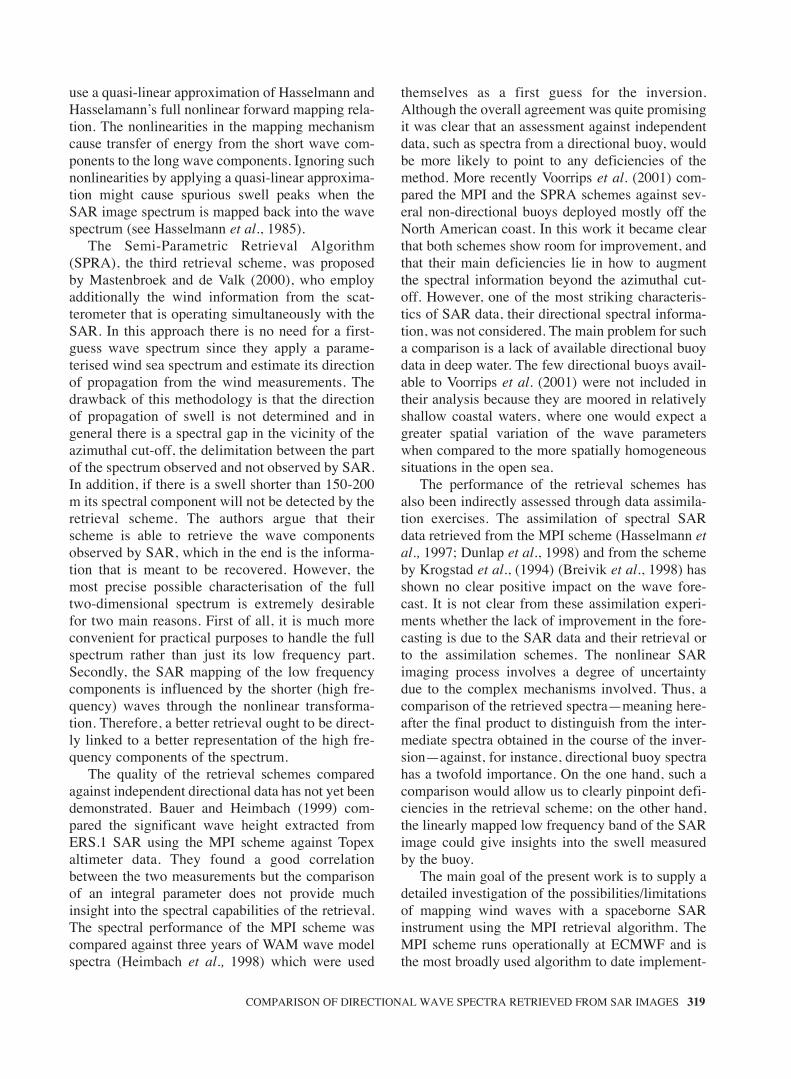
FIG. 1. – The selected area covers the South Atlantic from the Equa-tor line to 72ºS and from 74ºW to 30ºE which is the lat-lon grid usedfor the wave model. Every dot represents one of the thousands ofSAR Wave Mode imagettes during October in 1994 and the * are
those closer than 150 km from the buoy.
sm68n3317 10/9/04 12:57 Página 318
use a quasi-linear approximation of Hasselmann andHasselamann’s full nonlinear forward mapping rela-tion. The nonlinearities in the mapping mechanismcause transfer of energy from the short wave com-ponents to the long wave components. Ignoring suchnonlinearities by applying a quasi-linear approxima-tion might cause spurious swell peaks when theSAR image spectrum is mapped back into the wavespectrum (see Hasselmann et al., 1985).
The Semi-Parametric Retrieval Algorithm(SPRA), the third retrieval scheme, was proposedby Mastenbroek and de Valk (2000), who employadditionally the wind information from the scat-terometer that is operating simultaneously with theSAR. In this approach there is no need for a first-guess wave spectrum since they apply a parame-terised wind sea spectrum and estimate its directionof propagation from the wind measurements. Thedrawback of this methodology is that the directionof propagation of swell is not determined and ingeneral there is a spectral gap in the vicinity of theazimuthal cut-off, the delimitation between the partof the spectrum observed and not observed by SAR.In addition, if there is a swell shorter than 150-200m its spectral component will not be detected by theretrieval scheme. The authors argue that theirscheme is able to retrieve the wave componentsobserved by SAR, which in the end is the informa-tion that is meant to be recovered. However, themost precise possible characterisation of the fulltwo-dimensional spectrum is extremely desirablefor two main reasons. First of all, it is much moreconvenient for practical purposes to handle the fullspectrum rather than just its low frequency part.Secondly, the SAR mapping of the low frequencycomponents is influenced by the shorter (high fre-quency) waves through the nonlinear transforma-tion. Therefore, a better retrieval ought to be direct-ly linked to a better representation of the high fre-quency components of the spectrum.
The quality of the retrieval schemes comparedagainst independent directional data has not yet beendemonstrated. Bauer and Heimbach (1999) com-pared the significant wave height extracted fromERS.1 SAR using the MPI scheme against Topexaltimeter data. They found a good correlationbetween the two measurements but the comparisonof an integral parameter does not provide muchinsight into the spectral capabilities of the retrieval.The spectral performance of the MPI scheme wascompared against three years of WAM wave modelspectra (Heimbach et al., 1998) which were used
themselves as a first guess for the inversion.Although the overall agreement was quite promisingit was clear that an assessment against independentdata, such as spectra from a directional buoy, wouldbe more likely to point to any deficiencies of themethod. More recently Voorrips et al. (2001) com-pared the MPI and the SPRA schemes against sev-eral non-directional buoys deployed mostly off theNorth American coast. In this work it became clearthat both schemes show room for improvement, andthat their main deficiencies lie in how to augmentthe spectral information beyond the azimuthal cut-off. However, one of the most striking characteris-tics of SAR data, their directional spectral informa-tion, was not considered. The main problem for sucha comparison is a lack of available directional buoydata in deep water. The few directional buoys avail-able to Voorrips et al. (2001) were not included intheir analysis because they are moored in relativelyshallow coastal waters, where one would expect agreater spatial variation of the wave parameterswhen compared to the more spatially homogeneoussituations in the open sea.
The performance of the retrieval schemes hasalso been indirectly assessed through data assimila-tion exercises. The assimilation of spectral SARdata retrieved from the MPI scheme (Hasselmann etal., 1997; Dunlap et al., 1998) and from the schemeby Krogstad et al., (1994) (Breivik et al., 1998) hasshown no clear positive impact on the wave fore-cast. It is not clear from these assimilation experi-ments whether the lack of improvement in the fore-casting is due to the SAR data and their retrieval orto the assimilation schemes. The nonlinear SARimaging process involves a degree of uncertaintydue to the complex mechanisms involved. Thus, acomparison of the retrieved spectra—meaning here-after the final product to distinguish from the inter-mediate spectra obtained in the course of the inver-sion—against, for instance, directional buoy spectrahas a twofold importance. On the one hand, such acomparison would allow us to clearly pinpoint defi-ciencies in the retrieval scheme; on the other hand,the linearly mapped low frequency band of the SARimage could give insights into the swell measuredby the buoy.
The main goal of the present work is to supply adetailed investigation of the possibilities/limitationsof mapping wind waves with a spaceborne SARinstrument using the MPI retrieval algorithm. TheMPI scheme runs operationally at ECMWF and isthe most broadly used algorithm to date implement-
COMPARISON OF DIRECTIONAL WAVE SPECTRA RETRIEVED FROM SAR IMAGES 319
sm68n3317 10/9/04 12:57 Página 319
ed in several institutions around the world. Howev-er very little is known about its performanceassessed against independent measurements. Wecompare SAR wave spectra extracted from the MPIscheme against directional buoy spectra measured inthe open ocean in the South Atlantic and againstWAM spectra used as a first guess to the inversion.The main characteristics of the MPI retrievalscheme are presented together with a comprehen-sive review of the SAR modulation transfer func-tions. The structure of the paper is the following. InSection 2 the SAR imaging mechanisms aredescribed in some detail while the MPI retrievalscheme is discussed in Section 3. Buoy and modeldata are presented in Section 4 and finally the resultsof the comparison and discussions are presented inSections 5 and 6.
SAR OCEAN WAVE IMAGING MECHANISMS
It is quite remarkable that an instrument likeSAR that emits microwave pulses able to penetrateno further than the very top skin layer of the oceanis capable of capturing in its back scattered pulseinformation about several oceanic features such asinternal waves, shallow water bathymetry, currentboundaries and surface gravity waves. In the expla-nation for what is, at first sight, a surprisingresponse lie the principles of the SAR ocean waveimaging mechanism.
The ERS-1 satellite was launched in July 1991into a sun-synchronous, polar, near-circular orbitoperating at an altitude of about 785 km. Its payloadconsisted of an Active Microwave Instrument com-prising a SAR (image and wave modes), a WindScatterometer, a Radar Altimeter and an AlongTrack Scanning Radiometer. In SAR image modethe instrument acquires 10 x 100 km images, but duemainly to onboard data storage limitations it can beoperated only in the vicinity of a ground station. TheSAR Wave Mode was introduced to yield globalcoverage of directional wave spectra since the muchsmaller images acquired in this mode are storedonboard and transmitted once per orbit to groundstations. Figure 1 shows the several thousand SARWave Mode imagettes acquired by ERS-1 during theperiod of one month over the South Atlantic. Theresolution of the SAR Wave Mode imagette is simi-lar to the SAR image mode, around 30 x 30 m. Thespectrum consists of 12 x 12 polar wavenumbercoordinates ranging from approximately 100 to
1000 m in wavelength (wave periods from 8 to 25 s)and covering a 180º sector, so with a directional res-olution of 15º.
The ERS-1 SAR is a right-side-looking imagingradar operating at C-band (a frequency of 5.3 GHz).A SAR is an active all weather sensor transmittingits own radiation and receiving back part of the ener-gy that was back scattered from the sea surface. Thefraction of incident energy reflected back is calledthe radar cross-section and the radar modulationtransfer function (MTF) is used to define the relationbetween the surface wave height and the amplitudeof the variabilities of the radar cross-section. At thetypical incidence angles used in SAR onboard satel-lites (23º from vertical for ERS-1) the electromag-netic waves emitted by SAR interact with shortocean surface waves in a process called the Braggresonant scattering process (see for example Robin-son, 1985, Chapter 12). The back scattered signal isproportional to the amplitude of these decimetricocean waves denominated Bragg surface ripples.For ERS-1 the Bragg ripples have a wavelength ofapproximately 8 cm. These short waves are modu-lated by longer waves, such as a swell propagatingon the surface or even internal waves propagatingseveral metres in depth, which causes the longerwaves to be visible on SAR images.
The imaging of ocean surface waves by SAR isbased on a two-scale model (see for instance Komenet al., 1994) consisting of the short waves whosewavelength is approximately half as long as the inci-dent radar wavelength and the longer swell waves.The back scattered signal is affected by the slope ofthe long waves that changes the angle of view thatthe ripples present to the radar, the tilt modulation.Basically the amount of energy reflected back willbe greater for the target plane (facet) facing towardsthe radar, while for the slope of the wave facingaway the cross-section will be smaller. This mecha-nism is primarily sensitive to range travelling waves(perpendicular to the direction of satellite flight).Models of the Tilt MTF assume a Phillips k-4 (or f-5)slope although the best representation for this highfrequency decay exponent is still open to debate (seefor instance Violante-Carvalho et al., Buoy Obser-vations of the Influence of Swell on Wind Waves inthe Open Ocean, submitted to Applied OceanResearch, 2002 and references therein). The TiltMTF is represented by
(1)T k et r
i
= −±
4
1 22cot
sin
θθ
π
320 N. VIOLANTE-CARVALHO and I.S. ROBINSON
sm68n3317 10/9/04 12:57 Página 320
where kr is the component of the wavenumber vec-tor in the range direction and q is the radar incidenceangle. The ± sign represents vertical and horizontalpolarisation respectively and hence the tilt MTF isstrongest for horizontal polarisation. The maximumcross-section occurs on the face of the long wave -p/2 from the wave crest -as described by the phasein (1)
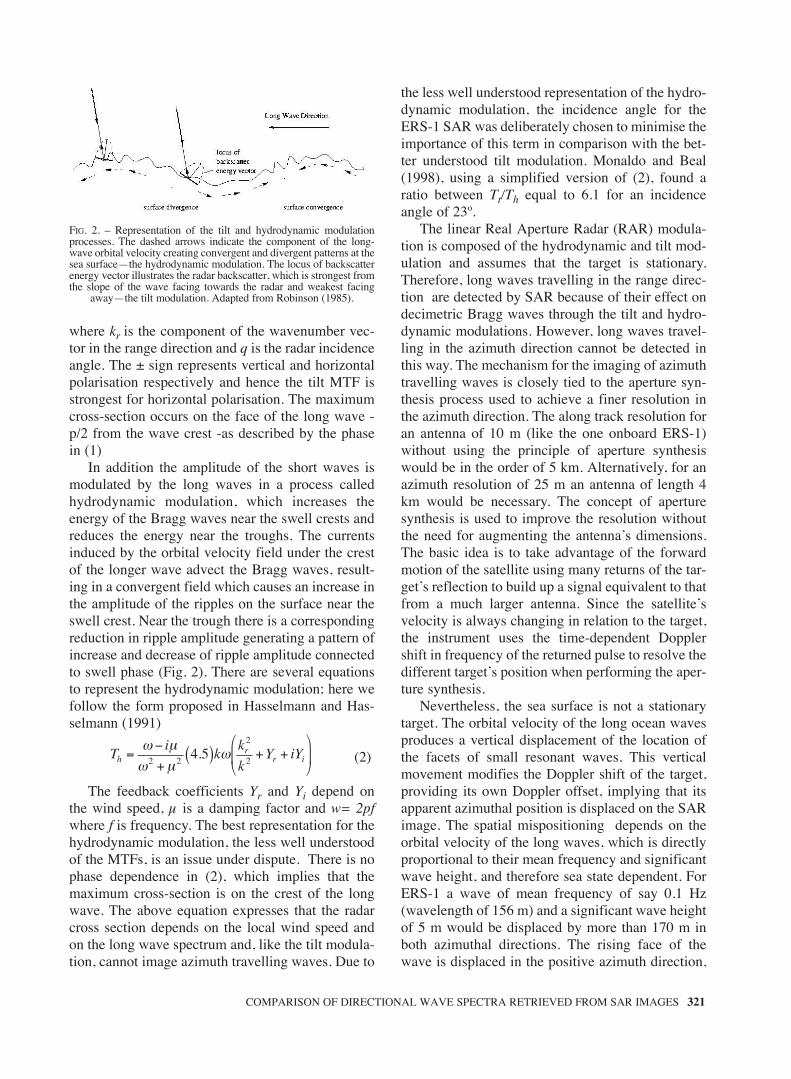
In addition the amplitude of the short waves ismodulated by the long waves in a process calledhydrodynamic modulation, which increases theenergy of the Bragg waves near the swell crests andreduces the energy near the troughs. The currentsinduced by the orbital velocity field under the crestof the longer wave advect the Bragg waves, result-ing in a convergent field which causes an increase inthe amplitude of the ripples on the surface near theswell crest. Near the trough there is a correspondingreduction in ripple amplitude generating a pattern ofincrease and decrease of ripple amplitude connectedto swell phase (Fig. 2). There are several equationsto represent the hydrodynamic modulation; here wefollow the form proposed in Hasselmann and Has-selmann (1991)
(2)
The feedback coefficients Yr and Yi depend onthe wind speed, µ is a damping factor and w= 2pfwhere f is frequency. The best representation for thehydrodynamic modulation, the less well understoodof the MTFs, is an issue under dispute. There is nophase dependence in (2), which implies that themaximum cross-section is on the crest of the longwave. The above equation expresses that the radarcross section depends on the local wind speed andon the long wave spectrum and, like the tilt modula-tion, cannot image azimuth travelling waves. Due to
the less well understood representation of the hydro-dynamic modulation, the incidence angle for theERS-1 SAR was deliberately chosen to minimise theimportance of this term in comparison with the bet-ter understood tilt modulation. Monaldo and Beal(1998), using a simplified version of (2), found aratio between Tt/Th equal to 6.1 for an incidenceangle of 23º.
The linear Real Aperture Radar (RAR) modula-tion is composed of the hydrodynamic and tilt mod-ulation and assumes that the target is stationary.Therefore, long waves travelling in the range direc-tion are detected by SAR because of their effect ondecimetric Bragg waves through the tilt and hydro-dynamic modulations. However, long waves travel-ling in the azimuth direction cannot be detected inthis way. The mechanism for the imaging of azimuthtravelling waves is closely tied to the aperture syn-thesis process used to achieve a finer resolution inthe azimuth direction. The along track resolution foran antenna of 10 m (like the one onboard ERS-1)without using the principle of aperture synthesiswould be in the order of 5 km. Alternatively, for anazimuth resolution of 25 m an antenna of length 4km would be necessary. The concept of aperturesynthesis is used to improve the resolution withoutthe need for augmenting the antenna’s dimensions.The basic idea is to take advantage of the forwardmotion of the satellite using many returns of the tar-get’s reflection to build up a signal equivalent to thatfrom a much larger antenna. Since the satellite’svelocity is always changing in relation to the target,the instrument uses the time-dependent Dopplershift in frequency of the returned pulse to resolve thedifferent target’s position when performing the aper-ture synthesis.
Nevertheless, the sea surface is not a stationarytarget. The orbital velocity of the long ocean wavesproduces a vertical displacement of the location ofthe facets of small resonant waves. This verticalmovement modifies the Doppler shift of the target,providing its own Doppler offset, implying that itsapparent azimuthal position is displaced on the SARimage. The spatial mispositioning depends on theorbital velocity of the long waves, which is directlyproportional to their mean frequency and significantwave height, and therefore sea state dependent. ForERS-1 a wave of mean frequency of say 0.1 Hz(wavelength of 156 m) and a significant wave heightof 5 m would be displaced by more than 170 m inboth azimuthal directions. The rising face of thewave is displaced in the positive azimuth direction,
Ti
kk
kY iYh
rr i=
−
+( ) + +
⎛
⎝⎜
⎞
⎠⎟
ω µω µ
ω2 2
2
24 5.
COMPARISON OF DIRECTIONAL WAVE SPECTRA RETRIEVED FROM SAR IMAGES 321
FIG. 2. – Representation of the tilt and hydrodynamic modulationprocesses. The dashed arrows indicate the component of the long-wave orbital velocity creating convergent and divergent patterns at thesea surface—the hydrodynamic modulation. The locus of backscatterenergy vector illustrates the radar backscatter, which is strongest fromthe slope of the wave facing towards the radar and weakest facing
away—the tilt modulation. Adapted from Robinson (1985).
sm68n3317 10/9/04 12:57 Página 321
whereas the falling face shifts in the negativeazimuth direction. If this displacement, called veloc-ity bunching, is small when compared to the wave-length of the long wave the effect is approximatelylinear. But if the displacement is of the same orderas (or larger than) the wavelength of the long waves,which is the case for waves as in the previous exam-ple, the velocity bunching mechanism is highly non-linear. These nonlinearities cause smearing of theimage and an azimuthal fall-off with a highwavenumber azimuthal cut-off beyond whichwaves are not mapped into the SAR image plane.The azimuthal cut-off is sea state dependent andhence varies, but in general SAR cannot detectwaves shorter than 150-200 m propagating in theazimuth direction. Therefore, the SAR imagingprocess can be thought of as a low-pass filter damp-ing out the high wavenumber part of the spectrum.
The linear velocity bunching MTF is represented as
(3)
where R is the distance between the radar and theocean surface (slant range), V is the satellite groundtrack velocity, ka is the component of the wavenum-ber vector in the azimuth direction and φ is the wavepropagation angle with the satellite track (sinφ =kr/⏐k⏐). The phase of (3) depends on the sign of ka;for positive values, or waves propagating in thesame direction as the satellite, the maximum cross-section occurs at the wave crest. For negative valuesof ka, or waves propagating antiparallel to the satel-lite, the minimum cross-section occurs at the wavecrest. Reducing the ratio R/V, for instance with SARon a lower altitude satellite, brings down theazimuth degradation caused by orbital motion and asa result the linear behavior of the velocity bunchingmechanism applies over a larger wavenumber band.
It is still not clear which one of the three imagingmechanisms is the dominant one (see a comprehen-sive review in Hasselmann et al., 1985). The map-ping of a wave spectrum into an SAR image spec-trum (and its inversion) has to take into account allthe imaging mechanisms and the nonlinearitiesencountered at least in part of the spectrum. Hassel-mann and Hasselmann (1991) developed a closednonlinear integral transform for dealing with thisproblem which combines additional information, ingeneral from wave models, with the incompleteinformation yielded by SAR images. The main fea-ture of this integral transform is an exponential termthat describes the azimuthal fall-off. The character-
istics of the integral transform, together with a dis-cussion of the MPI retrieval scheme, are presentedin the next section.
THE MPI RETRIEVAL SCHEME
Hasselmann and Hasselmann noted that since theimaging mechanisms are quite well understood theforward mapping of an ocean wave spectrum into anSAR image spectrum can be computed numerically.However, the wave spectrum provided by SARimages is an incomplete spectrum. First of all, this isdue to the directional ambiguity. Secondly, the non-linearities caused by orbital motions result in anazimuthal high wavenumber cut-off and thereforewaves shorter than 150-200 m propagating parallelto the satellite path are not imaged. In addition, dueto spatial resolution and storage limitations wavesshorter than approximately 70 m (period of approx-imately 7 s) propagating even in the range directionare not mapped onto the SAR image either. Theseconstraints impose the use of a first guess to aug-ment the spectral information. Hasselmann and Has-selmann recognised that because of this lack ofinformation in the high wavenumber part of thespectrum not only was a forward mapping necessarybut also a method for inverting this mapping relationmust be devised which extends the missing spectralinformation with the use of a first guess wave spec-trum.
The retrieval algorithm used in this work is theimproved MPI scheme presented by Hasselmann etal. (1996). The mapping of an ocean wave spectrumF(k) into an SAR image spectrum P(k) (Hassel-mann and Hasselmann, 1991) is a closed integraltransform in the form
(4)
where exp(–ka2ξ′2) describes an exponential fall-off
of the spectrum beyond an azimuthal cut-offwavenumber. This term can be thought of as a low-pass filter where the information beyond the cut-offis suppressed. The root mean square (rms) azimuthaldisplacement (ξ′) is given by ξ′ = υrβ where β is theratio of the slant range to the platform velocity R/Vand υr is the orbital velocity. Pnm represents theFourier transform of the auto and cross-covariancefunctions of the Real Aperture Radar image intensi-ty and the orbital velocity. The indexes m and n indi-cate the order of nonlinearity with respect to the
P k k Pa am
nmm n
n
n
k k( ) = − ′( ) ( ) ( )= −=
∞
∑∑exp 2 2
2 2
2
1
ξ β
TR
Vkvb a= +( )ω θ φ θsin sin cos2 2 2 1 2
322 N. VIOLANTE-CARVALHO and I.S. ROBINSON
sm68n3317 10/9/04 12:57 Página 322
velocity bunching mechanism and to the input wavespectrum respectively.
The full nonlinear mapping relation may beapproximated by a quasi-linear mapping relationtruncating (4) at n = 1, which is
P(k) � exp(–ka2ξ′2)P1(k). (5)
In the quasi-linear approximation the representa-tion of the azimuthal cut-off term is retained but thenonlinearities in the mapping are not taken intoaccount. The nonlinearities in the mapping mecha-nism cause transfer of energy from high to lowazimuth wavenumbers, which are ignored using (5).
The MPI retrieval is performed in two steps. Thefirst step or inner loop is the inversion of the map-ping relation. An improved estimate of a given firstguess wave spectrum is constructed through theminimisation of a cost function. The second step orouter loop is meant to reduce the spectral gap in theazimuthal cut-off. After the minimisation of the costfunction the wave spectra of both the first guess andthe observed SAR are partitioned into differentwave systems and cross-assigned. The first guesswave systems are modified to conform to theobserved SAR wave spectrum. In the following wediscuss in more detail the two steps performed in theretrieval scheme.
The main idea behind the MPI retrieval schemeis to create a simulated SAR image spectrum from afirst-guess wave spectrum through the mappingrelation P(k) = Φ(F(k) (as specified by Equation 4).This first guess spectrum is compared to theobserved SAR spectrum and the differencesbetween the two spectra are minimised through thefollowing cost function
(6)
The first error term is a function of the deviationbetween the observed SAR spectrum P̂(k) and thefitted SAR spectrum P(k). The second term express-ing the deviations between the first-guess wavespectrum F̂(k) and the optimal fit wave spectrum
F(k) is necessary to solve the 180º directional ambi-guity and to extend the information at highwavenumbers beyond the azimuthal cut-off. Thefactor m is set in order that the first-guess wavespectrum has a small influence in the part of thespectrum where SAR information is available but isgreat enough to solve the directional ambiguity (µ =10–3P̂3
max), and B is a constant to prevent thedenominator from vanishing. The third term inEquation (6) penalises the differences between theclutter cut-off length scale from the observed andsimulated SAR spectrum represented by λ̂cl and λcl.The value of the weighting factor ν is chosen tomake the third error term of the same order of mag-nitude as the first term. To correct the errors in thecut-off, the scale parameter α is applied to the wholespectrum and not only to the low wavenumber partwhere there is SAR information. Hence α also mod-ifies the high wavenumber components that con-tribute to the rms orbital velocities and consequent-ly to the rms azimuthal displacement ξ′. Since λcl isdetermined by ξ′ (both are proportional), a thenaffects λcl, thus reducing the error between theobserved and simulated cut-off.
Hence, the MPI scheme finds a retrieved wavespectrum by minimising a cost function whichdepends on the wave spectrum, the SAR spectrumand the azimuthal cut-off wavenumber. The fullnonlinear mapping relation (4) is used to calculatethe SAR image spectrum from a first-guess wavespectrum. However, the quasi-linear approximation(5) is applied to yield the direction of minimisationof the gradient of the cost function (6). The inver-sion is performed by the minimisation of the costfunction J, which is achieved when the differencebetween two iterations is smaller than a specificvalue, in general after 6-10 iteration steps. The formof the spectrum is modified only up to the pointwhere there is SAR spectral information, andbeyond the cut-off wavenumber it retains the infor-mation from the first-guess wave spectrum. At thispoint an improved estimation of the first-guesswave spectrum is constructed which is used in thenext step.
At every iteration the second step or outer loopreplaces the input spectrum with the wave spectrumderived in the previous cycle. Therefore, the first-guess wave spectrum from the model is used only inthe 0-th cycle, and after the first cycle of the outerloop its information is modified by new informationbased on the SAR image. The main reason for thisadditional loop is to resolve the discontinuities in the
J P P P d
P P
B F Fd
cl cl
cl cl
= ( )− ( )[ ] ( ) +
( )− ( )[ ]+ ( )− ( )[ ]{ }
+
−( ){ }
∫
∫
k k k k
k k
k kk
ˆ ˆ
ˆ
min ˆ
ˆ
max , ˆ
2
2
2
2 22
4 4
µ
ηαλ αλ
λ λ
COMPARISON OF DIRECTIONAL WAVE SPECTRA RETRIEVED FROM SAR IMAGES 323
sm68n3317 10/9/04 12:57 Página 323
vicinity of the cut-off wavenumber once the inversionmodifies the spectrum up to this point. In addition, thesecond loop decouples the retrieval from the WAMfirst guess wave spectrum, implying that the retrieval(in a sense) is independent of the first guess.
The input two-dimensional spectrum is parti-tioned into different wave systems, that is swell,wind sea, old wind sea, each one represented bysome wave parameters: significant wave height,mean frequency, spread width and direction. Theshape of the wave systems does not change and onlythe wave height, mean frequency and direction areadjusted. Thus, the input spectrum maintains thecharacteristics of the original one, but the scales anddirections are adjusted to conform to the observedspectrum. The program cycles five times around theouter loop and the updated spectrum from the previ-ous loop is used as the input spectrum for the inver-sion in the next cycle.
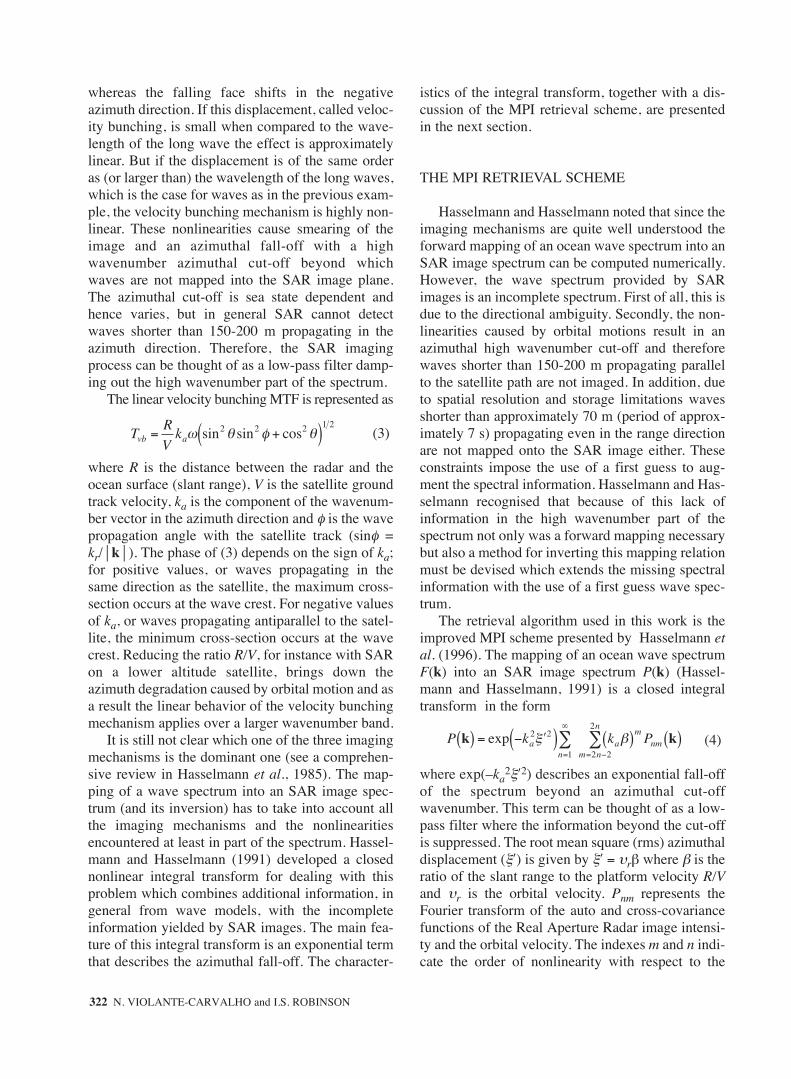
Figure 3 shows one example of the retrieval oper-ation. Panel (a) is the observed SAR image spectrum,whereas panel (b) is the a priori WAM wave spectrumwhich is used as a first guess in the 0-th iteration.Panel (c) is the first simulated SAR spectrum usingthe mapping relation P(k) = f(Φ(k) of the first-guess
wave spectrum (panel (b)). Panels (d) and (e) arerespectively the best simulated SAR spectrum of the0-th iteration and its inverted wave spectrum. Thebest inverted wave spectrum (e) is used as the inputspectrum for the next iteration, and so on. Panel (f) isthe retrieved SAR image spectrum from the iterationwhich yielded the smallest error between theobserved spectrum and the input spectrum.
The MPI retrieval scheme is a complicated algo-rithm. The best way to identify its skill deficienciesand strengths is through comparisons against inde-pendent data. In the following sections the WAMmodel is described together with the in situ observa-tions, and some comparisons are presented ofretrieved ERS-1 SAR spectra against directionalbuoy data.
COLLOCATED DATA SET AND IN SITUOBSERVATIONS
WAM Data
In this work the directional spectra from WAM isused as a first-guess by the MPI retrieval scheme toremove the 180º ambiguity and to augment the wave
324 N. VIOLANTE-CARVALHO and I.S. ROBINSON
FIG. 3. – Example of the retrieval operation using the MPI scheme from 2 October 1994 1248 UT. Panel (a) is the observed SAR image, (b)is the a priori WAM wave spectrum, (c) is the first simulated SAR, (d) is the best simulated SAR of the iteration, (e) is the inverted wavespectrum and finally (f) is the retrieved SAR spectrum. All spectra in wavenumber domain with the x axis indicate azimuth direction,
whereas the y axis indicates range direction.
sm68n3317 10/9/04 12:57 Página 324
spectral information beyond the azimuthal cut-offwavenumber. A brief summary of the main charac-teristics of the third generation WAM model fol-lows, but more detailed information is presented byWAMDI Group (1988); Günther et al. (1992);Komen et al. (1994) and on the web site atw w w. d k r z . d e / f o r s c h u n g / r e p o r t s / r e p o r t 4 /wamh-1.html.
In contrast with second generation wave models,a third generation model such as WAM does notintroduce assumptions about the shape of the spec-trum (SWAMP Group, 1985). The 2D wave spec-trum is determined by the integration of the trans-port equation:
(7)
where F = F(f, θ, φ, λ, t), the two-dimensional wavespectrum is a function of the frequency f, the direc-tion θ on a spherical grid of latitude φ and longitudeλ and
(8)
(9)
(10)
represent the rate of change of the position anddirection along a great circle path for a wave packetin water of infinite depth. The source terms are rep-resented by the wind input (Sin), the nonlinear trans-fer (Snl) and the dissipation term (Sds).
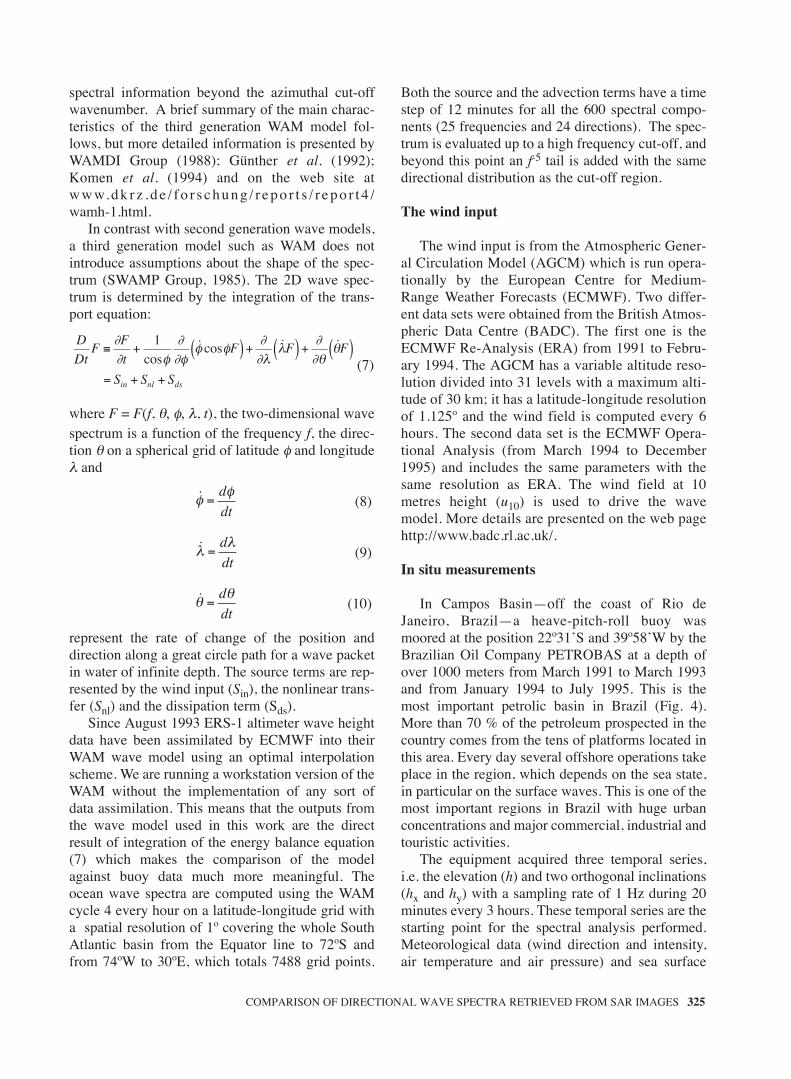
Since August 1993 ERS-1 altimeter wave heightdata have been assimilated by ECMWF into theirWAM wave model using an optimal interpolationscheme. We are running a workstation version of theWAM without the implementation of any sort ofdata assimilation. This means that the outputs fromthe wave model used in this work are the directresult of integration of the energy balance equation(7) which makes the comparison of the modelagainst buoy data much more meaningful. Theocean wave spectra are computed using the WAMcycle 4 every hour on a latitude-longitude grid witha spatial resolution of 1º covering the whole SouthAtlantic basin from the Equator line to 72ºS andfrom 74ºW to 30ºE, which totals 7488 grid points.
Both the source and the advection terms have a timestep of 12 minutes for all the 600 spectral compo-nents (25 frequencies and 24 directions). The spec-trum is evaluated up to a high frequency cut-off, andbeyond this point an f-5 tail is added with the samedirectional distribution as the cut-off region.
The wind input
The wind input is from the Atmospheric Gener-al Circulation Model (AGCM) which is run opera-tionally by the European Centre for Medium-Range Weather Forecasts (ECMWF). Two differ-ent data sets were obtained from the British Atmos-pheric Data Centre (BADC). The first one is theECMWF Re-Analysis (ERA) from 1991 to Febru-ary 1994. The AGCM has a variable altitude reso-lution divided into 31 levels with a maximum alti-tude of 30 km; it has a latitude-longitude resolutionof 1.125º and the wind field is computed every 6hours. The second data set is the ECMWF Opera-tional Analysis (from March 1994 to December1995) and includes the same parameters with thesame resolution as ERA. The wind field at 10metres height (u10) is used to drive the wavemodel. More details are presented on the web pagehttp://www.badc.rl.ac.uk/.
In situ measurements
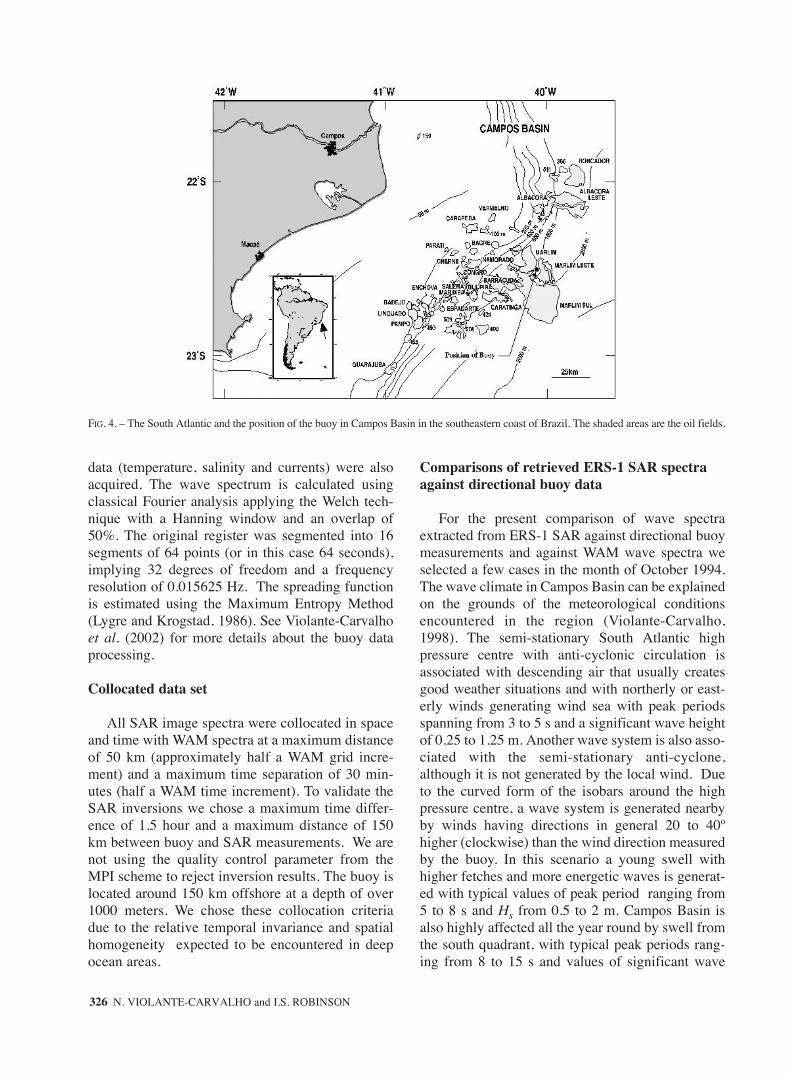
In Campos Basin—off the coast of Rio deJaneiro, Brazil—a heave-pitch-roll buoy wasmoored at the position 22º31’S and 39º58’W by theBrazilian Oil Company PETROBAS at a depth ofover 1000 meters from March 1991 to March 1993and from January 1994 to July 1995. This is themost important petrolic basin in Brazil (Fig. 4).More than 70 % of the petroleum prospected in thecountry comes from the tens of platforms located inthis area. Every day several offshore operations takeplace in the region, which depends on the sea state,in particular on the surface waves. This is one of themost important regions in Brazil with huge urbanconcentrations and major commercial, industrial andtouristic activities.
The equipment acquired three temporal series,i.e. the elevation (h) and two orthogonal inclinations(hx and hy) with a sampling rate of 1 Hz during 20minutes every 3 hours. These temporal series are thestarting point for the spectral analysis performed.Meteorological data (wind direction and intensity,air temperature and air pressure) and sea surface
θ̇θ
=d
dt
λ̇λ
=d
dt
φ̇φ
=d
dt
D
DtF
F
tF F F
S S Sin nl ds
≡ + ( ) + ( ) + ( )= + +
∂∂ φ
∂∂φ
φ φ∂∂λ
λ∂∂θ
θ1
cos˙cos ˙ ˙
COMPARISON OF DIRECTIONAL WAVE SPECTRA RETRIEVED FROM SAR IMAGES 325
sm68n3317 10/9/04 12:57 Página 325
data (temperature, salinity and currents) were alsoacquired. The wave spectrum is calculated usingclassical Fourier analysis applying the Welch tech-nique with a Hanning window and an overlap of50%. The original register was segmented into 16segments of 64 points (or in this case 64 seconds),implying 32 degrees of freedom and a frequencyresolution of 0.015625 Hz. The spreading functionis estimated using the Maximum Entropy Method(Lygre and Krogstad, 1986). See Violante-Carvalhoet al. (2002) for more details about the buoy dataprocessing.
Collocated data set
All SAR image spectra were collocated in spaceand time with WAM spectra at a maximum distanceof 50 km (approximately half a WAM grid incre-ment) and a maximum time separation of 30 min-utes (half a WAM time increment). To validate theSAR inversions we chose a maximum time differ-ence of 1.5 hour and a maximum distance of 150km between buoy and SAR measurements. We arenot using the quality control parameter from theMPI scheme to reject inversion results. The buoy islocated around 150 km offshore at a depth of over1000 meters. We chose these collocation criteriadue to the relative temporal invariance and spatialhomogeneity expected to be encountered in deepocean areas.
Comparisons of retrieved ERS-1 SAR spectraagainst directional buoy data
For the present comparison of wave spectraextracted from ERS-1 SAR against directional buoymeasurements and against WAM wave spectra weselected a few cases in the month of October 1994.The wave climate in Campos Basin can be explainedon the grounds of the meteorological conditionsencountered in the region (Violante-Carvalho,1998). The semi-stationary South Atlantic highpressure centre with anti-cyclonic circulation isassociated with descending air that usually createsgood weather situations and with northerly or east-erly winds generating wind sea with peak periodsspanning from 3 to 5 s and a significant wave heightof 0.25 to 1.25 m. Another wave system is also asso-ciated with the semi-stationary anti-cyclone,although it is not generated by the local wind. Dueto the curved form of the isobars around the highpressure centre, a wave system is generated nearbyby winds having directions in general 20 to 40ºhigher (clockwise) than the wind direction measuredby the buoy. In this scenario a young swell withhigher fetches and more energetic waves is generat-ed with typical values of peak period ranging from5 to 8 s and Hs from 0.5 to 2 m. Campos Basin isalso highly affected all the year round by swell fromthe south quadrant, with typical peak periods rang-ing from 8 to 15 s and values of significant wave
326 N. VIOLANTE-CARVALHO and I.S. ROBINSON
FIG. 4. – The South Atlantic and the position of the buoy in Campos Basin in the southeastern coast of Brazil. The shaded areas are the oil fields.
sm68n3317 10/9/04 12:57 Página 326
height ranging from 0.5 to 2 m. More spatially andtemporarily variable conditions are related to thepassage of cold fronts with turning winds and gusts.However, during this period of the year the goodweather scenario described above is more likely tobe expected with a long swell propagating north-ward (and therefore in the azimuth direction sincethe SAR satellites fly in polar orbits) and a shorter,wind sea component propagating westward (inrange direction).
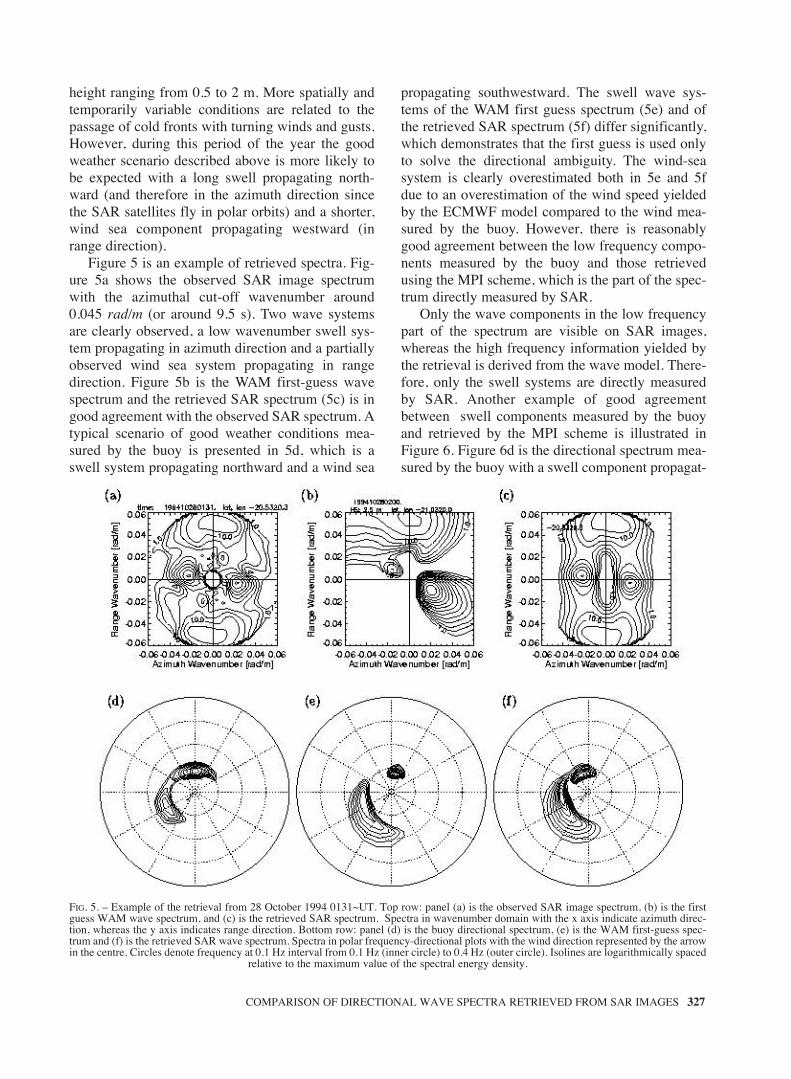
Figure 5 is an example of retrieved spectra. Fig-ure 5a shows the observed SAR image spectrumwith the azimuthal cut-off wavenumber around0.045 rad/m (or around 9.5 s). Two wave systemsare clearly observed, a low wavenumber swell sys-tem propagating in azimuth direction and a partiallyobserved wind sea system propagating in rangedirection. Figure 5b is the WAM first-guess wavespectrum and the retrieved SAR spectrum (5c) is ingood agreement with the observed SAR spectrum. Atypical scenario of good weather conditions mea-sured by the buoy is presented in 5d, which is aswell system propagating northward and a wind sea
propagating southwestward. The swell wave sys-tems of the WAM first guess spectrum (5e) and ofthe retrieved SAR spectrum (5f) differ significantly,which demonstrates that the first guess is used onlyto solve the directional ambiguity. The wind-seasystem is clearly overestimated both in 5e and 5fdue to an overestimation of the wind speed yieldedby the ECMWF model compared to the wind mea-sured by the buoy. However, there is reasonablygood agreement between the low frequency compo-nents measured by the buoy and those retrievedusing the MPI scheme, which is the part of the spec-trum directly measured by SAR.
Only the wave components in the low frequencypart of the spectrum are visible on SAR images,whereas the high frequency information yielded bythe retrieval is derived from the wave model. There-fore, only the swell systems are directly measuredby SAR. Another example of good agreementbetween swell components measured by the buoyand retrieved by the MPI scheme is illustrated inFigure 6. Figure 6d is the directional spectrum mea-sured by the buoy with a swell component propagat-
COMPARISON OF DIRECTIONAL WAVE SPECTRA RETRIEVED FROM SAR IMAGES 327
FIG. 5. – Example of the retrieval from 28 October 1994 0131~UT. Top row: panel (a) is the observed SAR image spectrum, (b) is the firstguess WAM wave spectrum, and (c) is the retrieved SAR spectrum. Spectra in wavenumber domain with the x axis indicate azimuth direc-tion, whereas the y axis indicates range direction. Bottom row: panel (d) is the buoy directional spectrum, (e) is the WAM first-guess spec-trum and (f) is the retrieved SAR wave spectrum. Spectra in polar frequency-directional plots with the wind direction represented by the arrowin the centre. Circles denote frequency at 0.1 Hz interval from 0.1 Hz (inner circle) to 0.4 Hz (outer circle). Isolines are logarithmically spaced
relative to the maximum value of the spectral energy density.
sm68n3317 10/9/04 12:57 Página 327
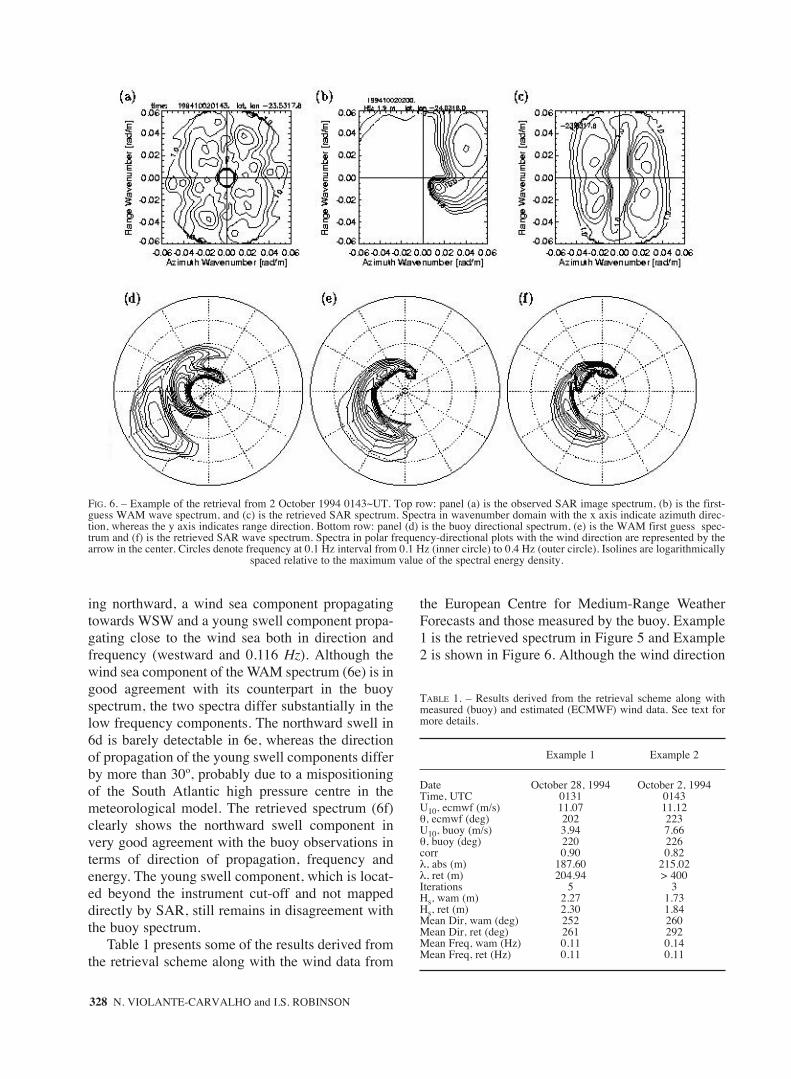
ing northward, a wind sea component propagatingtowards WSW and a young swell component propa-gating close to the wind sea both in direction andfrequency (westward and 0.116 Hz). Although thewind sea component of the WAM spectrum (6e) is ingood agreement with its counterpart in the buoyspectrum, the two spectra differ substantially in thelow frequency components. The northward swell in6d is barely detectable in 6e, whereas the directionof propagation of the young swell components differby more than 30º, probably due to a mispositioningof the South Atlantic high pressure centre in themeteorological model. The retrieved spectrum (6f)clearly shows the northward swell component invery good agreement with the buoy observations interms of direction of propagation, frequency andenergy. The young swell component, which is locat-ed beyond the instrument cut-off and not mappeddirectly by SAR, still remains in disagreement withthe buoy spectrum.
Table 1 presents some of the results derived fromthe retrieval scheme along with the wind data from
the European Centre for Medium-Range WeatherForecasts and those measured by the buoy. Example1 is the retrieved spectrum in Figure 5 and Example2 is shown in Figure 6. Although the wind direction
328 N. VIOLANTE-CARVALHO and I.S. ROBINSON
TABLE 1. – Results derived from the retrieval scheme along withmeasured (buoy) and estimated (ECMWF) wind data. See text formore details.
Example 1 Example 2
Date October 28, 1994 October 2, 1994Time, UTC 0131 0143U10, ecmwf (m/s) 11.07 11.12θ, ecmwf (deg) 202 223U10, buoy (m/s) 3.94 7.66θ, buoy (deg) 220 226corr 0.90 0.82λ, abs (m) 187.60 215.02λ, ret (m) 204.94 > 400Iterations 5 3Hs, wam (m) 2.27 1.73Hs, ret (m) 2.30 1.84Mean Dir, wam (deg) 252 260Mean Dir, ret (deg) 261 292Mean Freq, wam (Hz) 0.11 0.14Mean Freq, ret (Hz) 0.11 0.11
FIG. 6. – Example of the retrieval from 2 October 1994 0143~UT. Top row: panel (a) is the observed SAR image spectrum, (b) is the first-guess WAM wave spectrum, and (c) is the retrieved SAR spectrum. Spectra in wavenumber domain with the x axis indicate azimuth direc-tion, whereas the y axis indicates range direction. Bottom row: panel (d) is the buoy directional spectrum, (e) is the WAM first guess spec-trum and (f) is the retrieved SAR wave spectrum. Spectra in polar frequency-directional plots with the wind direction are represented by thearrow in the center. Circles denote frequency at 0.1 Hz interval from 0.1 Hz (inner circle) to 0.4 Hz (outer circle). Isolines are logarithmically
spaced relative to the maximum value of the spectral energy density.
sm68n3317 10/9/04 12:57 Página 328
estimated from the ECMWF model is close to thatmeasured by the buoy (q, ecmwf and q, buoy), thereis an overestimation of the ECMWF wind speed at10 m height in both examples (U10}}, ecmwf andU10, buoy). The correlation (corr) between theWAM (input) wave spectrum and the retrieved (ret)spectrum is also shown together with the number ofiterations to find the best estimate. The azimuthalcut-off wavelengths observed (l, obs) and retrieved(l, ret) in Example 1 show reasonable results, where-as in Example 2 the cut-off adjustment was notattained. Significant wave height (Hs), mean propa-gation direction (mean~dir) and mean frequency(mean freq) are in close agreement in Example 1,whereas in Example 2 the quality of the retrieval ispoorer with greater disagreement.
These two examples illustrate how the retrievedspectrum may yield useful information on the lowfrequency spectral components. However, the MPIalgorithm is quite complex and a more extensivevalidation with in situ data presently underway willbe necessary to pinpoint its deficiencies and itsstrengths (N. Violante-Carvalho and I. S. Robinson,Validation of ERS-1 SAR wave spectra against oneyear of directional buoy data, manuscript in prepa-ration). Preliminary results show that for periodslonger than 12 seconds (the part of the spectrumobserved by SAR) the MPI method performs betterthan WAM for values of mean direction of propaga-tion and for values of mean frequency. However, forperiods shorter than 12 seconds its performance isworse, even considering the fact that the model isused as a first guess in the MPI scheme.
DISCUSSION
The MPI scheme was the first proposed and mostwidely used algorithm for retrieving directionalwave spectra from SAR images. When it is operatedin the SAR Wave Mode thousands of imagettes areavailable daily in quasi-real time with global andcontinuous coverage. This is a unique data set farbeyond the capabilities of any other operationalwave measurement system, both in terms of spatialand temporal coverage. We discuss in this paper themain strengths and weakneses of the retrievalscheme together with a review of the ocean wave-radar modulation transfer functions.
The retrieval of wave spectra from SAR imagesrequires a first-guess wave spectrum to solve theinherent directional ambiguity of frozen images and
to extend the spectral information beyond the highwavenumber cut-off caused by nonlinearities in theimaging process. Some examples of spectraretrieved with the MPI scheme are compared againstdirectional buoy data and against the model spectraused as a first guess in the inversion. These exam-ples highlight the strengths of the retrieval scheme,that is, the performance of the retrieval is better thanthe performance of the model for long (swell) com-ponents both in terms of direction of propagationand in terms of mean frequency.
This is exactly the compromise that must beachieved: one must stress the strength of one tocompensate for the deficiency of the other. Thirdgeneration wave models such as WAM are known todescribe very well the wind sea part of the spectrum,where there is no information mapped onto SARimages. On the other hand, the low frequency part iscomparatively less well described by wave models,partially due to a poor understanding of the dissipa-tion processes. The low wavenumber part of thespectrum is mapped quasi-linearly onto SAR imagesand hence the wave components are measureddirectly with additional information used only tosolve the direction of propagation.
SAR data provide valuable information but mustbe considered with care because the retrievalschemes need to improve the performance of thewind sea retrieval. The three schemes proposed sofar require a better representation of the highwavenumber part of the spectrum to fill in the spec-tral gap beyond the cut-off. However, as demon-strated in this paper, SAR does in fact yield usefulinformation in the low frequency part of the spec-trum.
ACKNOWLEDGEMENTS
We are grateful to PETROBRAS, the BrazilianOil Company, for making available the buoy data.Violante-Carvalho was supported by the Brazilianresearch funding agency CNPq. Violante-Carvalhoalso acknowledges the support of the EuropeanCOST714 Action, who sponsored the period that hespent as a Visiting Researcher working with DrSusanne Lehner at the German Space Agency(DLR) in Oberpfaffenhofen, Germany. The short-term mission had the aim of solving several techni-cal problems involved in the assimilation of wavedata computed with the retrieval scheme of the Max-Planck Institut.
COMPARISON OF DIRECTIONAL WAVE SPECTRA RETRIEVED FROM SAR IMAGES 329
sm68n3317 10/9/04 12:57 Página 329
REFERENCES
Bauer and Heimbach. – 1999. Annual validation of significant waveheights of ERS-1 Synthetic Aperture Radar wave mode spectrausing TOPEX/Poseidon and ERS-1 altimeter data. J. Geophys.Res., 104(C6)13,345-13,357.
Breivik, L.A., M. Reistad, H. Schyberg, J. Sunde, H.E. Krogstadand H. Johnsen. – 1998. Assimilation of ERS SAR wave spec-tra in an operational wave model. J. Geophys. Res., 103(C4)7887-7900.
Csanady, G.T. – 2001. Air-Sea Interaction. Cambridge UniversityPress. 239 pp.
Donelan, M.A. – 1990. Air-sea interaction. In: B.L. Mehaute andD.M. Haines, editors, The Sea, volume 9 part A, pages 239-292.
Dunlap, E.M., R.B. Olsen, L. Wilson, S.D. Margerie and R. Lalbe-harry. – 1998. The effect of assimilating ERS-1 fast deliverywave data into the north atlantic WAM model. J. Geophys.Res., 103(C4): 7901-7915.
Günther, H., S. Hasselmann and P. Janssen. – 1992. The WAMod-el cycle 4 (revised version). Technical report, Deutsches Kli-marechenzentrum (DKRZ), Hamburg, Germany. Tech. Rep. 4.
Hasselmann, K. and S. Hasselmann. – 1991. On the nonlinear map-ping of an ocean wave spectrum into a Synthetic ApertureRadar image spectrum and its inversion. J. Geophys. Res.,96(C6): 10,713-10,729.
Hasselmann, K., P. Lionello and S. Hasselmann. – 1997. An opti-mal interpolation scheme for the assimilation of spectral wavedata. J. Geophys. Res., 102(C7): 15,823-15,836.
Hasselmann, K., R.K. Raney, W.J. Plant, W.Alpers, R.A. Schuch-man, D.R. Lyzenga, C.L. Rufenach and M.J. Tucker. – 1985.Theory of Synthetic Aperture Radar ocean imaging: AMARSEN view. J. Geophys. Res., 90(C3): 4659-4686.
Hasselmann, S., C. Brüning, K. Hasselmann and P. Heimbach. –1996. An improved algorithm for the retrieval of ocean wavespectra from Synthetic Aperture Radar image spectra. J. Geo-phys. Res., 101(C7): 16,615-16,629.
Heimbach, P., S. Hasselmann and K. Hasselmann. – 1998. Statisti-cal analysis and intercomparison of WAM model data withglobal ERS-1 SAR wave mode spectral retrievals over 3 years.
J. Geophys. Res., 103(C4): 7931-7977.Janssen, P.A.E.M. and P. Viterbo. – 1996. Ocean waves and the
atmospheric climate. J. Climate, 9: 1269-1287.Komen, G.J., L. Cavaleri, M.A. Donelan, K. Hasselmann, S. Has-
selmann and P.A.E.M. Janssen. – 1994. Dynamics and Model-ling of Ocean Waves. Cambridge University Press, GreatBritain. 532 p.
Krogstad, H.E., O. Samset and P.W. Vachon. – 1994. Generaliza-tions of the non-linear ocean-SAR transform and a simplifiedSAR inversion algorithm. Atmosphere-Ocean, 32(1): 61-82.
Lygre, A. and H.E. Krogstad. – 1986. Maximum entropy estimationof the directional distribution in ocean wave spectra. J. Phys.Oceanogr., 16: 2052-2060.
Mastenbroek, C. and C.F. de Valk. – 2000. A semiparametric algo-rithm to retrieve ocean wave spectra from Syntetic ApertureRadar. J. Geophys. Res., 105 (C2): 3497-3516.
Monaldo, F.M. and R.C. Beal. – 1998. Comparison of SIR-C SARwavenumber spectra with WAM model predictions. J. Geo-phys. Res., 103 (C9): 18,815-18,825.
Robinson, I.S. – 1985. Satellite Oceanography. Ellis Horwood Ltd.,Chichester, UK. 455 p.
SWAMP Group. – 1985. Ocean Wave Modeling. Plenum Press,New York (USA). 256 p.
Violante-Carvalho, N. – 1998. Investigation of the Wave Climate inCampos Basin, Rio de Janeiro-Brazil and its Correlation withthe Meteorological Situations -in Portuguese. Master’s thesis,Rio de Janeiro University- COPPE/UFRJ.
Violante-Carvalho, N., C.E. Parente, I.S. Robinson and L.M.P.Nunes. – 2002. On the growth of wind generated waves in aswell dominated region in the South Atlantic. J. Offshore Mech.Arctic Engin., 124: 14-21.
Voorrips, A.C., C. Mastenbroek and B. Hansen. – 2001. Validationof two algorithms to retrieve ocean wave spectra from ERSSynthetic Aperture Radar. J. Geophys. Res., 106(C8): 16,825-16,840.
WAMDI Group. – 1988. The WAM model-a third generation oceanwave prediction model. J. Phys. Oceanogr., 18: 1775-1810.
Scient. ed.: J. Font
330 N. VIOLANTE-CARVALHO and I.S. ROBINSON
sm68n3317 10/9/04 12:57 Página 330