Comparison of the Debye–Huckel and the Mean Spherical...
12
General rights Copyright and moral rights for the publications made accessible in the public portal are retained by the authors and/or other copyright owners and it is a condition of accessing publications that users recognise and abide by the legal requirements associated with these rights. • Users may download and print one copy of any publication from the public portal for the purpose of private study or research. • You may not further distribute the material or use it for any profit-making activity or commercial gain • You may freely distribute the URL identifying the publication in the public portal If you believe that this document breaches copyright please contact us providing details, and we will remove access to the work immediately and investigate your claim. Downloaded from orbit.dtu.dk on: Jun 29, 2018 Comparison of the Debye–Huckel and the Mean Spherical Approximation Theories for Electrolyte Solutions Maribo-Mogensen, Bjørn; Kontogeorgis, Georgios; Thomsen, Kaj Published in: Industrial & Engineering Chemistry Research Link to article, DOI: 10.1021/ie2029943 Publication date: 2012 Document Version Publisher's PDF, also known as Version of record Link back to DTU Orbit Citation (APA): Maribo-Mogensen, B., Kontogeorgis, G. M., & Thomsen, K. (2012). Comparison of the Debye–Huckel and the Mean Spherical Approximation Theories for Electrolyte Solutions. Industrial & Engineering Chemistry Research, 51(14), 5353-5363. DOI: 10.1021/ie2029943
Transcript of Comparison of the Debye–Huckel and the Mean Spherical...
General rights Copyright and moral rights for the publications made accessible in the public portal are retained by the authors and/or other copyright owners and it is a condition of accessing publications that users recognise and abide by the legal requirements associated with these rights.
• Users may download and print one copy of any publication from the public portal for the purpose of private study or research. • You may not further distribute the material or use it for any profit-making activity or commercial gain • You may freely distribute the URL identifying the publication in the public portal
If you believe that this document breaches copyright please contact us providing details, and we will remove access to the work immediately and investigate your claim.
Downloaded from orbit.dtu.dk on: Jun 29, 2018
Comparison of the Debye–Huckel and the Mean Spherical Approximation Theories forElectrolyte Solutions
Maribo-Mogensen, Bjørn; Kontogeorgis, Georgios; Thomsen, Kaj
Published in:Industrial & Engineering Chemistry Research
Link to article, DOI:10.1021/ie2029943
Publication date:2012
Document VersionPublisher's PDF, also known as Version of record
Link back to DTU Orbit
Citation (APA):Maribo-Mogensen, B., Kontogeorgis, G. M., & Thomsen, K. (2012). Comparison of the Debye–Huckel and theMean Spherical Approximation Theories for Electrolyte Solutions. Industrial & Engineering Chemistry Research,51(14), 5353-5363. DOI: 10.1021/ie2029943
Comparison of the Debye−Huckel and the Mean SphericalApproximation Theories for Electrolyte SolutionsBjørn Maribo-Mogensen,* Georgios M. Kontogeorgis, and Kaj Thomsen
Center for Energy Resources Engineering, Department of Chemical and Biochemical Engineering, Technical University of Denmark(DTU), Søltofts Plads, Building 229, 2800 Kgs. Lyngby, Denmark
*S Supporting Information
ABSTRACT: The thermodynamics of electrolyte solutions has been investigated by many scientists throughout the last century.While several theories have been presented, the most popular models for the electrostatic interactions are based on the Debye−Huckel and mean spherical approximation (MSA) theories. In this paper we investigate the differences between the Debye−Huckel and the MSA theories, and comparisons of the numerical results for the Helmholtz energy and its derivatives with respectto temperature, volume and composition are presented. The investigation shows that the nonrestricted primitive MSA theoryperforms similarly to Debye−Huckel, despite the differences in the derivation. We furthermore show that the static permittivity isa key parameter for both models and that in many cases it completely dominates the results obtained from the two models.Consequently, we conclude that the simpler Debye−Huckel theory may be used in connection with electrolyte equations of statewithout loss of accuracy.
■ INTRODUCTIONSolutions containing electrolytes are encountered in many impor-tant industrial processes, such as postcombustion CO2 capture,acid gas scrubbing, purification of proteins and pharmaceuticals,and corrosion in wet gas pipelines.1 To describe the phase equi-librium of mixtures containing electrolytes, it is necessary toaccount for the long-range electrostatic forces between chargedmolecules.1 The thermodynamics of electrolyte solutions hasbeen studied by many researchers by adding the long-rangeelectrostatic forces to an existing model for the short-rangeforces in activity coefficient models such as UNIQUAC2 andNRTL3 and to equations of state such as SRK or CPA4−7 and arange of SAFT models.8−11
The most commonly used models for the electrolyte inter-actions are the Debye−Huckel model12 and the electrostaticpart of the mean spherical approximation (MSA).13,14 Bothmodels use Coulomb’s law to describe the force between twocharges qi and qj:
=π ε ε
F rq q
r( )
14
1 i j
r 0 2 (1)
where qi is the charge of molecule i, εr is the relative staticpermittivity (or dielectric constant), ε0 is the vacuum permittiv-ity, and r is the distance between the two charges. TheCoulombic forces are lowered when the relative static permittiv-ity of the medium increases (e.g., in water with εr = 78 at25 °C) which enables the dissociation of salts. Another funda-mental equation is the electroneutrality condition, that is, thatthe net charge of a system is zero:
∑ ρ =q 0i
i i(2)
where ρi is the density of molecule i. The Debye−Huckelmodel12 was first derived by Debye and Huckel in 1923, from a
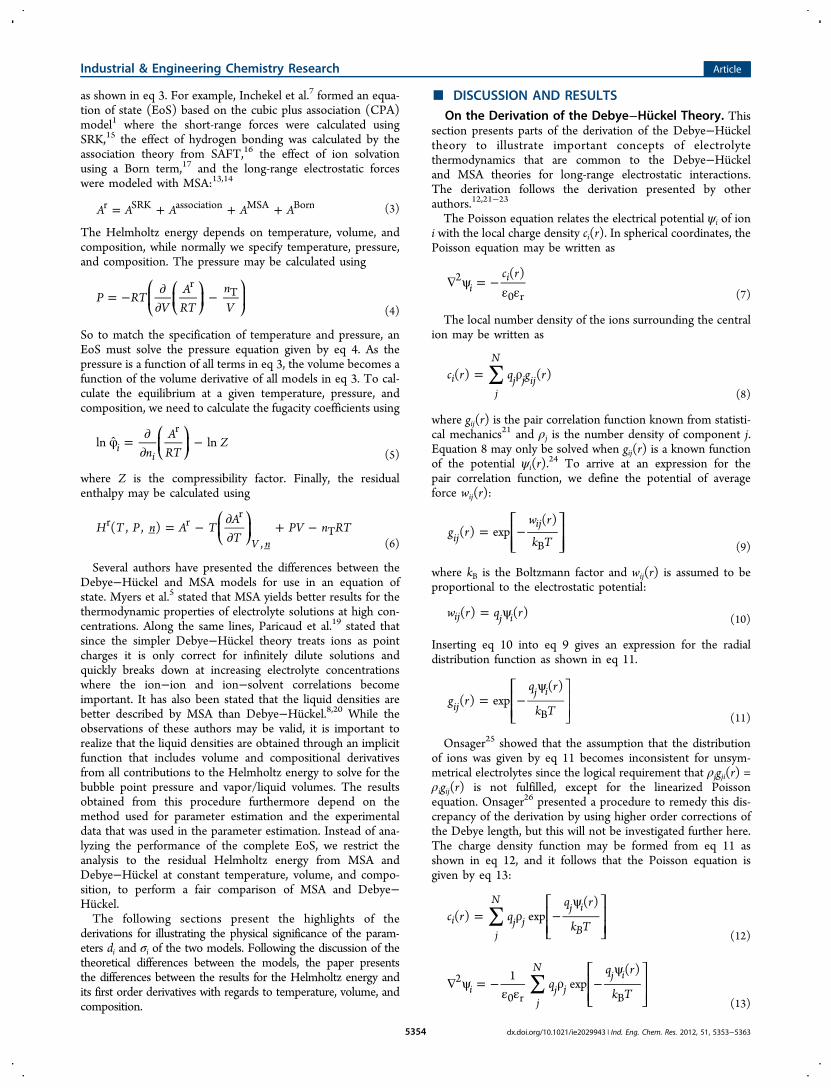
linearization of the Poisson equation and by treating all ions aspoint charges and assuming a minimum distance of di betweenthe ions surrounding a central ion. The nonrestricted primitiveMSA model was developed by Blum13,14 from statistical mech-anics, by treating ions as charged hard spheres of different dia-meters. In the original MSA model, the screening length (2Γ)−1must be solved for numerically as it is done in this work, butseveral simplifications of the MSA theory making it into anexplicit equation of the Helmholtz energy have been presentedin literature.1,8 Figure 1 shows a visual interpretation of theassumptions of the two models.
Equations of state may be derived from the assumption thatthe total residual Helmholtz energy may be determined as asum of the contributions from individual energetic interactions
Received: December 21, 2011Revised: March 6, 2012Accepted: March 8, 2012Published: March 8, 2012
Figure 1. Illustration of the differences between the assumptions ofthe Debye−Huckel and of the MSA model. Debye−Huckel treats ionsas point charges with a minimum separation distance, while MSAtreats all ions as charged hard spheres.
Article
pubs.acs.org/IECR
© 2012 American Chemical Society 5353 dx.doi.org/10.1021/ie2029943 | Ind. Eng. Chem. Res. 2012, 51, 5353−5363
as shown in eq 3. For example, Inchekel et al.7 formed an equa-tion of state (EoS) based on the cubic plus association (CPA)model1 where the short-range forces were calculated usingSRK,15 the effect of hydrogen bonding was calculated by theassociation theory from SAFT,16 the effect of ion solvationusing a Born term,17 and the long-range electrostatic forceswere modeled with MSA:13,14
= + + +A A A A Ar SRK association MSA Born (3)
The Helmholtz energy depends on temperature, volume, andcomposition, while normally we specify temperature, pressure,and composition. The pressure may be calculated using
= − ∂∂
−⎛⎝⎜
⎛⎝⎜
⎞⎠⎟
⎞⎠⎟P RT
VA
RTnV
rT
(4)
So to match the specification of temperature and pressure, anEoS must solve the pressure equation given by eq 4. As thepressure is a function of all terms in eq 3, the volume becomes afunction of the volume derivative of all models in eq 3. To cal-culate the equilibrium at a given temperature, pressure, andcomposition, we need to calculate the fugacity coefficients using
φ = ∂∂
−⎛⎝⎜
⎞⎠⎟n
ART
Zln lnii
r
(5)
where Z is the compressibility factor. Finally, the residualenthalpy may be calculated using
= − ∂∂
+ −
⎛⎝⎜
⎞⎠⎟H T P n A T
AT
PV n RT( , , )V n
r rr
,T
(6)
Several authors have presented the differences between theDebye−Huckel and MSA models for use in an equation ofstate. Myers et al.5 stated that MSA yields better results for thethermodynamic properties of electrolyte solutions at high con-centrations. Along the same lines, Paricaud et al.19 stated thatsince the simpler Debye−Huckel theory treats ions as pointcharges it is only correct for infinitely dilute solutions andquickly breaks down at increasing electrolyte concentrationswhere the ion−ion and ion−solvent correlations becomeimportant. It has also been stated that the liquid densities arebetter described by MSA than Debye−Huckel.8,20 While theobservations of these authors may be valid, it is important torealize that the liquid densities are obtained through an implicitfunction that includes volume and compositional derivativesfrom all contributions to the Helmholtz energy to solve for thebubble point pressure and vapor/liquid volumes. The resultsobtained from this procedure furthermore depend on themethod used for parameter estimation and the experimentaldata that was used in the parameter estimation. Instead of ana-lyzing the performance of the complete EoS, we restrict theanalysis to the residual Helmholtz energy from MSA andDebye−Huckel at constant temperature, volume, and compo-sition, to perform a fair comparison of MSA and Debye−Huckel.The following sections present the highlights of the
derivations for illustrating the physical significance of the param-eters di and σi of the two models. Following the discussion of thetheoretical differences between the models, the paper presentsthe differences between the results for the Helmholtz energy andits first order derivatives with regards to temperature, volume, andcomposition.
■ DISCUSSION AND RESULTS
On the Derivation of the Debye−Huckel Theory. Thissection presents parts of the derivation of the Debye−Huckeltheory to illustrate important concepts of electrolytethermodynamics that are common to the Debye−Huckeland MSA theories for long-range electrostatic interactions.The derivation follows the derivation presented by otherauthors.12,21−23
The Poisson equation relates the electrical potential ψi of ioni with the local charge density ci(r). In spherical coordinates, thePoisson equation may be written as
∇ ψ = −ε εc r( )
ii2
0 r (7)
The local number density of the ions surrounding the centralion may be written as
∑= ρc r q g r( ) ( )ij
N
j j ij(8)
where gij(r) is the pair correlation function known from statisti-cal mechanics21 and ρj is the number density of component j.Equation 8 may only be solved when gij(r) is a known functionof the potential ψi(r).
24 To arrive at an expression for thepair correlation function, we define the potential of averageforce wij(r):
= −⎡⎣⎢⎢
⎤⎦⎥⎥g r
w r
k T( ) exp
( )ij
ij
B (9)
where kB is the Boltzmann factor and wij(r) is assumed to beproportional to the electrostatic potential:
= ψw r q r( ) ( )ij j i (10)
Inserting eq 10 into eq 9 gives an expression for the radialdistribution function as shown in eq 11.
= −ψ⎡
⎣⎢⎢
⎤⎦⎥⎥g r
q r
k T( ) exp
( )ij
j i
B (11)
Onsager25 showed that the assumption that the distributionof ions was given by eq 11 becomes inconsistent for unsym-metrical electrolytes since the logical requirement that ρjgji(r) =ρigij(r) is not fulfilled, except for the linearized Poissonequation. Onsager26 presented a procedure to remedy this dis-crepancy of the derivation by using higher order corrections ofthe Debye length, but this will not be investigated further here.The charge density function may be formed from eq 11 asshown in eq 12, and it follows that the Poisson equation isgiven by eq 13:
∑= ρ −ψ⎡
⎣⎢⎢
⎤⎦⎥⎥c r q
q r
k T( ) exp
( )i
j
N
j jj i
B (12)
∑∇ ψ = −ε ε
ρ −ψ⎡
⎣⎢⎢
⎤⎦⎥⎥q
q r
k T1
exp( )
ij
N
j jj i2
0 r B (13)
Industrial & Engineering Chemistry Research Article
dx.doi.org/10.1021/ie2029943 | Ind. Eng. Chem. Res. 2012, 51, 5353−53635354
By linearizing eq 13 and using the electroneutrality condition,we arrive at
∑∇ ψ = − ρ −ψ⎛
⎝⎜⎜
⎞⎠⎟⎟q
q r
k T1
( )i
j
N
j jj i2
B (14)
Using the electroneutrality condition from eq 2, andintroducing the Debye length κ−1 as shown in eq 15, we arriveat
∑κ =ε ε
ρk T
q1 1
i
N
i i2
B r 0
2
(15)
∇ ψ = κ ψ r( )i i2 2
(16)
Thus, the electrical potential ψi may be deduced by thesolution to eq 16 imposing the boundary conditionslimr→∞ψi(r) = 0 and from the Coulomb potential of the ionas presented in the derivation shown in, for example,McQuarrie21 or Michelsen and Mollerup.22 With both models,the electrostatic potential of a molecule with fractional chargeλqi may be calculated using eq 17:22
ψ = =λ
πε ε + λκr d
q
d d( )
41 1
1i ii
r ij ij0 (17)
The total electrostatic potential at r = dij may be related to theexcess Helmholtz energy using the partial charging process,21,22
where the ion with charge λqi is charged from λ = 0 to 1, aspresented in eq 18 and 19:
∫∑= ψ λ λA n q ( ) di
i i iDH
0
1
(18)
∑= −π ∑
χAk TV
N n zn z
4 i i i ii i i
DH B
A2
2
(19)
where the function χi is given by
χ = + κ − κ + κ⎡⎣⎢
⎤⎦⎥d
d d d1ln(1 )
12
( )ii
i i i32
(20)
The complete derivatives of up to second order are provided inthe book by Michelsen and Mollerup.22
Pitzer27,28 discussed how the hard-core contribution could beincluded in the Debye−Huckel theory using a statisticalmechanical treatment of the osmotic pressure Π givenby eq 21.
∫∑ ∑Π − ρ = − π ρ ρ∂
∂∞ ⎛
⎝⎜⎞⎠⎟k T
u
rg r r r4
6( ) d
i ji j
ijijB 0
3
(21)
Using a potential uij for the hard-core ions given by eq 22,Pitzer27 derived the expression shown in eq 23 by including thethird order Taylor expansion of the radial distribution functiongij from eq 11.
=
∞ <
πε ε≥
⎧⎨⎪⎪
⎩⎪⎪
u
r d
z z e
rr d
4
ij
ij
i jij
2
r 0 (22)
Πρ
− = − κπρ + κ
+ ρ π +π
κρ + κ
⎡⎣⎢⎢
⎤⎦⎥⎥
k T d
d d
d
124 (1 )
23
148 (1 )
i
i
i
B
3
3 4
2 2(23)
As pointed out by Onsager,22 methods that use higherorder terms of the radial distribution function will becomeinconsistent for unsymmetrical electrolytes as the logicalrequirement ρjgji(r) = ρigij(r) is not fulfilled. Pitzer notes thatthe method is consistent for symmetrical electrolytes, andthat the inconsistency for unsymmetrical cases is small. Sincethe model by Pitzer includes the contribution from hard-corerepulsions, it is not suited as a perturbation for the electro-static forces in an EoS, as the EoS already contains terms thataccount for the short-range interactions.
On the Derivation of the MSA Theory. The fundamentaldifference between the derivations of the MSA and the Debye−Huckel theories is that MSA treats the ions as hard-corespherical molecules with diameter σi. This gives rise to anexcluded volume that is inaccessible to other ions leading todifferent expressions for the Helmholtz energy and screeninglength compared to the Debye−Huckel theory.The lengthy derivation of MSA has been presented by
Blum13,14 and will not be repeated here. The final expressionfor the excess internal energy is given by eq 24:
∑Δ = −πε ε
ρΓ + ησ
+ σ Γ
⎡⎣⎢
⎤⎦⎥E
Vez
z4 1
i
N
i ii i
i
MSA2
r 0 (24)
where zi is the charge of the ion, Γ is given by the MSA closureequation from eq 25, and the parameter η is calculated from
∑Γ =ε ε
ρ + σk T
ez N(2 )
1( )
kk k k k
2
B
2
0 r
2
(25)
∑ ∑η =Ω
πΔ
ρ σ+ Γσ
=Ω
πΔ
σ+ Γσ
z NV
n z12 1
12 1
k
k k k
k k
k k k
k
A
(26)
The distance (2Γ)−1 is the MSA equivalent of the screeninglength in the Debye−Huckel theory κ−1, and the auxiliary func-tion Ω is calculated using
∑ ∑Ω = + πΔ
ρ σ+ Γσ
= + πΔ
σ+ Γσ
NV
n1
2 11
2 1k
k k
k k
k k
k
3A
3
(27)
Δ is a measure of the included volume calculated using eq 28and must be strictly positive and larger than ∼0.26 (the face-centered cubic packing factor). Note that this term also in-cludes the contribution from uncharged species in the mixture:
∑ ∑Δ = − π ρ σ = − π σNV
n16
16
kk k
kk k
3 A 3
(28)
The Helmholtz free energy may be calculated using thethermodynamic relation as follows:
∂∂
= Δ−
⎛⎝⎜⎜
⎞⎠⎟⎟
k TAk T
E( )B
1
MSA
B
MSA
(29)
Industrial & Engineering Chemistry Research Article
dx.doi.org/10.1021/ie2029943 | Ind. Eng. Chem. Res. 2012, 51, 5353−53635355
The integration shown in eq 29 cannot be performed directly,but we may use the method by Høye and Stell,29 where theHelmholtz energy may be expressed from
∫= Δ − Γ′ ∂∂Γ′
ΔΓ ⎛⎝⎜⎜
⎞⎠⎟⎟A
k TEk T
EkT
dMSA
B
MSA
B 0
MSA
(30)
Note that taking the derivative of eq 30 with respect to Γ yieldsthe identity in eq 31:
∂∂Γ
=⎛⎝⎜⎜
⎞⎠⎟⎟A
k T0
T V n
MSA
B , , (31)
The solution to the integral in eq 30 gives the surprisinglysimple result
∑= Γπ
−πε ε
× ρΓ + ησ
+ σ Γ
⎡⎣⎢
⎤⎦⎥
Ak T
Vk T
Vez
z3
14 1
i
N
i ii i
i
MSA
B
3
B
2
r 0
(32)
Furthermore, as we have eq 31, we may deduce another form ofeq 25:
∑Γ =ε ε
ρ ∂∂Γ
Γ + ησ+ σ Γ
⎡⎣⎢
⎤⎦⎥k T
e zz
(2 )1
1i
N
i ii i
i
2
B
2
r 0 (33)
The MSA theory has one internal variable Γ which is notknown from explicit relations and must be obtained fromnumerical methods. The Supporting Information contains a fastand robust iterative scheme for solving eq 33 based on secondorder minimization.The Electrostatic Moment Conditions. The solutions to
the four first moments are interesting in terms of analyzing theimportance of the assumptions done in the Debye−Huckeltheory, that is, that the radial distribution function is only afunction of the long-range forces from the electrostaticinteractions. From the Coulombic forces between ions (eq 1)it is possible to derive a set of statistical mechanical momentconditions for electrolytes using the Ornstein−Zernikeequation. A derivation of the moment conditions has beenpresented by, for example, Attard,23 and his results aresummarized in this paper to illustrate that the Debye−Huckeltheory cannot satisfy the fourth moment condition due toneglecting the short-range forces. The zeroth momentcondition is shown in eq 34:
∫∑π ρ = −∞
z r h r r z4 ( ) dk
k k ik i02
(34)
The left-hand side of eq 34 represents integration over all ionsin the vicinity of the central ion. The physical significance of eq34 is that the total charge in the ion cloud surrounding thecentral ion i will be of same magnitude but opposite charge asthe central ion i.14 The second moment is thus the statisticalmechanical equivalent of the electroneutrality condition fromeq 2.The Stillinger-Lovett second moment condition is given by
eq 35:
∫∑ ∑πε ε
ρ ρ × = −∞e
k Tz z r h r r
4( ) d 6
r i ji j i j ik
2
0 B 04
(35)
The physical significance of the Stillinger-Lovett secondmoment is that for finite size ions, a charge oscillation occursin the ionic cloud.23 Note that neither the zeroth nor thesecond moment depend on the short-range interactions.The fourth moment is shown in eq 36:23
= − − −QH Q H C H C I C1
120( )( )(4) (0) (0) (0) (0) (0)
(36)
where the matrix Q is given by eq 37, H(0) is from the first termof the linearization of the indirect correlation function hij(r) ineq 38, and C(0) is from the first term of the linearization ofthe short-range part of the direct correlation function as givenby eq 39
=ρ ρ
ε εk T
q qQ ij
i j i j
B 0 r (37)
= ρ ρ hH r( ) ( )ij i j ij0 1/2 0
(38)
= ρ ρ cC r( ) ( )ij i j ij0 1/2 0
(39)
It is evident that the fourth moment depends on the short-range interactions, represented by C(0). The fourth momentcondition has been related to the partial ionic structure factorsand the isothermal compressibility of the electrolyte.30,31 TheDebye−Huckel theory assumes that the short-range inter-actions are negligible, that is, that C(0) = 0, but the MSAaccounts for the short-range interactions by treating the ions ashard spheres.
On the Relationship between EoS and ActivityCoefficient Models. An EoS will include one of the termsfor the Helmholtz energy from Debye−Huckel (eq 19) or MSA(eq 32) to account for the long-range electrostatic interactions,as a perturbation to the reference EoS. Insofar as the efforts toform a working EoS for mixtures with electrolytes have notresulted in significant improvements over the activity coefficient(or excess Gibbs energy) models for electrolyte systems,1 thissection serves to present the relationship between the expres-sions for the long-range electrostatic forces developed for theDebye−Huckel and MSA theories, and the activity coefficientmodels that are widely used by the industry to predict thermo-dynamic properties of mixtures containing electrolytes.The chemical potential may be determined from the com-
positional derivative of either the Helmholtz or the Gibbs freeenergy:
μ = ∂∂
= ∂∂
≠ ≠
⎛⎝⎜
⎞⎠⎟
⎛⎝⎜
⎞⎠⎟
An
Gni
i T V n i T P n, , , ,j i j i (40)
The chemical potential may be split into two terms from therelation μi = μi
i + μiE, one term corresponding to the ideal
mixture contribution μii, and one term corresponding to the
excess chemical potential μiE. The activity coefficient may then
be obtained from the excess chemical potential using the well-known relation ln γi = μi
E/(RT). The chemical potential may becalculated from either the rational (mole-fraction) or the mola-lity scale, and may furthermore be given as the unsymmetricalactivity coefficient, tending to 1 as the concentration goes tozero. Commonly, activity coefficient models for electrolyte mix-tures use unsymmetrical activity coefficients using the molality
Industrial & Engineering Chemistry Research Article
dx.doi.org/10.1021/ie2029943 | Ind. Eng. Chem. Res. 2012, 51, 5353−53635356
scale for solutes, and the symmetrical rational activity coefficientfor solvents.Debye and Huckel12 originally derived a model for the activity
coefficient from the expression of the excess Helmholtz energyfrom eq 19 by replacing the molar volume and static permittivityby empirical correlations, and using the resulting equation as anexpression for the excess Gibbs energy. This procedure has beenused for activity coefficient models.2,3,36,37 Electrolyte equations ofstate determine the volume from the pressure equation given byeq 4. Primitive electrolyte equations of state4−10,18−20,24 determinethe static permittivity from (semi)-empirical solvent-specific cor-relations while nonprimitive equations of state11 determine thestatic permittivity from dipolar interactions. Common to both theelectrolyte EoS and activity coefficient models is that they includeterms that account for the short-range interactions; activity coef-ficient models determine the short-range forces from local-com-position models as UNIQUAC2 or NRTL,3 or from Pitzer’smodifications of the Debye−Huckel theory to include a hard-core repulsive term shown in eq 23.Numerical Comparison of the Debye−Huckel and
MSA Theories. The previous section introduced the Debye−Huckel and MSA models and showed the major differences bet-ween the assumptions of these two models. It is of interest toinvestigate the numerical differences in the excess Helmholtzenergy to determine the differences between MSA and Debye−Huckel. It was decided to use the same numerical value of theion diameter in MSA as in Debye−Huckel to provide a basis forcomparing the two models, thus in this section, σi will be usedas the symbol for the ion diameter and the distance of closestapproach di. Typical Pauling radii are shown in Table 1.
To obtain the complete picture of the differences betweenthe two models, it was decided to vary the following modelparameters: (i) ion diameter, (ii) ion charge, (iii) temperature,(iv) volume, (v) composition. Additionally, as has been shownby several authors,5,7,18,22,33,34 the relative static permittivity ordielectric constant εr is a function of temperature, volume, andcomposition, and that this dependence is of high importance tothe performance of the electrolyte equation of state. To deter-mine the influence of the static permittivity on the performanceof the two models, the model presented by Michelsen andMollerup22 was implemented. According to this model, therelative static permittivity is calculated using the empiricalexpression
ε = ε ×T V n T E Vn( , , ) ( ) ( , )rrw
(41)
where E(n,V) is an ion correction factor that effectivelyserves to reduce the relative static permittivity. εr
w is the relative
static permittivity of water calculated as a function oftemperature:
ε = ε +β μ
ερ
−ρ⎛
⎝⎜⎜
⎛⎝⎜
⎞⎠⎟⎞⎠⎟⎟T T
Nk
T
T
T
T( )
2
( ) ( )Arw
rw,0
01 w
2
B 0
w w 0
0
(42)
where T0 = 273.15 K is the reference temperature, εrw,0 = 87.82
is the relative static permittivity at T0, μw = 8.33 × 10⁻³⁰ C·m isthe dipole moment of water in vacuum, NA is the Avogadronumber, and β1 = 3.1306 is a fitting constant. The density ofwater ρw(T) was calculated using
ρ = ρ + ω − + ω − ωT T T T T( ) ( ) ( )w 0 1 0 2 0 3 (43)
where ρ0 = 0.99984 kg/L, ω1 = 1.51782 × 10⁻⁴ kg/(L·K), ω2 =−4.50573 × 10⁻⁵ kg/(L·Kω3) and ω3 = 1.55.The E-factor is given by
∑= + β −α+ β
⎛⎝⎜⎜
⎞⎠⎟⎟E V c
cc
n( , ) 11
kk
k k
k
ions
32 (44)
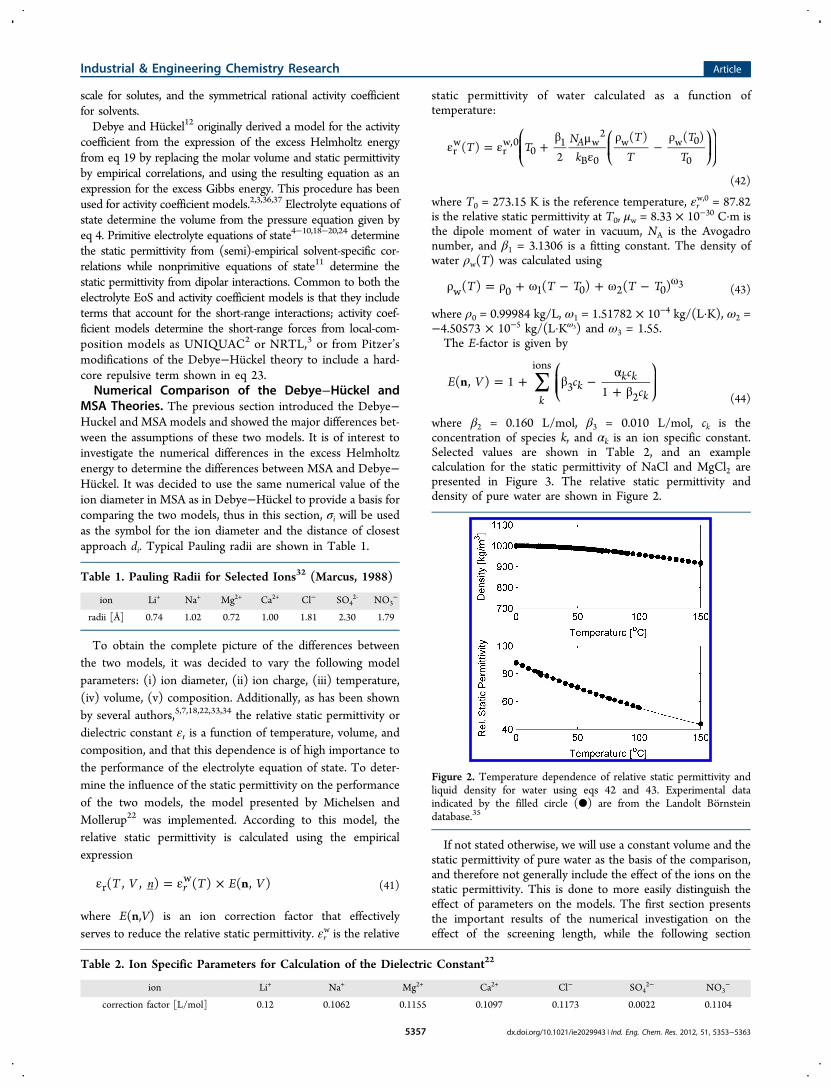
where β2 = 0.160 L/mol, β3 = 0.010 L/mol, ck is theconcentration of species k, and αk is an ion specific constant.Selected values are shown in Table 2, and an examplecalculation for the static permittivity of NaCl and MgCl2 arepresented in Figure 3. The relative static permittivity anddensity of pure water are shown in Figure 2.
If not stated otherwise, we will use a constant volume and thestatic permittivity of pure water as the basis of the comparison,and therefore not generally include the effect of the ions on thestatic permittivity. This is done to more easily distinguish theeffect of parameters on the models. The first section presentsthe important results of the numerical investigation on theeffect of the screening length, while the following section
Table 1. Pauling Radii for Selected Ions32 (Marcus, 1988)
ion Li+ Na+ Mg2+ Ca2+ Cl− SO42‑ NO3
−
radii [Å] 0.74 1.02 0.72 1.00 1.81 2.30 1.79
Table 2. Ion Specific Parameters for Calculation of the Dielectric Constant22
ion Li+ Na+ Mg2+ Ca2+ Cl− SO42− NO3
−
correction factor [L/mol] 0.12 0.1062 0.1155 0.1097 0.1173 0.0022 0.1104
Figure 2. Temperature dependence of relative static permittivity andliquid density for water using eqs 42 and 43. Experimental dataindicated by the filled circle (●) are from the Landolt Bornsteindatabase.35
Industrial & Engineering Chemistry Research Article
dx.doi.org/10.1021/ie2029943 | Ind. Eng. Chem. Res. 2012, 51, 5353−53635357
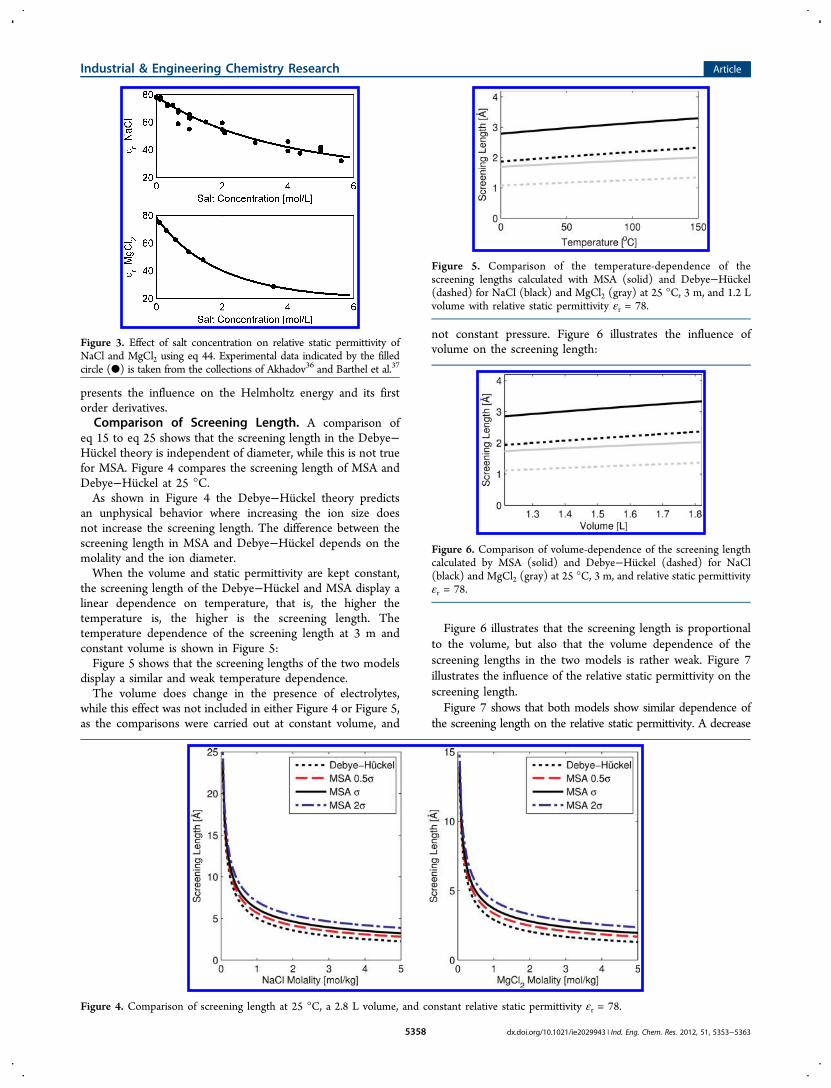
presents the influence on the Helmholtz energy and its firstorder derivatives.Comparison of Screening Length. A comparison of
eq 15 to eq 25 shows that the screening length in the Debye−Huckel theory is independent of diameter, while this is not truefor MSA. Figure 4 compares the screening length of MSA andDebye−Huckel at 25 °C.As shown in Figure 4 the Debye−Huckel theory predicts
an unphysical behavior where increasing the ion size doesnot increase the screening length. The difference between thescreening length in MSA and Debye−Huckel depends on themolality and the ion diameter.When the volume and static permittivity are kept constant,
the screening length of the Debye−Huckel and MSA display alinear dependence on temperature, that is, the higher thetemperature is, the higher is the screening length. Thetemperature dependence of the screening length at 3 m andconstant volume is shown in Figure 5:Figure 5 shows that the screening lengths of the two models
display a similar and weak temperature dependence.The volume does change in the presence of electrolytes,
while this effect was not included in either Figure 4 or Figure 5,as the comparisons were carried out at constant volume, and
not constant pressure. Figure 6 illustrates the influence ofvolume on the screening length:
Figure 6 illustrates that the screening length is proportionalto the volume, but also that the volume dependence of thescreening lengths in the two models is rather weak. Figure 7illustrates the influence of the relative static permittivity on thescreening length.Figure 7 shows that both models show similar dependence of
the screening length on the relative static permittivity. A decrease
Figure 3. Effect of salt concentration on relative static permittivity ofNaCl and MgCl2 using eq 44. Experimental data indicated by the filledcircle (●) is taken from the collections of Akhadov36 and Barthel et al.37
Figure 4. Comparison of screening length at 25 °C, a 2.8 L volume, and constant relative static permittivity εr = 78.
Figure 5. Comparison of the temperature-dependence of thescreening lengths calculated with MSA (solid) and Debye−Huckel(dashed) for NaCl (black) and MgCl2 (gray) at 25 °C, 3 m, and 1.2 Lvolume with relative static permittivity εr = 78.
Figure 6. Comparison of volume-dependence of the screening lengthcalculated by MSA (solid) and Debye−Huckel (dashed) for NaCl(black) and MgCl2 (gray) at 25 °C, 3 m, and relative static permittivityεr = 78.
Industrial & Engineering Chemistry Research Article
dx.doi.org/10.1021/ie2029943 | Ind. Eng. Chem. Res. 2012, 51, 5353−53635358
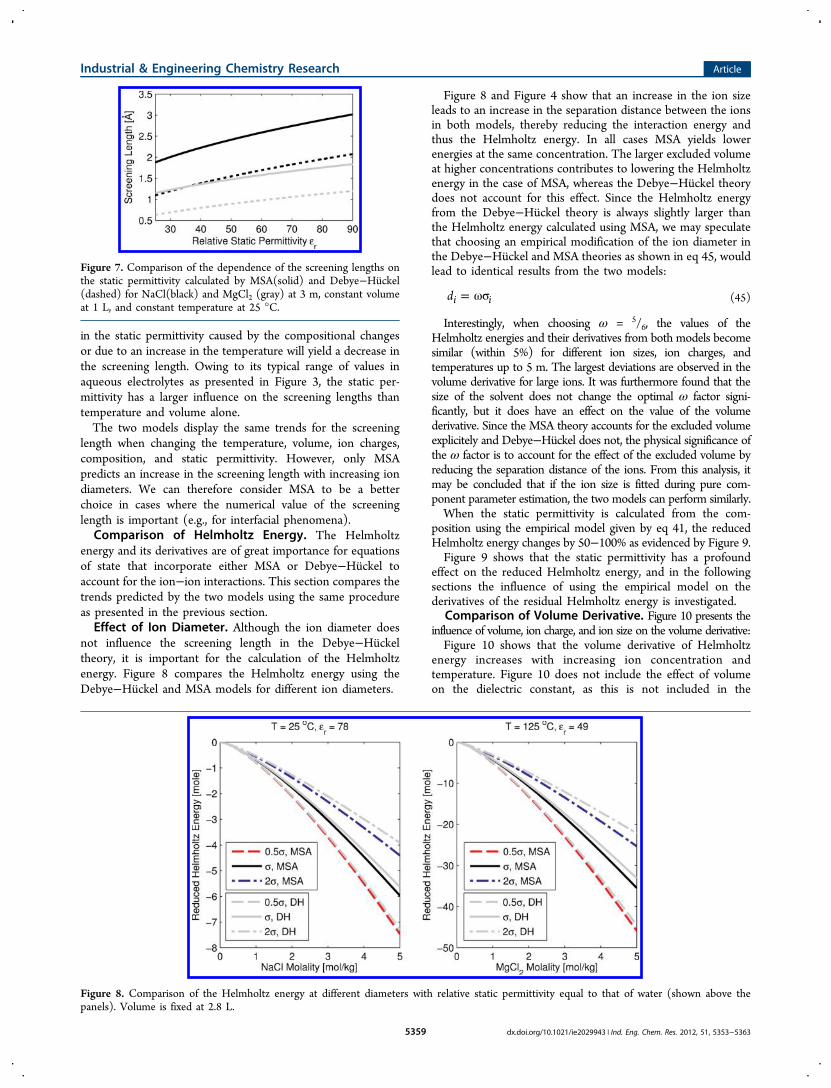
in the static permittivity caused by the compositional changesor due to an increase in the temperature will yield a decrease inthe screening length. Owing to its typical range of values inaqueous electrolytes as presented in Figure 3, the static per-mittivity has a larger influence on the screening lengths thantemperature and volume alone.The two models display the same trends for the screening
length when changing the temperature, volume, ion charges,composition, and static permittivity. However, only MSApredicts an increase in the screening length with increasing iondiameters. We can therefore consider MSA to be a betterchoice in cases where the numerical value of the screeninglength is important (e.g., for interfacial phenomena).Comparison of Helmholtz Energy. The Helmholtz
energy and its derivatives are of great importance for equationsof state that incorporate either MSA or Debye−Huckel toaccount for the ion−ion interactions. This section compares thetrends predicted by the two models using the same procedureas presented in the previous section.Effect of Ion Diameter. Although the ion diameter does
not influence the screening length in the Debye−Huckeltheory, it is important for the calculation of the Helmholtzenergy. Figure 8 compares the Helmholtz energy using theDebye−Huckel and MSA models for different ion diameters.
Figure 8 and Figure 4 show that an increase in the ion sizeleads to an increase in the separation distance between the ionsin both models, thereby reducing the interaction energy andthus the Helmholtz energy. In all cases MSA yields lowerenergies at the same concentration. The larger excluded volumeat higher concentrations contributes to lowering the Helmholtzenergy in the case of MSA, whereas the Debye−Huckel theorydoes not account for this effect. Since the Helmholtz energyfrom the Debye−Huckel theory is always slightly larger thanthe Helmholtz energy calculated using MSA, we may speculatethat choosing an empirical modification of the ion diameter inthe Debye−Huckel and MSA theories as shown in eq 45, wouldlead to identical results from the two models:
= ωσdi i (45)
Interestingly, when choosing ω = 5/6, the values of theHelmholtz energies and their derivatives from both models becomesimilar (within 5%) for different ion sizes, ion charges, andtemperatures up to 5 m. The largest deviations are observed in thevolume derivative for large ions. It was furthermore found that thesize of the solvent does not change the optimal ω factor signi-ficantly, but it does have an effect on the value of the volumederivative. Since the MSA theory accounts for the excluded volumeexplicitely and Debye−Huckel does not, the physical significance ofthe ω factor is to account for the effect of the excluded volume byreducing the separation distance of the ions. From this analysis, itmay be concluded that if the ion size is fitted during pure com-ponent parameter estimation, the two models can perform similarly.When the static permittivity is calculated from the com-
position using the empirical model given by eq 41, the reducedHelmholtz energy changes by 50−100% as evidenced by Figure 9.Figure 9 shows that the static permittivity has a profound
effect on the reduced Helmholtz energy, and in the followingsections the influence of using the empirical model on thederivatives of the residual Helmholtz energy is investigated.
Comparison of Volume Derivative. Figure 10 presents theinfluence of volume, ion charge, and ion size on the volume derivative:Figure 10 shows that the volume derivative of Helmholtz
energy increases with increasing ion concentration andtemperature. Figure 10 does not include the effect of volumeon the dielectric constant, as this is not included in the
Figure 7. Comparison of the dependence of the screening lengths onthe static permittivity calculated by MSA(solid) and Debye−Huckel(dashed) for NaCl(black) and MgCl2 (gray) at 3 m, constant volumeat 1 L, and constant temperature at 25 °C.
Figure 8. Comparison of the Helmholtz energy at different diameters with relative static permittivity equal to that of water (shown above thepanels). Volume is fixed at 2.8 L.
Industrial & Engineering Chemistry Research Article
dx.doi.org/10.1021/ie2029943 | Ind. Eng. Chem. Res. 2012, 51, 5353−53635359

empirical model for the static permittivity of pure water givenby eq 42. However, if we would use the model for the static
permittivity given by eq 41 the volume derivatives are affectedas shown in Figure 11.
Figure 9. Comparison of the Helmholtz energy at different diameters with composition dependent static permittivity. Volume is fixed at 2.8 L.
Figure 10. Comparison of the volume derivative of Helmholtz energy at different diameters at constant temperature and relative static permittivity(shown above the figure). Volume is fixed at 2.8 L.
Figure 11. Comparison of the volume derivative of Helmholtz energy when eq 41 is used to model the relative static permittivity. Volume is fixed at 2.8 L.
Industrial & Engineering Chemistry Research Article
dx.doi.org/10.1021/ie2029943 | Ind. Eng. Chem. Res. 2012, 51, 5353−53635360
As the volume derivative is inversely dependent on the staticpermittivity, the reduction of εr due to the presence of saltsserves to increase the volume derivative. Additionally a volumedependency is introduced through the E(n,V) correctionfunction given by eq 44. Figure 11 illustrates that accountingfor the effect of salts has a substantial effect on the volumederivative. However, the result shown in Figure 11 is notnecessarily the correct physical behavior, but rather a result offitting the empirical model parameters to concentration data(see eq 44). If the correction factor was depending on molalityor mole fractions rather than concentrations, the volumedependency would become zero, which would influenced thebehavior shown in Figure 11. Extreme care should be exercisedwhen using empirical correlations for the static permittivity, asthey may end up including a nonphysical behavior of theHelmholtz energy expression of the electrostatic models. It isconsidered of high importance to have a model for thepermittivity that not only fits the data but actually resemblesthe correct physical dependence on temperature, volume, andcomposition.
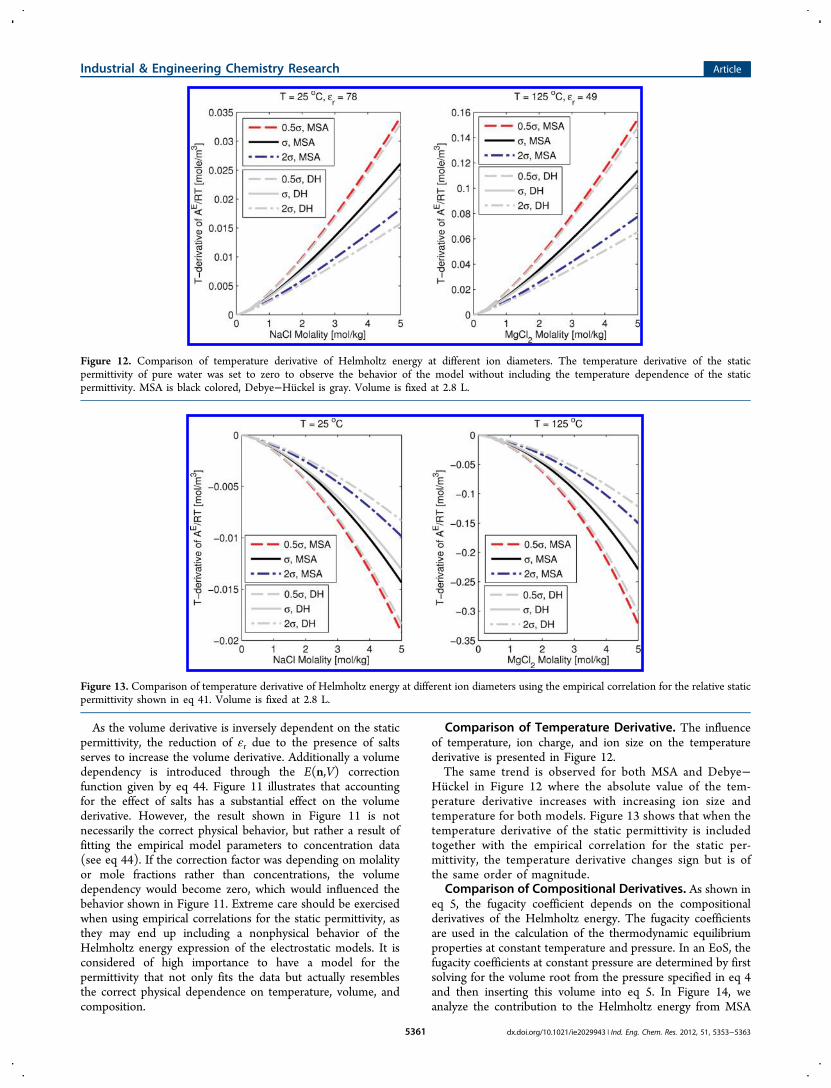
Comparison of Temperature Derivative. The influenceof temperature, ion charge, and ion size on the temperaturederivative is presented in Figure 12.The same trend is observed for both MSA and Debye−
Huckel in Figure 12 where the absolute value of the tem-perature derivative increases with increasing ion size andtemperature for both models. Figure 13 shows that when thetemperature derivative of the static permittivity is includedtogether with the empirical correlation for the static per-mittivity, the temperature derivative changes sign but is ofthe same order of magnitude.
Comparison of Compositional Derivatives. As shown ineq 5, the fugacity coefficient depends on the compositionalderivatives of the Helmholtz energy. The fugacity coefficientsare used in the calculation of the thermodynamic equilibriumproperties at constant temperature and pressure. In an EoS, thefugacity coefficients at constant pressure are determined by firstsolving for the volume root from the pressure specified in eq 4and then inserting this volume into eq 5. In Figure 14, weanalyze the contribution to the Helmholtz energy from MSA
Figure 12. Comparison of temperature derivative of Helmholtz energy at different ion diameters. The temperature derivative of the staticpermittivity of pure water was set to zero to observe the behavior of the model without including the temperature dependence of the staticpermittivity. MSA is black colored, Debye−Huckel is gray. Volume is fixed at 2.8 L.
Figure 13. Comparison of temperature derivative of Helmholtz energy at different ion diameters using the empirical correlation for the relative staticpermittivity shown in eq 41. Volume is fixed at 2.8 L.
Industrial & Engineering Chemistry Research Article
dx.doi.org/10.1021/ie2029943 | Ind. Eng. Chem. Res. 2012, 51, 5353−53635361
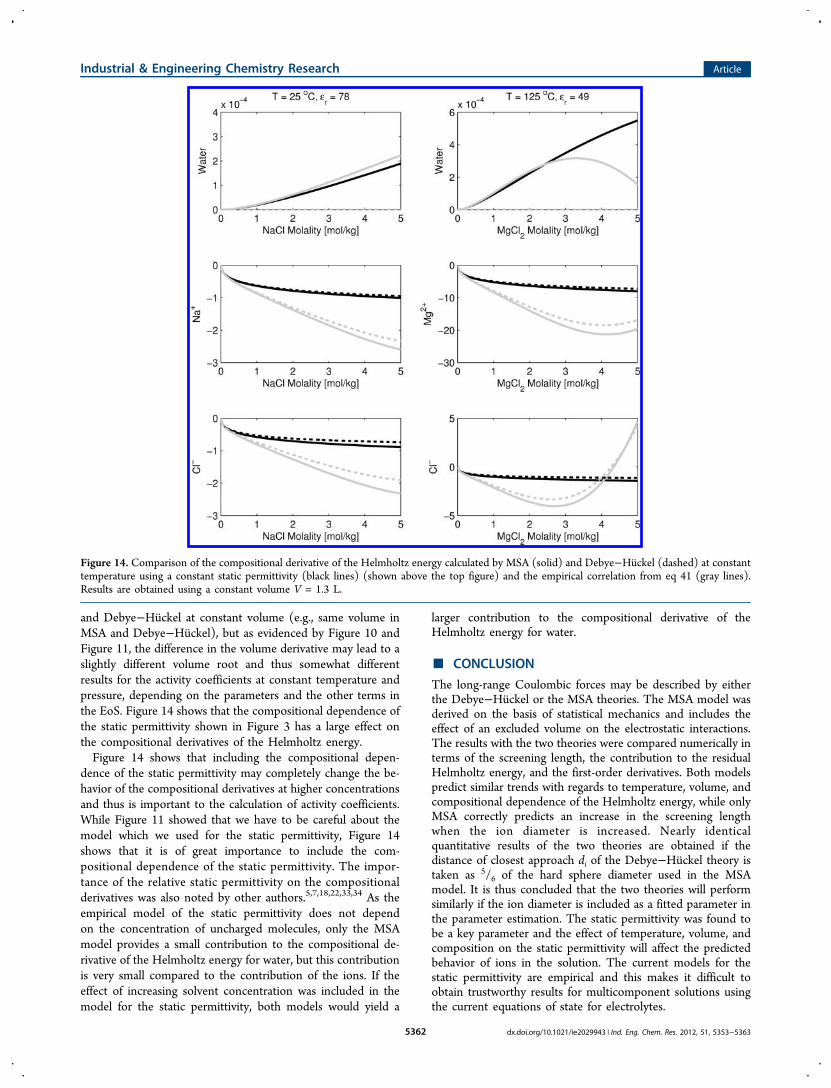
and Debye−Huckel at constant volume (e.g., same volume inMSA and Debye−Huckel), but as evidenced by Figure 10 andFigure 11, the difference in the volume derivative may lead to aslightly different volume root and thus somewhat differentresults for the activity coefficients at constant temperature andpressure, depending on the parameters and the other terms inthe EoS. Figure 14 shows that the compositional dependence ofthe static permittivity shown in Figure 3 has a large effect onthe compositional derivatives of the Helmholtz energy.Figure 14 shows that including the compositional depen-
dence of the static permittivity may completely change the be-havior of the compositional derivatives at higher concentrationsand thus is important to the calculation of activity coefficients.While Figure 11 showed that we have to be careful about themodel which we used for the static permittivity, Figure 14shows that it is of great importance to include the com-positional dependence of the static permittivity. The impor-tance of the relative static permittivity on the compositionalderivatives was also noted by other authors.5,7,18,22,33,34 As theempirical model of the static permittivity does not dependon the concentration of uncharged molecules, only the MSAmodel provides a small contribution to the compositional de-rivative of the Helmholtz energy for water, but this contributionis very small compared to the contribution of the ions. If theeffect of increasing solvent concentration was included in themodel for the static permittivity, both models would yield a
larger contribution to the compositional derivative of theHelmholtz energy for water.
■ CONCLUSION
The long-range Coulombic forces may be described by eitherthe Debye−Huckel or the MSA theories. The MSA model wasderived on the basis of statistical mechanics and includes theeffect of an excluded volume on the electrostatic interactions.The results with the two theories were compared numerically interms of the screening length, the contribution to the residualHelmholtz energy, and the first-order derivatives. Both modelspredict similar trends with regards to temperature, volume, andcompositional dependence of the Helmholtz energy, while onlyMSA correctly predicts an increase in the screening lengthwhen the ion diameter is increased. Nearly identicalquantitative results of the two theories are obtained if thedistance of closest approach di of the Debye−Huckel theory istaken as 5/6 of the hard sphere diameter used in the MSAmodel. It is thus concluded that the two theories will performsimilarly if the ion diameter is included as a fitted parameter inthe parameter estimation. The static permittivity was found tobe a key parameter and the effect of temperature, volume, andcomposition on the static permittivity will affect the predictedbehavior of ions in the solution. The current models for thestatic permittivity are empirical and this makes it difficult toobtain trustworthy results for multicomponent solutions usingthe current equations of state for electrolytes.
Figure 14. Comparison of the compositional derivative of the Helmholtz energy calculated by MSA (solid) and Debye−Huckel (dashed) at constanttemperature using a constant static permittivity (black lines) (shown above the top figure) and the empirical correlation from eq 41 (gray lines).Results are obtained using a constant volume V = 1.3 L.
Industrial & Engineering Chemistry Research Article
dx.doi.org/10.1021/ie2029943 | Ind. Eng. Chem. Res. 2012, 51, 5353−53635362

■ ASSOCIATED CONTENT
*S Supporting InformationNumerical solution procedure for fast and robust solution ofthe implicit mean spherical approximation equations. Thismaterial is available free of charge via the Internet at http://pubs.acs.org.
■ AUTHOR INFORMATION
Corresponding Author*E-mail: [email protected]. Tel.: +45 45252869. Fax: +4545882258.
NotesThe authors declare no competing financial interest.
■ ACKNOWLEDGMENTSThe authors thank the Department of Chemical andBiochemical Engineering, DTU, and the CHIGP Consortium(Statoil, Mærsk Oil & Gas, DONG Energy, BP, GASSCO) forfunding this research.
■ REFERENCES(1) Kontogeorgis, G. M.; Folas, G. K. Thermodynamic Models forIndustrial Applications: From Classical and Advanced Mixing Rules toAssociation Theories; Wiley: New York, 2010; ISBN: 978-0-470-69726-9.(2) Thomsen, K; Rasmussen, P. Modeling of vapor−liquid−solidequilibrium in gas−aqueous electrolyte systems. Chem. Eng. Sci. 1999,54, 1787.(3) Chen, C. C.; Evans, L. B. A local composition model for theexcess Gibbs energy of aqueous electrolyte systems. AIChE J. 1986, 32,444.(4) Furst, W; Renon, H. Representation of excess properties ofelectrolyte solutions using a new equation of state. AIChE J. 1993, 39(2), 335.(5) Myers, J. A.; Sandler, S. I.; Wood, R. H. An equation of state forelectrolyte solutions covering wide ranges of temperature, pressure,and composition. Ind. Eng. Chem. Res. 2002, 41, 3282−3297.(6) Lin, Y.; Thomsen, K.; de Hemptinne, J.-C. Multicomponentequations of state for electrolytes. AIChE J. 2007, 53 (4), 989.(7) Inchekel, R.; de Hemptinne, J-C; Furst, W The simultaneousrepresentation of dielectric constant, volume and activity coefficientsusing an electrolyte equation of state. Fluid Phase Equilib. 2008, 271(1−2), 19−27.(8) Galindo, A.; Gil-Villegas, A.; Jackson, G.; Burgess, A. N. SAFT-VRE: Phase behavior of electrolyte solutions with the statisticalassociating fluid theory for potentials of variable range. J. Phys. Chem. B1999, 103, 10272.(9) Cameretti, L. F.; Sadowski, G.; Mollerup, J. M. Modeling ofaqueous electrolyte solutions with perturbed-chain statistical asso-ciated fluid theory. Ind. Eng. Chem. Res. 2005, 44, 3355−3362.(10) Tan, S. P.; Adidharma, H.; Radosz, M. Statistical associatingfluid theory coupled with restricted primitive model to representaqueous strong electrolytes. Ind. Eng. Chem. Res. 2005, No. 44, 4442−445.(11) Zhao, H.; dos Ramos, M. C.; McCabe, C. Development of anequation of state for electrolyte solutions by combining the statisticalassociating fluid theory and the mean spherical approximation for thenonprimitive model. J. Chem. Phys. 2007, 126, 244503−17.(12) Debye, P.; Huckel, E. Zur theorie der elektrolyte. Phys. Z. 1923,24, 179−207.(13) Blum, L. Mean spherical model for asymmetric electrolytes. Mol.Phys. 1975, 30 (5), 1529−1535.(14) Blum, L. In Theoretical Chemistry: Advances and Perspectives;Academic Press Inc, 1980; Vol. 5, pp 1−65, ISBN: 9780126819052.(15) Soave, G Equilibrium constants from a modified Redlich−Kwong equation of state. Chem. Eng. Sci. 1972, 1197.
(16) Chapman, W. G.; Gubbins, K. E.; Jackson, G.; Radosz, M. Newreference equation of state for associating liquids. Ind. Eng. Chem. Res.1990, 29, 1709.(17) Born, M. Volumen und Hydrationswarme der Ionen. Z. Phys.1920, 1 (1), 45.(18) Raatschen, W.; Harvey, A. H.; Prausnitz, J. M. Equation of statefor solutions of electrolytes in mixed solvents. Fluid Phase Equilib.1987, 38, 19−38.(19) Paricaud, P.; Galindo, A.; Jackson, G. Recent advances in the useof the SAFT approach in describing electrolytes, interfaces, liquidcrystals and polymers. Fluid Phase Equilib. 2002, 194−197, 87−96.(20) Patel, B. H.; Paricaud, P.; Galindo, A.; Maitland, G. C.Prediction of the salting-out effect of strong electrolytes on water +alkane solutions. Ind. Eng. Chem. Res. 2003, 42 (16), 3809−3823.(21) McQuarrie, D. Statistical Mechanics; University Science Books:Sausalito, CA, 2000; ISBN: 1-891389-15-7.(22) Michelsen, M. L.; Mollerup, J. M. Thermodynamic Models:Fundamentals & Computational Aspects; Tie-Line Publications: Holte,Denmark, 2007; ISBN 87-989961-3-4.(23) Attard, P. Asymptotic analysis of primitive model electrolytesand the electrical double layer. Phys. Rev. E 1993, 48 (5), 3604−3618.(24) Loehe, J. R.; Donohue, M. D. Recent advances in modelingthermodynamic properties of aqueous strong electrolyte systems.AIChE J. 1997, 43 (1), 180−195.(25) Onsager, L. Theories of concentrated electrolytes. Chem. Rev.1933, 18, 73.(26) Onsager, L. A Correction to the Poisson−Boltzmann equationfor unsymmetrical electrolytes. J. Am. Chem. Soc. 1964, 86 (17), 3421−3423.(27) Pitzer, K. S. Thermodynamics of electrolytes, theoretical basisand general equations, J. Phys. Chem., 1973, 77 (2)(28) Pitzer, K. S. Thermodynamics, 3rd ed.; McGraw-Hill: New York,1995; ISBN 0-07050221-8.(29) Høye, J. S.; Stell, G. Thermodynamics of the MSA for simplefluids. J. Chem. Phys. 1977, 67, 439.(30) Giaquinta, P. V.; Parrinello, M.; Tosi, M. P. Hydrodynamiccorrelation functions for molten salts. Phys. Chem. Liq. 1976, 5, 305.(31) Vieillefosse, P. Fluctuations de charge et de masse dans un selfondu binaire a la limite hydrodynamique. J. Phys. Lett. (Paris) 1977,38, L43.(32) Marcus, Y. Ionic radii in aqueous solutions. Chem. Rev. 1988, 88,1475−1498.(33) Wu, J.; Prausnitz, J. M. Ind. Eng. Chem. Res. 1998, 37, 1634−1643.(34) Simon, H.; Kistenmacher, H.; Prausnitz, J. M.; Vortmeyer, D.Chem. Eng. Process. 1991, 29, 139−146.(35) Springer Materials, The Landolt Bornstein Database; 2011, http://www.springermaterials.com (September 1, 2011).(36) Akhadov, Y. Y. Dielectric Properties of Binary Solutions: A DataHandbook; Elsevier: New York, 1980; ISBN 978-0080236001.(37) Barthel, J.; Buchner, R.; Munsterer, M. Electrolyte DataCollection, Part 2: Dielectric Properties of Water and Aqueous ElectrolyteSolutions; Dechema: Frankfurt, Germany, 1995; ISBN 3-926959-62-2.
■ NOTE ADDED AFTER ASAP PUBLICATIONAfter this paper was published online March 30, 2012, severalminor corrections were made to the text. The corrected versionwas reposted April 3, 2012.
Industrial & Engineering Chemistry Research Article
dx.doi.org/10.1021/ie2029943 | Ind. Eng. Chem. Res. 2012, 51, 5353−53635363


![nqxZ fo'ofo|ky;] nqxZ ¼N-x-½ - durguniversity.ac.indurguniversity.ac.in/Uploads/MSC Chemistry syllabus corrected FINAL... · Duhem equation, variation of ... Debye-Huckel Onsager](https://static.fdocuments.us/doc/165x107/5af1df977f8b9a572b915073/nqxz-foofoky-nqxz-n-x-chemistry-syllabus-corrected-finalduhem-equation.jpg)