Comparison of different actuation modes of a biomechanical...
11
The 5 th Joint International Conference on Multibody System Dynamics June 24 –28, 2018, Lisbon, Portugal Comparison of different actuation modes of a biomechanical human arm model in an optimal control framework Marius Obentheuer 1,2 , Michael Roller 1 , Staffan Björkenstam 3 , Karsten Berns 2 , Joachim Linn 1 1 Fraunhofer Institute for Industrial Mathematics,{Marius.Obentheuer,Michael.Roller,Joachim.Linn}@itwm.Fraunhofer.de 2 Robotics Research Lab, University of Kaiserslautern, [email protected], [email protected] 3 Fraunhofer-Chalmers Centre, [email protected] ABSTRACT — Modelling and controlling a digital human model (DHM) is a challenging task, and the scope of ergonomic evaluation adds some additional requirements to the generated motions. In previous publications, we introduced a multibody system dynamics approach for DHM modelling with an optimal control (OC) framework for motion generation that uses different actuation modes (AM). Human bones are modeled as rigid bodies and connected via joints, as actuators joint torques (AM-T) or simplified hill type muscles are implemented. The latter can be controlled directly (AM-M) or by using muscle synergies as control parameters (AM-S). In this paper, we investigate the characteristics of human reaching motions measured in the motion lab at a “basic reaching test”. We then simulate the reaching motions under similar specifications as done in the experimental setup, and compare the influence of the different actuation modes to the measured trajectories and velocity profiles. 1 Introduction Modelling and controlling a digital human model (DHM) is a challenging task, and the scope of ergonomic evaluation adds some additional requirements to the generated motions. Even a simple “reaching for an object” task can be fulfilled by a multitude of solutions (trajectories, velocities, accelerations) [1]. Modelling (parts of) the human body as a multibody system (MBS), means that there is an infinite number of possible solutions to get from a given start configuration to a certain end configuration. When controlling a DHM, this kinematical redundancy should be solved in a way, a real human might or at least can do it (to get ergonomically significance). When working with biomechanical musculoskeletal models, the problem of anatomical redundancy is added. Due to the fact that humans have more actuators (muscles) than kinematical degrees of freedom (DOF), even one and the same motion can be generated by a multitude of muscle actuations. In [2,3], an appropriate DHM modelling approach with an optimal control (OC) framework for motion generation is presented. Human bones are modelled as rigid bodies and connected via joints, to actuate the model, joint torques can be used or simplified hill type muscles can be added to the model. Additionally, we developed an approach which allows us to use muscle synergies as control parameters for our DHM [4]. Muscle synergies are one hypothesis in neuroscience to explain how the human central nervous system (CNS) simplifies motor control [5]. In this paper we focus on trajectories and velocity profiles of motions measured in a basic reaching test. We simulate reaching motions under similar specifications as done in the motion lab and compare the resulting motions with those we measured, with focus on the influence of the chosen actuation mode. In section 2 we give a short overview of our control approach. In section 3 the basic reaching test is described and trajectories and velocity profiles for a multitude of reaching motions are assessed. In section 4, simulation results are shown and
Transcript of Comparison of different actuation modes of a biomechanical...

The 5th Joint International Conference on Multibody System Dynamics
June 24 –28, 2018, Lisbon, Portugal
Comparison of different actuation modes of a biomechanical human arm model in an optimal control framework
Marius Obentheuer1,2, Michael Roller1, Staffan Björkenstam3, Karsten Berns2, Joachim Linn1
1 Fraunhofer Institute for Industrial Mathematics,{Marius.Obentheuer,Michael.Roller,Joachim.Linn}@itwm.Fraunhofer.de 2 Robotics Research Lab, University of Kaiserslautern, [email protected], [email protected]
3 Fraunhofer-Chalmers Centre, [email protected]
ABSTRACT — Modelling and controlling a digital human model (DHM) is a challenging task, and the scope of ergonomic evaluation adds some additional requirements to the generated motions. In previous publications, we introduced a multibody system dynamics approach for DHM modelling with an optimal control (OC) framework for motion generation that uses different actuation modes (AM). Human bones are modeled as rigid bodies and connected via joints, as actuators joint torques (AM-T) or simplified hill type muscles are implemented. The latter can be controlled directly (AM-M) or by using muscle synergies as control parameters (AM-S). In this paper, we investigate the characteristics of human reaching motions measured in the motion lab at a “basic reaching test”. We then simulate the reaching motions under similar specifications as done in the experimental setup, and compare the influence of the different actuation modes to the measured trajectories and velocity profiles.
1 Introduction
Modelling and controlling a digital human model (DHM) is a challenging task, and the scope of ergonomic evaluation adds some additional requirements to the generated motions. Even a simple “reaching for an object” task can be fulfilled by a multitude of solutions (trajectories, velocities, accelerations) [1]. Modelling (parts of) the human body as a multibody system (MBS), means that there is an infinite number of possible solutions to get from a given start configuration to a certain end configuration. When controlling a DHM, this kinematical redundancy should be solved in a way, a real human might or at least can do it (to get ergonomically significance). When working with biomechanical musculoskeletal models, the problem of anatomical redundancy is added. Due to the fact that humans have more actuators (muscles) than kinematical degrees of freedom (DOF), even one and the same motion can be generated by a multitude of muscle actuations.
In [2,3], an appropriate DHM modelling approach with an optimal control (OC) framework for motion generation is presented. Human bones are modelled as rigid bodies and connected via joints, to actuate the model, joint torques can be used or simplified hill type muscles can be added to the model. Additionally, we developed an approach which allows us to use muscle synergies as control parameters for our DHM [4]. Muscle synergies are one hypothesis in neuroscience to explain how the human central nervous system (CNS) simplifies motor control [5].
In this paper we focus on trajectories and velocity profiles of motions measured in a basic reaching test. We simulate reaching motions under similar specifications as done in the motion lab and compare the resulting motions with those we measured, with focus on the influence of the chosen actuation mode. In section 2 we give a short overview of our control approach. In section 3 the basic reaching test is described and trajectories and velocity profiles for a multitude of reaching motions are assessed. In section 4, simulation results are shown and

2
compared with the results of section 3. In section 5 we conclude our work and give an outlook on planned research.
2 Control approach
In Figure 1, our DHM control approach, which we already introduced in detail in [4] is depicted. We perform measurements of certain tasks in the motion lab where we capture trajectories and velocity profiles of the
motions as well as EMG data from the involved arm and shoulder muscles. We then use the EMG data to extract time invariant muscle synergies, which can be used as control parameters for our musculoskeletal DHM. One muscle synergy represents a group of muscles that can only be activated synchronously in a fixed ratio that does not change over time. Afterwards the measured task is simulated in our OC simulation environment using the same specifications as in the motion lab (e.g. defined start and end position of the hands for reaching motions). The OC code then calculates the actuation signals of the DHM such that the defined motion constraints are fulfilled, while minimizing a cost function and respecting the equations of motion of the MBS. Our DHM can be actuated by joint torques (AM-T) and Hill type muscles. For the latter, muscle activations can be calculated directly (AM-M) or by using time invariant muscle synergies as control parameters (AM-S). Additionally, we can minimize different OC cost functions (as well as our own defined mixed cost function) to calculate actuations. In the last step, we compare the trajectories, velocity profiles and muscle actuations (AM-M & AM-S only) resulting from our simulations with those measured in the motion lab. This allows us to investigate the influence of the different actuation modes as well as the choice of cost function to the resulting motions, and to find an
Figure 1: Control approach of our DHM simulation environment

3
appropriate setting of our control parameters to achieve human like motions or even a certain characteristic of the resulting motions (e.g. fast vs. precise). In this publication, we only use minimal time as OC cost function, as test persons in the motion lab were told to move fast.
3 The basic reaching test
The idea of the basic reaching test is to measure a wide range of distinct reaching motions, with target points (TP) adapted to the test persons anthropometry.
3.1 Test description
Reaching motions are performed from a relaxed hanging start position to 17 different target points (Figure 2
middle left), using two distances to the target plane (Figure 2 middle right) and three final hand orientations (Figure 2 right). Additionally, weighted reaching motions (subject wears a weight cuff at its wrist) and motions with a lateral orientation to the target plane are performed. Each distinct motion is repeated five times. During the execution, electromyography (EMG) data of 16 arm and shoulder muscles is acquired and trajectories are tracked by an optical motion capture system. For details concerning data acquisition and test setup see [4].
��
�
��
Neutral
Rotated inwards
Rotated outwards
1
17
2
3
4 5
6
7
8 9 10
11
12 13
14
15
16
Figure 2: The basic reaching test: (left) test execution in the motion lab with EMG sensors and optical marker; (middle left) estimation
of target point placement dependent on the subject’s anthropometry. Inner radius Ri equals length of the upper arm, outer radius Ra
equals 90% of the maximal range to the target plane R_max_reach; (middle right) estimation of distances �� and �� to the measuring
plane, adapted to the test persons anthropometry; (right) the three final hand orientations

4
3.2 Characteristics of the captured motions
In the following, the trajectories and velocity profiles of the marker HL3R of one test person are plotted. The marker is placed at the metacarpophalangeal joint of the middle finger as depicted in Figure 3 (left). The z-direction of the coordinate system for the plots points upwards, x-direction points into the viewing direction of the test person, and y-directions points to its left (Figure 3 right).
3.2.1 Reaching Motions from distance D1 (frontal orientation)
From distance D1 in frontal orientation, reaching motions to all 17 target points (TP) are measured. In Figure 4 the trajectories for test scenario (TS) TS1 (outward rotated final hand orientation (ORO)), TS2 (inward rotated final hand orientation (IRO)), TS3 (neutral final hand orientation (N)) and TS10 (weight cuff attached (W)) are plotted. For each point, one (arbitrary) repetition is depicted.
TS 1 TS 2 TS 3 TS 10
Figure 4: Reaching Trajectories for Test scenario TS1-3 and TS10
x x x x y y y y
z z z z
HL3R
Figure 3: Position of optical marker HL3R (left) and coordinate system orientation (right)
x y
z

5
In Figure 5, the reaching motions from TS1 (ORO - blue line), TS2 (IRO - red line) TS3 ( N - yellow line) and TS10 (W - purple line) to a single target point are compared ( 1st row TP1, 2nd row TP3 and 3rd row TP7). In the first column the 3D plots are depicted, in the second column the projection to the x-z plane (sideview from the
right), in the third column the projection to the y-z plane (viewing direction of the test person) and in the fourth column the projection to the y-x plane is plotted (top view). The chosen trajectories do not differ a lot for the different test scenarios and lie in the range of variation that was measured in between single repetitions for one specific task. Hence, the final hand orientation as well as the weight cuff do not seem to influence the characteristics of the global trajectory. In all 2D projections, a more or less pronounced bow- to s-shape like characteristic of the measured trajectories can be observed. All Trajectories have a smooth appearance, without any sharp edges or sudden changes in direction.
Figure 5: Reaching motions to point 1 (1st row) point 3 (2nd row) and point 7 (3rd row)
z
z [m
m]
z [m
m]
x [m
m]
y x
3D plot
-200 0 200 400 600
x [mm]
1000
1200
1400
1600
1800
sideview right
-600-400-2000200400
y [mm]
1000
1200
1400
1600
1800
viewing direction
-200-150-100-500
y [mm]
150
200
250
300
top view
y x
3D plot
0 200 400
x [mm]
900
1000
1100
1200
1300
1400
sideview right
-600-400-200
y [mm]
900
1000
1100
1200
1300
1400
viewing direction
-500-400-300-200
y [mm]
0
100
200
300
400
top view
TP 01
TP 03
TP 07
6
3.2.2 Reaching Motions from Distance D2 (frontal orientation)
From distance D2 in frontal orientation, only reaching motions to target points 09-17 are measured (as target points on the outer circle are out of reach when leaving the shoulder in position). In Figure 6, the trajectories for test scenario (TS) TS4 (outward rotated final hand orientation), TS5 (inward rotated final hand orientation), TS6 (neutral final hand orientation) and TS11 (weight cuff attached) are plotted. For each point, one (arbitrary) repetition is plotted.
In Figure 7, the reaching motions from TS4 (ORO - blue line), TS5 (IRO - red line), TS6 (N - yellow line) and TS11 (W - purple line) to a single target point are plotted (1st row TP9, 2nd row TP11 ,3rd row TP13 and 4th row TP15). In the first column the 3D plots are depicted, in the second column the projection to the x-z plane (sideview from the right), in the third column the projection to the y-z plane (viewing direction of the test person) and in the fourth column the projection to the y-x plane is plotted (top view).
TS 4 TS 5 TS 6 TS 11
Figure 6: Reaching Trajectories for Test scenario TS4-6 and TS11
x y
z
z [m
m]
z [m
m]
x [m
m]
y x
z
3D plot
0 200 400
x [mm]
900
1000
1100
1200
1300
1400
z [m
m]
sideview right
-400-2000
y [mm]
900
1000
1100
1200
1300
1400
z [m
m]
viewing direction
-400-300-200-100
y [mm]
0
100
200
300
x [m
m]
top view
z
x y
z
TP 11
TP 09
x y
z
x y
z

7
The observed characteristics of the measured trajectories remain consistent for reaching motions from distance D2. It can be said that reaching motions with an outward rotated final hand orientation have a slightly more distinct bow shape, especially for target points on the vertical line (see Figure 4 left (TS1), Figure 6 left (TS4) and top views TP 01, TP 09, TP 13 Figure 5 and Figure 7).
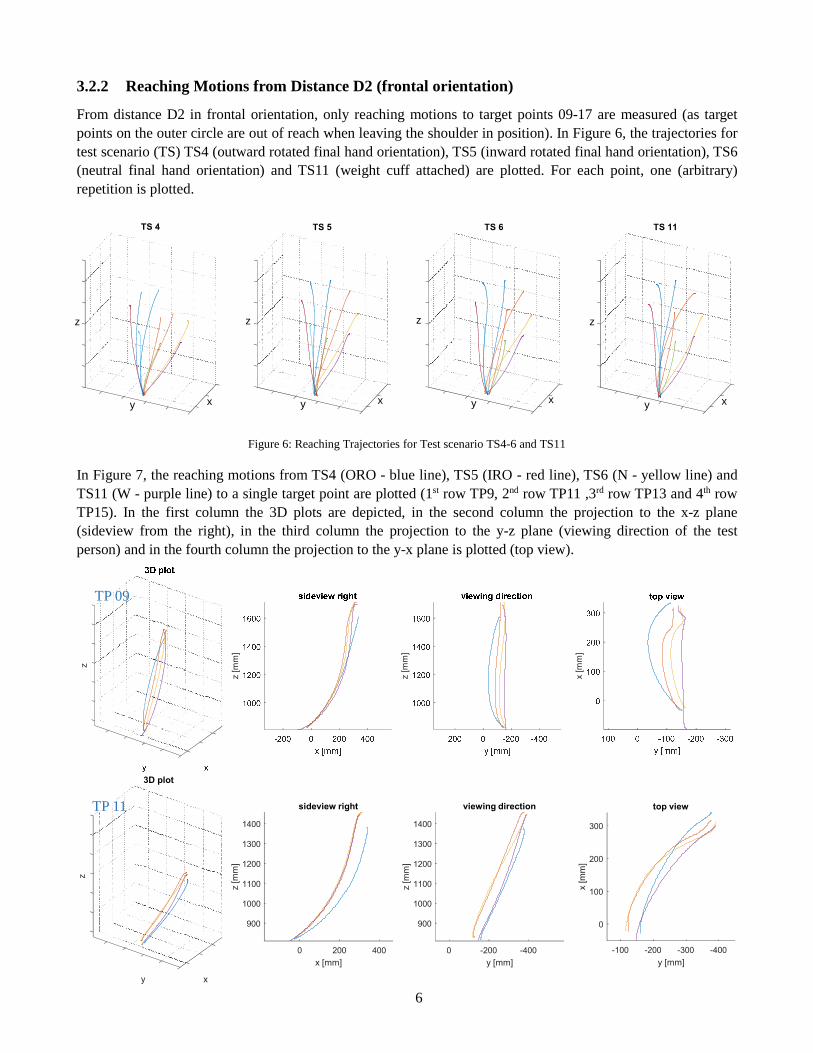
3.2.3 Velocity profiles of the measured motions
In Figure 8, the velocity profiles (absolute velocities) of reaching motions from distance D1 to TP 1-17 (left) and distance D2 to TP 9-17 (right) with a neutral final hand orientation are depicted. The velocity profiles have a bell shaped characteristic, whereas the peak velocity is reached at about one third of the duration. The maximum velocity increases with the distance between start- and end position of the hand, the maximum speed is reached at TP1 from distance D1, and is about 3 m/s, i.e. about four times higher than the minimum velocity peak (0.7 m/s at TP 5). On the other hand, the duration of the motion for the shortest distance (D1,TP 5, distance 25 cm, duration 0.8s) and the longest distance (D1, TP 1, distance 109 cm, duration 1.1s) only varies by a factor of 1.38.
y x
3D plot
0 100 200 300
x [mm]
800
900
1000
1100
sideview right
-300-200-1000
y [mm]
850
900
950
1000
1050
1100
1150
viewing direction
-300-200-1000
y [mm]
0
100
200
300
top view
y x
z
3D plot
0 200 400
x [mm]
900
1000
1100
1200
1300
1400
z [m
m]
sideview right
-2000200
y [mm]
900
1000
1100
1200
1300
1400
z [m
m]
viewing direction
-200-1000100
y [mm]
0
100
200
300
x [m
m]
top view
Figure 7: Test scenario TS 4-6 and 11 to point 9 (1st row) and point 11 (2nd row)
TP 13
TP 15
8
4 Simulation results
Our simulation framework allows us to build arbitrary DHM models using various joint types with restricted range of motion. As we only focus on reaching in this test, and as test persons were told to keep their shoulder in position and to keep the forearm and hand stiff during the motion, we use a 5 DOF human arm model, adapted to the anthropometry of the test person. For AM-M and AM-S, 29 hill type muscles are included in the model as depicted in Figure 9. For motion evaluation, we introduce a virtual marker in the model, placed at the position of marker HL3R (see Figure 3). For all simulations, the start posture of the model is given. As goal, the coordinates of the virtual target points have to be reached with the tip of the middle finger. As test persons in the motion lab are told to move as fast as possible, we use minimal time as cost function for all simulations.
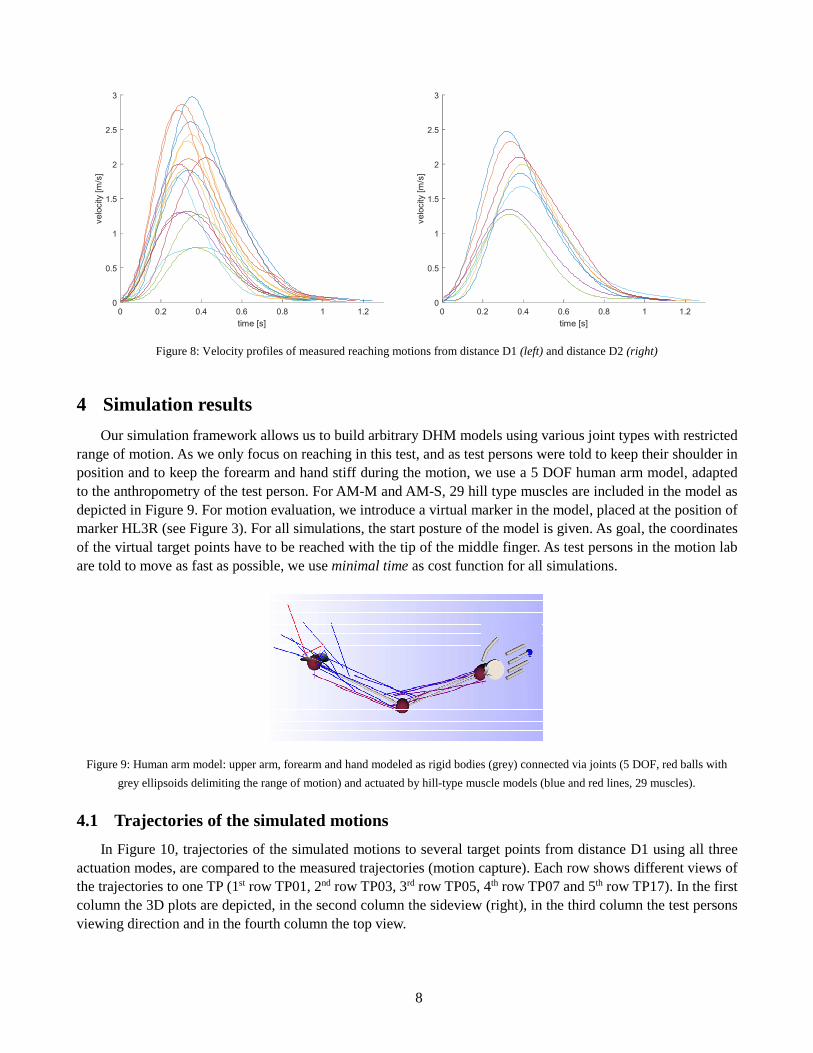
4.1 Trajectories of the simulated motions
In Figure 10, trajectories of the simulated motions to several target points from distance D1 using all three actuation modes, are compared to the measured trajectories (motion capture). Each row shows different views of the trajectories to one TP (1st row TP01, 2nd row TP03, 3rd row TP05, 4th row TP07 and 5th row TP17). In the first column the 3D plots are depicted, in the second column the sideview (right), in the third column the test persons viewing direction and in the fourth column the top view.
0 0.2 0.4 0.6 0.8 1 1.2
time [s]
0
0.5
1
1.5
2
2.5
3velo
city [m
/s]
0 0.2 0.4 0.6 0.8 1 1.2
time [s]
0
0.5
1
1.5
2
2.5
3
velo
city [m
/s]
Figure 8: Velocity profiles of measured reaching motions from distance D1 (left) and distance D2 (right)
Figure 9: Human arm model: upper arm, forearm and hand modeled as rigid bodies (grey) connected via joints (5 DOF, red balls with
grey ellipsoids delimiting the range of motion) and actuated by hill-type muscle models (blue and red lines, 29 muscles).

9
Figure 10: Comparison of measured and simulated trajectories with different actuation modes
z
z
z [m
]
x [m
]
-0.6
0.2
-0.4
-0.2
0
y
3D plot
0.4
x
0.2-0.20
0 0.1 0.2 0.3 0.4 0.5
x
-0.6
-0.5
-0.4
-0.3
-0.2
-0.1
sideview right
-0.3-0.2-0.100.10.2
y [m]
-0.6
-0.5
-0.4
-0.3
-0.2
-0.1
viewing direction
-0.2-0.100.10.2
y [m]
0
0.1
0.2
0.3
0.4
top view
z
z
z [
m]
x [
m]
TP 01
TP 03
TP 05
TP 17
TP 07

10
Trajectories measured in the motion lab are colored in blue, trajectories resulting from AM-T in red, from AM-M in green and from AM-S in orange. Note that the origin of each coordinate system (Motion capture and simulation model) is located in the rotation center of the shoulder joint. Due to slightly different start positions of the test persons hand between each repetition of the measured reaching motions, the start positions of simulations and motion capture trajectories can differ somewhat.
For all actuation modes and each target point the OC framework converges to a feasible solution. Although trajectories resulting from AM-T differ from those that were measured in the motion lab, the simulated paths at least appears human like and feasible from a subjective point of view. Including muscles in the model directly leads to trajectories that are very similar to those that were measured. The observed characteristics of the measured motions (see Chapter 3.2) can be clearly seen in the simulation results as well. In some cases the s- and bow-shape appearance is somewhat exaggerated, but the characteristics are preserved. The use of muscle synergies (AM-S) partly helps to reduce this exaggeration.
4.2 Velocity profiles of the simulated motions
In Figure 11, the velocity profiles (absolute velocities) of reaching motions to several TP’s from distance D1 are plotted for all three Actuation Modes (AM-T, AM-M and AM-S, from left to right). When using motors as actuators, the maximum velocity (~22m/s) is about seven times higher compared to the maximum measured values (~3m/s). This leads to motion durations between 0.07s (TP5) and 0,11s (TP1) which are about 10 times faster than the measured values (0.8s and 1.1s, see Chapter 3.2.3). Implementing muscles in the model reduces the maximum simulated velocities by factor four. In AM-M, the maximum velocity is about 5.2 m/s which leads to a duration of 0.38s (TP1). In AM-S the maximum velocity is about 4.3 m/s which leads to a motion duration of 0.5s (TP1), which is about twice as fast as the measured value for this point.
4.3 Influence of number of muscle synergies
It is significant that velocities produced at AM-T are much higher than the measured values (and do not seem to be feasible for a human from a subjective point of view neither). One explanation for this could be that motors in our model have a constant maximum torque, which does not depend on the state of the MBS (joint angles and joint velocities) as it is the case in the human body. Using muscles as actuators (AM-M and AM-S) reduces the produced velocities, which could result from the force-length and force-velocity dependency of the hill type muscle models which is inspired by nature. Additionally, the velocity profiles produced in AM-M and AM-S have a smoother appearance than those resulting from AM-T. Nevertheless it is conspicuous, that the velocities drop rapidly at the end of the reaching motions (AM-M & AM-S), especially at motions with longer duration and higher velocities. However, that the reaching motions measured in the motion lab involve some
Figure 11: Velocity profiles of reaching motions to TP 1-17 (odd numbers only) from Distance D1 with a neutral final hand orientation:
(left) Motors as actuations, (middle) muscles as actuations (right) muscle synergies as control parameters.
0 0.02 0.04 0.06 0.08 0.1 0.12
time [s]
0
5
10
15
20
25
0 0.1 0.2 0.3 0.4
time [s]
0
1
2
3
4
5
6
0 0.1 0.2 0.3 0.4 0.5 0.6
time [s]
0
0.5
1
1.5
2
2.5
3
3.5
4
4.5
Motors (AM-T) Muscles (AM-M) Synergies (AM-S)

11
precision and visual feedback, as the test persons have to reach a given point and stop exactly in front of the target plane. This could result in a prolonged deceleration phase. Additionally, the test persons were not trained to move as they possibly could (from a physiological point of view).
5 Conclusions and outlook
The characteristics for a multitude of reaching motions measured at the basic reaching test are investigated and compared with simulated motions. Simulations are performed with three different actuation modes (motors, muscles and muscle synergies) and their influence is examined. Motors deliver trajectories that differ to those measured, but still look feasible and human like, although the velocities are to high. Including muscles in the model makes the simulated trajectories very close to those used for validation, and the observed characteristics of the measured motions can be found in the simulation results as well. The use of muscle synergies slightly improves this effect, especially when it comes to velocity profiles. Overall the introduced DHM control framework produces feasible and human like motions given just generic task descriptions (e.g. similar constraints and goals as given to test persons in the motion lab) and without any need for motion capture data or measurements as input. In future applications, this could help to predict and assess human motions in digital scenarios where no physical prototypes exist.
As the muscle synergies, used in the simulation, result from measurements done in the motion lab, it has to be investigated how generic the extracted synergies are and if they can be used for different tasks. Additionally, we plan to investigate measured and simulated reaching trajectories from different test persons with a distinct anthropometry. As the measured reaching motions in this paper involve some precision, additional measurements of arbitrary fast reaching motions with the focus on speed have been done in the motion lab. These data is planned to be used to validate velocity profiles of our musculoskeletal model when minimal time is used as OC cost function. Further on, additional measurement which involve external forces and investigations on the influence of different OC cost functions to the resulting motions and actuation signals are being planned.
Acknowledgements
This work was supported by the Fraunhofer Internal Programs under Grant No. MAVO 828 424. We acknowledge the use of the facilities and the support at the Fraunhofer IPA motion lab.
References
[1] N. Bernstein. The Coordination and Regulation of Movements. Pergamon Press, Oxford 1967.
[2] S. Björkenstam, J. Carlson, J. Nyström et al. A framework for motion planning of digital humans using discrete mechanics and optimal control. Proceedings of the 5th International Digital Human Modeling Symposium, pp 64-72, June 26-28, Bonn, Germany, 2017.
[3] M. Roller, S. Björkenstam, J. Linn, S. Leyendecker. Optimal control of a biomechanical multibody model for the dynamic simulation of working tasks. Proceedings of the 8th ECCOMAS Thematic Conference on Multibody Dynamics, pp. 817-826, June 19-22, Prague, Czech Republic, 2017.
[4] M. Obentheuer, M. Roller, S. Björkenstam, K. Berns, J. Linn. Human like Motion Generation for Ergonomic Assessment - a Muscle Driven Digital Human Model Using Muscle Synergies. Proceedings of the 8th ECCOMAS Thematic Conference on Multibody Dynamics, pp. 847-856, June 19-22, Prague, Czech Republic, 2017.
[5] E Bizzi, V.C.K. Cheung, A. d’Avella, P. Saltiel and M. Tresch. Combining modules for movement. Brain Research Reviews, Volume 57, Issue 1, Pages 1-270, January 2008.