Energy Management Systems: 2017/2018 - Técnico … · Energy Management Systems: 2017/2018 ......
73
Energy Management Systems: 2017/2018 Energy & Material Services Industrial Energy Use SGCIE Prof. Tânia Sousa [email protected]
Transcript of Energy Management Systems: 2017/2018 - Técnico … · Energy Management Systems: 2017/2018 ......
Energy Management Systems:
2017/2018
Energy & Material Services
Industrial Energy Use
SGCIE
Prof. Tânia Sousa

• SGCIE (DL 71/2008) – Sistema de Gestão dos
Consumos Intensivos de Energia (Energy
Management System for Intensive Energy Consumers)
– It promotes energy efficiency for big primary
energy consumers
– It promotes clean primary energy fuels mix
SGCIE
Energy Management
Class # 6 :: Block Diagrams (cont.) & LCA & SGCIE
SGCIE
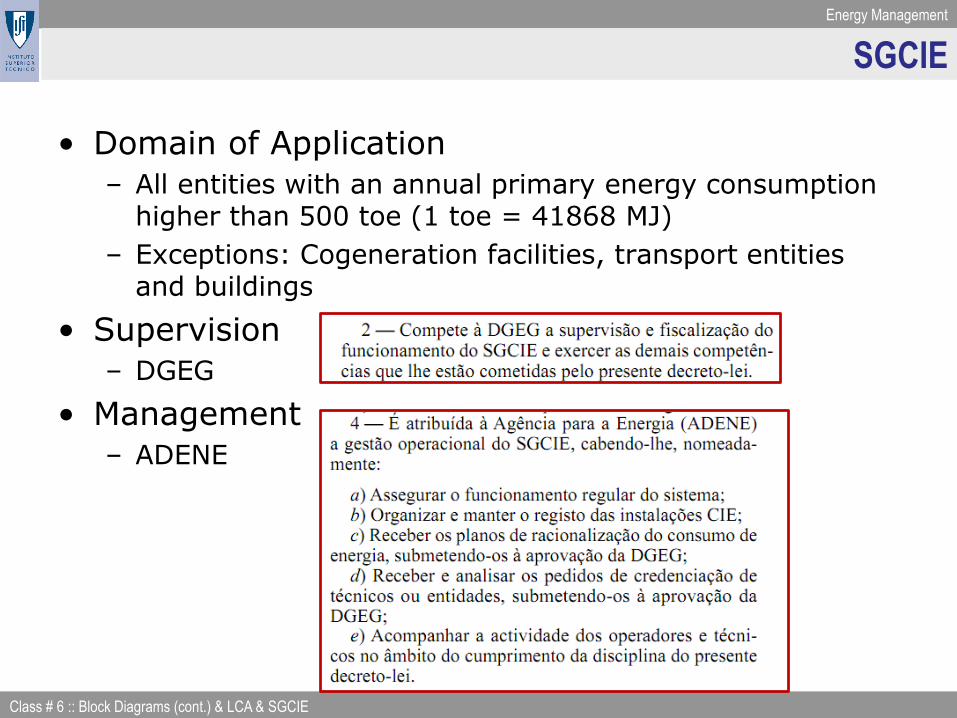
• Domain of Application
– All entities with an annual primary energy consumption higher than 500 toe (1 toe = 41868 MJ)
– Exceptions: Cogeneration facilities, transport entities and buildings
• Supervision
– DGEG
• Management
– ADENE

Energy Management
Class # 6 :: Block Diagrams (cont.) & LCA & SGCIE

Energy Management
Class # 6 :: Block Diagrams (cont.) & LCA & SGCIE

Energy Management
Class # 6 :: Block Diagrams (cont.) & LCA & SGCIE

Energy Management
Class # 6 :: Block Diagrams (cont.) & LCA & SGCIE
SGCIE
• Obligations (for IEC entities)
– Promote the registration of facilities
– Perform Energy Audits
• Every 6 years for entities 1000 toe
• Every 8 years for entities from500 to 1000 toe

Energy Management
Class # 6 :: Block Diagrams (cont.) & LCA & SGCIE
SGCIE
• Obligations (for IEC entities)
– Develop Energy Racionalization Plans
• Every measure with payback lower than 5 years must be implemented in the first 3 years for entities 1000 toe
• Every measure with payback lower than 3 years must be implemented in the first 3 years for entities from 500-1000 toe

Energy Management
Class # 6 :: Block Diagrams (cont.) & LCA & SGCIE
SGCIE
• Obligations (for IEC entities)
– Develop Energy Racionalization Plans
• Energy Intensity must decrease 6% in 6 years for entities 1000 toe
• Energy Intensity must decrease 4% in 8 years for entities from 500 to 1000 toe

Energy Management
Class # 6 :: Block Diagrams (cont.) & LCA & SGCIE
SGCIE
• What is the relationship between the Energy Intensity obtained using the definition in SGCIE and the energy specific consumption obtained with the block diagrams methodology?
Operation Am2
m3
mR
EA
Materials
lnput Production
Energy
consumption
Residues
m1 3 A 1 23
3 3
E E +E +ECE = =
m m
Energy Management
Class # 6 :: Block Diagrams (cont.) & LCA & SGCIE
SGCIE
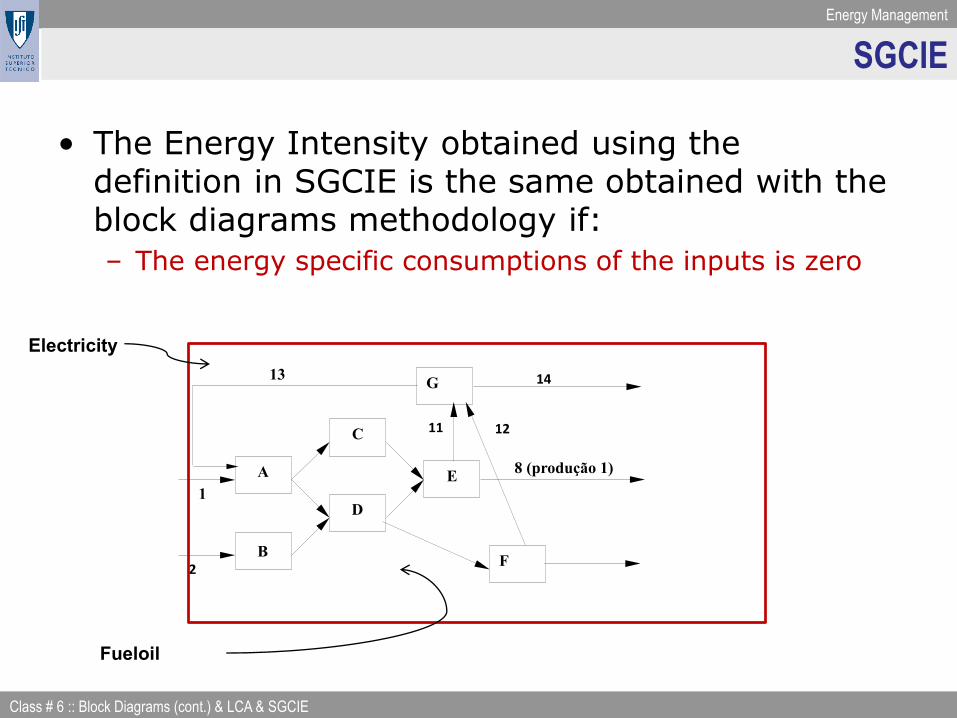
• The Energy Intensity obtained using thedefinition in SGCIE is the same obtained with theblock diagrams methodology if:
– The energy specific consumptions of the inputs is zero
8 (produção 1)A
C
D
E
B2
1
F
G 1413
1211
Electricity
Fueloil

Energy Management
Class # 6 :: Block Diagrams (cont.) & LCA & SGCIE
Embodied energy
• Cumulative amount of commercial energy invested to extract, process and manufacture a product and transport it to its point of use.
– The energy used indirectly might be more important that the energy used directly
Auto-industry assembly line
Electricity
Paint
Embodied energy in a car: 270 GJ

Energy Management
Class # 6 :: Block Diagrams (cont.) & LCA & SGCIE
SGCIE
• Obligations (for IEC entities)
– Develop Energy Rationalization Plans
• The carbon intensity must not increase
– Why a goal on carbon intensity?

Energy Management
Class # 6 :: Block Diagrams (cont.) & LCA & SGCIE
SGCIE
• Obligations (for IEC entities)
– Develop Energy Rationalization Plans
• The carbon intensity must not increase
– Why a goal on carbon intensity?
• Promote less polutant energy mixes (do not increase energy efficiency by replacing less polutant energy forms with more polutant ones)

Energy Management
Class # 6 :: Block Diagrams (cont.) & LCA & SGCIE

Energy Management
Class # 6 :: Block Diagrams (cont.) & LCA & SGCIE

Energy Management
Class # 6 :: Block Diagrams (cont.) & LCA & SGCIE

SGCIE
• Conversion coefficients for CO2 emissions and
primary energy
– Despacho nº 17313/2008

SGCIE
• Conversion coefficients for CO2 emissions and
primary energy
– For primary fuels:

SGCIE
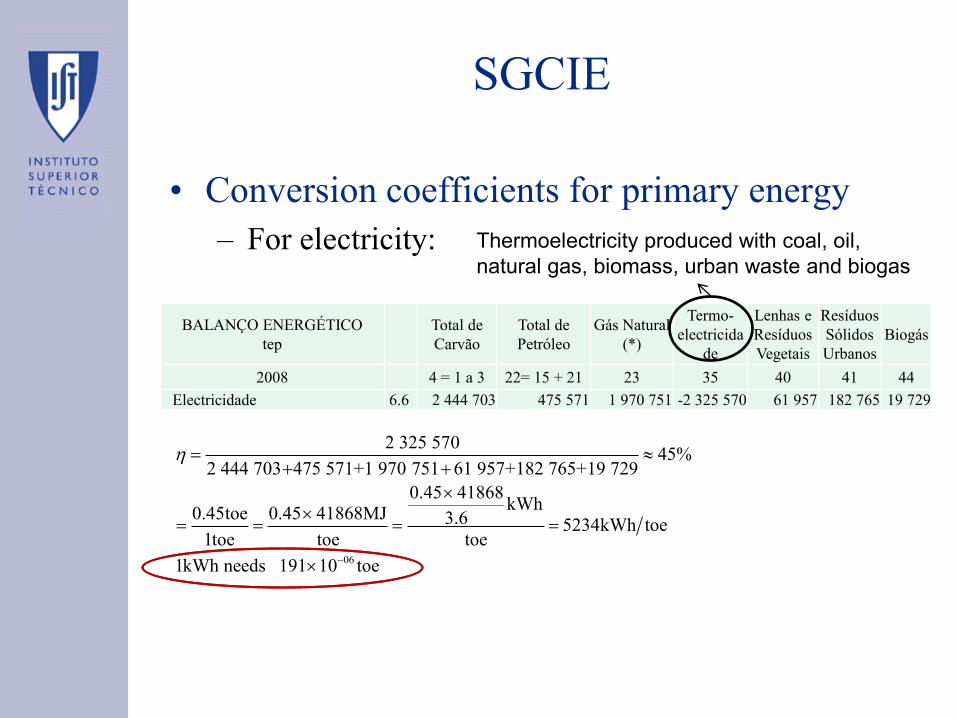
• Conversion coefficients for primary energy
– For electricity (in kWh per toe)?
BALANÇO ENERGÉTICO
tep
Total de
Carvão
Total de
Petróleo
Gás Natural
(*)
Termo-
electricida
de
Lenhas e
Resíduos
Vegetais
Resíduos
Sólidos
Urbanos
Biogás
2008 4 = 1 a 3 22= 15 + 21 23 35 40 41 44
Electricidade 6.6 2 444 703 475 571 1 970 751 -2 325 570 61 957 182 765 19 729
Thermoelectricity produced with coal, oil,
natural gas, biomass, urban waste and biogas
SGCIE
• Conversion coefficients for primary energy
– For electricity:
BALANÇO ENERGÉTICO
tep
Total de
Carvão
Total de
Petróleo
Gás Natural
(*)
Termo-
electricida
de
Lenhas e
Resíduos
Vegetais
Resíduos
Sólidos
Urbanos
Biogás
2008 4 = 1 a 3 22= 15 + 21 23 35 40 41 44
Electricidade 6.6 2 444 703 475 571 1 970 751 -2 325 570 61 957 182 765 19 729
Thermoelectricity produced with coal, oil,
natural gas, biomass, urban waste and biogas
06
2 325 57045%
2 444 703 475 571+1 970 751 61 957+1 82 765+1 9 729
0.45 41868kWh
0.45toe 0.45 41868MJ 3.6 5234kWh toe1toe toe toe
1kWh needs 191 10 toe

SGCIE
• Conversion coefficients for primary energy
– For electricity:
– What would happen to this coefficient if we
consider cogeneration?
BALANÇO ENERGÉTICO
tep
Total de
Carvão
Total de
Petróleo
Gás Natural
(*)
Termo-
electricida
de
Lenhas e
Resíduos
Vegetais
Resíduos
Sólidos
Urbanos
Biogás
2008 4 = 1 a 3 22= 15 + 21 23 35 40 41 44
Electricidade 6.6 2 444 703 475 571 1 970 751 -2 325 570 61 957 182 765 19 729
Thermoelectricity produced with coal, oil,
natural gas, biomass, urban waste and biogas
06
2 325 57045%
2 444 703 475 571+1 970 751 61 957+1 82 765+1 9 729
0.45 41868kWh
0.45toe 0.45 41868MJ 3.6 5234kWh toe1toe toe toe
1kWh needs 191 10 toe

SGCIE
• Conversion coefficients for primary energy
– For electricity:
BALANÇO ENERGÉTICO
tep
Total de
Carvão
Total de
Petróleo
Gás Natural
(*)
Termo-
electricida
de
Lenhas e
Resíduos
Vegetais
Resíduos
Sólidos
Urbanos
Biogás
2008 4 = 1 a 3 22= 15 + 21 23 35 40 41 44
Electricidade 6.6 2 444 703 475 571 1 970 751 -2 325 570 61 957 182 765 19 729
Thermoelectricity produced with coal, oil,
natural gas, biomass, urban waste and biogas
BALANÇO ENERGÉTICO
tep
Total de
Petróleo
Gás
Natural
(*)
Gases o
Outros
Derivado
s
Termo-
electricidadeCalor
Resíduos
Industriais
Renováveis
Sem Hídrica
200822= 15 +
2123
30 = 24
a 2935 37 38 46 = 39 a 45
Cogeração6.7
834 520 626 392 24 379 - 485 426 -1 472 450 2 523 974 514

SGCIE
• Conversion coefficients for CO2 emissions
– For electricity (in kg CO2 e per kWh)?
BALANÇO ENERGÉTICO
tep
Total de
Carvão
Total de
Petróleo
Gás Natural
(*)
Termo-
electricidade
Lenhas e
Resíduos
Vegetais
Resíduos
Sólidos
Urbanos
Biogás
2008 4 = 1 a 3 22= 15 + 21 23 35 40 41 44
Electricidade 6.6 2 444 703 475 571 1 970 751 -2 325 570 61 957 182 765 19 729
4111.4 kg CO2 e/toe3236.4 kg CO2 e/toe
2348.8 kg CO2 e/toe

SGCIE
• Conversion coefficients for CO2 emissions
– For electricity (in kg CO2 e per kWh)
BALANÇO ENERGÉTICO
tep
Total de
Carvão
Total de
Petróleo
Gás Natural
(*)
Termo-
electricidade
Lenhas e
Resíduos
Vegetais
Resíduos
Sólidos
Urbanos
Biogás
2008 4 = 1 a 3 22= 15 + 21 23 35 40 41 44
Electricidade 6.6 2 444 703 475 571 1 970 751 -2 325 570 61 957 182 765 19 729
4111.4 kg CO2 e/toe3236.4 kg CO2 e/toe
2348.8 kg CO2 e/toe
2
2
4111.4 2 444 703 3236.4 475 571 2348.8 1 970 751 kg CO e
2 325 570 41868kWh
3.6
0.6kg CO e kWh
IC
IC

Energy Management
Class # 6 :: Block Diagrams (cont.) & LCA & SGCIE
SGCIE
• Conversion coefficients for CO2 emissions and primary energy
– For electricity:
– Conversão directa de kWh em tep?

Energy Management
Class # 6 :: Block Diagrams (cont.) & LCA & SGCIE
SGCIE
• Conversion coefficients for CO2 emissions and primary energy
– For electricity:
– Conversão directa de kWh em tep?
• 1kWh=3.6MJ=3.610-3/41.87 tep = 86 10-6
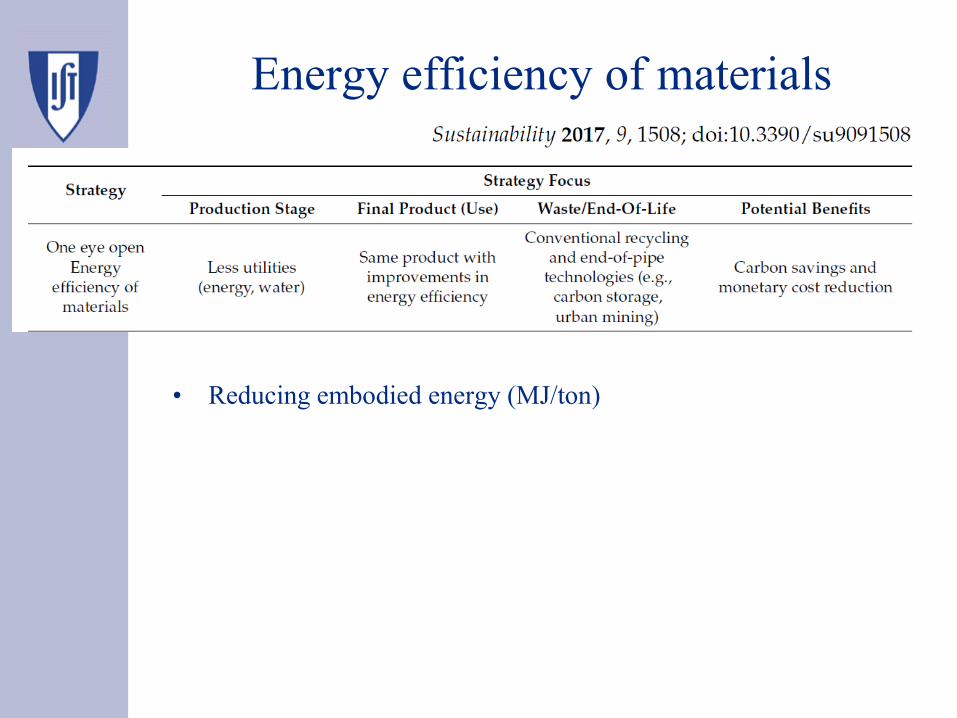
Energy efficiency of materials
• Reducing embodied energy (MJ/ton)

Energy vs. Exergy
• Embodied Energy or Cumulative Energy Consumption
(CEC): it is the total (direct and indirect) amount of
(primary) energy needed to generate product k.
• Cumulative exergy consumption (CExC): it is the total
(direct and indirect) amount of (primary) exergy
needed to generate product k.
• What is the difference?
Operation Am2
m3
mR
EA
Materials
lnput Production
Energy
consumption
Residues
m1
3 A 1 23
3 3
E E +E +ECE = =
m m

Cement Industry
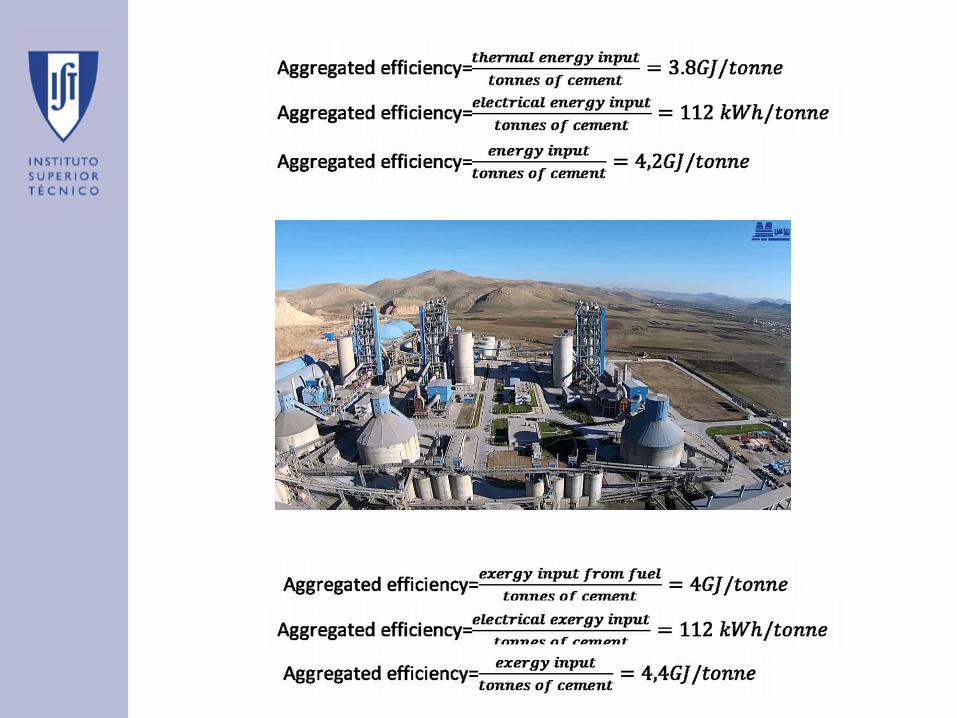

Exergetic efficiency various formulations

Final Energy Use in Industry in 2005
• World Industrial final energy
use in 2005 is 115EJ
• The bulk of industrial energy
use is due to the production of a
small number of energy
intensive commodities:
– Chemicals and petrochemicals and
the iron and steel sector account for
approximately half of all industrial
energy used worldwide.
• Other sectors that account for a
significant share of industrial
energy use:
– non-metallic minerals and the pulp
and paper sector.
Cement,
ceramics,
glass, lime
Aluminium,
copper, nickel
Plastics and fertilizers
GEA, 2012

Final Energy Use in Industry in Portugal

Final Energy Use in Industry in 2005
The bulk of industrial energy use is
in developing economies (80% pop.)

World Production of key materials
Gutowski TG, Sahni S, Allwood JM, Ashby MF,Worrell E. 2013 The energy required to produce
materials: constraints on energy-intensity improvements, parameters of demand. Phil Trans R Soc A
371: 20120003.
http://dx.doi.org/10.1098/rsta.2012.0003
Steel
Cement
Paper
Aluminium
Plastics

World production of key materials
• Higher growth rates from the
90’ and then from the 2000’
onwards
• Heterogeneous growth
(cement)
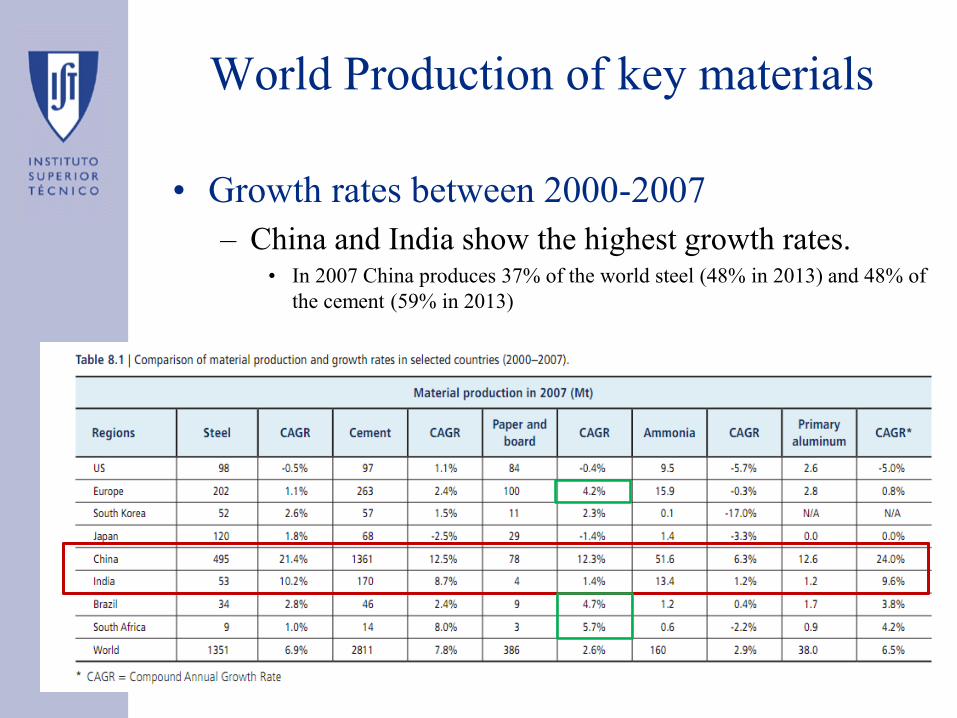
World Production of key materials
• Growth rates between 2000-2007
– China and India show the highest growth rates.• In 2007 China produces 37% of the world steel (48% in 2013) and 48% of
the cement (59% in 2013)

World Demand of key materials
China is atypical
• Regional per-capita demand for materials
– For some materials it increases with income and
economic development and then stabilizes
Stock = 10 ton/capita
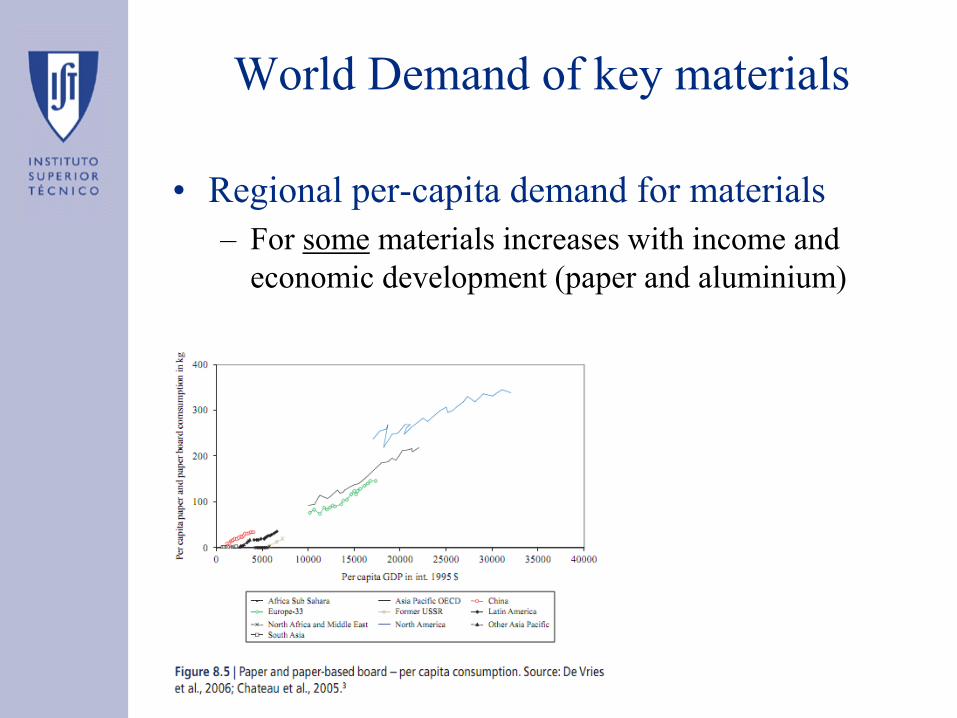
• Regional per-capita demand for materials
– For some materials increases with income and
economic development (paper and aluminium)
World Demand of key materials

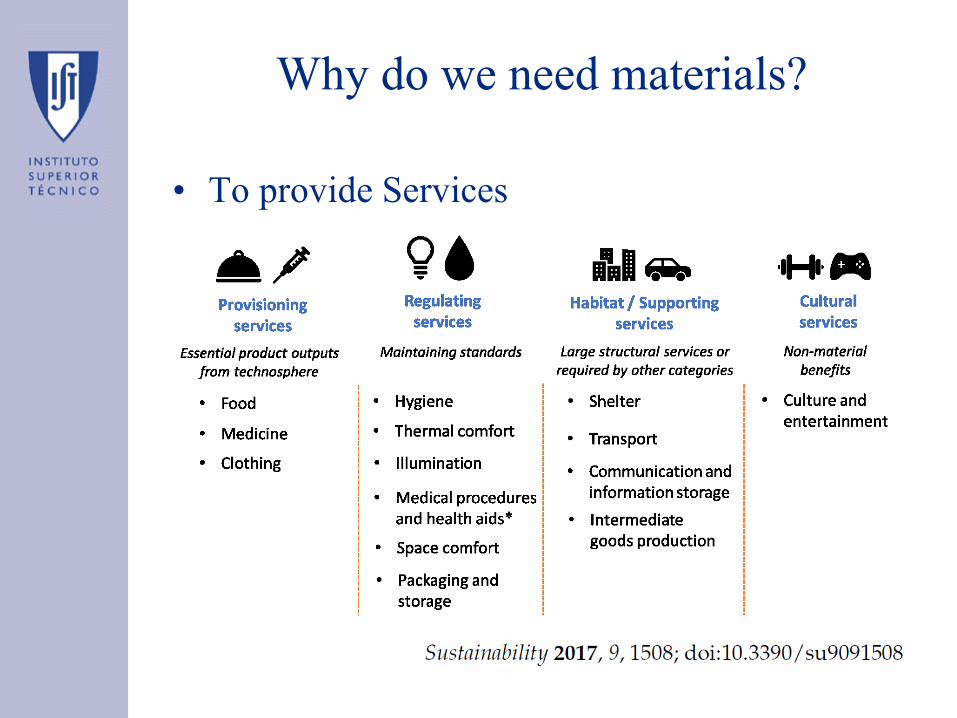
Why do we need materials?
• To provide Services

Why do we need materials?
Cullen & Allwood, 201042
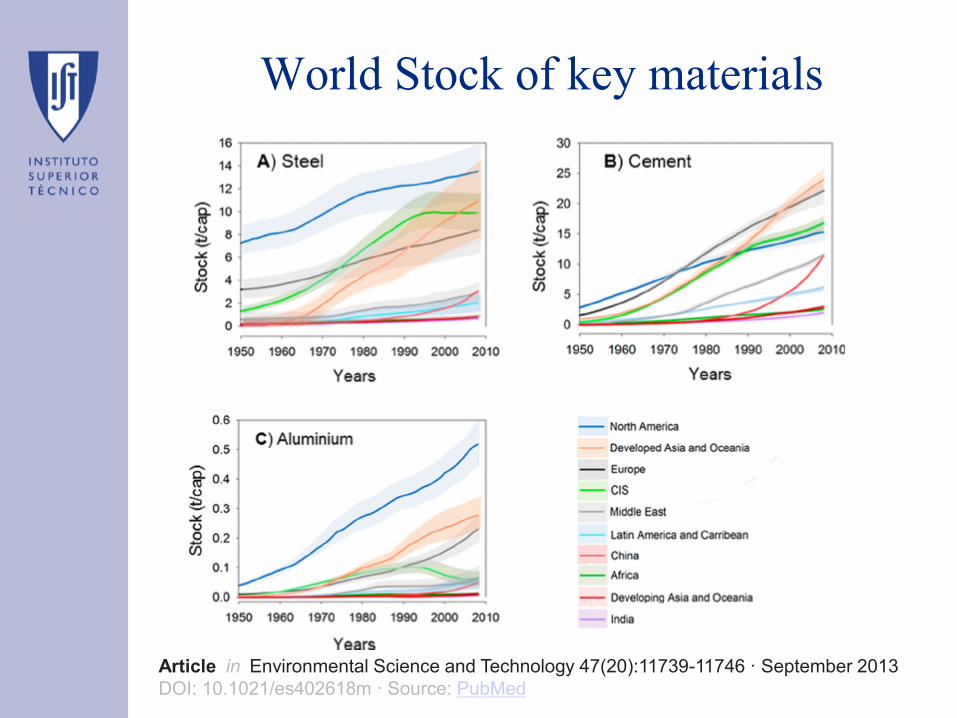
World Stock of key materials
Article in Environmental Science and Technology 47(20):11739-11746 · September 2013
DOI: 10.1021/es402618m · Source: PubMed
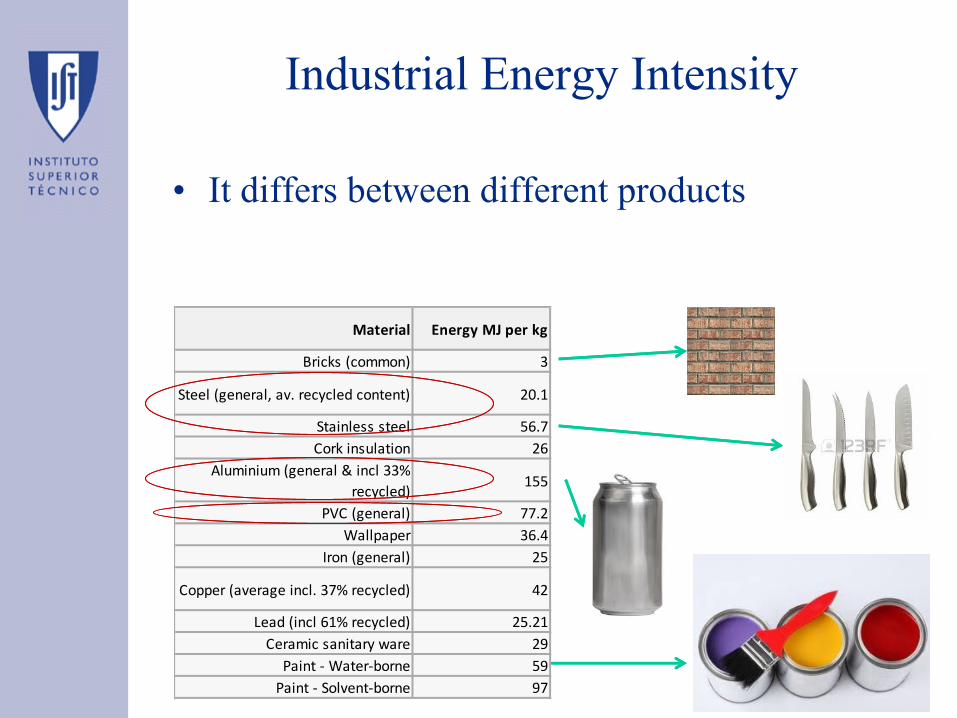
Industrial Energy Intensity
• It differs between different products
Material Energy MJ per kg
Bricks (common) 3
Steel (general, av. recycled content) 20.1
Stainless steel 56.7
Cork insulation 26
Aluminium (general & incl 33%
recycled)155
PVC (general) 77.2
Wallpaper 36.4
Iron (general) 25
Copper (average incl. 37% recycled) 42
Lead (incl 61% recycled) 25.21
Ceramic sanitary ware 29
Paint - Water-borne 59
Paint - Solvent-borne 97

Industrial Energy Intensity
• It differs between different materials
Gutowski TG, Sahni S, Allwood JM, Ashby MF,Worrell E. 2013 The energy required to produce
materials: constraints on energy-intensity improvements, parameters of demand. Phil Trans R Soc A
371: 20120003.
http://dx.doi.org/10.1098/rsta.2012.0003
Steel
Cement
Paper
Aluminium
Plastics
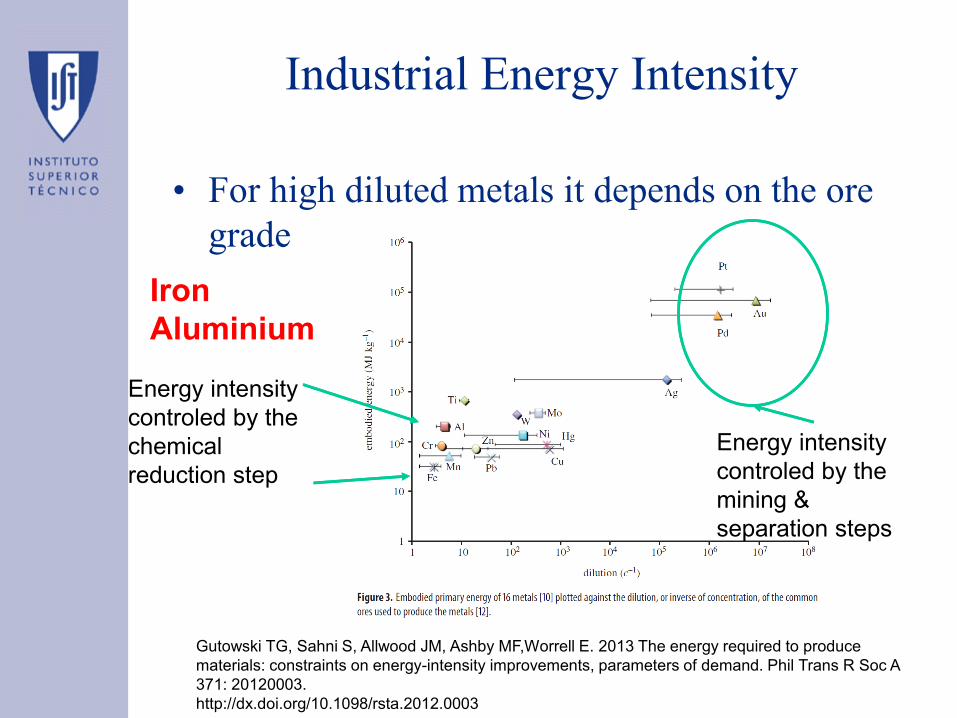
Industrial Energy Intensity
• For high diluted metals it depends on the ore
grade
Gutowski TG, Sahni S, Allwood JM, Ashby MF,Worrell E. 2013 The energy required to produce
materials: constraints on energy-intensity improvements, parameters of demand. Phil Trans R Soc A
371: 20120003.
http://dx.doi.org/10.1098/rsta.2012.0003
Iron
Aluminium
Energy intensity
controled by the
mining &
separation steps
Energy intensity
controled by the
chemical
reduction step

Chemical reduction steps
• Iron
2Fe2O3(s) + 3C(s) → 4Fe(l) + 3CO2(g)
Fe2O3(s) + 3CO(s) → 2Fe(l) + 3CO2(g)
CaCO3(s) → CaO(s) + CO2(g)
CaO(s) + SiO2(s) → CaSiO3(l)
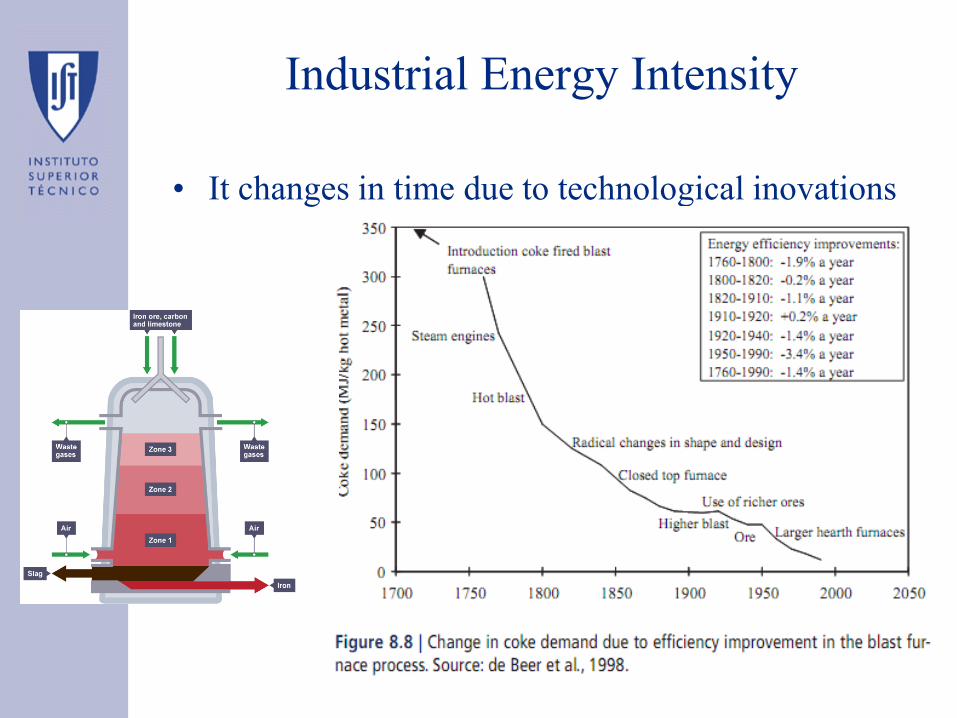
Industrial Energy Intensity
• It changes in time due to technological inovations

Thermodynamic limits
• Iron
– The ΔG˚ for the chemical reaction is 1.4 MJ/kg Fe
2Fe2O3(s) + 3C(s) → 4Fe(l) + 3CO2(g)

Industrial Energy Intensity
• Steel
Gutowski TG, Sahni S, Allwood JM, Ashby MF,Worrell E. 2013 The energy required to produce
materials: constraints on energy-intensity improvements, parameters of demand. Phil Trans R Soc A
371: 20120003.
http://dx.doi.org/10.1098/rsta.2012.0003
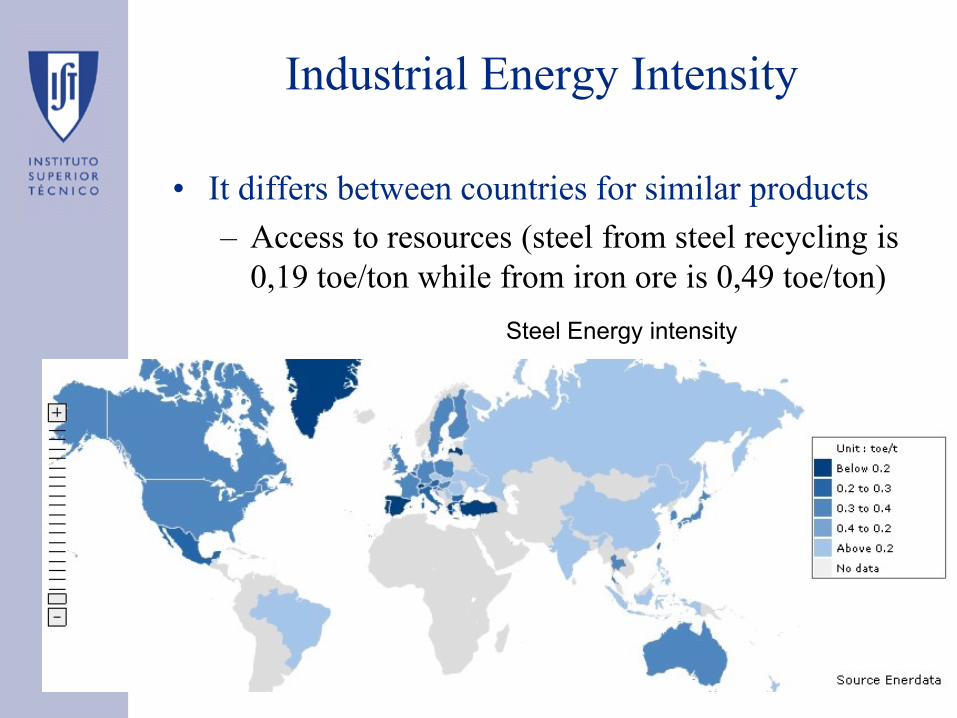
Industrial Energy Intensity
• It differs between countries for similar products
– Access to resources (steel from steel recycling is
0,19 toe/ton while from iron ore is 0,49 toe/ton)
Steel Energy intensity

Industrial Energy Intensity
• It differs between countries for similar products
– Access to resources
– Energy Prices
– Plant size and age of capital stock
– Capital cost (more efficient capital is also more
expensive - interest rates)
– Awareness of energy efficiency measures and
opportunity cost
– Government policies
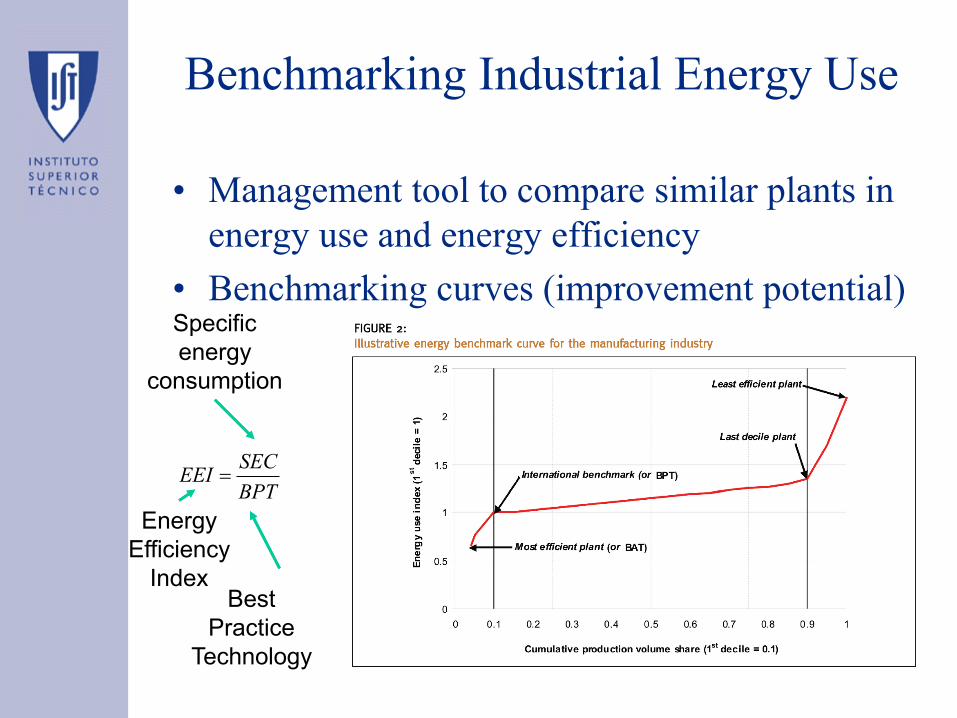
Benchmarking Industrial Energy Use
• Management tool to compare similar plants in
energy use and energy efficiency
• Benchmarking curves (improvement potential)
SECEEI
BPT
Specific
energy
consumption
Best
Practice
Technology
Energy
Efficiency
Index

Benchmarking Industrial Energy Use
• Management tool to compare similar plants in
energy use and energy efficiency
• Benchmarking curves (improvement potential)
SECEEI
BPT

Industrial Energy Intensity

Industrial Energy Intensity

Benchmarking Industrial Energy Use
• Average 10-20% or 30-35% improvement potential
– Lower than for other energy uses (e.g. in buildings is close to
50%)

Industrial Energy Intensity
• Aggregated industrial energy intensity (energy
use per unit of VA):
– Depends on what?
Industrial Energy Use
VA

Industrial Energy Intensity
• Industrial energy intensity (energy use per unit
of VA):
– Efficiency
– Sectoral
Structure
Industrial Energy Use
VA
Why do we need materials?
• To provide Services
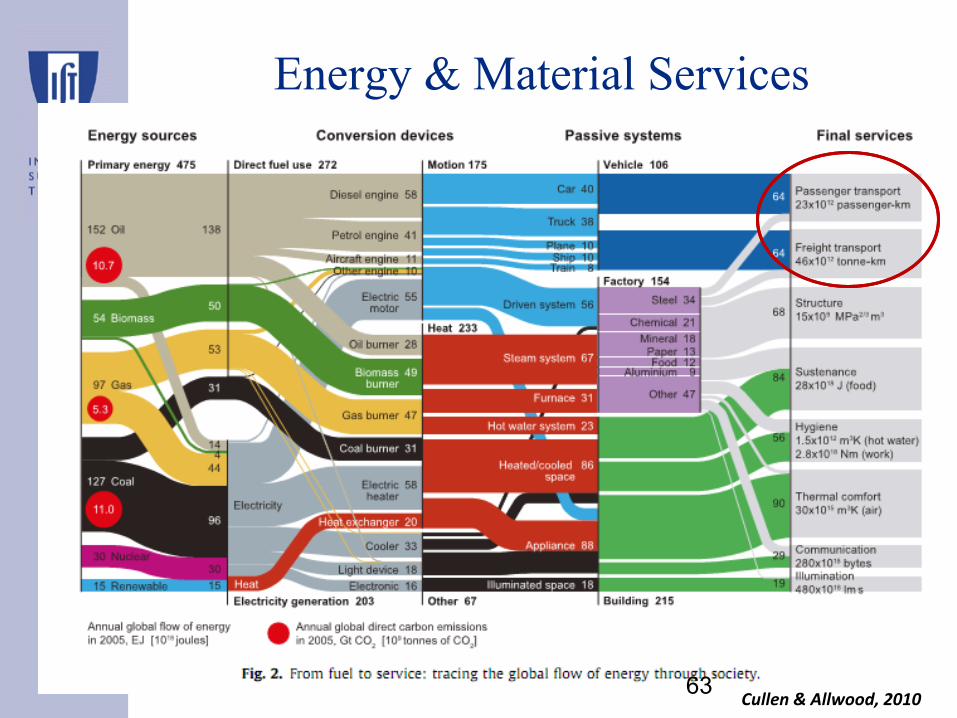
Energy & Material Services
Cullen & Allwood, 201063

Direct Energy
Cullen & Allwood, 201064
direct
energy

“Direct” Energy efficiency of
transport
• Depends on what?
15.7 l/100km4.7 l/100km
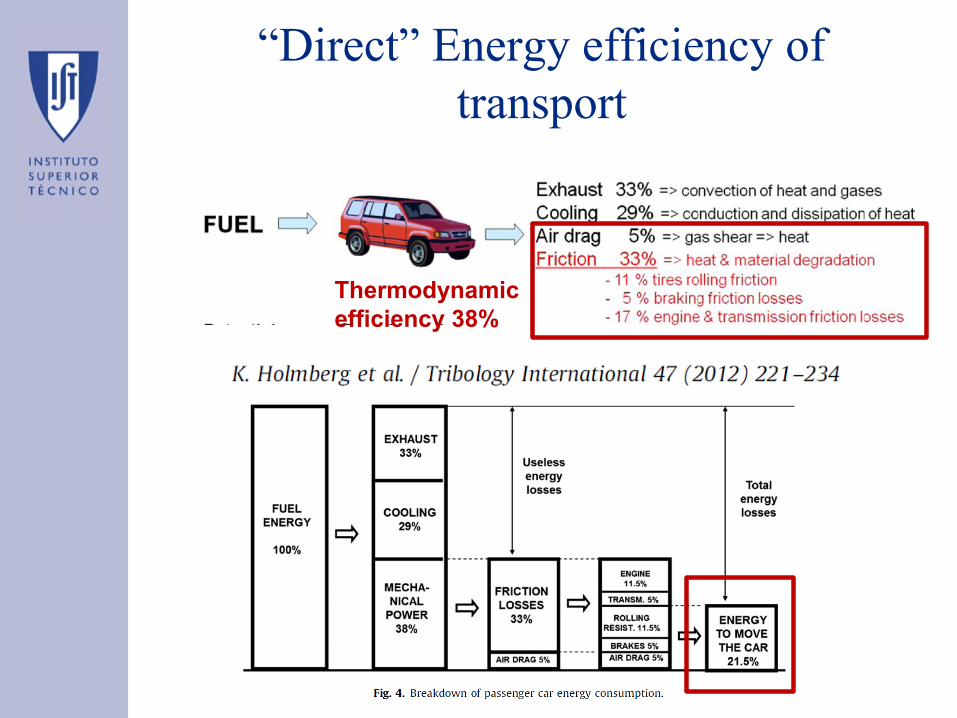
“Direct” Energy efficiency of
transport
Thermodynamic
efficiency 38%
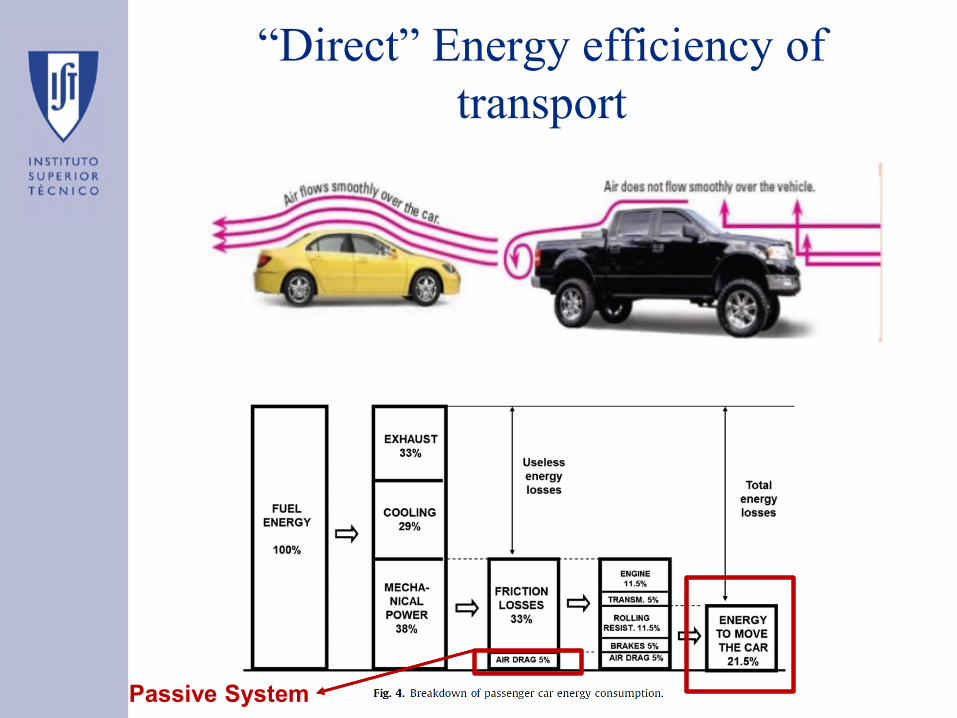
“Direct” Energy efficiency of
transport
Passive System

The passive system

Material efficiency
• Reducing embodied energy in passive system (MJ/ton)
• Improving passive system reducing direct energy per unit of
service
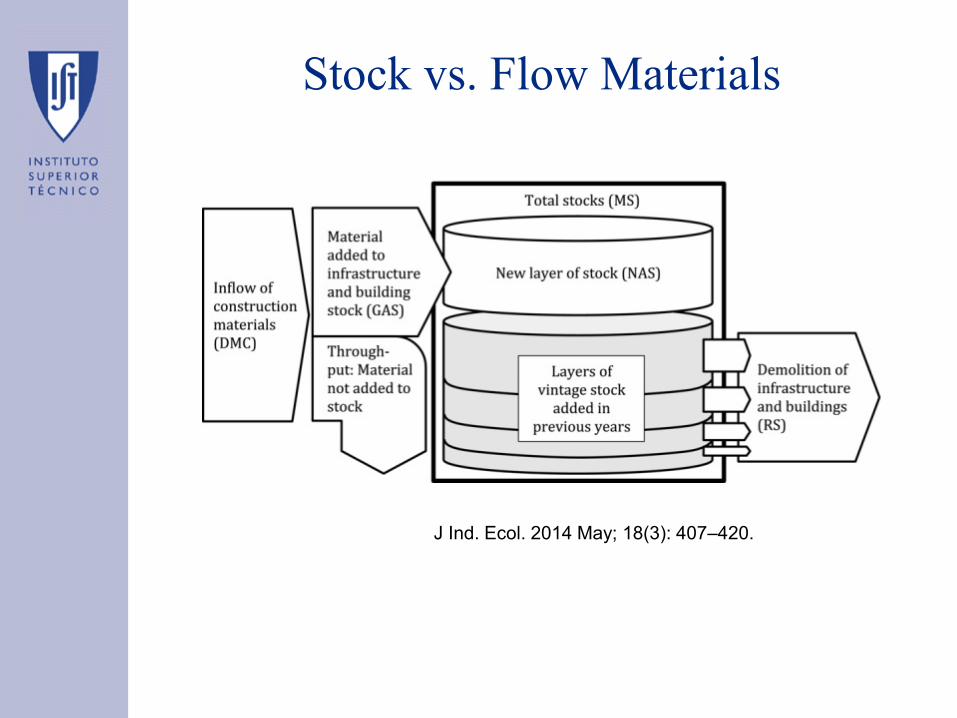
Stock vs. Flow Materials
J Ind. Ecol. 2014 May; 18(3): 407–420.

Stock vs. Flow Materials
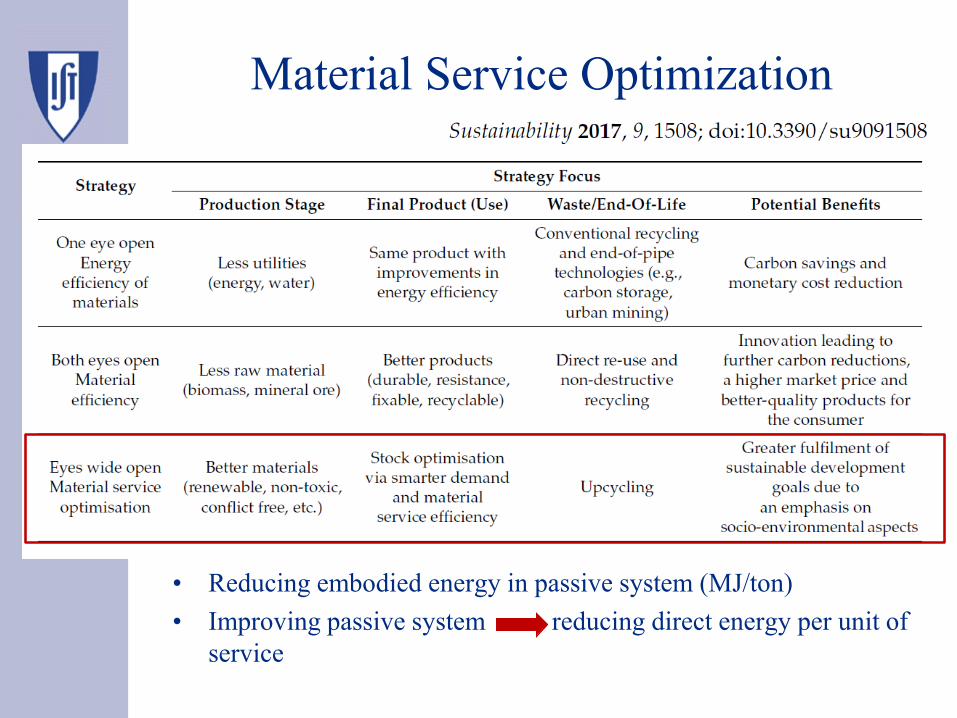
Material Service Optimization
• Reducing embodied energy in passive system (MJ/ton)
• Improving passive system reducing direct energy per unit of
service

Energy vs. Exergy efficiency

Energy Management
Class # 6 :: Block Diagrams (cont.) & LCA & SGCIE
Exercise
• A factory produces 2 end products: P1 and P2. These products follow the production process shown in the diagram below, with P1 = 50000 ton/year and P2 = 30000 ton/year. The operation G treats the effluents from E and F. These two (E and F) are the only productive operations that generate waste, and SE = 1.2, SF = 1.3. In operation G, only 20% of the input effluent, exits the process as waste. The values of composition are as follows: f4 = 0.4, f6 = 0.5. The table presents the specific consumption of each operation. Consider that for electricity: 0.215 kgep/kWh & 0.47 kg CO2e/KWh and for fueloil 0.984 kgep/kg & 3236.4 kg CO2e/toe
a) What is the carbon intensity of this factory?
A B C D E F G H
Electricidade (kWh/ton produto) 100 20 30 20 20 20
Thick Fuel Óleo (kg/ton produto) 50 60 50
8 (produção 1)A
C
D
E
B2
1
F
G 1413
1211
10 (produção 2)
3
4
5
6
7
9

Energy Management
Class # 6 :: Block Diagrams (cont.) & LCA & SGCIE
Exercise
8 (produção 1)A
C
D
E
B2
1
F
G 1413
1211
10 (produção 2)
3
4
5
6
7
9
3 4 5 6
7 9 10 11 12 2
3 4 8
8 8 10 10
100 20 300.215 0.47
20 20 20 kg CO
50 60 0.984 3.2364
CE CE kgoe
m m m m
m m m m m
m m mCI
m m