Comparison of Diagnostic Performance of Two-Dimensional ...
7
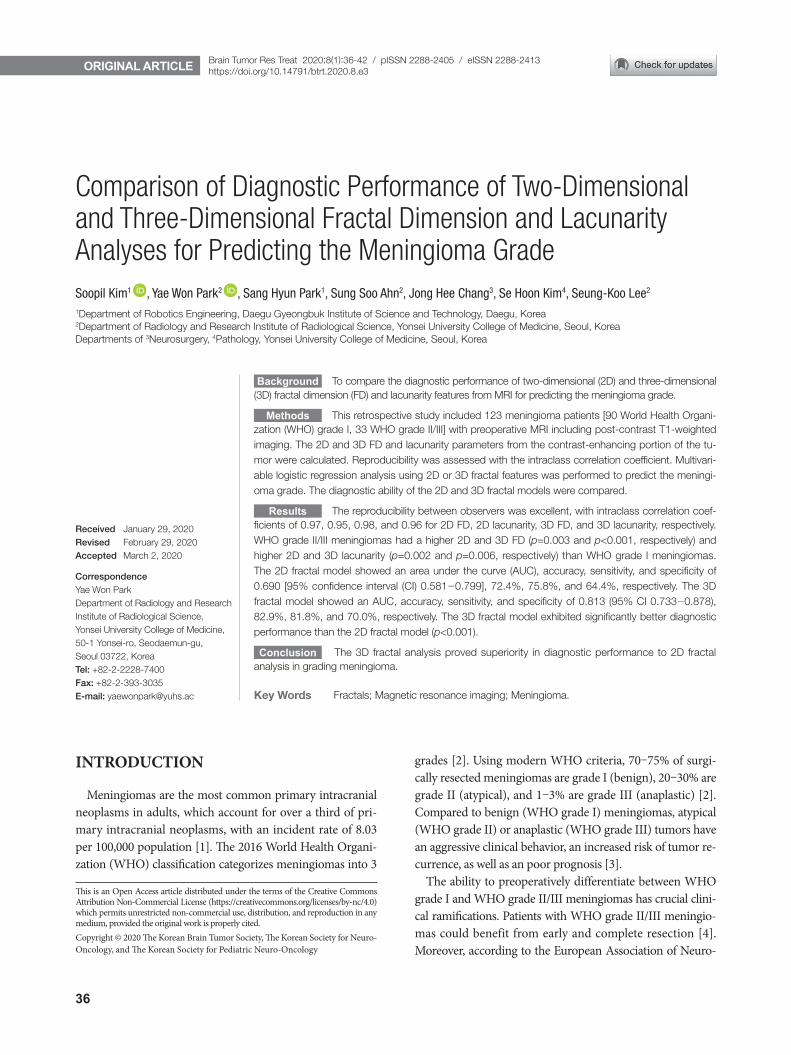
36 INTRODUCTION Meningiomas are the most common primary intracranial neoplasms in adults, which account for over a third of pri- mary intracranial neoplasms, with an incident rate of 8.03 per 100,000 population [1]. e 2016 World Health Organi- zation (WHO) classification categorizes meningiomas into 3 Comparison of Diagnostic Performance of Two-Dimensional and Three-Dimensional Fractal Dimension and Lacunarity Analyses for Predicting the Meningioma Grade Soopil Kim 1 , Yae Won Park 2 , Sang Hyun Park 1 , Sung Soo Ahn 2 , Jong Hee Chang 3 , Se Hoon Kim 4 , Seung-Koo Lee 2 1 Department of Robotics Engineering, Daegu Gyeongbuk Institute of Science and Technology, Daegu, Korea 2 Department of Radiology and Research Institute of Radiological Science, Yonsei University College of Medicine, Seoul, Korea Departments of 3 Neurosurgery, 4 Pathology, Yonsei University College of Medicine, Seoul, Korea Received January 29, 2020 Revised February 29, 2020 Accepted March 2, 2020 Correspondence Yae Won Park Department of Radiology and Research Institute of Radiological Science, Yonsei University College of Medicine, 50-1 Yonsei-ro, Seodaemun-gu, Seoul 03722, Korea Tel: +82-2-2228-7400 Fax: +82-2-393-3035 E-mail: [email protected] Background To compare the diagnostic performance of two-dimensional (2D) and three-dimensional (3D) fractal dimension (FD) and lacunarity features from MRI for predicting the meningioma grade. Methods This retrospective study included 123 meningioma patients [90 World Health Organi- zation (WHO) grade I, 33 WHO grade II/III] with preoperative MRI including post-contrast T1-weighted imaging. The 2D and 3D FD and lacunarity parameters from the contrast-enhancing portion of the tu- mor were calculated. Reproducibility was assessed with the intraclass correlation coefficient. Multivari- able logistic regression analysis using 2D or 3D fractal features was performed to predict the meningi- oma grade. The diagnostic ability of the 2D and 3D fractal models were compared. Results The reproducibility between observers was excellent, with intraclass correlation coef- ficients of 0.97, 0.95, 0.98, and 0.96 for 2D FD, 2D lacunarity, 3D FD, and 3D lacunarity, respectively. WHO grade II/III meningiomas had a higher 2D and 3D FD (p=0.003 and p<0.001, respectively) and higher 2D and 3D lacunarity (p=0.002 and p=0.006, respectively) than WHO grade I meningiomas. The 2D fractal model showed an area under the curve (AUC), accuracy, sensitivity, and specificity of 0.690 [95% confidence interval (CI) 0.581-0.799], 72.4%, 75.8%, and 64.4%, respectively. The 3D fractal model showed an AUC, accuracy, sensitivity, and specificity of 0.813 (95% CI 0.733-0.878), 82.9%, 81.8%, and 70.0%, respectively. The 3D fractal model exhibited significantly better diagnostic performance than the 2D fractal model (p<0.001). Conclusion The 3D fractal analysis proved superiority in diagnostic performance to 2D fractal analysis in grading meningioma. Key Words Fractals; Magnetic resonance imaging; Meningioma. grades [2]. Using modern WHO criteria, 70–75% of surgi- cally resected meningiomas are grade I (benign), 20–30% are grade II (atypical), and 1–3% are grade III (anaplastic) [2]. Compared to benign (WHO grade I) meningiomas, atypical (WHO grade II) or anaplastic (WHO grade III) tumors have an aggressive clinical behavior, an increased risk of tumor re- currence, as well as an poor prognosis [3]. The ability to preoperatively differentiate between WHO grade I and WHO grade II/III meningiomas has crucial clini- cal ramifications. Patients with WHO grade II/III meningio- mas could benefit from early and complete resection [4]. Moreover, according to the European Association of Neuro- ORIGINAL ARTICLE Brain Tumor Res Treat 2020;8(1):36-42 / pISSN 2288-2405 / eISSN 2288-2413 https://doi.org/10.14791/btrt.2020.8.e3 is is an Open Access article distributed under the terms of the Creative Commons Attribution Non-Commercial License (https://creativecommons.org/licenses/by-nc/4.0) which permits unrestricted non-commercial use, distribution, and reproduction in any medium, provided the original work is properly cited. Copyright © 2020 e Korean Brain Tumor Society, e Korean Society for Neuro- Oncology, and e Korean Society for Pediatric Neuro-Oncology
Transcript of Comparison of Diagnostic Performance of Two-Dimensional ...
36
INTRODUCTION
Meningiomas are the most common primary intracranial neoplasms in adults, which account for over a third of pri-mary intracranial neoplasms, with an incident rate of 8.03 per 100,000 population [1]. The 2016 World Health Organi-zation (WHO) classification categorizes meningiomas into 3
Comparison of Diagnostic Performance of Two-Dimensional and Three-Dimensional Fractal Dimension and Lacunarity Analyses for Predicting the Meningioma GradeSoopil Kim1 , Yae Won Park2 , Sang Hyun Park1, Sung Soo Ahn2, Jong Hee Chang3, Se Hoon Kim4, Seung-Koo Lee2
1Department of Robotics Engineering, Daegu Gyeongbuk Institute of Science and Technology, Daegu, Korea2Department of Radiology and Research Institute of Radiological Science, Yonsei University College of Medicine, Seoul, Korea Departments of 3Neurosurgery, 4Pathology, Yonsei University College of Medicine, Seoul, Korea
Received January 29, 2020Revised February 29, 2020Accepted March 2, 2020
CorrespondenceYae Won ParkDepartment of Radiology and Research Institute of Radiological Science, Yonsei University College of Medicine, 50-1 Yonsei-ro, Seodaemun-gu, Seoul 03722, KoreaTel: +82-2-2228-7400Fax: +82-2-393-3035E-mail: [email protected]
Background To compare the diagnostic performance of two-dimensional (2D) and three-dimensional (3D) fractal dimension (FD) and lacunarity features from MRI for predicting the meningioma grade.
Methods This retrospective study included 123 meningioma patients [90 World Health Organi-zation (WHO) grade I, 33 WHO grade II/III] with preoperative MRI including post-contrast T1-weighted imaging. The 2D and 3D FD and lacunarity parameters from the contrast-enhancing portion of the tu-mor were calculated. Reproducibility was assessed with the intraclass correlation coefficient. Multivari-able logistic regression analysis using 2D or 3D fractal features was performed to predict the meningi-oma grade. The diagnostic ability of the 2D and 3D fractal models were compared.
Results The reproducibility between observers was excellent, with intraclass correlation coef-ficients of 0.97, 0.95, 0.98, and 0.96 for 2D FD, 2D lacunarity, 3D FD, and 3D lacunarity, respectively. WHO grade II/III meningiomas had a higher 2D and 3D FD (p=0.003 and p<0.001, respectively) and higher 2D and 3D lacunarity (p=0.002 and p=0.006, respectively) than WHO grade I meningiomas. The 2D fractal model showed an area under the curve (AUC), accuracy, sensitivity, and specificity of 0.690 [95% confidence interval (CI) 0.581-0.799], 72.4%, 75.8%, and 64.4%, respectively. The 3D fractal model showed an AUC, accuracy, sensitivity, and specificity of 0.813 (95% CI 0.733-0.878), 82.9%, 81.8%, and 70.0%, respectively. The 3D fractal model exhibited significantly better diagnostic performance than the 2D fractal model (p<0.001).
Conclusion The 3D fractal analysis proved superiority in diagnostic performance to 2D fractal analysis in grading meningioma.
Key Words Fractals; Magnetic resonance imaging; Meningioma.
grades [2]. Using modern WHO criteria, 70–75% of surgi-cally resected meningiomas are grade I (benign), 20–30% are grade II (atypical), and 1–3% are grade III (anaplastic) [2]. Compared to benign (WHO grade I) meningiomas, atypical (WHO grade II) or anaplastic (WHO grade III) tumors have an aggressive clinical behavior, an increased risk of tumor re-currence, as well as an poor prognosis [3].
The ability to preoperatively differentiate between WHO grade I and WHO grade II/III meningiomas has crucial clini-cal ramifications. Patients with WHO grade II/III meningio-mas could benefit from early and complete resection [4]. Moreover, according to the European Association of Neuro-
ORIGINAL ARTICLE Brain Tumor Res Treat 2020;8(1):36-42 / pISSN 2288-2405 / eISSN 2288-2413https://doi.org/10.14791/btrt.2020.8.e3
This is an Open Access article distributed under the terms of the Creative Commons Attribution Non-Commercial License (https://creativecommons.org/licenses/by-nc/4.0) which permits unrestricted non-commercial use, distribution, and reproduction in any medium, provided the original work is properly cited.Copyright © 2020 The Korean Brain Tumor Society, The Korean Society for Neuro-Oncology, and The Korean Society for Pediatric Neuro-Oncology
S Kim et al.
37
Oncology guideline, incidentally discovered menigiomas on MRI can be managed by observation [5]; thus, the histological grade may not be confirmed. Thus, noninvasive prediction of the meningioma grade may support clinical decision-making by providing information on whether observation should be performed. However, currently, the value of meningioma grading on the basis of neuroimaging has been low [6]. Con-ventional imaging features are subjective [7], and diffusion and perfusion imaging has shown contradictory results [8-10].
Fractal features are image descriptors that mathematically measures the geometrical complexity [11,12]. In particular, the uniqueness of fractal features lies in its ability to quantify natural objects with high structural complexities that are poorly represented by the conventional Euclidean geometry, thereby allowing analysis of underlying tissue biology reflect-ed as morphological information. Fractal dimension (FD) and lacunarity are the two parameters used in fractal analysis. FD describes the intrinsic shape of an object; as the FD in-creases, the complexity increases [12]. Lacunarity is a geomet-ric measure that represents the degree of rotational (or trans-lational) invariance and gappiness [12]. Several studies have performed fractal analysis on differentiating various brain tu-mors with promising results [13-15], but most studies have analyzed only two-dimensional (2D) or three-dimensional (3D) fractal features. By encompassing the entire tumor, 3D fractal features may potentially provide a more comprehen-sive assessment of the fractal properties of a tumor and show better diagnostic performance than 2D fractal features. How-ever, there has been no previous study that compared the di-agnostic accuracy of 2D and 3D fractal models.
We hypothesized that 3D fractal features may exhibit true fractal behavior and show superiority in grading meningioma than 2D fractal features. Thus, the purpose of this study was to compare the diagnostic performance of 2D and 3D FD and lacunarity features for predicting the grade of meningiomas.
MATERIALS AND METHODS
Patient populationThis retrospective study was approved by the Yonsei Univer-
sity Heath System Institutional Review Board, and a waiver of informed consent was obtained. One hundred thirty-one me-ningioma cases in which pathological confirmation and pre-operative conventional MRI were performed between June 2009 and January 2018 were included in this study. Exclusion criteria were as follows: 1) patients with a past history of brain surgery (n=6), and 2) patients who have undergone tumor embolization or gamma knife surgery before MRI examina-tion (n=2). A total of 123 patients were included in this study (100 females and 23 males; mean age: 57.9±13.0 years).
MRI protocolMRI scans was performed using a 3-T MRI scanner (Achie-
va, Philips Medical Systems, Best, the Netherlands) with an eight-channel head coil. The preoperative MRI protocol in-cluded T1-weighted [repetition time (TR)/echo time (TE): 2,000/10 ms; field of view: 230 mm; section thickness: 5 mm; matrix: 320×198] and post-contrast T1-weighted (T1C) images (TR/TE: 2000/10 ms; field of view: 250 mm; section thickness: 2 mm; and matrix: 256×256). T1C images were acquired after the administration of 0.1 mL/kg of gadolinium-based contrast material (Gadovist; Bayer, Leverkusen, Germany).
Pathologic diagnosisAccording to the 2016 WHO criteria, pathological diagnosis
and meningioma grading was performed by a neuropatholo-gist [12]. The mitosis count was evaluated using the mitotic marker phosphohistone-H3. The mitosis index was determined by counting the number of unequivocal mitotic figures in 10 consecutive high-power fields (×400) containing the highest number of mitoses. The Ki-67 labeling index was estimated.
Segmentation of the tumorTumor segmentation was performed by a neuroradiologist
(Y.W.P.), blinded to the clinical and histopathologic results. The regions of interests were segmented using an open source software platform for medical image informatics (3D slicer, version 4.10.2; available at: http://slicer.org). Regions of inter-ests were drawn on every tumor slice on T1C images, using an intensity threshold-based semiautomatic method. Gross cys-tic, necrotic, or hemorrhagic areas were avoided using T1-weighted and T1C images. To test the interobserver reproduc-ibility, images from 20 patients were randomly selected and separately segmented by another neuroradiologist (S.S.A.).
2D and 3D fractal analysisComputation of the 2D and 3D box-counting FD and lacu-
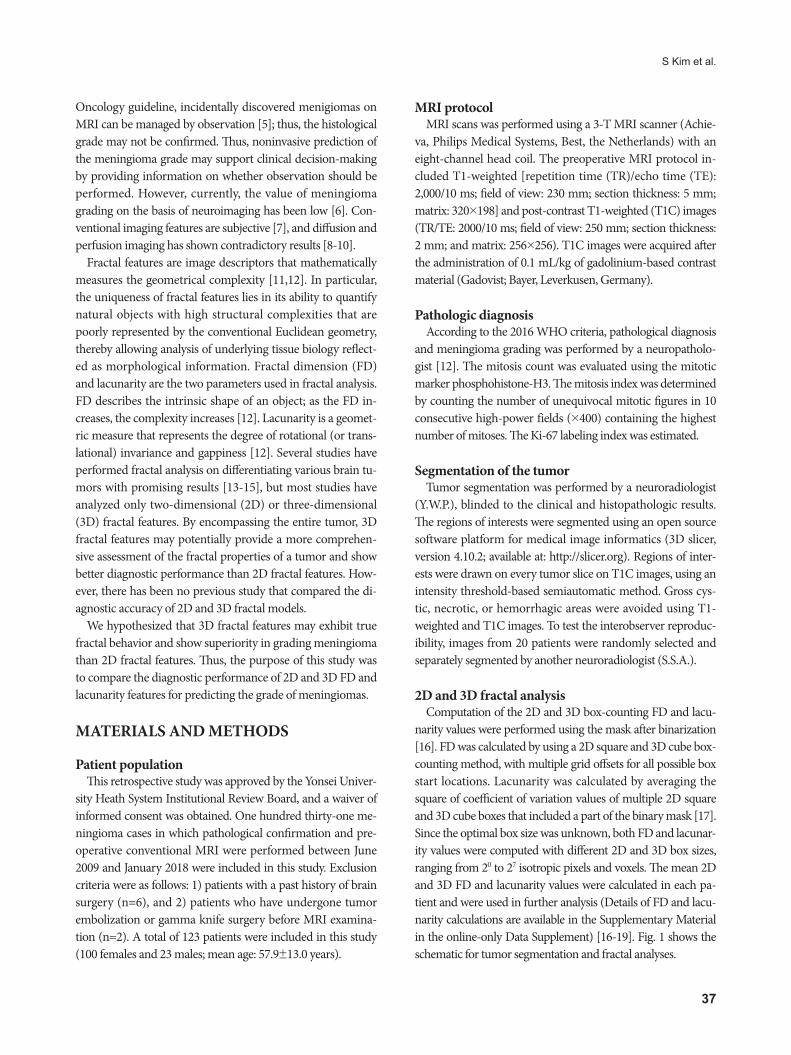
narity values were performed using the mask after binarization [16]. FD was calculated by using a 2D square and 3D cube box-counting method, with multiple grid offsets for all possible box start locations. Lacunarity was calculated by averaging the square of coefficient of variation values of multiple 2D square and 3D cube boxes that included a part of the binary mask [17]. Since the optimal box size was unknown, both FD and lacunar-ity values were computed with different 2D and 3D box sizes, ranging from 20 to 27 isotropic pixels and voxels. The mean 2D and 3D FD and lacunarity values were calculated in each pa-tient and were used in further analysis (Details of FD and lacu-narity calculations are available in the Supplementary Material in the online-only Data Supplement) [16-19]. Fig. 1 shows the schematic for tumor segmentation and fractal analyses.
38 Brain Tumor Res Treat 2020;8(1):36-42
Comparison of 2D and 3D Fractal Analyses for Meningioma Grade
RESULTS
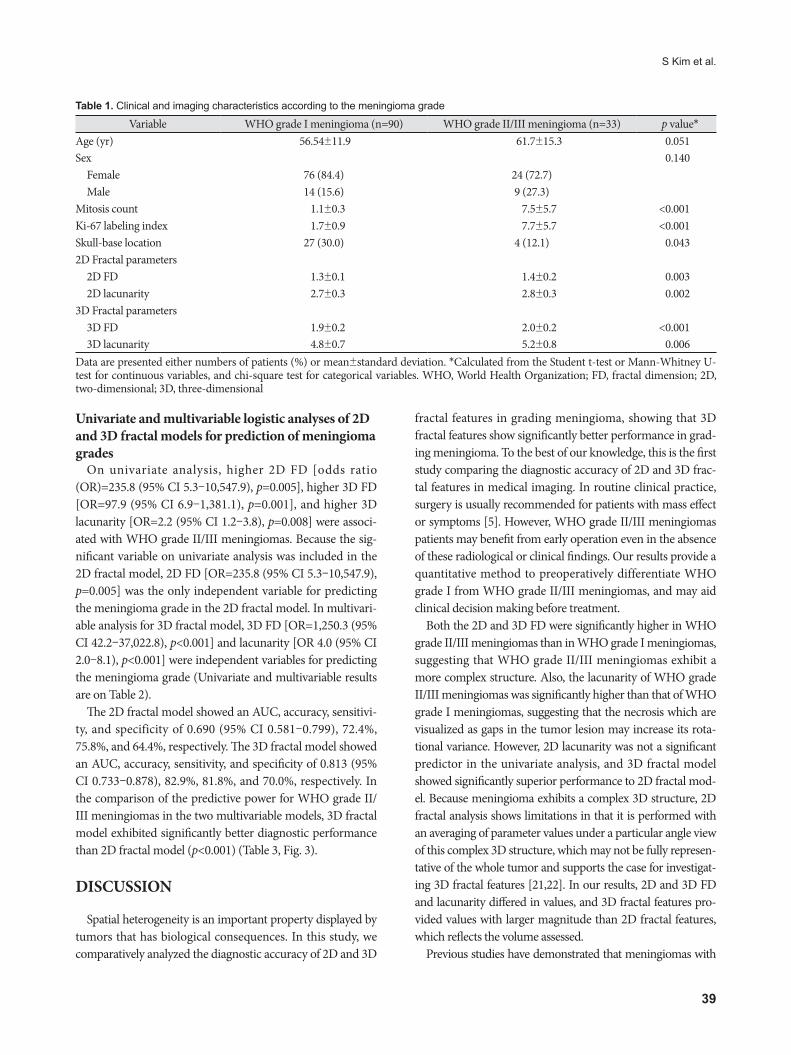
The clinical, histopathological characteristics and fractal features of the 123 patients are summarized in Table 1. There were 90 WHO grade I meninigiomas and 33 WHO grade II/III meningiomas. Among WHO grade I meningiomas, 44 were transitional, 27 meningothelial, 10 fibroblastic, four psammomatous, two angiomatous, two microcystic, and one secretory. Among WHO grade II/III meningiomas, 29 atypi-cal and four anaplastic meningiomas. Patients with WHO grade II/III meningiomas had a lower prevalence of skull base location than WHO grade I meningiomas (12.1% vs. 30.0%, p=0.043).
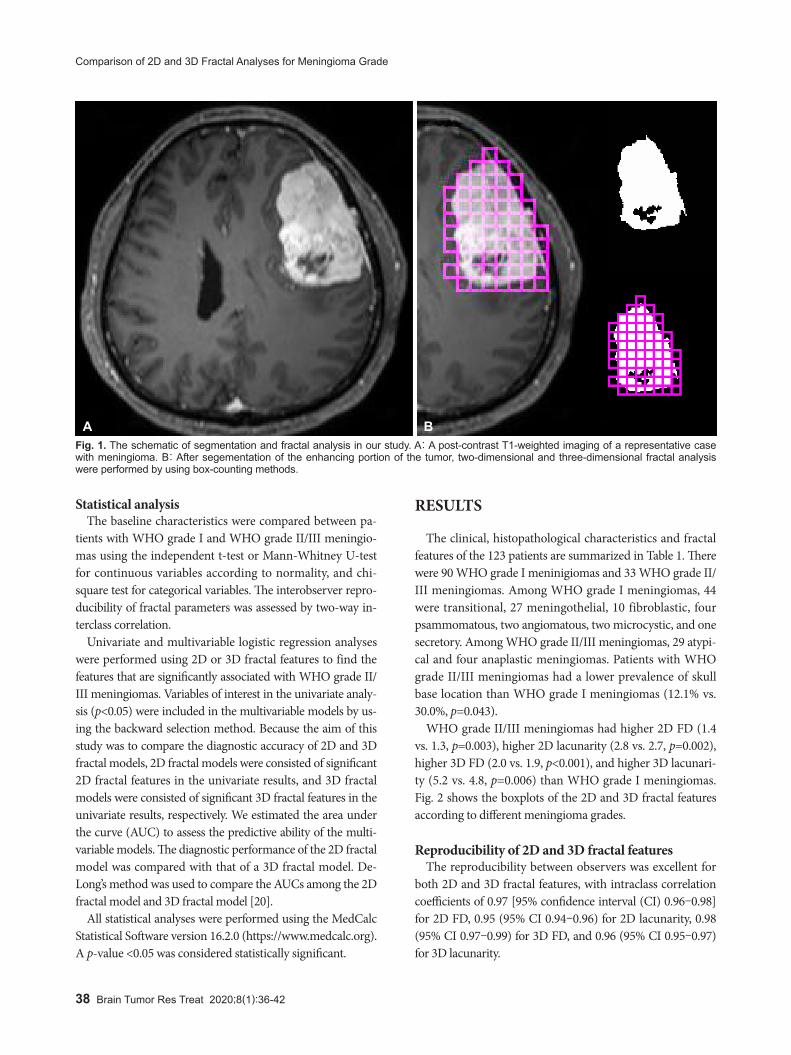
WHO grade II/III meningiomas had higher 2D FD (1.4 vs. 1.3, p=0.003), higher 2D lacunarity (2.8 vs. 2.7, p=0.002), higher 3D FD (2.0 vs. 1.9, p<0.001), and higher 3D lacunari-ty (5.2 vs. 4.8, p=0.006) than WHO grade I meningiomas. Fig. 2 shows the boxplots of the 2D and 3D fractal features according to different meningioma grades.
Reproducibility of 2D and 3D fractal featuresThe reproducibility between observers was excellent for
both 2D and 3D fractal features, with intraclass correlation coefficients of 0.97 [95% confidence interval (CI) 0.96–0.98] for 2D FD, 0.95 (95% CI 0.94–0.96) for 2D lacunarity, 0.98 (95% CI 0.97–0.99) for 3D FD, and 0.96 (95% CI 0.95–0.97) for 3D lacunarity.
Statistical analysisThe baseline characteristics were compared between pa-
tients with WHO grade I and WHO grade II/III meningio-mas using the independent t-test or Mann-Whitney U-test for continuous variables according to normality, and chi-square test for categorical variables. The interobserver repro-ducibility of fractal parameters was assessed by two-way in-terclass correlation.
Univariate and multivariable logistic regression analyses were performed using 2D or 3D fractal features to find the features that are significantly associated with WHO grade II/III meningiomas. Variables of interest in the univariate analy-sis (p<0.05) were included in the multivariable models by us-ing the backward selection method. Because the aim of this study was to compare the diagnostic accuracy of 2D and 3D fractal models, 2D fractal models were consisted of significant 2D fractal features in the univariate results, and 3D fractal models were consisted of significant 3D fractal features in the univariate results, respectively. We estimated the area under the curve (AUC) to assess the predictive ability of the multi-variable models. The diagnostic performance of the 2D fractal model was compared with that of a 3D fractal model. De-Long’s method was used to compare the AUCs among the 2D fractal model and 3D fractal model [20].
All statistical analyses were performed using the MedCalc Statistical Software version 16.2.0 (https://www.medcalc.org). A p-value <0.05 was considered statistically significant.
Fig. 1. The schematic of segmentation and fractal analysis in our study. A: A post-contrast T1-weighted imaging of a representative case with meningioma. B: After segementation of the enhancing portion of the tumor, two-dimensional and three-dimensional fractal analysis were performed by using box-counting methods.
A B
S Kim et al.
39
Table 1. Clinical and imaging characteristics according to the meningioma grade
Variable WHO grade I meningioma (n=90) WHO grade II/III meningioma (n=33) p value*Age (yr) 56.54±11.9 61.7±15.3 0.051Sex 0.140
Female 76 (84.4) 24 (72.7)Male 14 (15.6) 9 (27.3)
Mitosis count 1.1±0.3 7.5±5.7 <0.001Ki-67 labeling index 1.7±0.9 7.7±5.7 <0.001Skull-base location 27 (30.0) 4 (12.1) 0.0432D Fractal parameters
2D FD 1.3±0.1 1.4±0.2 0.0032D lacunarity 2.7±0.3 2.8±0.3 0.002
3D Fractal parameters3D FD 1.9±0.2 2.0±0.2 <0.0013D lacunarity 4.8±0.7 5.2±0.8 0.006
Data are presented either numbers of patients (%) or mean±standard deviation. *Calculated from the Student t-test or Mann-Whitney U-test for continuous variables, and chi-square test for categorical variables. WHO, World Health Organization; FD, fractal dimension; 2D, two-dimensional; 3D, three-dimensional
Univariate and multivariable logistic analyses of 2D and 3D fractal models for prediction of meningioma grades
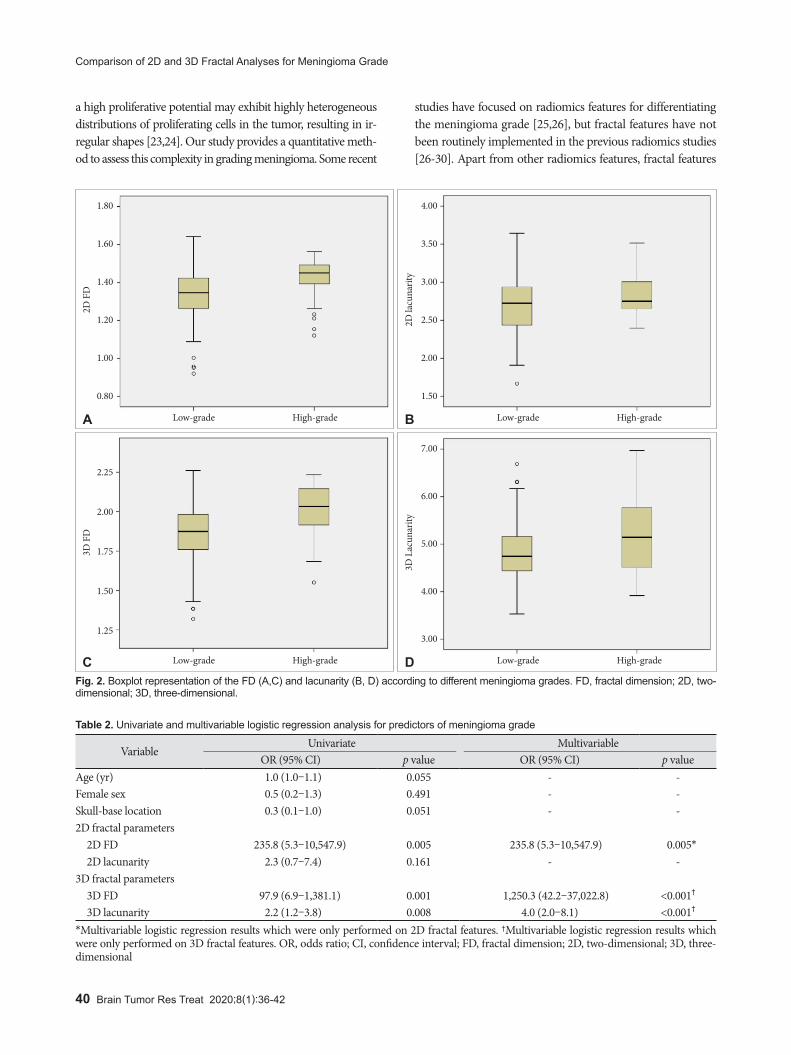
On univariate analysis, higher 2D FD [odds ratio (OR)=235.8 (95% CI 5.3–10,547.9), p=0.005], higher 3D FD [OR=97.9 (95% CI 6.9–1,381.1), p=0.001], and higher 3D lacunarity [OR=2.2 (95% CI 1.2–3.8), p=0.008] were associ-ated with WHO grade II/III meningiomas. Because the sig-nificant variable on univariate analysis was included in the 2D fractal model, 2D FD [OR=235.8 (95% CI 5.3–10,547.9), p=0.005] was the only independent variable for predicting the meningioma grade in the 2D fractal model. In multivari-able analysis for 3D fractal model, 3D FD [OR=1,250.3 (95% CI 42.2–37,022.8), p<0.001] and lacunarity [OR 4.0 (95% CI 2.0–8.1), p<0.001] were independent variables for predicting the meningioma grade (Univariate and multivariable results are on Table 2).
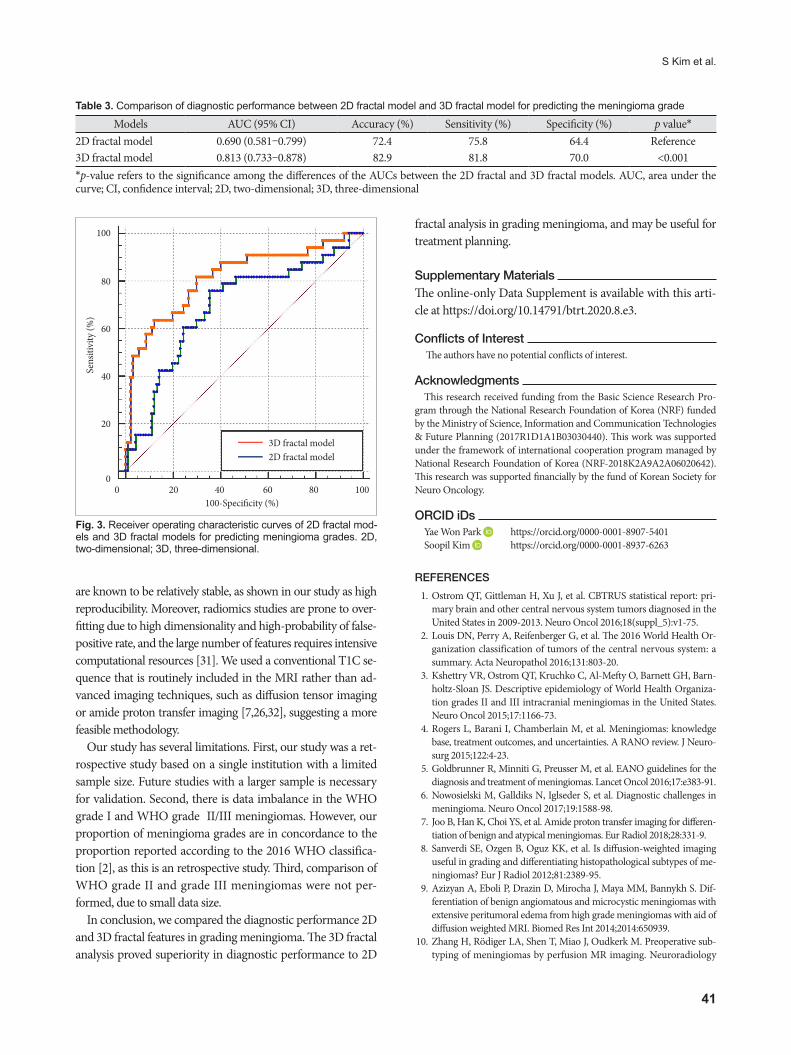
The 2D fractal model showed an AUC, accuracy, sensitivi-ty, and specificity of 0.690 (95% CI 0.581–0.799), 72.4%, 75.8%, and 64.4%, respectively. The 3D fractal model showed an AUC, accuracy, sensitivity, and specificity of 0.813 (95% CI 0.733–0.878), 82.9%, 81.8%, and 70.0%, respectively. In the comparison of the predictive power for WHO grade II/III meningiomas in the two multivariable models, 3D fractal model exhibited significantly better diagnostic performance than 2D fractal model (p<0.001) (Table 3, Fig. 3).
DISCUSSION
Spatial heterogeneity is an important property displayed by tumors that has biological consequences. In this study, we comparatively analyzed the diagnostic accuracy of 2D and 3D
fractal features in grading meningioma, showing that 3D fractal features show significantly better performance in grad-ing meningioma. To the best of our knowledge, this is the first study comparing the diagnostic accuracy of 2D and 3D frac-tal features in medical imaging. In routine clinical practice, surgery is usually recommended for patients with mass effect or symptoms [5]. However, WHO grade II/III meningiomas patients may benefit from early operation even in the absence of these radiological or clinical findings. Our results provide a quantitative method to preoperatively differentiate WHO grade I from WHO grade II/III meningiomas, and may aid clinical decision making before treatment.
Both the 2D and 3D FD were significantly higher in WHO grade II/III meningiomas than in WHO grade I meningiomas, suggesting that WHO grade II/III meningiomas exhibit a more complex structure. Also, the lacunarity of WHO grade II/III meningiomas was significantly higher than that of WHO grade I meningiomas, suggesting that the necrosis which are visualized as gaps in the tumor lesion may increase its rota-tional variance. However, 2D lacunarity was not a significant predictor in the univariate analysis, and 3D fractal model showed significantly superior performance to 2D fractal mod-el. Because meningioma exhibits a complex 3D structure, 2D fractal analysis shows limitations in that it is performed with an averaging of parameter values under a particular angle view of this complex 3D structure, which may not be fully represen-tative of the whole tumor and supports the case for investigat-ing 3D fractal features [21,22]. In our results, 2D and 3D FD and lacunarity differed in values, and 3D fractal features pro-vided values with larger magnitude than 2D fractal features, which reflects the volume assessed.
Previous studies have demonstrated that meningiomas with
40 Brain Tumor Res Treat 2020;8(1):36-42
Comparison of 2D and 3D Fractal Analyses for Meningioma Grade
Table 2. Univariate and multivariable logistic regression analysis for predictors of meningioma grade
VariableUnivariate Multivariable
OR (95% CI) p value OR (95% CI) p valueAge (yr) 1.0 (1.0–1.1) 0.055 - -Female sex 0.5 (0.2–1.3) 0.491 - -Skull-base location 0.3 (0.1–1.0) 0.051 - -2D fractal parameters
2D FD 235.8 (5.3–10,547.9) 0.005 235.8 (5.3–10,547.9) 0.005*2D lacunarity 2.3 (0.7–7.4) 0.161 - -
3D fractal parameters3D FD 97.9 (6.9–1,381.1) 0.001 1,250.3 (42.2–37,022.8) <0.001†
3D lacunarity 2.2 (1.2–3.8) 0.008 4.0 (2.0–8.1) <0.001†
*Multivariable logistic regression results which were only performed on 2D fractal features. †Multivariable logistic regression results which were only performed on 3D fractal features. OR, odds ratio; CI, confidence interval; FD, fractal dimension; 2D, two-dimensional; 3D, three-dimensional
Fig. 2. Boxplot representation of the FD (A,C) and lacunarity (B, D) according to different meningioma grades. FD, fractal dimension; 2D, two-dimensional; 3D, three-dimensional.
Low-grade Low-gradeHigh-grade High-grade
2D F
D
2D la
cuna
rity
1.80
1.60
1.40
1.20
1.00
0.80
4.00
3.50
3.00
2.50
2.00
1.50
A B
Low-grade Low-gradeHigh-grade High-grade
3D F
D
3D L
acun
arity
2.25
2.00
1.75
1.50
1.25
7.00
6.00
5.00
4.00
3.00
C D
a high proliferative potential may exhibit highly heterogeneous distributions of proliferating cells in the tumor, resulting in ir-regular shapes [23,24]. Our study provides a quantitative meth-od to assess this complexity in grading meningioma. Some recent
studies have focused on radiomics features for differentiating the meningioma grade [25,26], but fractal features have not been routinely implemented in the previous radiomics studies [26-30]. Apart from other radiomics features, fractal features
S Kim et al.
41
are known to be relatively stable, as shown in our study as high reproducibility. Moreover, radiomics studies are prone to over-fitting due to high dimensionality and high-probability of false-positive rate, and the large number of features requires intensive computational resources [31]. We used a conventional T1C se-quence that is routinely included in the MRI rather than ad-vanced imaging techniques, such as diffusion tensor imaging or amide proton transfer imaging [7,26,32], suggesting a more feasible methodology.
Our study has several limitations. First, our study was a ret-rospective study based on a single institution with a limited sample size. Future studies with a larger sample is necessary for validation. Second, there is data imbalance in the WHO grade I and WHO grade II/III meningiomas. However, our proportion of meningioma grades are in concordance to the proportion reported according to the 2016 WHO classifica-tion [2], as this is an retrospective study. Third, comparison of WHO grade II and grade III meningiomas were not per-formed, due to small data size.
In conclusion, we compared the diagnostic performance 2D and 3D fractal features in grading meningioma. The 3D fractal analysis proved superiority in diagnostic performance to 2D
fractal analysis in grading meningioma, and may be useful for treatment planning.
Supplementary MaterialsThe online-only Data Supplement is available with this arti-cle at https://doi.org/10.14791/btrt.2020.8.e3.
Conflicts of InterestThe authors have no potential conflicts of interest.
AcknowledgmentsThis research received funding from the Basic Science Research Pro-
gram through the National Research Foundation of Korea (NRF) funded by the Ministry of Science, Information and Communication Technologies & Future Planning (2017R1D1A1B03030440). This work was supported under the framework of international cooperation program managed by National Research Foundation of Korea (NRF-2018K2A9A2A06020642). This research was supported financially by the fund of Korean Society for Neuro Oncology.
ORCID iDsYae Won Park https://orcid.org/0000-0001-8907-5401Soopil Kim https://orcid.org/0000-0001-8937-6263
REFERENCES
1. Ostrom QT, Gittleman H, Xu J, et al. CBTRUS statistical report: pri-mary brain and other central nervous system tumors diagnosed in the United States in 2009-2013. Neuro Oncol 2016;18(suppl_5):v1-75.
2. Louis DN, Perry A, Reifenberger G, et al. The 2016 World Health Or-ganization classification of tumors of the central nervous system: a summary. Acta Neuropathol 2016;131:803-20.
3. Kshettry VR, Ostrom QT, Kruchko C, Al-Mefty O, Barnett GH, Barn-holtz-Sloan JS. Descriptive epidemiology of World Health Organiza-tion grades II and III intracranial meningiomas in the United States. Neuro Oncol 2015;17:1166-73.
4. Rogers L, Barani I, Chamberlain M, et al. Meningiomas: knowledge base, treatment outcomes, and uncertainties. A RANO review. J Neuro-surg 2015;122:4-23.
5. Goldbrunner R, Minniti G, Preusser M, et al. EANO guidelines for the diagnosis and treatment of meningiomas. Lancet Oncol 2016;17:e383-91.
6. Nowosielski M, Galldiks N, Iglseder S, et al. Diagnostic challenges in meningioma. Neuro Oncol 2017;19:1588-98.
7. Joo B, Han K, Choi YS, et al. Amide proton transfer imaging for differen-tiation of benign and atypical meningiomas. Eur Radiol 2018;28:331-9.
8. Sanverdi SE, Ozgen B, Oguz KK, et al. Is diffusion-weighted imaging useful in grading and differentiating histopathological subtypes of me-ningiomas? Eur J Radiol 2012;81:2389-95.
9. Azizyan A, Eboli P, Drazin D, Mirocha J, Maya MM, Bannykh S. Dif-ferentiation of benign angiomatous and microcystic meningiomas with extensive peritumoral edema from high grade meningiomas with aid of diffusion weighted MRI. Biomed Res Int 2014;2014:650939.
10. Zhang H, Rödiger LA, Shen T, Miao J, Oudkerk M. Preoperative sub-typing of meningiomas by perfusion MR imaging. Neuroradiology
Table 3. Comparison of diagnostic performance between 2D fractal model and 3D fractal model for predicting the meningioma grade
Models AUC (95% CI) Accuracy (%) Sensitivity (%) Specificity (%) p value*2D fractal model 0.690 (0.581–0.799) 72.4 75.8 64.4 Reference3D fractal model 0.813 (0.733–0.878) 82.9 81.8 70.0 <0.001*p-value refers to the significance among the differences of the AUCs between the 2D fractal and 3D fractal models. AUC, area under the curve; CI, confidence interval; 2D, two-dimensional; 3D, three-dimensional
Fig. 3. Receiver operating characteristic curves of 2D fractal mod-els and 3D fractal models for predicting meningioma grades. 2D, two-dimensional; 3D, three-dimensional.
100-Specificity (%)0 20 40 60 80 100
100
3D fractal model2D fractal model
Sens
itivi
ty (%
)
80
60
40
20
0
42 Brain Tumor Res Treat 2020;8(1):36-42
Comparison of 2D and 3D Fractal Analyses for Meningioma Grade
2008;50:835-40. 11. Lee G, Lee HY, Park H, et al. Radiomics and its emerging role in lung
cancer research, imaging biomarkers and clinical management: state of the art. Eur J Radiol 2017;86:297-307.
12. Lennon FE, Cianci GC, Cipriani NA, et al. Lung cancer-a fractal viewpoint. Nat Rev Clin Oncol 2015;12:664-75.
13. Liu S, Wang Y, Xu K, et al. Relationship between necrotic patterns in glioblastoma and patient survival: fractal dimension and lacunarity analyses using magnetic resonance imaging. Sci Rep 2017;7:8302.
14. Liu S, Fan X, Zhang C, et al. MR imaging based fractal analysis for dif-ferentiating primary CNS lymphoma and glioblastoma. Eur Radiol 2019;29:1348-54.
15. Smitha KA, Gupta AK, Jayasree RS. Fractal analysis: fractal dimension and lacunarity from MR images for differentiating the grades of glio-ma. Phys Med Biol 2015;60:6937-47.
16. Falconer K. Fractal geometry: mathematical foundations and applica-tions. Hoboken: John Wiley & Sons; 2004.
17. Plotnick RE, Gardner RH, O’Neill RV. Lacunarity indices as measures of landscape texture. Landsc Ecol 1993;8:201-11.
18. Metze K. Fractal dimension of chromatin: potential molecular diag-nostic applications for cancer prognosis. Expert Rev Mol Diagn 2013; 13:719-35.
19. Kane AJ, Sughrue ME, Rutkowski MJ, et al. Anatomic location is a risk factor for atypical and malignant meningiomas. Cancer 2011;117:1272-8.
20. DeLong ER, DeLong DM, Clarke-Pearson DL. Comparing the areas under two or more correlated receiver operating characteristic curves: a nonparametric approach. Biometrics 1988;44:837-45.
21. Sanghera B, Banerjee D, Khan A, et al. Reproducibility of 2D and 3D fractal analysis techniques for the assessment of spatial heterogeneity of regional blood flow in rectal cancer. Radiology 2012;263:865-73.
22. Park YW, Kim S, Ahn SS, et al. Magnetic resonance imaging-based 3-dimensional fractal dimension and lacunarity analyses may predict the meningioma grade. Eur Radiol 2020 Apr 9 [Epub]. Available at:
https://doi.org/10.1007/s00330-020-06788-8.23. Nakasu S, Nakasu Y, Nakajima M, Matsuda M, Handa J. Preoperative
identification of meningiomas that are highly likely to recur. J Neuro-surg 1999;90:455-62.
24. Siegers HP, Zuber P, Hamou MF, van Melle GD, de Tribolet N. The implications of the heterogeneous distribution of Ki-67 labelled cells in meningiomas. Br J Neurosurg 1989;3:101-7.
25. Coroller TP, Bi WL, Huynh E, et al. Radiographic prediction of meningi-oma grade by semantic and radiomic features. PLoS One 2017;12: e0187908.
26. Park YW, Oh J, You SC, et al. Radiomics and machine learning may ac-curately predict the grade and histological subtype in meningiomas using conventional and diffusion tensor imaging. Eur Radiol 2019;29:4068-76.
27. Park YW, Han K, Ahn SS, et al. Whole-tumor histogram and texture analyses of DTI for evaluation of IDH1-mutation and 1p/19q-codele-tion status in World Health Organization grade II gliomas. AJNR Am J Neuroradiol 2018;39:693-8.
28. Park YW, Choi YS, Ahn SS, Chang JH, Kim SH, Lee SK. Radiomics MRI phenotyping with machine learning to predict the grade of lower-grade gliomas: a study focused on nonenhancing tumors. Korean J Radiol 2019;20:1381-9.
29. Park CJ, Choi YS, Park YW, et al. Diffusion tensor imaging radiomics in lower-grade glioma: improving subtyping of isocitrate dehydrogenase mutation status. Neuroradiology 2020;62:319-26.
30. Park YW, Han K, Ahn SS, et al. Prediction of IDH1-mutation and 1p/19q-codeletion status using preoperative MR imaging phenotypes in lower grade gliomas. AJNR Am J Neuroradiol 2018;39:37-42.
31. Park JE, Park SY, Kim HJ, Kim HS. Reproducibility and generalizabili-ty in radiomics modeling: possible strategies in radiologic and statisti-cal perspectives. Korean J Radiol 2019;20:1124-37.
32. Toh CH, Castillo M, Wong AM, et al. Differentiation between classic and atypical meningiomas with use of diffusion tensor imaging. AJNR Am J Neuroradiol 2008;29:1630-5.