Comparison between Total Fecal Coliform and...
17
UNIVERSITY OF HOUSTON Comparison between Total Fecal Coliform and E. coli Concentrations in Water And Sediment Civil and Environmental Engineering Research Experience for Undergraduates Becky Jimenez, REU Student Dr. Hanadi Rifai, Faculty Advisor Anuradha Desai, Graduate Mentor 7/28/2009
Transcript of Comparison between Total Fecal Coliform and...

UNIVERSITY OF HOUSTON
Comparison between Total Fecal Coliform and E. coli Concentrations in Water
And Sediment Civil and Environmental Engineering Research Experience for Undergraduates
Becky Jimenez, REU Student
Dr. Hanadi Rifai, Faculty Advisor
Anuradha Desai, Graduate Mentor
7/28/2009

1
Table of Contents
Introduction ....................................................................................................................................2
Background and Theory................................................................................................................3
Site Background .......................................................................................................................3
Characteristics of Pathogens in Samples ..................................................................................4
Method ............................................................................................................................................4
Analysis ...........................................................................................................................................6
Comparing Water and Sediment Samples ................................................................................7
Temporal Effects ......................................................................................................................7
Solar Effects ...........................................................................................................................10
Decay Rate………………………………………………………………………………….11
Conclusion ....................................................................................................................................14
References .....................................................................................................................................15

2
Abstract:
Studies on fecal indicator bacteria (FIB) in sediment have shown that sediment contains
greater concentrations of fecal coliforms (FC) than the overlying water. (D. L. Craig 2004)
(LaLiberte1981) (Niewolak 1998) (Burton Jr. 1987) By only analyzing water, the amount of
bacterial and pathogenic concentration may be underestimated. Research has shown that
sediment provides a more suitable environment than water by offering protection from predators
and insolation and by providing higher concentrations of nutrients and organic carbon for
bacteria. (Lee 2006) (D. L. Craig 2002) Thus, the amount of bacteria in sediment gives more
accurate results regarding the safety of certain sites than only measuring bacteria concentrations
in water from the same areas.
Introduction:
The goal of this research will be to measure the fluctuation in concentrations of fecal
indicator bacteria (FIB) in sediment and water and to compare the concentration between the two
in Cole Creek. Fecal indicator bacteria are known to survive in water, but there is more research
concerning the presence of FIBs in water than in sediment. Most often, only FIB levels in water
are considered when monitoring water standards and that of the underlying sediment is not
measured despite the research that has shown that sediment can harbor a higher FIB
concentration because it provides a more protective environment for bacteria than water does.
(Niewolak 1998) By comparing the concentrations, one would be able to determine whether
using FIB levels in water as a standard for water quality is sufficient, or, if, only using those
values in water is underestimating possible bacterial contamination, and whether it would be
necessary to take into account FIB concentration in sediment.
Figure 1: Cole Creek

3
Background and Theory:
Fecal indicator bacteria are known to survive in water, but there is an increasing amount
of research concerning the presence of FIBs in sediment. Studies on fecal indicator bacteria in
sediment have shown that sediment may contain greater concentrations of FIBs than the
overlying water. By incorporating concentration levels of FIBs in sediment into water quality
standards, safer guidelines can be established when monitoring the safety of water used for
recreational purposes.
Higher concentrations of bacteria are believed to exist in sediment, because it provides a
more suitable environment for bacteria than water by providing larger amounts of nutrients and
carbon on particles, decreasing sunlight inactivation, and providing protection against predators
such as flagellates which are unable to graze on bacteria when they are attached to sediment
because of the particle’s large size. (Friesa 2008) For this reason, the amount of bacteria in
sediment could give more accurate results regarding the safety of certain sites than only
measuring bacterial concentrations in water from the same areas. Examining the concentrations
of FIBs in sediments, allows an opportunity for analysis to be taken of sediment conditions that
may support FIB concentration.
Site Background
Cole Creek, part of the Whiteoak Bayou watershed, is also identified by segment number
1017B and Station ID 16593. The soils in the Whiteoak Bayou watershed have been classified by
the STATE Geographic Database (STATSGO) as Clodine and Katy soil series. Clodine soils are
characterized as very deep, somewhat poorly drained, and moderately permeable. Katy soils are
very deep, somewhat poorly drained, and very slowly permeable soils. See Table 1. (CDM 2008)
Figure
2: Cole Creek- Station ID 16593

4
Table1: Soil Series in Whiteoak Bayou Watershed
Map Unit
ID:
Soil Series
Name:
Min Available
Water Capacity
(in/in):
Max Available Water Capacity
(in/in):
Min Bulk Density
(g/cmˆ3):
TX 100 Clodine 0.15 0.2 1.35
TX 248 Katy 0.15 0.2 1.3
Characteristics of Pathogens in Samples
Total coliforms are a type of harmless microorganisms that live within the intestines of
humans, warm- and cold-blooded animals. Total coliforms are used as indicators that signal the
presence of fecal pathogens. Fecal indicator bacteria (FIB) fall under this category of which
E.coli is a widely known member. The presence of E. coli is evidence of recent fecal
contamination, and this bacteria is known to survive longer in sediment than in water. (Nature
2004)
Fecal indicator bacteria are used to measure the quality standards of water used for
agricultural, industrial, and recreational purposes. A correlation is made between the survival of
FIBs and pathogens which cause diseases. If FIBs survive, then pathogens are assumed to
survive under the same environmental conditions. (Knee 2008) When exposed to certain
environmental elements, the bacteria eventually die-off. Sunlight exposure, pH levels, chemicals
placed in water to inhibit bacterial growth, predators and temperature are some environmental
conditions that affect their ability to survive. But still some bacteria have been known to survive
in sediment for months. (Nature 2004)
Method:
Prior to going to the sampling site a reconnaissance group goes out to the designated
location to determine where the best location would be to collect samples. Once the site is
chosen, the sampling can begin. Sampling occurred at Cole Creek, which is part of theWhiteoak
Bayou Watershed.
Samples of sediment and water were taken at relatively close distances to each other to
provide for a better comparison between sediment and water samples. At a later time, the
sampling site was moved to an area within a fifty-foot radius of the original site because of a
decrease in sediment availability. The samples were collected over a twelve hour period from six
in the morning until six in the evening to allow time to experience the effects of sunlight on the
bacteria.
At the location, the YSI 6820 Multi-Parameter Water Quality Sonde was used to measure
the physical conditions of the water, after having been previously calibrated for conductivity,
turbidity, and pH. The YSI readings were then checked and recorded every ten minutes for
temperature, pH, conductivity, and salinity.
A UV reader was also used to measure incoming UV radiation every ten minutes. These
readings and the times for which they were taken along with those for the YSI were collected in
a logbook.
Water samples were collected in previously sterilized buckets and poured into three four
ounce Nasco Whirl-Pak Bags to ensure that if an analysis needs to be repeated there is enough of

5
the sample left over to replicate the process on the sample. The bags contain a tablet of sodium
thiosulfate to counteract any chlorine that may affect the bacteria count. The samples are then
stored in a dark cooler filled with ice to prevent bacteria die-off.
During the sampling period, field blanks are collected for every 10 to 20 samples to
confirm that none of the equipment that is used to analyze and collect the sample has been
contaminated. The field blanks are then analyzed for fecal indicator bacteria in the same way that
the samples are processed. If the field blank shows no growth of bacteria, then the equipment
used did not contaminate the samples that are collected.
Lab blanks were also taken to certify that the deionized (DI) water used to process the
samples was not contaminated by fecal indicator bacteria. Duplicates were collected at three
different times to ensure that the collection method is carried out consistently and accurately.
Sediment was collected from the banks of Cole Creek, because of a relatively rocky area
in the middle of the creek. The sediment was collected in a bucket and deposited into glass jars
that were then placed into an ice-filled cooler.
In the lab, the water samples were processed using the IDEXX-Colilert method. All the
samples collected at the site were labeled with the site location ID and the time of collection.
These were matched up with previously prepared and labeled bottles with dilutions of 1:1, 1:10,
and 1:100 of DI water. Thus, the 1:1 dilution is completely filled with a pure sample of water
collected at the site, the 1:10 contains 10 mL of bayou water, and the 1:100 dilution is filled with
1mL of sample water.
One packet of Colilert reagent is then poured into each bottle. The Colilert will detect
total coliforms and E. coli in the water which will be visible because total coliforms consume
and metabolize the reagent making the sample turn yellow, the E. coli can be identified because
the reagent causes the E.coli to become fluorescent. The bottles are then shaken until the reagent
dissolves. Duplicates of each dilution are processed as well. The dilutions are then placed into
the corresponding Quanti-Trays with large and small wells, which are then sealed.
The time and temperature-35±0.5°C- for when the trays are incubated is recorded. The
trays- including lab and field blanks- are then incubated for 24 hours and are then read for total
coliforms and E.coli. The number of large and small wells that are yellow are counted and
identified as positive for total coliforms. Those that are yellow and fluoresce are positive for E.
coli. The number of wells that are positive for total coliforms and E. coli correspond to the most
probable number per 100 mL (MPN/dL).
For the sediment samples, a balance was used to measure out approximately 10 grams of
sediment. The sediment was placed into a 100 mL bottle containing 90 mL of deionized water.
The sediment-water mixture was then sonicated for two minutes, to separate any bacteria that
could possibly be attached to the sediment particles. The sonic probe was inserted into the bottle
without touching the bottom of the bottle. Between sonications, the sonic probe was wiped down
with alcohol wipes to remove any bacteria that may have been left over from the previous
sample. This mixture was then used as the water sample that was poured into the three different
dilutions. The dilutions used to process the sediment samples were different and were changed to
dilutions of 1:10, 1:100, and 1:1000.
One packet of Colilert reagent to was added to each dilution. The bottles were closed and
shaken until the bottles showed no trace of the reagent. Labeled Quanti-Trays with the same
information as the diluted bottles were sealed once the entire contents of each diluted bottle were
carefully poured into the corresponding Quanti-Tray.

6
The trays were incubated at 35°C for 24 hours. A record of the date, time, and
temperature when the incubation began and ended was kept in a log sheet. To read the Quanti-
trays, all the wells that had a distinct yellow color were counted. The number of small and large
yellow wells was recorded in a log book.
Then, the tray was placed inside a dark box with a UV light. The UV light was used to
identify the number of fluorescent wells. The large and small fluorescent wells were then
marked. The number of wells that were both yellow and fluorescent (non-yellow, fluorescent
wells were not counted) were recorded in the log book. These numbers would then provide the
most probable number (MPN) per 100 mL of sample.
Analysis:
Based on the test used to evaluate the sample, bacteria concentrations are measured as
either colony forming units (CFU) or most probable number (MPN) per 100 milliliters (100 mL).
Both are considered equal. The most probable number is based on a statistical approximation of
the actual number of colony forming units in a water sample. Contact recreation with water is
supported when the minimum sample requirements are met; that is, if the geometric mean for
samples that are tested for E.coli do not exceed 126 cfu or MPN per 100 mL; and/or individual
samples do not exceed 394 CFU or MPN per 100 mL more than twenty-five percent of the time.
(Chief Engineer’s Office 2008)
From previously gathered data for Cole Creek, the minimum E. coli concentration was
150 and the maximum 240,000(MPN/dL). The data was collected beginning December 4th
, 2001
through February 21, 2005, the number of samples taken was 38 and the percentage of samples
exceeding 394 MPN/dL was 95% and the geometric mean 2,845 MPN/dL. (CDM 2008)
The geometric means of E. coli concentration in water samples for the years 2002, 2003,
2004, 2005, where calculated to be 970, 672, 2561, and 1200 (MPN/dL). While the geometric
mean for water samples collected gave a value of 441 (MPN/dL).
0
500
1000
1500
2000
2500
3000
2002 2003 2004 2005 2009E.
co
li C
on
cen
trat
ion
(M
PN
/dL)
Years
Geometric Mean
Figure 3: Geometric mean of E. coli concentrations for different years
7
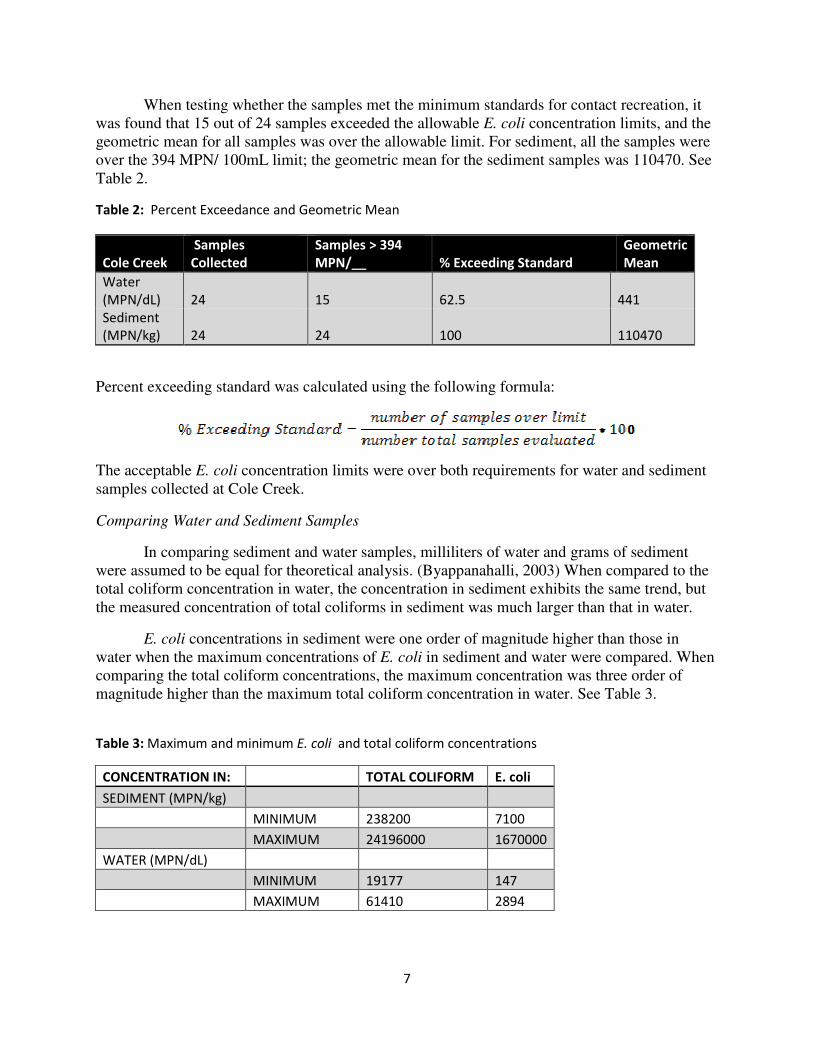
When testing whether the samples met the minimum standards for contact recreation, it
was found that 15 out of 24 samples exceeded the allowable E. coli concentration limits, and the
geometric mean for all samples was over the allowable limit. For sediment, all the samples were
over the 394 MPN/ 100mL limit; the geometric mean for the sediment samples was 110470. See
Table 2.
Table 2: Percent Exceedance and Geometric Mean
Cole Creek
Samples
Collected
Samples > 394
MPN/__ % Exceeding Standard
Geometric
Mean
Water
(MPN/dL) 24 15 62.5 441
Sediment
(MPN/kg) 24 24 100 110470
Percent exceeding standard was calculated using the following formula:
The acceptable E. coli concentration limits were over both requirements for water and sediment
samples collected at Cole Creek.
Comparing Water and Sediment Samples
In comparing sediment and water samples, milliliters of water and grams of sediment
were assumed to be equal for theoretical analysis. (Byappanahalli, 2003) When compared to the
total coliform concentration in water, the concentration in sediment exhibits the same trend, but
the measured concentration of total coliforms in sediment was much larger than that in water.
E. coli concentrations in sediment were one order of magnitude higher than those in
water when the maximum concentrations of E. coli in sediment and water were compared. When
comparing the total coliform concentrations, the maximum concentration was three order of
magnitude higher than the maximum total coliform concentration in water. See Table 3.
Table 3: Maximum and minimum E. coli and total coliform concentrations
CONCENTRATION IN: TOTAL COLIFORM E. coli
SEDIMENT (MPN/kg)
MINIMUM 238200 7100
MAXIMUM 24196000 1670000
WATER (MPN/dL)
MINIMUM 19177 147
MAXIMUM 61410 2894

8
Temporal Effects
Total coliform and E. coli concentration as measured throughout the sampling period was
seen to be influenced by the temperature. As the day progressed and the temperature increased,
the concentration of total coliforms and E. coli decreased for water and sediment samples. See
Figures 1-4.
Figure 4: Total Coliform Concentration Change with Time in water
Figure 5: E. Coli Concentration Change with time in water

9
Figure 6: Fluctuation of Total Coliform Concentration in Sediment
Figure 7: Fluctuation of E. coli Concentration in Sediment

10
Solar effects
The effects of sunlight did show some correlation with the total coliform and E. coli
concentrations, although not as much as in other experiments which support the theory that
sunlight is one of the most powerful factors in bacterial inactivation. (Whitman 2004) But
temperature was a better indicator of E. coli concentration than UV exposure, because the effects
of UV light can vary considerably and quickly because of sudden changes in cloud cover.
Additionally, as the UV measurement changes, reading the UV value is dependent on the
estimation of the person who is recording the value.
Figure 8: Effect of UV radiation on Total Coliform Concentration in Water
Figure 9: Effect of UV radiation on E. coli Concentration in Water

11
Figure 10: UV Radiation effect on E. coli Concentration in Sediment
Figure 11: Affect of UV radiation on E. coli Concentration in Water
Decay Rate
When measuring the rate of decay for bacteria, the form of the inactivation curve
followed the exponential decay law: N= N₀ , where N₀ was the initial concentration of
E.coli, N was the concentration at time t, and k ( ) was the rate at which the bacteria decayed,
which gave a negative coefficient.
From other prior experiments done that monitored the decay rate of bacteria- specifically-
E. coli- in sediment, the fell within range of those values. Where one experiment gave a
values of 0.95, 0.99, and 0.96 for sediment samples taken at three different locations, the data
gave a value of 0.7479. (D. L. Craig 2004)

12
Figure 12: Decay rate of E. coli in sediment
The form of the decay rate for water gave an of 0.1833 when the bacteria
concentration at 12:30 P.M. and 4:00 P.M. (observations 14 and 21, respectively) were used, but
when running a regression on all the values during the sampling period, those two concentrations
were seen as outliers, going over the allowable value of two. (D. L. Craig 2004)
Table 4: Residual Output
Observation Predicted Y Residuals Standard Residuals
1 6.537576654 -0.33504114 -0.577567728
2 6.500241762 -0.21052619 -0.362920013
3 6.462906869 -0.29539038 -0.509214933
4 6.425571977 -0.01375371 -0.023709622
5 6.388237085 -0.03560769 -0.061383064
6 6.350902192 0.113686111 0.1959802
7 6.3135673 0.141631263 0.24415404
8 6.276232408 0.091954779 0.158518184
9 6.238897515 -0.27531817 -0.474613036
10 6.201562623 0.002995139 0.005163234
11 6.164227731 0.121770364 0.209916409
12 6.126892839 0.061371285 0.105796183
13 6.089557946 -0.38577547 -0.665027181
14 6.052223054 1.918171853 3.306680997
15 6.014888162 0.199719937 0.344291425
16 5.977553269 0.33418154 0.576085894
17 5.940218377 -0.05968539 -0.102889919
18 5.902883485 -0.32315366 -0.557075249
19 5.865548592 -0.68376504 -1.178722786
20 5.8282137 -0.38579599 -0.665062552
21 5.790878808 1.480129731 2.551552847
22 5.753543915 -0.76311133 -1.315505556
23 5.716209023 -0.07430195 -0.128086987
24 5.678874131 -0.21928862 -0.378025306
25 5.641539239 -0.40509728 -0.698335481

13
Figure 13: Decay rate of E. coli in water, prior to removal of residuals
After removing the two outliers at times 12:30 P.M. and 4:00 P.M, the rate of decay in
water gave a value of 0.666. Values for E. coli decay in water have been measured to be
0.84, 0.89, 0.89, and 0.95 at four other locations. Thus, the value calculated here fell within a
reasonable value for bacteria decay rates in water. Generally, the decay rate and total coliform
and E. coli concentration began with high values and then showed a decline.
Figure 14: Decay rate of E. coli in water

14
Conclusion:
Most studies only consider the concentrations of fecal indicator bacteria in water and
overlook the concentration of bacteria in sediments. By examining the concentrations of FIBs in
sediments, this experiment opens new ground for research. Because the data shows that sediment
does contain greater concentrations of bacteria, one can look into what conditions are favorable
for bacteria growth in sediment than in water. When considering potential health hazards from
water quality, the levels of bacteria in sediment should not be ignored but rather incorporated
into deciding if water quality is safe for use.
Acknowledgements
The research study described herein was sponsored by the National Science Foundation under the
Award No. EEC-0649163. The opinions expressed in this study are those of the authors and do not
necessarily reflect the views of the sponsor. I would also like to thank Dr. Hanadi Rifai, Anu
Desai, Norma Moreno, Sean Carbonaro, Scott Rauschhuber, Yaa Amoah, Sharon Wells, Nathan
Howell, Jenni McFarland, Lisa Grecho, Maria Modelska, Stephen Ray, Zack Van Brunt, Matt
Feaga and Divagar Lakshmanan.

15
References
Burton Jr., G. Allen, Gunnison, Douglas, Lanza Guy R. "Survival of pathogenic Bacteria in
various Freshwater Sediments." Applied and Environmental Microbiology, 1987: 633-638.
Byappanahalli, Muruleedhara, Fowler, Melanie Shively, Dawn and Whitman, Richard. "Ubiquity
and Persistence of Escherichia coli in a Midwestern Coastal Stream." Applied Environmental
Microbiology Vol. 69, No. 8, August 2003: 4549-4555.
CDM, University of Houston. TECHNICAL SUPPORT DOCUMENT FOR BUFFALO AND
WHITEOAK BAYOU TMDL. Austin: Total Maximum Daily Load Program Texas Commission
on Environmental Quality, 2008.
Chief Engineer’s Office, Water Programs, TMDL Section. Eighteen Total Maximum Daily
Loads for Bacteria in Buffalo and Whiteoak Bayous and Tributaries. Austin: Total Maximum
Daily Load Section, 2008.
Craig, D. L., Fallowfield, H. J., and Cromar, N. J. "Enumeration of faecal coliforms from
recreational coastal sites: evalution of techniques for the separation of bacteria from sediment."
Journal of Applied Microbiology, 2002: 93, 557-565.
Craig, D. L., Fallowfield, H.J., and Cromar, N.J. "Use of Microcosms to Determine persostence
of Escherichia coli in recreational coastal water and sediment and validation with in situ
measurements." Journal of Applied Microbiology, 2004: 922-930.
Friesa, J. Stephen, Characklisb, Gregory W., and Noble, Rachel T. "Sediment–water exchange of
Vibrio sp. and fecal indicator bacteria: Implications for persistence and transport in the Neuse
River Estuary, North Carolina, USA." Water Research, 2008: 941-950.
Knee, Karen L., Leopold, Rose L., Madsen, Ella R., Paytan Adina. "Assessing the Importance of
Sand as a Source of Fecal Indicator Bacteria." Oceanography Vol. 21, No.3 (The Oceanography
Society), 2008: 98-106.
LaLiberte, Paul, Grimes, D. Jay. "Survival of Escherichia coli in Lake Bottom Sediments."
Applied and Environmental Microbiology, 1981: 623-628.
LaLiberte, Paul, Grimes, D. Jay. "Survival of Escherichia coli in Lake Bottom Sediments."
Applied and Environmental Microbiology, 2 November 1981: 623-628.
Lee, Christine M., Lin, Tiffany Y.,Lin, Chu-Ching, Kohbodi, Golenaz A., Bhatt, Anita,Lee,
Robin, Jay, Jennifer A. "Persistence of fecal indicator bacteria in Santa Monica Bay beach
Sediments." Elsevier, 2006: 2593-2602.
Nature. "Fecal Coliforms." 2004.

16
Niewolak, S. "Total Viable Count and Concentration of Enteric BActeria in Bottom Sediments
from the Czarna Hancza River, Northeast POland." Polish Journal of Environmental Studies Vol.
7, No. 5, 1998: 293-306.
Quality, Texas Commission on Environmental. "Sampling Data Query, Surface Water Quality
Monitoring." 2002-2008.
S., Niewolak. "Total Viable Count and Concentration of Enteric BActeria in Bottom Sediments
from the Czarna Hancza River, Northeast Poland." Polish Journal of Environmental Studies Vol.
7, No. 5, 1998: 293-306.
Whitman, Richard L., Nevers, Meredith B., Korinek, Ginger C. and Byappanahall, Muruleedhara
N. "Solar and Temporal Effects on Escherichia coli Concentration at a Lake Michigan
Swimming Beach." Applied and Environmental Microbiology Vol. 70, No. 7, July 2004: 4276-
4285.