Tuxachanie Creek FINAL Fecal Coliform TMDL · Fecal Coliform TMDL For Tuxachanie Creek Coastal...
46
Fecal Coliform TMDL For Tuxachanie Creek Coastal Streams Basin Harrison County, Mississippi Prepared by Mississippi Department of Environmental Quality Office of Pollution Control TMDL/WLA Section of the Water Quality Assessment Branch February 23, 2000 MDEQ P.O. Box 10385 Jackson, MS 39289-0385 (601) 961-5171
Transcript of Tuxachanie Creek FINAL Fecal Coliform TMDL · Fecal Coliform TMDL For Tuxachanie Creek Coastal...

Fecal Coliform TMDLForTuxachanie CreekCoastal Streams BasinHarrison County,Mississippi
Prepared byMississippi Department of Environmental QualityOffice of Pollution ControlTMDL/WLA Section of the Water Quality Assessment Branch
February 23, 2000MDEQP.O. Box 10385Jackson, MS 39289-0385(601) 961-5171

____________________________________ Fecal Coliform TMDL for Tuxachanie Creek, Mississippi
___________________________________________________________________________ii
CONTENTS
PageMONITORED SEGMENT IDENTIFICATION ........................................................................ ivEXECUTIVE SUMMARY......................................................................................................... v
1.0 INTRODUCTION ............................................................................................................1-11.1 Background ...........................................................................................................1-11.2 Applicable Waterbody Segment Use ......................................................................1-31.3 Applicable Waterbody Segment Standard...............................................................1-3
2.0 TMDL ENDPOINT AND WATER QUALITY ASSESSMENT.......................................2-12.1 Selection of a TMDL Endpoint and Critical Condition ...........................................2-12.2 Discussion of Instream Water Quality ....................................................................2-1
2.2.1 Inventory of Available Water Quality Monitoring Data ............................2-12.2.2 Analysis of Instream Water Quality Monitoring Data...............................2-3
3.0 SOURCE ASSESSMENT.................................................................................................3-13.1 Assessment of Point Sources .................................................................................3-13.2 Assessment of Nonpoint Sources ...........................................................................3-2
3.2.1 Failing Septic Systems..............................................................................3-33.2.2 Wildlife ....................................................................................................3-43.2.3 Land Application of Hog and Cattle Manure.............................................3-43.2.4 Grazing Beef and Dairy Cattle ..................................................................3-43.2.5 Cattle Contributions Deposited Directly Instream .....................................3-53.2.6 Urban Development .................................................................................3-5
4.0 MODELING PROCEDURE: LINKING THE SOURCES TO THE ENDPOINT .............4-14.1 Modeling Framework Selection .............................................................................4-14.2 Model Setup ..........................................................................................................4-14.3 Source Representation ...........................................................................................4-1
4.3.1 Failing Septic Systems..............................................................................4-24.3.2 Wildlife ....................................................................................................4-24.3.3 Land Application of Hog and Cattle Manure.............................................4-34.3.4 Grazing Beef and Dairy Cattle ..................................................................4-34.3.5 Cattle Contributions Deposited Directly Instream .....................................4-34.3.6 Urban Development .................................................................................4-3
4.4 Stream Characteristics ...........................................................................................4-44.5 Selection of Representative Modeling Period .........................................................4-44.6 Model Calibration Process .....................................................................................4-54.7 Existing Loading....................................................................................................4-5
5.0 ALLOCATION.................................................................................................................5-15.1 Wasteload Allocations ...........................................................................................5-1

____________________________________ Fecal Coliform TMDL for Tuxachanie Creek, Mississippi
___________________________________________________________________________iii
5.2 Load Allocations....................................................................................................5-15.3 Incorporation of a Margin of Safety .......................................................................5-25.4 Calculation of the TMDL.......................................................................................5-35.5 Seasonality ............................................................................................................5-3
6.0 CONCLUSION.................................................................................................................6-16.1 Future Monitoring ................................................................................................6-16.2 Public Participation................................................................................................6-1
APPENDIX A ........................................................................................................................A-1APPENDIX B......................................................................................................................... B-1DEFINITIONS .......................................................................................................................D-1ABBREVIATIONS ............................................................................................................. AB-1REFERENCES....................................................................................................................... R-1

____________________________________ Fecal Coliform TMDL for Tuxachanie Creek, Mississippi
___________________________________________________________________________iv
MONITORED SEGMENT IDENTIFICATION
Name: Tuxachanie Creek
Waterbody ID: MS117M2
Location: Near Biloxi: From County Road Northwest of White Plains to Mouth atTchoutacabouffa River
County: Harrison County, Mississippi
USGS HUC Code: 03170009
NRCS Watershed: 150
Length: 13 miles
Use Impairment: Contact Recreation
Cause Noted: Fecal Coliform, an Indicator for the Presence of Pathogenic Bacteria
Priority Rank: 80
NPDES Permits: There is one NPDES Permit issued for a facility that discharges fecal coliformin the watershed (Table 3.1).
Standards Variance: None
Pollutant Standard: Fecal coliform colony counts shall not exceed a geometric mean of 200 per 100ml, nor shall more than ten percent of the samples examined during any monthexceed a colony count of 400 per 100 ml.
Waste Load Allocation: 0.508E+12 counts/ 30 days (The TMDL requires all dischargers to meet waterquality standards for disinfection.)
Load Allocation: 1.61E+12 counts/ 30 days
Margin of Safety: Implicit modeling assumptions - The model was run for a time span of 11 years.
Total Maximum Daily 2.12E+12 counts/ 30 daysLoad (TMDL): The TMDL is a combination of the direct input of fecal coliform from NPDES
Permitted dischargers and nonpoint sources due to cows with access tostreams, failing septic tanks, and land surface fecal coliform application ratesnecessary to meet the fecal coliform standard.

____________________________________ Fecal Coliform TMDL for Tuxachanie Creek, Mississippi
___________________________________________________________________________v
EXECUTIVE SUMMARY
A segment of Tuxachanie Creek has been placed on the Mississippi 1998 Section 303(d) List ofWaterbodies as an impaired waterbody segment, due to fecal coliform bacteria. The applicable statestandard specifies that the maximum allowable level of fecal coliform shall not exceed a geometricmean of 200 per 100 ml, nor shall more than ten percent of the samples examined during any monthexceed a colony count of 400 per 100 ml. A review of the available monitoring data for thewatershed indicates that there is a violation of the standard for the impaired waterbody.
Tuxachanie Creek is a tributary of the Tchoutacabouffa River. It flows in a southeastern directionfrom its headwaters until it meets the Tchoutacabouffa River. This TMDL, however, has beendeveloped for the section of Tuxachanie Creek found on the 303(d) List. The 13-mile long impairedsection of the creek is located in Harrison County near Biloxi from a county road northwest of WhitePlains to the creek’s mouth at the Tchoutacabouffa River. The BASINS Nonpoint Source Model(NPSM) was selected as the modeling framework for performing the TMDL allocations for thisstudy. Daily flow values from the USGS Gage 02480500 on Tuxachanie Creek near Biloxi were usedto calibrate the hydrologic flow for the watershed. The weather data used for this model werecollected at Saucier Experimental Forest Station. The representative hydrologic period used for thisTMDL was January 1, 1985, through December 31, 1995.
Fecal coliform loading from nonpoint sources in the watershed were calculated based upon wildlifepopulations; numbers of cattle and hogs; information on livestock and manure management practicesfor the Coastal Basin; and urban development. The estimated fecal coliform production andaccumulation rates due to nonpoint sources for the watershed were incorporated into the model. Also represented in the model were the nonpoint sources such as failing septic systems and cattle thathave direct access to the tributaries of Tuxachanie Creek. There is one NPDES Permitted dischargelocated in the watershed and included as a point source in the model. Under existing conditions,output from the model indicates violation of the fecal coliform standard in the stream. After applyinga load reduction scenario, there were no violations of the standard according to the model.
The scenario used to reduce the fecal coliform load involves a cooperative effort between all fecalcoliform contributors in the Tuxachanie Creek Watershed. First, all NPDES facilities will be requiredto treat their discharge so that the fecal coliform concentrations do not exceed water qualitystandards. Monitoring of all permitted facilities in the Tuxachanie Creek Watershed should becontinued to ensure that compliance with permit limits is consistently attained. Second is thereduction of cattle=s direct access to tributaries. This could be accomplished by fencing streams incattle pastures. Education on best management practices is a vital part of achieving this goal. Finally,a reduction in the fecal coliform contribution from failing septic tanks may be required. This TMDLassumed a high failure rate for septic tanks in the drainage area. A reduction could be accomplishedby education on best management practices for septic tank owners. Additionally, users of individualonsite wastewater treatment plants could be educated on the importance of disinfection of the effluentfrom their treatment plant.
The model accounted for seasonal variations in hydrology, climatic conditions, and watershedactivities. The use of the continuous simulation model allowed for consideration of the seasonal

____________________________________ Fecal Coliform TMDL for Tuxachanie Creek, Mississippi
___________________________________________________________________________vi
aspects of rainfall and temperature patterns within the watershed. Calculation of the fecal coliformaccumulation parameters and source contributions on a monthly basis accounted for seasonalvariations in watershed activities such as livestock grazing and land application of manure.

____________________________________ Fecal Coliform TMDL for Tuxachanie Creek, Mississippi
___________________________________________________________________________1-1
1.0 INTRODUCTION
1.1 Background
The identification of waterbodies not meeting their designated use and the development of totalmaximum daily loads (TMDLs) for those waterbodies are required by Section 303(d) of the CleanWater Act and the Environmental Protection Agency’s (EPA) Water Quality Planning andManagement Regulations (40 CFR part 130). The TMDL process is designed to restore and maintainthe quality of those impaired waterbodies through the establishment of pollutant specific allowableloads. The pollutant of concern for this TMDL is fecal coliform. Fecal coliform bacteria are usedas indicator organisms. They are readily identifiable and indicate the possible presence of otherpathogenic organisms in the waterbody. The TMDL process can be used to establish water qualitybased controls to reduce pollution from both point and nonpoint sources, and to restore and maintainthe quality of water resources.
The Mississippi Department of Environmental Quality (MDEQ) has identified a segment ofTuxachanie Creek as being impaired by fecal coliform bacteria for a length of 13 miles as reportedin the Mississippi 1998 Section 303(d) List of Waterbodies. This segment is listed as impairedbecause sufficient monitoring data is available to show that there is an impairment in this segment.The impaired section of the Tuxachanie Creek is in Harrison County near Biloxi from a county roadnorthwest of White Plains to its mouth at the Tchoutacabouffa River. Tuxachanie Creek ishighlighted in Figure 1.1.
Figure 1.1 Tuxachanie Creek Location Map
____________________________________ Fecal Coliform TMDL for Tuxachanie Creek, Mississippi
___________________________________________________________________________1-2
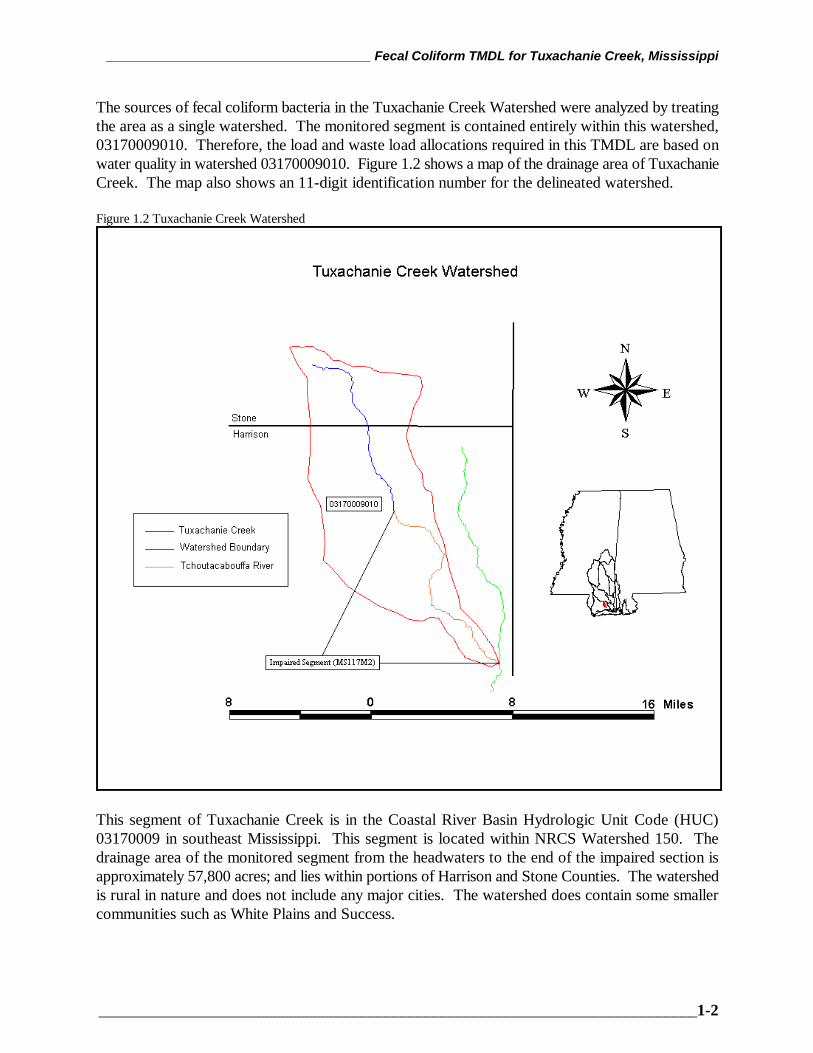
The sources of fecal coliform bacteria in the Tuxachanie Creek Watershed were analyzed by treatingthe area as a single watershed. The monitored segment is contained entirely within this watershed,03170009010. Therefore, the load and waste load allocations required in this TMDL are based onwater quality in watershed 03170009010. Figure 1.2 shows a map of the drainage area of TuxachanieCreek. The map also shows an 11-digit identification number for the delineated watershed.
Figure 1.2 Tuxachanie Creek Watershed
This segment of Tuxachanie Creek is in the Coastal River Basin Hydrologic Unit Code (HUC)03170009 in southeast Mississippi. This segment is located within NRCS Watershed 150. Thedrainage area of the monitored segment from the headwaters to the end of the impaired section isapproximately 57,800 acres; and lies within portions of Harrison and Stone Counties. The watershedis rural in nature and does not include any major cities. The watershed does contain some smallercommunities such as White Plains and Success.

____________________________________ Fecal Coliform TMDL for Tuxachanie Creek, Mississippi
___________________________________________________________________________1-3
Forest is the dominant landuse within this watershed. Figure 3.1 shows the landuse distributionwithin the monitored drainage area.
1.2 Applicable Waterbody Segment Use
Designated beneficial uses and water quality standards are established by the State of MississippiWater Quality Criteria for Intrastate, Interstate, and Coastal Waters regulations. The designateduse for Tuxachanie Creek as defined by the regulations is Contact Recreation. The monitored sectionof Tuxachanie Creek has the designated use of Contact Recreation.
1.3 Applicable Waterbody Segment Standard
The water quality standard applicable to the use of the waterbody and the pollutant of concern isdefined in the State of Mississippi Water Quality Criteria for Intrastate, Interstate, and CoastalWaters. The standard states that the fecal coliform colony counts shall not exceed a geometric meanof 200 per 100 ml, nor shall more than ten percent of the samples examined during any month exceeda colony count of 400 per 100 ml. This water quality standard will be used as targeted endpoints toevaluate impairments and establish this TMDL.

____________________________________ Fecal Coliform TMDL for Tuxachanie Creek, Mississippi
___________________________________________________________________________2-1
2.0 TMDL ENDPOINT AND WATER QUALITY ASSESSMENT
2.1 Selection of a TMDL Endpoint and Critical Condition
One of the major components of a TMDL is the establishment of instream numeric endpoints, whichare used to evaluate the attainment of acceptable water quality. Instream numeric endpoints,therefore, represent the water quality goals that are to be achieved by implementing the load andwaste load reductions specified in the TMDL. The endpoints allow for a comparison betweenobserved instream conditions and conditions that are expected to restore designated uses. Theinstream fecal coliform target for this TMDL is a 30-day geometric mean of 200 colony counts per100 ml.
Because fecal coliform may be attributed to both nonpoint and point sources, the critical conditionused for the modeling and evaluation of stream response was represented by a multi-year period.Critical conditions for waters impaired by nonpoint sources generally occur during periods of wet-weather and high surface runoff. But, critical conditions for point source dominated systemsgenerally occur during low-flow, low-dilution conditions. The 1985-1995 period represents both lowflow conditions as well as wet-weather conditions and encompasses a range of wet and dry seasons.Therefore, the 11-year period was selected as representing critical conditions associated with allpotential sources of fecal coliform bacteria within the watershed.
2.2 Discussion of Instream Water Quality
Water quality data available for the monitored segment of Tuxachanie Creek show that high levelsof fecal coliform bacteria frequently impair the stream. There is one ambient station operated byMDEQ that collected fecal coliform monitoring data during the 11-year modeling period. Station02480500 located on Tuxachanie Creek near Biloxi made measurements of flow and fecal coliformbetween June 1994 and December 1998. The data indicate that high instream fecal coliformconcentrations occurred during both periods of high-flow and dry, low-flow conditions.
2.2.1 Inventory of Available Water Quality Monitoring Data
The State’s 1998 Section 305(b) Water Quality Assessment Report was reviewed to assess waterquality conditions and data available for the watershed. According to the report, Tuxachanie Creekis partially supporting the use of Contact Recreation. These conclusions were based on instantaneousdata collected at station 02480500. Data collected at this station are listed below in Table 2.1.

____________________________________ Fecal Coliform TMDL for Tuxachanie Creek, Mississippi
___________________________________________________________________________2-2
Table 2.1 Fecal Coliform Data Reported in Tuxachanie Creek, Station #02480500
Date Fecal Coliform(counts/100 ml)
06/07/94 50008/01/94 13008/23/94 10301/31/95 4704/04/95 2012/12/96 5401/14/97 1702/10/97 2503/17/97 304/08/97 7705/13/97 63006/12/97 10007/08/97 21008/12/97 8009/02/97 53010/01/97 22011/13/97 207012/02/97 12001/13/98 100002/10/98 2403/05/98 1004/02/98 21006/11/98 13007/20/98 1708/04/98 2009/03/98 7310/07/98 64011/02/98 3912/02/98 49

____________________________________ Fecal Coliform TMDL for Tuxachanie Creek, Mississippi
___________________________________________________________________________2-3
2.2.2 Analysis of Instream Water Quality Monitoring Data
A statistical summary of the water quality data discussed above is presented in Table 2.2. Samplesare compared to the instantaneous maximum standard of 400 counts per 100 ml. The percentexceedance was calculated by dividing the number of exceedances by the total number of samples anddoes not represent the amount of time that the water quality is in violation.
Table 2.2 Statistical Summary
StationNumber
Number ofSamples
MinimumValue
(counts/100 ml)
MaximumValue
(counts/100 ml)
Number ofExceedances
PercentInstantaneousExceedance
02480500 29 3 2070 6 21%

____________________________________ Fecal Coliform TMDL for Tuxachanie Creek, Mississippi
___________________________________________________________________________3-1
3.0 SOURCE ASSESSMENT
The TMDL evaluation summarized in this report examined all known potential fecal coliform sourcesin the Tuxachanie Creek Watershed. The source assessment was used as the basis of developmentfor the model and the ultimate analysis of the TMDL allocation options. In evaluation of the sources,loads were characterized by the best available information, monitoring data, literature values, andlocal management activities. This section documents the available information and interpretation forthe analysis. The representation of the following sources in the model is discussed in Section 4.0.
Tuxachanie Creek was modeled as a single reach from its headwaters to the Tchoutacabouffa River.The watershed delineations were based primarily on an analysis of the Reach File 3 (RF3) streamnetwork in the basin as well as a topographic analysis of the watershed.
3.1 Assessment of Point Sources
Point sources of fecal coliform bacteria have their greatest potential impact on water quality duringperiods of low flow. Thus, a careful evaluation of point sources that discharge fecal coliform bacteriawas necessary in order to quantify the degree of impairment present during the low flow, criticalcondition period. There is one wastewater treatment plant in the Tuxachanie Creek Watershed thatserves a residential subdivision.
A point source assessment was completed for the Tuxachanie Creek drainage area. Table 3.1 lists thefecal coliform discharger in this watershed, along with the NPDES Permit number and the receivingwaterbody.
Once the permitted discharger was located, the effluent from the source was characterized based onall available monitoring data including permit limits, discharge monitoring reports, and informationon treatment types. The permitted discharge for the Tuxachanie Creek Watershed was characterizedby the limits of the NPDES Permit. The permit limits of the facility are given in Table 3.1.
Table 3.1 Identified NPDES Permitted Dischargers
FacilityName
WatershedNPDESPermit
Fecal Coliform(counts/100ml) Receiving Waterbody
Destination RV Park 03170009010 MS0039250 200 Tuxachanie Creek

____________________________________ Fecal Coliform TMDL for Tuxachanie Creek, Mississippi
___________________________________________________________________________3-2
3.2 Assessment of Nonpoint Sources
There are many potential nonpoint sources of fecal coliform bacteria for Tuxachanie Creek, including:
♦ Failing septic systems♦ Wildlife♦ Land application of hog and cattle manure♦ Grazing animals♦ Cattle contributions directly deposited instream♦ Urban development
The 57,843-acre drainage area of the monitored segment of Tuxachanie Creek contains manydifferent landuse types, including urban, forests, cropland, pasture, barren, and wetlands. The landuseinformation is based on data collected by the State of Mississippi’s Automated Information System(MARIS, 1997). This data set is based on Landsat Thematic Mapper digital images taken between1992 and 1993. This classification is based on a modified Anderson level one and two system withadditional level two wetland classifications. The contribution of each of these land types to the fecalcoliform loading of Tuxachanie Creek was considered on a watershed basis. Table 3.2 and Figure3.1 show the landuse distribution within the watershed in acres.
The contribution of fecal coliform due to land application of poultry litter was considered in theTuxachanie Creek Watershed nonpoint source assessment. Since there are no known chicken housesin the Tuxachanie Creek Watershed, land application of poultry litter is not considered as a sourceof fecal coliform for this watershed.
Table 3.2 Landuse Distribution in Number of Acres
Watershed Forest Croplands Pasture Urban Barren Wetland Total
03170009010 41,191 175 16,013 5 8 451 57,843
The nonpoint fecal coliform contribution from each landuse was estimated using the latest informationavailable. The MARIS landuse data for Mississippi was utilized by the BASINS model to extractlanduse sizes, populations, agriculture census data, and other information. MDEQ contacted severalagencies to refine the assumptions made in determining the fecal coliform loading. The MississippiDepartment of Wildlife, Fisheries, and Parks provided information of wildlife density in theTuxachanie Creek Watershed. The Mississippi State Department of Health was contacted regardingthe failure rate of septic tank systems in this portion of the state. Mississippi State Universityresearchers provided information on manure application practices and loading rates for hog farms andcattle operations. The Natural Resources Conservation Service also gave MDEQ information onmanure treatment practices and land application of manure.

____________________________________ Fecal Coliform TMDL for Tuxachanie Creek, Mississippi
___________________________________________________________________________3-3
Figure 3.1 Tuxachanie Creek Landuse Distribution
3.2.1 Failing Septic Systems
Septic systems have a potential to deliver fecal coliform bacteria loads to surface waters due tomalfunctions, failures, and direct pipe discharges. Properly operating septic systems treatwastewater and dispose of the water through a series of underground field lines. The water isapplied through these lines into a rock substrate, thence into underground absorption. Thesystems can fail when the field lines are broken, or when the underground substrate is clogged orflooded. A failing septic system’s discharge can reach the surface, where it becomes available forwash-off into the stream. Another potential problem is a direct bypass from the system to astream. In an effort to keep the water off the land, pipes are occasionally placed from the septictank or the field lines directly to the creek, which can be represented as a point source.

____________________________________ Fecal Coliform TMDL for Tuxachanie Creek, Mississippi
___________________________________________________________________________3-4
Another consideration is the use of individual onsite wastewater treatment plants. Thesetreatment systems are in wide use in Mississippi. They can adequately treat wastewater whenproperly maintained. However, these systems do not typically receive the maintenance needed forproper, long-term operation. These systems require some sort of disinfection to properly operate. When this expense is ignored, the water does not receive adequate disinfection prior to release.
3.2.2 Wildlife
Wildlife present in the Tuxachanie Creek Watershed contributes to fecal coliform bacteria on the landsurface. In the Tuxachanie Creek model, all wildlife was accounted for by considering contributionsfrom deer. Estimates of deer population were designed to account for the deer combined with all ofthe other wildlife contributing to the area. An upper limit of 45 deer per square mile was used as theestimate. It was assumed that the wildlife population remained constant throughout the year, and thatwildlife was present on all land classified as pastureland, cropland, and forest. It was also assumedthat the wildlife and the manure produced by the wildlife were evenly distributed throughout theseland types.
3.2.3 Land Application of Hog and Cattle Manure
In the Coastal Basin processed manure from confined hog and dairy cattle operations is collected inlagoons and routinely applied to pastureland during March through May and October throughNovember. This manure is a potential contributor of bacteria to receiving waterbodies due to runoffproduced during a rain event. Hog farms in the Coastal Basin operate by either keeping the animalsconfined by or allowing hogs to graze in a small pasture or pen. For this model, it was assumed thatall of the hog manure produced by either farming method was applied evenly to the availablepastureland. Application rates of hog manure to pastureland from confined operations varied monthlyaccording to management practices currently used in this area.
The dairy farms that are currently operating in the Tuxachanie Creek Watershed only confine theanimals for a limited time during the day. The model assumed a confinement time of four hours perday, during which time the cattle are milked and fed. During all other times, dairy cattle are allowedto graze on pasturelands. The manure collected during confinement is applied to the availablepastureland in the watershed. Like the hog farms, application rates of dairy cow manure topastureland vary monthly according to management practices currently used in this area.
3.2.4 Grazing Beef and Dairy Cattle
Grazing cattle deposit manure on pastureland where it is available for wash-off and delivery toreceiving waterbodies. Beef cattle have access to pastureland for grazing all of the time. However,dairy cattle can spend four hours per day confined in milking barns, and the remainder of their timegrazing on pastureland. Manure produced by grazing beef and dairy cows is directly deposited ontopastureland.

____________________________________ Fecal Coliform TMDL for Tuxachanie Creek, Mississippi
___________________________________________________________________________3-5
3.2.5 Cattle Contributions Directly Deposited Instream
Cattle often have direct access to flowing and intermittent streams that run through pastureland.These small streams are tributaries of larger streams. Fecal coliform bacteria deposited in thesestreams by grazing cattle are modeled as a direct input of bacteria to the stream. Due to the generaltopography in the Tuxachanie Creek Watershed, it was assumed that all land slopes in the watershedare such that cattle are able to access the intermittent streams in all pastures. In order to determinethe amount of bacteria introduced into streams from cattle, it was assumed that all grazing cattlespent five percent of their time standing in the streams. Thus, the model assumes that five percentof the manure produced by grazing beef and dairy cows are deposited directly in the stream.
3.2.6 Urban Development
Urban areas include land classified as urban and barren. Even though only a small percentage of thewatershed is classified as urban, the contribution of the urban areas to fecal coliform loading inTuxachanie Creek was considered. Fecal coliform contributions from urban areas may come fromstorm water runoff, runoff from construction sites, and runoff contribution from improper disposalof materials such as household toxic materials and litter.

____________________________________ Fecal Coliform TMDL for Tuxachanie Creek, Mississippi
___________________________________________________________________________4-1
4.0 MODELING PROCEDURE:LINKING THE SOURCES TO THE ENDPOINT
Establishing the relationship between the instream water quality target and the source loading is acritical component of TMDL development. It allows for the evaluation of management options thatwill achieve the desired source load reductions. The link can be established though a range oftechniques, from qualitative assumptions based on sound scientific principles to sophisticatedmodeling techniques. Ideally, the linkage will be supported by monitoring data that allow the TMDLdeveloper to associate certain waterbody responses to flow and loading conditions. In this section,the selection of the modeling tools, setup, and model application are discussed.
4.1 Modeling Framework Selection
The BASINS model platform and the NPSM model were used to predict the significance of fecalcoliform sources to fecal coliform levels in the Tuxachanie Creek Watershed. BASINS is amultipurpose environmental analysis system for use in performing watershed and water quality-basedstudies. A geographic information system (GIS) provides the integrating framework for BASINS andallows for the display and analysis of a wide variety of landscape information such as landuses,monitoring stations, point source discharges, and stream descriptions. The NPSM model simulatesnonpoint source runoff from selected watersheds, as well as the transport and flow of the pollutantsthrough stream reaches. A key reason for using BASINS as the modeling framework is its ability tointegrate both point and nonpoint sources in the simulation, as well as its ability to assess instreamwater quality response.
4.2 Model Setup
The Tuxachanie Creek TMDL model includes the listed section of the creek as well as all of thedrainage area that is upstream of the segment. Thus, all upstream contributors of bacteria areaccounted for in the model. A subwatershed delineation of the Tuxachanie Creek Watershed was notnecessary due to the small area of the watershed.
4.3 Source Representation
Both point and nonpoint sources were represented in this model. Due to die-off rates and overlandtransportation assumptions, the fecal coliform loading from point and nonpoint sources must beaddressed separately. There is one NPDES Permitted facility in the Tuxachanie Creek Watershedwhich discharges fecal coliform bacteria. The discharge was added as a direct input into thewaterbody. Fecal coliform loading rates for point sources are input to the model as flow in cubic feetper second and fecal coliform contribution in counts per hour.
The nonpoint sources are represented in the model with two different methods. The first of thesemethods is a direct fecal coliform loading to Tuxachanie Creek. Other sources are represented as anapplication rate to the land in the Tuxachanie Creek Watershed. For these sources, fecal coliform

____________________________________ Fecal Coliform TMDL for Tuxachanie Creek, Mississippi
___________________________________________________________________________4-2
accumulation rates in counts per acre per day were calculated for the watershed on a monthly basisand input to the model for each landuse. Fecal coliform contributions from forests and wetlands wereconsidered at the same time, and all forest and wetland contributions were combined for model input. Urban and barren areas were combined and input into the model in the same manner.
The contribution of fecal coliform due to land application of poultry litter was considered in theTuxachanie Creek Watershed nonpoint source assessment. Since there are no known chicken housesin the Tuxachanie Creek Watershed, land application of poultry litter is not considered as a sourceof fecal coliform for this watershed.
Appendix A contains the Fecal Coliform Spreadsheet developed for quantifying point and nonpointsources of bacteria for the Tuxachanie Creek model. The model inputs for fecal coliform loading dueto point and nonpoint sources are calculated using assumptions about land management, septicsystems, farming practices, and permitted point source contributions. Each of the potential bacteriasources is covered in the fecal coliform spreadsheet. The spreadsheet also contains a reference pagethat lists the literature references used to generate the fecal coliform loading rates.
4.3.1 Failing Septic Systems
The number of failing septic systems used in the model was derived from the watershed areanormalized population of Stone and Harrison Counties. The percentage of the population on septicsystems, which was determined from 1990 United States Census Data, is given in Table 4.1. Basedon the best available information, a failure rate of 80% was assumed. This information was used tocalculate the estimated number of failing septic tanks per watershed. The number of failing septictanks also incorporates an estimate for the failing onsite wastewater treatment systems in the area.
Table 4.1 Percent of Population on Septic Systems, by CountyCounty Stone Harrison
Percent on Septic Systems 67% 19%
Discharges from failing septic systems were quantified based on several factors including theestimated population served by the septic systems, an average daily discharge of 100 gallons perperson per day, and a septic system effluent fecal coliform concentration of 104 counts per 100 ml.The model inputs for flow and fecal coliform concentration from failing septic tanks are shown inAppendix A.
4.3.2 Wildlife
Based on information provided by the Mississippi Department of Wildlife, Fisheries, and Parks, thedeer population throughout the Tuxachanie Creek Watershed was estimated to be 30 to 45 animalsper square mile. For the model, the upper limit of 45 deer per square mile was used to account forthe deer and all other wildlife contributing to fecal coliform accumulation in the area. The wildlife

____________________________________ Fecal Coliform TMDL for Tuxachanie Creek, Mississippi
___________________________________________________________________________4-3
contribution in counts per acre per day is calculated by multiplying a loading rate by the number ofanimals. The loading rate used in the model was estimated to be 5.00E+08 counts per day per animal.The loading rate for the watershed is available in Appendix A.
4.3.3 Land Application of Hog and Cattle Manure
The fecal coliform spreadsheet was used to estimate the amount of waste and the concentration offecal coliform bacteria contained in hog and dairy cattle manure produced by confined animal feedingoperations. The livestock count per county is based upon the 1997 Census of Agriculture data. Thecounty livestock count is used to estimate the number of livestock on a watershed scale. This iscalculated by multiplying the county livestock figures with the area of the county within the watershedboundaries. This estimate is made with the assumption that the livestock are uniformly distributedthroughout the county. A fecal coliform production rate in counts per day per animals was multipliedby the number of confined animals to quantify the amount of bacteria produced. The manureproduced by these operations is collected in lagoons and applied evenly to all pastureland. Manureapplication rates to pastureland vary on a monthly basis. This monthly variation is incorporated intothe model by using monthly loading rates. The fecal coliform loading rates for land application of hogand liquid dairy manure are shown in Appendix A.
4.3.4 Grazing Beef and Dairy Cattle
The model assumes that the manure produced by grazing beef and dairy cattle is evenly spread onpastureland throughout the year. The fecal coliform content of manure produced by grazing cattleis estimated by multiplying the number of grazing cattle by a fecal coliform production of 5.40E+09counts per day per animal. The resulting fecal coliform loads are in the units of counts per acre perday. The fecal coliform loading rates due to grazing cattle are shown in the spreadsheet in AppendixA.
4.3.5 Cattle Contributions Deposited Directly Instream
The contribution of fecal coliform from cattle to a stream is represented as a direct input into thestream by the model. In order to estimate the point source loading produced by grazing beef anddairy cattle with access to streams, it is assumed that five percent of the number of grazing cattle ineach watershed are standing in a stream at any given time. When cattle are standing in a stream, theirfecal coliform production is estimated as flow in cubic feet per second and a concentration in countsper hour. As shown in Appendix A, the fecal coliform concentration is calculated using the numberof cows in the stream and a bacteria production rate of 5.40E+09 counts per animal per day.
4.3.6 Urban Development
The MARIS landuse data divide urban land into several categories. For the Tuxachanie CreekWatershed, the urban land is divided into three different categories: high density, low density, andtransportation. For the model, fecal coliform buildup rates for each category were determined byusing literature values from Horner, 1992. The literature value accounts for all of the potential fecalcoliform sources in each urban category. The literature values for each urban landuse category are

____________________________________ Fecal Coliform TMDL for Tuxachanie Creek, Mississippi
___________________________________________________________________________4-4
given in Tables 4.2. Table 4.3 shows the urban landuse distribution within the watershed. In themodel, fecal coliform loading rates on urban land are input as counts per acre per day. These loadingrates for the watershed are shown in Appendix A.
Table 4.2 Urban Loading Rates, by Landuse
High Density Area Low Density Area Transportation Area
1.54E+07 1.03E+07 2.00E+05
Table 4.3 Urban Landuse Distribution
Watershed High Density Area(acres)
Low DensityAcres (acres)
TransportationArea (acres) Total
03170009010 2 6 5 13
4.4 Stream Characteristics
The stream characteristics given below describe the entire modeled section of Tuxachanie Creek. Thissection begins at the headwaters and ends at the end of the monitored reach, where it joinsTchoutacabouffa River. The channel geometry and lengths for Tuxachanie Creek are based on dataavailable within the BASINS modeling system. The 7Q10 flow was determined from USGS data.The characteristics of the modeled section of Tuxachanie Creek are as follows.
♦ Length 25 miles♦ Average Depth 0.44 ft♦ Average Width 30.01 ft♦ Mean Flow 198.85 cubic ft per second♦ Mean Velocity 1.29 ft per second♦ 7Q10 Flow 3.2 cubic ft per second♦ Slope 0.00095 ft per ft
4.5 Selection of Representative Modeling Period
The model was run for 12 years, from January 1, 1984, through December 31, 1995. The first yearof data were used to stabilize the model. Results from the model were evaluated for the time periodfrom January 1, 1985, until December 31, 1995. Because this 11-year time span is used, a marginof safety is implicitly applied. Seasonality and critical conditions are accounted for during theextended time frame of the simulation.

____________________________________ Fecal Coliform TMDL for Tuxachanie Creek, Mississippi
___________________________________________________________________________4-5
The critical condition for fecal coliform impairment from nonpoint source contributors occurs aftera heavy rainfall that is preceded by several days of dry weather. The dry weather allows a build upof fecal coliform bacteria, which is then washed off the ground by a heavy rainfall. By using the 11-year time period, many such occurrences are captured in the model results. Critical conditions forpoint sources, which occur during low-flow and low-dilution conditions, are simulated as well.
4.6 Model Calibration Process
The model was calibrated for hydrology on various gages in southeast Mississippi. A set of inputvalues was established through the hydrologic calibration. The hydrological model had a continuousUSGS gage (02480500) available on Tuxachanie Creek near Biloxi for comparison with the modeledflow. A sample of these results is included in Appendix B, Graph B-1. The modeled output and themost recent actual gage data are shown on the same graph. There is a very good correlation betweenthe two data sets.
MDEQ contacted researchers and agricultural experts to quantify representative pathogen loadsentering the stream and give as much validity as possible to the assumptions made within the BASINSmodel. The weather data used for this model were collected at Saucier Experimental Forest Station.The representative hydrologic period used for the TMDL was January 1, 1985, through December31, 1995.
4.7 Existing Loading
Appendix B includes two graphs of the model results showing the instream fecal coliformconcentrations for Tuxachanie Creek. Graph B-2 shows the modeled fecal coliform levels in thestream during the 11-year modeling period. The graph shows a 30-day geometric mean of the data.The straight line at 200 counts per 100 ml indicates the water quality standard for the stream.
Graph B-3 shows the 30-day geometric mean of the fecal coliform levels after a reduction scenariohas been modeled. The scale matches the previous graph for comparison purposes. The graphindicates that there are no violations of the water quality standard for the monitored segment afterthe reduction scenario is applied.
____________________________________ Fecal Coliform TMDL for Tuxachanie Creek, Mississippi
___________________________________________________________________________5-1
5.0 ALLOCATION
The allocation for this TMDL involves a wasteload allocation for point sources and a load allocationfor nonpoint sources necessary for attainment of water quality standards in segment MS117M2. Pointsource contributions enter the stream directly in the appropriate reach. Cows in the stream and failingseptic tanks were also modeled as direct inputs to the stream. Cows in the stream are nonpointsources while failing septic tanks are both point and nonpoint sources. The other nonpoint sourcecontributions were applied to land area on a counts per day per acre basis. The fecal coliformbacteria applied to land are subject to a die-off rate and an absorption rate before it enters the stream.The TMDL was calculated based on modeling estimates which are referenced in Appendix B.
5.1 Wasteload Allocations
The contribution of point sources was considered on a watershed basis for the model. Within thewatershed, the modeled contribution of each discharger was based on the facility’s dischargemonitoring data and other records of past performance. As part of this TMDL, all wastewatertreatment facilities will be required to meet water quality standards at the end of their pipe.
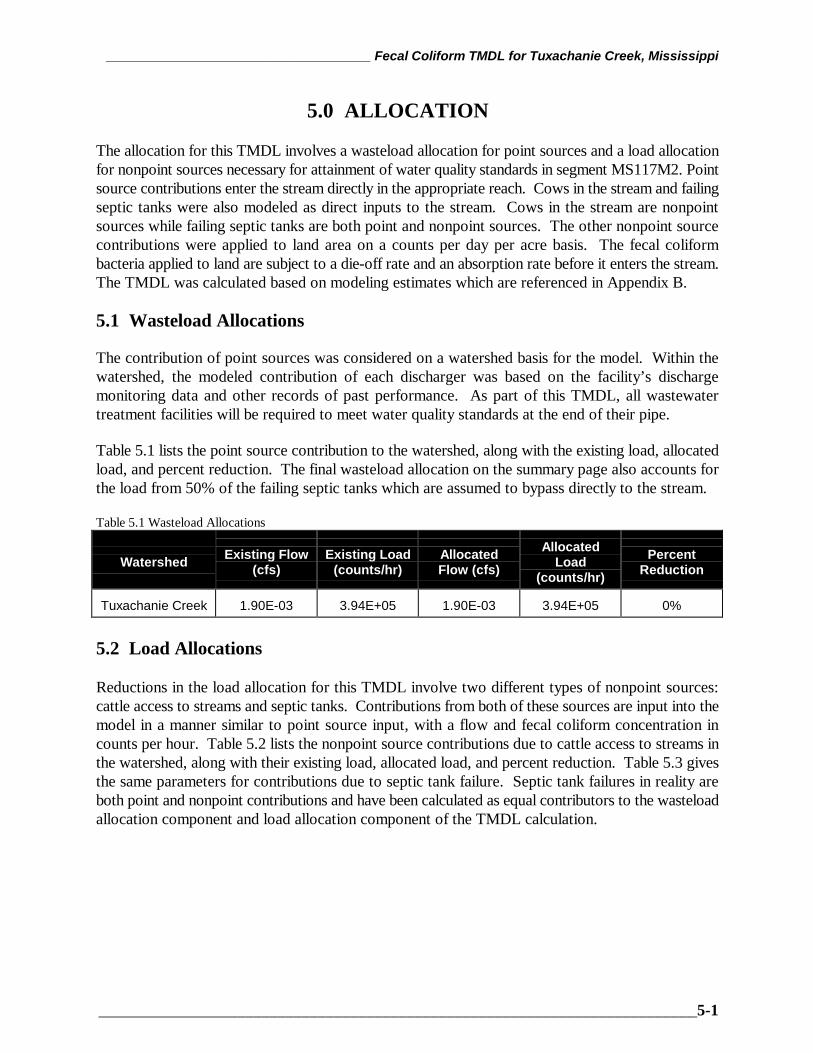
Table 5.1 lists the point source contribution to the watershed, along with the existing load, allocatedload, and percent reduction. The final wasteload allocation on the summary page also accounts forthe load from 50% of the failing septic tanks which are assumed to bypass directly to the stream.
Table 5.1 Wasteload Allocations
Watershed Existing Flow(cfs)
Existing Load(counts/hr)
AllocatedFlow (cfs)
AllocatedLoad
(counts/hr)
PercentReduction
Tuxachanie Creek 1.90E-03 3.94E+05 1.90E-03 3.94E+05 0%
5.2 Load Allocations
Reductions in the load allocation for this TMDL involve two different types of nonpoint sources:cattle access to streams and septic tanks. Contributions from both of these sources are input into themodel in a manner similar to point source input, with a flow and fecal coliform concentration incounts per hour. Table 5.2 lists the nonpoint source contributions due to cattle access to streams inthe watershed, along with their existing load, allocated load, and percent reduction. Table 5.3 givesthe same parameters for contributions due to septic tank failure. Septic tank failures in reality areboth point and nonpoint contributions and have been calculated as equal contributors to the wasteloadallocation component and load allocation component of the TMDL calculation.

____________________________________ Fecal Coliform TMDL for Tuxachanie Creek, Mississippi
___________________________________________________________________________5-2
Table 5.2 Fecal Coliform Loading Rates for Nonpoint Source Contribution of Cattle Access to Streams
Watershed Existing Flow(cfs)
Existing Load(counts/hr)
AllocatedFlow (cfs)
AllocatedLoad
(counts/hr)
PercentReduction
Tuxachanie Creek 1.98E-04 7.56E+09 3.96E-05 1.51E+09 80%
Table 5.3 Fecal Coliform Loading Rates for the Contribution from Failing Septic Tanks (50% WLA and 50% LA)
Watershed Existing Flow(cfs)
Existing Load(counts/hr)
AllocatedFlow (cfs)
AllocatedLoad
(counts/hr)
PercentReduction
Tuxachanie Creek 5.53E-01 5.63E+09 1.38E-01 1.41E+09 75%
Nonpoint fecal coliform loading due to cattle grazing; land application of manure produced byconfined dairy cattle and hogs; wildlife; and urban development are also included in the loadallocation. Currently, no reduction is assumed for these contributors in the model for TuxachanieCreek to achieve water quality standards. The loading rates are constant throughout the year forforest, cropland, and urban land. The loading rates for pastureland vary for each month. These ratesare shown in the fecal coliform spreadsheet in Appendix A. Table 5.4 shows the estimated fecalcoliform bacteria count per 30 days entering Tuxachanie Creek due to runoff during the 30-daycritical period. There is a negligible amount of impervious land within the Tuxachanie Watershed,so no impervious land runoff was calculated.
Table 5.4 Fecal Coliform Counts Per Day Entering Tuxachanie Creek Due to Runoff
Critical Period Pervious Land Runoff(counts/ 30 days)
Impervious Land Runoff(counts/ 30 days)
Total Runoff(counts/ 30 days)
Total 1.19E+10 0.00 1.19E+10
The scenario used in this analysis for the load allocation in the Tuxachanie Creek Watershed assumesan 80% reduction in contributions from cows in the stream and a 75% reduction from failing septictanks. The scenario also assumes all permitted dischargers meet water quality standards fordisinfection. This scenario might be achieved by supporting BMP projects that promote fencingaround streams in pastures, and by supporting education projects that encourage homeowners toproperly maintain their septic tanks by routinely pumping them out, repairing broken field lines, anddisinfecting the effluent from individual onsite wastewater treatment plants.
5.3 Incorporation of a Margin of Safety
The two types of MOS development are to implicitly incorporate the MOS using conservative modelassumptions or to explicitly specify a portion of the total TMDL as the MOS. The MOS selected forthis model is implicit. Running the model for 11 years with no violations of the water quality standardprovides the primary component of the MOS. Ensuring compliance with the standard throughout allof the critical condition periods represented during the 11 years is a conservative practice. Another

____________________________________ Fecal Coliform TMDL for Tuxachanie Creek, Mississippi
___________________________________________________________________________5-3
component of the MOS is the conservative assumption that in the model all of the fecal coliformbacteria discharged from failing septic tanks reaches the stream, while it is likely that only a portionof the bacteria will reach the stream due to filtration and die-off during transport.
5.4 Calculation of the TMDL
The TMDL was calculated based on the following equation:
TMDL = WLA + LA + MOS
The TMDL was calculated based on the 30-day critical period for the Tuxachanie Creek Watershedaccording to the model. Each of the loading rates has been converted to the 30-day equivalent. Thewasteload allocation incorporates the fecal coliform contribution from identified NPDES Permittedfacilities and 50% of the contribution from failing septic tanks. The load allocation includes the fecalcoliform contributions from surface runoff, cows in the stream, and 50% of the contribution fromfailing septic tanks. The margin of safety for this TMDL is derived from the conservative loadingassumptions used in setting up the model and are implicit.
WLA = NPDES Permitted Facilites + ½ of the Septic Tank Failures= 0.284E+09 counts/30 days + 0.50(1.02E+12) counts/30 days= 0.508E+12 counts/30 days
LA = Surface Runoff + Cows in the Stream + ½ of the Septic Tank Failures= 11.9E+09 counts/30 days + 1.09E+12 counts/30 days + 0.50(1.02E+12) counts/30 days= 1.61E+12 counts/30 days
MOS = implicit
TMDL= 0.508E+12 + 1.61E+12 = 2.12E+12 counts/30 days
*NOTE: 1.0E+06 = 1 million; 1.0E+09 = 1 billion; 1.0E+12 = 1 trillion
5.5 Seasonality
For many streams in the state, fecal coliform limits vary according to the seasons. This stream,however, is designated for the use of contact recreation. For this use, the pollutant standard isconstant throughout the year.
Because the model was established for an 11-year time span, it took into account all of the seasonswithin the calendar years from 1985 to 1995. The extended time period allowed the simulation ofmany different atmospheric conditions such as rainy and dry periods and high and low temperatures.It also allowed seasonal critical conditions to be simulated.

____________________________________ Fecal Coliform TMDL for Tuxachanie Creek, Mississippi
___________________________________________________________________________6-1
6.0 CONCLUSION
The fecal coliform reduction scenario used in this TMDL included requiring all NPDES Permitteddischargers of fecal coliform to meet water standards for disinfection, along with reducing theassumed fecal load from 80% of the cattle access to streams and the assumed fecal load from 75%of the failing septic tanks in the watershed.
The TMDL will not impact existing or future NPDES Permits as long as the effluent is disinfectedto meet water quality standards for fecal coliform bacteria. MDEQ will not approve any NPDESPermit application that does not plan to meet water quality standards for disinfection. Educationprojects that teach best management practices should be used as a tool for reducing nonpoint sourcecontributions. These projects may be funded by CWA Section 319 Nonpoint Source (NPS) Grants.
6.1 Future Monitoring
MDEQ has adopted the Basin Approach to Water Quality Management, a plan that dividesMississippi’s major drainage basins into five groups. During each yearlong cycle, MDEQ resourcesfor water quality monitoring will be focused on one of the basin groups. During the next monitoringphase in the Coastal Basin, Tuxachanie Creek may receive additional monitoring to identify anychange in water quality.
6.2 Public Participation
This TMDL will be published for a 30-day public notice. During this time, the public will be notifiedby publication in the statewide newspaper and a newspaper in Biloxi. The public will be given anopportunity to review the TMDL and submit comments. At the end of the 30-day period, MDEQwill determine the level of interest in the TMDL and make a decision on the necessity of holding apublic hearing.
If a public hearing is deemed appropriate, the public will be given a 30-day notice of the hearing tobe held at a location near the watershed. That public hearing would be an official hearing of theMississippi Commission on Environmental Quality, and would be transcribed.
All comments received during the public notice period and at any public hearings become a part ofthe record of this TMDL. All comments will be considered in the ultimate approval of this TMDLby the Commission on Environmental Quality and for submission of this TMDL to EPA Region IVfor final approval.

____________________________________ Fecal Coliform TMDL for Tuxachanie Creek, Mississippi
__________________________________________________________________________A-1
APPENDIX A
The following documents comprise the spreadsheet used to estimate all of the fecal coliform loadingused in the model. The spreadsheet consists of several sheets, each dealing with a different aspectof the estimation. The final four sheets bring all of the inputs into one format for model input.

___________________________________________________________________________ Fecal Coliform TMDL for Tuxachanie Creek, Mississippi
______________________________________________________________________________________________________________A-2
THIS SPREADSHEET QUANTIFIES THE FECAL COLIFORM BACTERIA CONTRIBUTION FROM MULTIPLE SOURCES.It is based on a modeling study of 9 subwatersheds, composed of four landuses (Cropland, Forest, Built-up, and Pastureland).
BLUE text found throughout the spreadsheet presents valuable information and assumptions.GREEN text designates values specific to the Coastal Basin.RED text designates values which should be specified by the user.BLACK text generally presents information which is calculated by the spreadsheet or that should not be changed.
There are 9 subwatersheds in this study. The modeled landuses were derived from the original landuses.
Modeled landuses
Areas are listed in acres.
SUBSHED CROPLAND FOREST URBAN PASTURELAND TOTAL3170009010 175 41642 13 16013 57843
TOTAL 175 41642 13 16013 57843
Original landuses
Areas are listed in acres.Modeled land use category Original Land use category 3170009010CROPLAND CROPLAND 0FOREST DECIDUOUS FOREST LAND 0LAKES LAKES 0BUILT-UP HIGH DENSITY 2BUILT-UP NOTHING 0BUILT-UP LOW DENSITY 6BUILT-UP TRANSPORTATION 5PASTURELAND PASTURELAND 0

___________________________________________________________________________ Fecal Coliform TMDL for Tuxachanie Creek, Mississippi
______________________________________________________________________________________________________________A-3
The total number of animals in the 9 subwatersheds are as follows.
Fecal contributions from these animals are used to derive loading estimates for all landuses except for Built-up.The number input for Poultry should be "Chickens Sold" from tbl_lstock2.dbf divided by 7.
Agricultural AnimalsSUBSHED BEEF COWS SWINE (HOGS) DAIRY COWS POULTRY CATTLE BEEF FOR RATIO MILK FOR RATIO Check3170009010 627 9 54 0 681 371 32 681
TOTAL 627 9 54 0 681 371 32 681
WildlifeThe deer population is the only major wildlife source considered. The same deer density is assumed for all subwatersheds.
Deer/sq mile 45Deer/acre 0.0703125

___________________________________________________________________________ Fecal Coliform TMDL for Tuxachanie Creek, Mississippi
______________________________________________________________________________________________________________A-4
This sheet contains information relevant to land application of waste produced by agricultural animals in the study area.Application of hog manure, cattle manure, and poultry litter are considered.The information is presented based on monthly variability of waste application.It is assumed that cattle manure is applied to both Cropland and Pastureland using the same method.
Hog Manure Available for Wash-off
This is the percentage of manure applied by month. January February March April May June July August September October November December
% of annual manure applied in month 0.05 0.05 0.05 0.14 0.14 0.08 0.08 0.08 0.12 0.12 0.05 0.04 1The percent of manure available for runoff is dependent on the method of manure application. The percent available is computed below based on incorporation into soil. These are assumed values.
% available for runoff = (1 - % incorporated) + (% incorporated * 0.5) 0.6
% Applied to Cropland: 0.00
% Applied to Pastureland: 1.00
The following is the resulting manure application based on the monthly percentage applied and incorporation into the soil.Subwatershed January February March April May June July August September October November December3170009010 0.03 0.03 0.03 0.084 0.084 0.048 0.048 0.048 0.072 0.072 0.03 0.024
Cattle Manure Available for Wash-off
This is the percentage of manure applied by month. January February March April May June July August September October November December
% of annual manure applied in month 0 0 0 0.2 0.2 0.0666 0.0667 0.0667 0.2 0.2 0 0 1The percent of manure available for runoff is dependent on the method of manure application. The percent available is computed below based on incorporation into soil. These are assumed values. % available for runoff = (1 - % incorporated) + (% incorporated * 0.5) 0.625
% Applied to Cropland: 0.00
% Applied to Pastureland: 1.00
The following is the resulting manure application based on the monthly percentage applied and incorporation into the soil.Subwatershed January February March April May June July August September October November December3170009010 0 0 0 0.125 0.125 0.041625 0.041688 0.041688 0.125 0.125 0 0

___________________________________________________________________________ Fecal Coliform TMDL for Tuxachanie Creek, Mississippi
______________________________________________________________________________________________________________A-5
Poultry Litter Available for Wash-off
This is the percentage of manure applied by month. January February March April May June July August September October November December
% of annual manure applied in month 0 0 0 0.143 0.143 0.143 0.143 0.143 0.143 0.142 0 0 1The percent of manure available for runoff is dependent on the method of manure application. The percent available is computed below based on incorporation into soil. These are assumed values. % available for runoff = (1 - % incorporated) + (% incorporated * 0.33) 0.36
% Applied to Cropland: 0.00
% Applied to Pastureland: 1.00
The following is the resulting manure application based on the monthly percentage applied and incorporation into the soil.Subwatershed January February March April May June July August September October November December3170009010 0 0 0 0.05148 0.05148 0.05148 0.05148 0.05148 0.05148 0.05112 0 0

___________________________________________________________________________ Fecal Coliform TMDL for Tuxachanie Creek, Mississippi
______________________________________________________________________________________________________________A-6
This sheet contains information relevant to cattle farming in the study area.
Dairy CattleDairy cattle are assumed to be either kept in feedlots or allowed to graze (depending on the milking/feeding schedule, which is four hours per day). When grazing, a certain percentage are assumed to have direct access to streams.
Dairy cattle waste is therefore either applied as manure to Cropland and Pastureland, contributed directly to Pastureland, or contributed directly to streams (referred to as Cattle in Streams).
Beef CattleBeef cattle are assumed to be either kept in feedlots or allowed to graze (depending on the season). When grazing, a certain percentage are assumed to have direct access to streams.
Beef cattle waste is therefore either applied as manure to Cropland and Pastureland, contributed directly to Pastureland, or contributed directly to streams (referred to as Cattle in Streams).
Beef Cattle Grazing Dairy Cattle Grazing Assumed Cattle Access to Streams
Month Percentage of Time not Confined Percentage of Time not Confined Percentage of Time(0.0 or 1.0) (0.0 or 1.0) (0.0 to 1.0)
January 1.00 0.84 0.05February 1.00 0.84 0.05March 1.00 0.84 0.05April 1.00 0.84 0.05May 1.00 0.84 0.05June 1.00 0.84 0.05July 1.00 0.84 0.05August 1.00 0.84 0.05September 1.00 0.84 0.05October 1.00 0.84 0.05November 1.00 0.84 0.05December 1.00 0.84 0.05

___________________________________________________________________________ Fecal Coliform TMDL for Tuxachanie Creek, Mississippi
______________________________________________________________________________________________________________A-7
These data accessed from the following references are used in the remaining worksheets.
From ASAE
Total Manure prod Typical Animal Mass Manure prod per animal Fecal Coliform Fecal Coliform Manure prod Fecal ColiformAnimal (lb/day per 1,000 lb animal) (lb) (lb/day) (#/day E10 per 1,000 lb animal) (#/day) (lb/yr) (#/day)Beef cow 40 794 32 13 1.03E+11 11587 5.71E+10Dairy cow 86 1411 121 7.2 1.02E+11 44290 1.83E+11Hog 84 134 11 8 1.08E+10 4123 1.08E+10Sheep 40 60 2 20 1.19E+10 869 1.19E+10Chicken 64 4 0 3.4 1.35E+08 93 1.35E+08Broiler 85 2 0 3.4 6.75E+07 62 6.75E+07Turkey 47 15 1 0.62 9.29E+07 257 9.29E+07Duck 110 3 0 81 2.50E+09 124 2.50E+09
From Metcalf & Eddy
Estimated Fecal Coliform Production Rates by AnimalAnimal #/day ReferenceCow 5.40E+09 Metcalf & Eddy, 1991 pg. 101Hog 8.90E+09 Metcalf & Eddy, 1991Sheep 1.80E+10 Metcalf & Eddy, 1991Chicken 2.40E+08 Metcalf & Eddy, 1991Turkey 1.30E+08 Metcalf & Eddy, 1991Duck 1.10E+10 Metcalf & Eddy, 1991Deer 5.00E+08 BPJGeese 4.90E+10 LIRPB, 1982
From: Horner, 1992Fecal Coliform Loading Rates by Landuse
median #/ha-y #/acre/dayRoad 1.80E+08 2.00E+05Commercial 5.60E+09 6.21E+06Single family low density 9.30E+09 1.03E+07Single family high density 1.50E+10 1.66E+07Multifamily residential 2.10E+10 2.33E+07

___________________________________________________________________________ Fecal Coliform TMDL for Tuxachanie Creek, Mississippi
______________________________________________________________________________________________________________A-8
The deer population is the only wildlife considered as a fecal coliform contributor to the Forest.
FOREST LANDWildlife TOTAL
FC prod FC accum FC accumAll Months AREA (AC) #deer (#/day) (#/acre/day) (#/acre/day)3170009010 41642 2927.953 1.46E+12 35156250 3.52E+07
Due to lack of animal counts, etc. for Built-up land, literature values are used. A single, weighted Built-up loading value is quantified for each subwatershed based on individual built-up landuses present and their corresponding loading rates.
URBAN LANDTOTAL
HIGH DENSITY FC accum NOTHING FC accum LOW DENSITY FC accum TRANSPORTATION FC accum FC accumAll Months AREA (AC) (#/acre/day) AREA (AC) (#/acre/day) AREA (AC) (#/acre/day) AREA (AC) (#/acre/day) (#/acre/day)3170009010 2 1.54E+07 0 0.00E+00 6 1.03E+07 5 2.00E+05 7.18E+06

___________________________________________________________________________ Fecal Coliform TMDL for Tuxachanie Creek, Mississippi
_____________________________________________________________________________________________________________A-9
This sheet contains information related to the contribution of failing septic systems to streams.The direct contribution of fecal coliform from septics to a stream can be represented as a point source in the model. Required input for point sources in NPSM are loading rate (#/hr) and flow (cfs).
The following assumptions are made for septic contributions.
Assume a failure rate for septics in the watershed: 80 %
Assume the average FC concentration reaching the stream (from septic overcharge) is: 1.00E+04 #/100 ml (Horsely & Whitten, 1996)Assume a typical septic overcharge flow rate of: 100 gal/day/person (Horsely & Whitten, 1996)
SEPTICS AS A POINT SOURCE
Total # people Total # people Septic flow Septic flow FC rate Septic flowSubwatershed served by septics on failing tanks (gal/day) (mL/hr) (#/hr) (cfs)3170009010 4461 3568.8 356880 56282950 5.63E+09 5.53E-01

___________________________________________________________________________ Fecal Coliform TMDL for Tuxachanie Creek, Mississippi
_____________________________________________________________________________________________________________A-10
POINT SOURCES FOR EACH SUBWATERSHED (Point Sources\Loads)
Cattle in Streams Septic Tanks Dischargers Fresh Water TotalFlow Fecal Flow Fecal Flow Fecal Flow Flow Fecal(cfs) (#/hr) (cfs) (#/hr) (cfs) (#/hr) (cfs) (cfs) (#/hr)
3170009010 3.96E-05 1.51E+09 1.38E-01 1.41E+09 4.60E-03 9.45E+05 1.00E+01 1.0143E+01 2.9208E+09
LANDUSE AREAS (for verification purposes only) SCENARIOS
SUBSHED CROPLAND FOREST URBAN PASTURE TOTAL Source % Reduced*3170009010 175 41642 13 16013 57843 Cattle Access 80
0 0 0 0 0 0 Septic Failure 750 0 0 0 0 0 Pastureland 00 0 0 0 0 0 * Changing the % Reduced will change only the values0 0 0 0 0 0 on this sheet0 0 0 0 0 00 0 0 0 0 0 Dischargers Effluent Concetration Level =0 0 0 0 0 0 (enter concentration used for current run, 0 0 0 0 0 0 i.e. estimated for modeling period, maximum currently
TOTAL 175 41642 13 16013 57843 permitted, maximum reccommended permitted, etc… )

___________________________________________________________________________ Fecal Coliform TMDL for Tuxachanie Creek, Mississippi
_____________________________________________________________________________________________________________A-11
PASTURELAND AND CROPLAND - ACCUM (Data Editor\PERLND\PQAL\Monthly Input\MON-ACCUM)
Monthly Input - ACCUM
3170009010Pastureland Cropland
January 2.53E+08 3.52E+07February 2.53E+08 3.52E+07March 2.53E+08 3.52E+07April 2.61E+08 3.52E+07May 2.61E+08 3.52E+07June 2.56E+08 3.52E+07July 2.55E+08 3.52E+07August 2.55E+08 3.52E+07September 2.60E+08 3.52E+07October 2.60E+08 3.52E+07November 2.53E+08 3.52E+07December 2.52E+08 3.52E+07
PASTURELAND AND CROPLAND - SQOLIM (Data Editor\PERLND\PQAL\Monthly Input\MON-SQOLIM)
Monthly Input - SQOLIM
Pastureland CroplandJanuary 1.01E+09 1.41E+08February 1.01E+09 1.41E+08March 1.01E+09 1.41E+08April 1.04E+09 1.41E+08May 1.04E+09 1.41E+08June 1.02E+09 1.41E+08July 1.02E+09 1.41E+08August 1.02E+09 1.41E+08September 1.04E+09 1.41E+08October 1.04E+09 1.41E+08November 1.01E+09 1.41E+08December 1.01E+09 1.41E+08
URBAN AND FOREST - ACQOP & SQOLIM (Data Editor\PERLND\PQAL\QUAL-INPUT\ACQOP & SQOLIM)
ACQOP for all months SQOLIM for all monthsUrb & Bar For & Wet Urb & Bar For & Wet
3170009010 7.18E+06 3.52E+07 3170009010 2.87E+07 1.41E+08
3170009010

____________________________________ Fecal Coliform TMDL for Tuxachanie Creek, Mississippi
__________________________________________________________________________B-1
APPENDIX B
This appendix contains printouts of the various model run results. Graph B-1 shows the modeledflow, in cubic feet per second, through Tuxachanie Creek compared to the most recent actual USGSgage readings from Tuxachanie Creek near Biloxi. USGS Gage 02480500 was discontinued in 1971.The remaining graphs represent an 11-year time period, from January 1, 1985, to December 31, 1995.The second set of graphs show the 30-day geometric mean for fecal coliform concentrations in countsper 100 ml in the impaired section of Tuxachanie Creek. The graphs contain a reference line at 200counts per 100 ml. Graph B-2 represents the existing conditions in Tuxachanie Creek. There are 22violations of the fecal coliform standard on this graph. Graph B-3 represents the conditions inTuxachanie Creek after the reduction scenario has been applied. Graph B-3 shows no violations ofthe standard. Graphs B-2 and B-3 are shown with the same scale for comparison purposes.
The TMDL calculated in this report represents the maximum fecal coliform load that can beassimilated by the waterbody segment during the critical 30-day period that will maintain waterquality standards. The calculation of this TMDL is based on the critical hydrologic flow conditionthat occurred during the modeled time span. The graph showing the 30-day geometric mean ofinstream fecal coliform concentrations representing the allocated loading scenario (Graph B-3) wasused to identify the critical condition. The TMDL calculation includes the sum of the loads from allidentified point and nonpoint sources applied or discharged within the modeled watershed.
An individual TMDL calculation was prepared for each waterbody segment included in this report.The numerical values for the wasteload allocation (point sources) and load allocation (nonpointsources) for each waterbody segment and drainage area can be found on the waterbody segmentidentification pages at the beginning of this report.

________________________________________________________________________ Fecal Coliform TMDL for Tuxachanie Creek Mississippi
______________________________________________________________________________________________________________B-2

________________________________________________________________________ Fecal Coliform TMDL for Tuxachanie Creek Mississippi
__________________________________________________________________________________________________________B-3
Graph B-2 Modeled Fecal Coliform Concentrations Under Existing Conditions
0
100
200
300
400
500
600
700
800
900
1/1/1985 1/1/1986 1/1/1987 1/1/1988 1/1/1989 1/1/1990 1/1/1991 1/1/1992 1/1/1993 1/1/1994 1/1/1995
Fecal Coliform 30-Day Geometric Mean Water Quality Standard (200 counts/100 ml)

________________________________________________________________________ Fecal Coliform TMDL for Tuxachanie Creek Mississippi
__________________________________________________________________________________________________________B-4
Graph B-3 Modeled Fecal Coliform Concentrations After Application of Reduction Scenario
0
100
200
300
400
500
600
700
800
900
1/1/1985 1/1/1986 1/1/1987 1/1/1988 1/1/1989 1/1/1990 1/1/1991 1/1/1992 1/1/1993 1/1/1994 1/1/1995
Fecal Coliform 30-Day Geometric Mean Water Quality Standard (200 counts/100 ml)

____________________________________ Fecal Coliform TMDL for Tuxachanie Creek, Mississippi
_____________________________________________________________________D-1
DEFINITIONS
Ambient stations: a network of fixed monitoring stations established for systematic water qualitysampling at regular intervals, and for uniform parametric coverage over a long-term period.
Assimilative capacity: the capacity of a body of water or soil-plant system to receive wastewatereffluents or sludge without violating the provisions of the State of Mississippi Water Quality Criteriafor Intrastate, Interstate, and Coastal Waters and Water Quality regulations.
Background: the condition of waters in the absence of man-induced alterations based on the bestscientific information available to MDEQ. The establishment of natural background for an alteredwaterbody may be based upon a similar, unaltered or least impaired, waterbody or on historical pre-alteration data.
Calibrated model: a model in which reaction rates and inputs are significantly based on actualmeasurements using data from surveys on the receiving waterbody.
Critical Condition: hydrologic and atmospheric conditions in which the pollutants causingimpairment of a waterbody have their greatest potential for adverse effects.
Daily discharge: the "discharge of a pollutant" measured during a calendar day or any 24-hourperiod that reasonably represents the calendar day for purposes of sampling. For pollutants withlimitations expressed in units of mass, the "daily discharge" is calculated as the total mass of thepollutant discharged over the day. For pollutants with limitations expressed in other units ofmeasurement, the "daily average" is calculated as the average.
Designated Use: use specified in water quality standards for each waterbody or segment regardlessof actual attainment.
Discharge monitoring report: report of effluent characteristics submitted by a NPDES Permittedfacility.
Effluent standards and limitations: all State or Federal effluent standards and limitations onquantities, rates, and concentrations of chemical, physical, biological, and other constituents to whicha waste or wastewater discharge may be subject under the Federal Act or the State law. This includes,but is not limited to, effluent limitations, standards of performance, toxic effluent standards andprohibitions, pretreatment standards, and schedules of compliance.
Effluent: treated wastewater flowing out of the treatment facilities.
Fecal coliform bacteria: a group of bacteria that normally live within the intestines of mammals,including humans. Fecal coliform bacteria are used as an indicator of the presence of pathogenicorganisms in natural water.

____________________________________ Fecal Coliform TMDL for Tuxachanie Creek, Mississippi
_____________________________________________________________________D-2
Geometric mean: the nth root of the product of n numbers. A 30-day geometric mean is the 30throot of the product of 30 numbers.
Impaired Waterbody: any waterbody that does not attain water quality standards due to anindividual pollutant, multiple pollutants, pollution, or an unknown cause of impairment.
Land Surface Runoff: water that flows into the receiving stream after application by rainfall orirrigation. It is a transport method for nonpoint source pollution from the land surface to thereceiving stream.
Load allocation (LA): the portion of a receiving water's loading capacity attributed to or assignedto nonpoint sources (NPS) or background sources of a pollutant. The load allocation is the valueassigned to the summation of all cattle and land applied fecal coliform that enter a receivingwaterbody. It also contains a portion of the contribution from septic tanks.
Loading: the total amount of pollutants entering a stream from one or multiple sources.
Nonpoint Source: pollution that is in runoff from the land. Rainfall, snowmelt, and other water thatdoes not evaporate become surface runoff and either drains into surface waters or soaks into the soiland finds its way into groundwater. This surface water may contain pollutants that come from landuse activities such as agriculture; construction; silviculture; surface mining; disposal of wastewater;hydrologic modifications; and urban development.
NPDES permit: an individual or general permit issued by the Mississippi Environmental QualityPermit Board pursuant to regulations adopted by the Mississippi Commission on EnvironmentalQuality under Mississippi Code Annotated (as amended) §§ 49-17-17 and 49-17-29 for dischargesinto State waters.
Point Source: pollution loads discharged at a specific location from pipes, outfalls, and conveyancechannels from either wastewater treatment plants or industrial waste treatment facilities. Pointsources can also include pollutant loads contributed by tributaries to the main receiving stream.
Pollution: contamination, or other alteration of the physical, chemical, or biological properties, ofany waters of the State, including change in temperature, taste, color, turbidity, or odor of the waters,or such discharge of any liquid, gaseous, solid, radioactive, or other substance, or leak into any watersof the State, unless in compliance with a valid permit issued by the Permit Board.
Publicly Owned Treatment Works (POTW): a waste treatment facility owned and/or operated bya public body or a privately owned treatment works which accepts discharges which would otherwisebe subject to Federal Pretreatment Requirements.
Regression Coefficient: an expression of the functional relationship between two correlated variablesthat is often empirically determined from data, and is used to predict values of one variable whengiven values of the other variable.
____________________________________ Fecal Coliform TMDL for Tuxachanie Creek, Mississippi
_____________________________________________________________________D-3
Scientific Notation (Exponential Notation): mathematical method in which very large numbersor very small numbers are expressed in a more concise form. The notation is based on powers often. Numbers in scientific notation are expressed as the following: 4.16 x 10^(+b) and 4.16 x10^(-b) [same as 4.16E4 or4.16E-4]. In this case, b is always a positive, real number. The10^(+b) tells us that the decimal point is b places to the right of where it is shown. The 10^(-b)tells us that the decimal point is b places to the left of where it is shown.For example: 2.7X104 = 2.7E+4 =27000 and 2.7X10-4 = 2.7E-4=0.00027.
Sigma (ÿ): shorthand way to express taking the sum of a series of numbers. For example, thesum or total of three amounts 24, 123, 16, (dl, d2, d3) respectively could be shown as:
3ÿ di = d1+d2+d3 =24 +123+16 =163i=1
Total Maximum Daily Load or TMDL: the calculated maximum permissible pollutant loading toa waterbody at which water quality standards can be maintained.
Waste: sewage, industrial wastes, oil field wastes, and all other liquid, gaseous, solid, radioactive,or other substances which may pollute or tend to pollute any waters of the State.
Wasteload allocation (WLA): the portion of a receiving water's loading capacity attributed to orassigned to point sources of a pollutant. It also contains a portion of the contribution from septictanks.
Water Quality Standards: the criteria and requirements set forth in State of Mississippi WaterQuality Criteria for Intrastate, Interstate, and Coastal Waters. Water quality standards are standardscomposed of designated present and future most beneficial uses (classification of waters), thenumerical and narrative criteria applied to the specific water uses or classification, and the Mississippiantidegradation policy.
Water quality criteria: elements of State water quality standards, expressed as constituentconcentrations, levels, or narrative statements, representing a quality of water that supports thepresent and future most beneficial uses.
Waters of the State: all waters within the jurisdiction of this State, including all streams, lakes, ponds, wetlands, impounding reservoirs, marshes, watercourses, waterways, wells, springs, irrigationsystems, drainage systems, and all other bodies or accumulations of water, surface and underground,natural or artificial, situated wholly or partly within or bordering upon the State, and such coastalwaters as are within the jurisdiction of the State, except lakes, ponds, or other surface waters whichare wholly landlocked and privately owned, and which are not regulated under the Federal CleanWater Act (33 U.S.C.1251 et seq.).
Watershed: the area of land draining into a stream at a given location.

____________________________________ Fecal Coliform TMDL for Tuxachanie Creek, Mississippi
____________________________________________________________________AB-1
ABBREVIATIONS
7Q10..........................Seven-Day Average Low Stream Flow with a Ten-Year Occurrence Period
BASINS.................................Better Assessment Science Integrating Point and Nonpoint Sources
BMP ....................................................................................................Best Management Practice
CWA ................................................................................................................. Clean Water Act
DMR................................................................................................Discharge Monitoring Report
EPA..........................................................................................Environmental Protection Agency
GIS ..............................................................................................Geographic Information System
HUC ...........................................................................................................Hydrologic Unit Code
LA ....................................................................................................................... Load Allocation
MARIS ..........................................................State of Mississippi Automated Information System
MDEQ.............................................................. Mississippi Department of Environmental Quality
MOS...................................................................................................................Margin of Safety
NRCS .............................................................................National Resource Conservation Service
NPDES.............................................................. National Pollution Discharge Elimination System
NPSM......................................................................................................Nonpoint Source Model
RF3............................................................................................................................Reach File 3
USGS .........................................................................................United States Geological Survey
WLA..........................................................................................................Waste Load Allocation

____________________________________ Fecal Coliform TMDL for Tuxachanie Creek, Mississippi
____________________________________________________________________AB-1
REFERENCES
Horner, 1992. Water Quality Criteria/Pollutant Loading Estimation/Treatment EffectivenessEstimation. In R.W. Beck and Associates. Covington Master Drainage Plan. King County SurfaceWater Management Division, Seattle, WA.
Horsley & Whitten, Inc. 1996. Identification and Evaluation of Nutrient Bacterial Loadings toMaquoit Bay, Brunswick, and Freeport, Maine. Casco Bay Estuary Project.
Metccalf and Eddy. 1991. Wastewater Engineering: Treatment, Disposal, Reuse. 3rd Edition. McGraw-Hill, Inc., New York.
MDEQ. 1994. Wastewater Regulations for National Pollutant Discharge Elimination System(NPDES) Permits, Underground Injection Control (UIC) Permits, State Permits, Water QualityBased Effluent Limitations and Water Quality Certification. Office of Pollution Control.
MDEQ. 1995. State of Mississippi Water Quality Criteria for Intrastate, Interstate, and CoastalWaters. Office of Pollution Control.
MDEQ. 1998. Mississippi List of Waterbodies, Pursuant to Section 303(d) of the Clean Water Act.Office of Pollution Control.
MDEQ. 1998. Mississippi 1998 Water Quality Assessment, Pursuant to Section 305(b) of the CleanWater Act. Office of Pollution Control.
USEPA. 1998. Better Assessment Science Integrating Point and Nonpoint Sources, BASINS,Version 2.0 User’s Manual. U.S. Environmental Protection Agency, Office of Water, Washington,D.C.