Comparing Trade Performance of China and India Trade Performance of China and India Sarah Y TONG*...
14
60 east asian policy east asian policy east asian policy east asian policy east asian policy Comparing Trade Performance of China and India Sarah Y TONG* China and India have achieved remarkable growth in recent decades, sustained by rapid trade expansion. There are however evident disparities between the two and both have considerable room to grow. For China, commodities trade has not only expanded rapidly but undertaken considerable restructuring and upgrading. In addition to liberal trade policies, such transformation has been promoted by active participation of foreign invested enterprises, especially those from neighbouring economies in East and Southeast Asia. Consequently, China has become a key link in an intensifying regional production network. For India, in contrast, trade expansion has not brought substantial structural changes and commodities export remains weak, while trade in services continues to play a dominant role. In part, this is due to the lack of export-oriented foreign investment and, as a result, India is much less integrated with economies in Asia. * Sarah Y. TONG is Assistant Professor of the Economics Department and Research Fellow at the East Asian Institute, National University of Singapore.
-
Upload
hoangtuyen -
Category
Documents
-
view
218 -
download
4
Transcript of Comparing Trade Performance of China and India Trade Performance of China and India Sarah Y TONG*...

60 east asian policyeast asian policyeast asian policyeast asian policyeast asian policy
Comparing TradePerformance of China
and India
Sarah Y TONG*
China and India have achieved remarkable growth in recentdecades, sustained by rapid trade expansion. There are however evidentdisparities between the two and both have considerable room to grow.
For China, commodities trade has not only expanded rapidly butundertaken considerable restructuring and upgrading. In addition to
liberal trade policies, such transformation has been promoted by activeparticipation of foreign invested enterprises, especially those fromneighbouring economies in East and Southeast Asia. Consequently,China has become a key link in an intensifying regional production
network. For India, in contrast, trade expansion has not broughtsubstantial structural changes and commodities export remains weak,
while trade in services continues to play a dominant role. In part, this isdue to the lack of export-oriented foreign investment and, as a result,
India is much less integrated with economies in Asia.
* Sarah Y. TONG is Assistant Professor of the Economics Department and Research Fellow at
the East Asian Institute, National University of Singapore.

east asian policyeast asian policyeast asian policyeast asian policyeast asian policy 61
THE TWO ASIAN GIANTS, China and India, are the world’s most populouscountries and jointly made up nearly two-fifth of the world population (37%) in 20061.Both have registered extraordinary growth performance in recent decades, China sincelate 1970s and India in the last decade, and consequently attracting growing globalattention. Indeed, continued growth in the two nations is much anticipated to sustainworld economic development as the economic prospect in the industrial world darkens.
The year 2008 marks the 30th Anniversary of China’s economic reform and openingup. Over the past three decades, China’s rapid growth contributed considerably to theworld economy. Between 1978 and 2007, China has sustained almost unprecedentedeconomic increase of nearly 10% a year, albeit from a very low base. Valued at PurchasingPower Parity (PPP) terms, China has been the world’s second largest economy since2000. Even when measured at market exchange rate, China’s GDP amounted to US$3.3trillion in 2007 and was the world’s fourth largest behind the US, Japan, and Germany.Between 2000 and 2006, China contributed around 15% of the total increase in worldGDP.
India also entered its third decade of economic transformation and the economy hasmoved progressively towards a more market-based system, since it started successivereforms in the mid-1980s. Economic performance has improved considerably, especiallysince more dramatic liberalisation measures were being implemented in the 1990s. In2007, India’s GDP, valued at US$1098 billion, amounted to about one third of China’sGDP (Appendix Table A). When PPP is used, India is the world’s fifth largest economy.
Perhaps more important than economic growth, China and India affect the worldeconomy through their rapid trade expansion. Between 1978 and 2006, China’s sharein world export of goods and services jumped by more than five times, from 1.4% to7.6%. During the same period, India’s share in world export of goods and servicesgrew from 0.4% to 1.2%, an equally impressive three-fold increase.
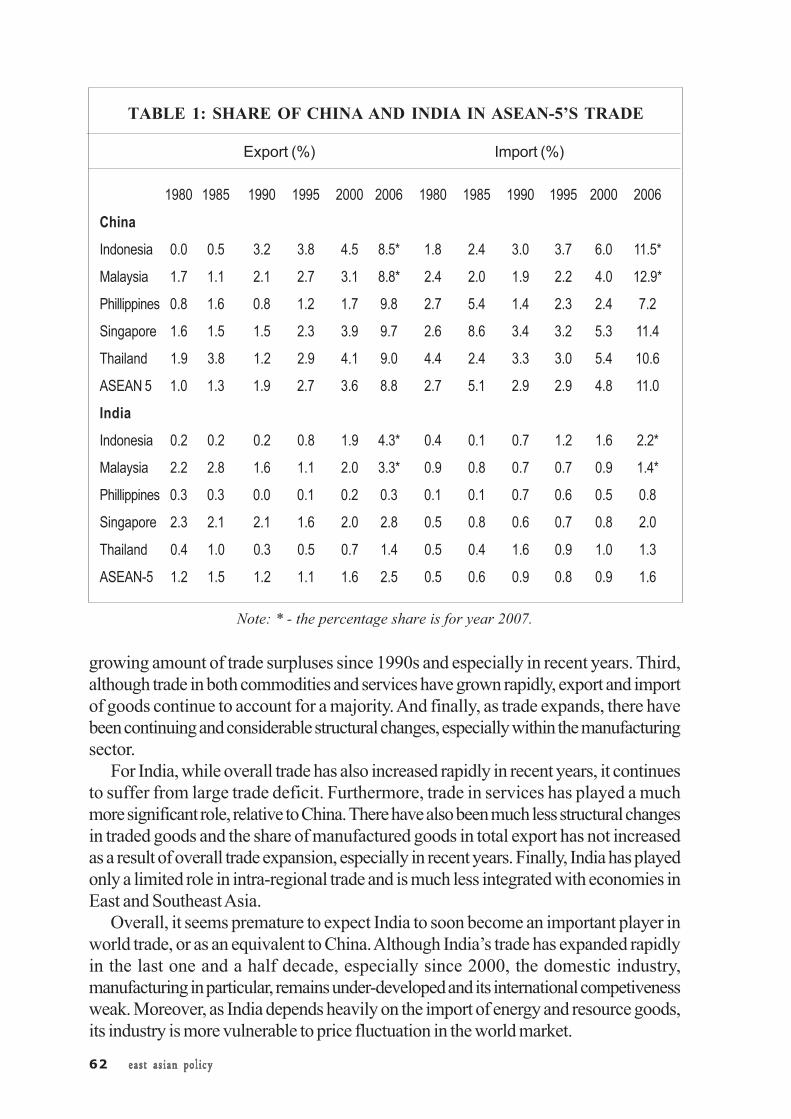
Nonetheless, India is still a minor player in world trade, compared to China. This isalso true for their trade with countries in Southeast Asia. For example, in 2006, exportto India by the five original members of ASEAN (ASEAN-5), including Indonesia,Malaysia, the Philippines, Singapore, and Thailand, accounted for only 2.5% (Table 1)of the group’s total export. The share of export to China in the same year was 8.8%, upfrom only 1% in 1980. The contrast is even more prominent when evaluating imports toASEAN from the two countries. In 2006, China supplied 11% of ASEAN-5’s totalimport, while India supplied only 1.6%.
Accordingly, one would expect India to continue its quest for trade expansion andrapid economic growth and soon contribute more to regional and world trade as wellas growth. This is especially important as China’s future expansion is constrained byrising domestic costs and an appreciating currency. To better comprehend India’sprospect in growth and trade, especially in comparison with China, the two countries’trade performance during the past decades was examined.
In fact, while both achieved remarkable progress, there are substantial differencesin the two countries’ trade development. China’s trade expansion may be characterisedby four main aspects. First, overall trade has grown rapidly and considerably, in thevolume and as a ratio to the economy. Second, as trade expands, China has sustained
62 east asian policyeast asian policyeast asian policyeast asian policyeast asian policy
1980 1985 1990 1995 2000 2006 1980 1985 1990 1995 2000 2006
China
Indonesia 0.0 0.5 3.2 3.8 4.5 8.5* 1.8 2.4 3.0 3.7 6.0 11.5*
Malaysia 1.7 1.1 2.1 2.7 3.1 8.8* 2.4 2.0 1.9 2.2 4.0 12.9*
Phillippines 0.8 1.6 0.8 1.2 1.7 9.8 2.7 5.4 1.4 2.3 2.4 7.2
Singapore 1.6 1.5 1.5 2.3 3.9 9.7 2.6 8.6 3.4 3.2 5.3 11.4
Thailand 1.9 3.8 1.2 2.9 4.1 9.0 4.4 2.4 3.3 3.0 5.4 10.6
ASEAN 5 1.0 1.3 1.9 2.7 3.6 8.8 2.7 5.1 2.9 2.9 4.8 11.0
India
Indonesia 0.2 0.2 0.2 0.8 1.9 4.3* 0.4 0.1 0.7 1.2 1.6 2.2*
Malaysia 2.2 2.8 1.6 1.1 2.0 3.3* 0.9 0.8 0.7 0.7 0.9 1.4*
Phillippines 0.3 0.3 0.0 0.1 0.2 0.3 0.1 0.1 0.7 0.6 0.5 0.8
Singapore 2.3 2.1 2.1 1.6 2.0 2.8 0.5 0.8 0.6 0.7 0.8 2.0
Thailand 0.4 1.0 0.3 0.5 0.7 1.4 0.5 0.4 1.6 0.9 1.0 1.3
ASEAN-5 1.2 1.5 1.2 1.1 1.6 2.5 0.5 0.6 0.9 0.8 0.9 1.6
TABLE 1: SHARE OF CHINA AND INDIA IN ASEAN-5’S TRADE
Export (%) Import (%)
Note: * - the percentage share is for year 2007.
growing amount of trade surpluses since 1990s and especially in recent years. Third,although trade in both commodities and services have grown rapidly, export and importof goods continue to account for a majority. And finally, as trade expands, there havebeen continuing and considerable structural changes, especially within the manufacturingsector.
For India, while overall trade has also increased rapidly in recent years, it continuesto suffer from large trade deficit. Furthermore, trade in services has played a muchmore significant role, relative to China. There have also been much less structural changesin traded goods and the share of manufactured goods in total export has not increasedas a result of overall trade expansion, especially in recent years. Finally, India has playedonly a limited role in intra-regional trade and is much less integrated with economies inEast and Southeast Asia.
Overall, it seems premature to expect India to soon become an important player inworld trade, or as an equivalent to China. Although India’s trade has expanded rapidlyin the last one and a half decade, especially since 2000, the domestic industry,manufacturing in particular, remains under-developed and its international competivenessweak. Moreover, as India depends heavily on the import of energy and resource goods,its industry is more vulnerable to price fluctuation in the world market.
east asian policyeast asian policyeast asian policyeast asian policyeast asian policy 63
Strong Growth Sustained by Surging TradeMuch has been discussed about the notable growth experience of China in the past
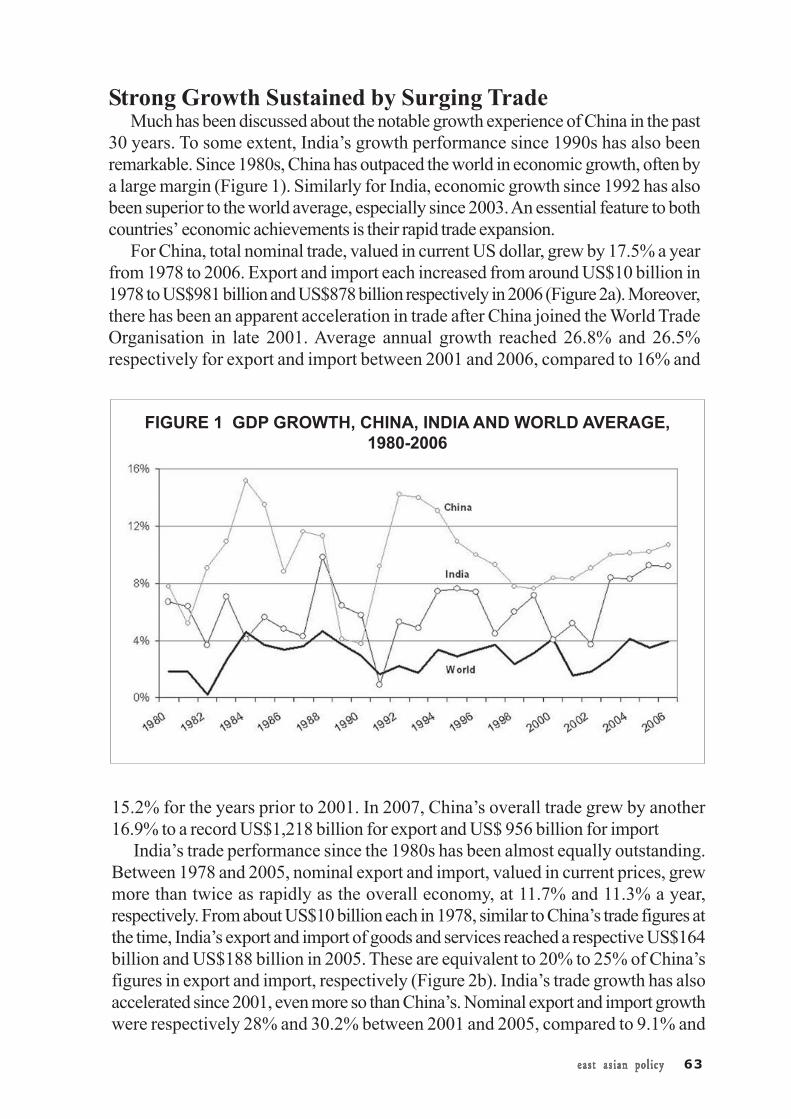
30 years. To some extent, India’s growth performance since 1990s has also beenremarkable. Since 1980s, China has outpaced the world in economic growth, often bya large margin (Figure 1). Similarly for India, economic growth since 1992 has alsobeen superior to the world average, especially since 2003. An essential feature to bothcountries’ economic achievements is their rapid trade expansion.
For China, total nominal trade, valued in current US dollar, grew by 17.5% a yearfrom 1978 to 2006. Export and import each increased from around US$10 billion in1978 to US$981 billion and US$878 billion respectively in 2006 (Figure 2a). Moreover,there has been an apparent acceleration in trade after China joined the World TradeOrganisation in late 2001. Average annual growth reached 26.8% and 26.5%respectively for export and import between 2001 and 2006, compared to 16% and
15.2% for the years prior to 2001. In 2007, China’s overall trade grew by another16.9% to a record US$1,218 billion for export and US$ 956 billion for import
India’s trade performance since the 1980s has been almost equally outstanding.Between 1978 and 2005, nominal export and import, valued in current prices, grewmore than twice as rapidly as the overall economy, at 11.7% and 11.3% a year,respectively. From about US$10 billion each in 1978, similar to China’s trade figures atthe time, India’s export and import of goods and services reached a respective US$164billion and US$188 billion in 2005. These are equivalent to 20% to 25% of China’sfigures in export and import, respectively (Figure 2b). India’s trade growth has alsoaccelerated since 2001, even more so than China’s. Nominal export and import growthwere respectively 28% and 30.2% between 2001 and 2005, compared to 9.1% and
FIGURE 1 GDP GROWTH, CHINA, INDIA AND WORLD AVERAGE,1980-2006

64 east asian policyeast asian policyeast asian policyeast asian policyeast asian policy
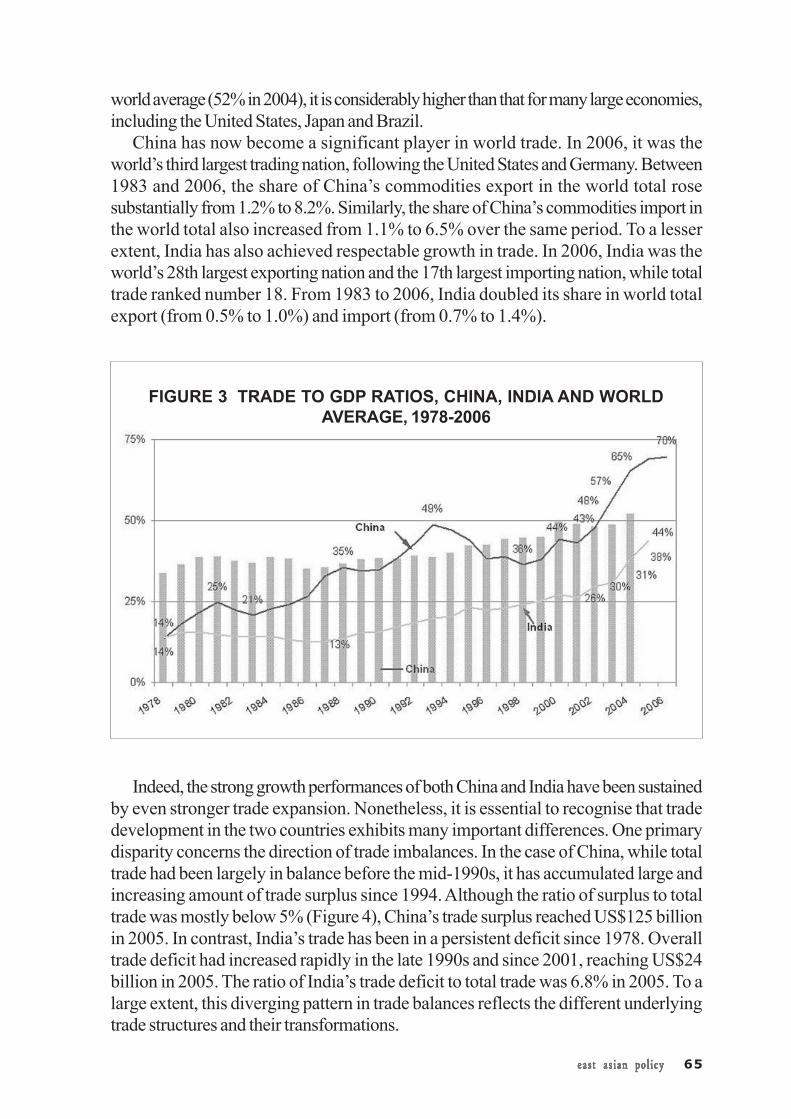
8.3% for the period between 1978 and 2001.With decades of trade liberalisation and trade expansion, China and India have
become considerably more open, as measured by trade to GDP ratio. In 1978, tradeto GDP ratio for both countries was estimated to be about 14%, while the world averagewas about 34%. China’s trade to GDP ratio has since increased considerably to 43%in 2001 and further to 70% in 2006, significantly higher than the world average. Incomparison, India’s trade to GDP ratio remained relatively stable through most of the1980s but had started to increase considerably since the late 1980s. Between 1987and 2001, India’s trade to GDP ratio doubled from 13% to 26%. Since then, it hadincreased more rapidly to reach 44% in 2005 (Figure 3). While this is lower than the
FIGURE 2A CHINA’S EXPORT AND IMPORT OF GOODS ANDSERVICES, 1978-2006
FIGURE 2B INDIA’S EXPORT AND IMPORT OF GOODS ANDSERVICES, 1978-2005
east asian policyeast asian policyeast asian policyeast asian policyeast asian policy 65
world average (52% in 2004), it is considerably higher than that for many large economies,including the United States, Japan and Brazil.
China has now become a significant player in world trade. In 2006, it was theworld’s third largest trading nation, following the United States and Germany. Between1983 and 2006, the share of China’s commodities export in the world total rosesubstantially from 1.2% to 8.2%. Similarly, the share of China’s commodities import inthe world total also increased from 1.1% to 6.5% over the same period. To a lesserextent, India has also achieved respectable growth in trade. In 2006, India was theworld’s 28th largest exporting nation and the 17th largest importing nation, while totaltrade ranked number 18. From 1983 to 2006, India doubled its share in world totalexport (from 0.5% to 1.0%) and import (from 0.7% to 1.4%).
Indeed, the strong growth performances of both China and India have been sustainedby even stronger trade expansion. Nonetheless, it is essential to recognise that tradedevelopment in the two countries exhibits many important differences. One primarydisparity concerns the direction of trade imbalances. In the case of China, while totaltrade had been largely in balance before the mid-1990s, it has accumulated large andincreasing amount of trade surplus since 1994. Although the ratio of surplus to totaltrade was mostly below 5% (Figure 4), China’s trade surplus reached US$125 billionin 2005. In contrast, India’s trade has been in a persistent deficit since 1978. Overalltrade deficit had increased rapidly in the late 1990s and since 2001, reaching US$24billion in 2005. The ratio of India’s trade deficit to total trade was 6.8% in 2005. To alarge extent, this diverging pattern in trade balances reflects the different underlyingtrade structures and their transformations.
FIGURE 3 TRADE TO GDP RATIOS, CHINA, INDIA AND WORLDAVERAGE, 1978-2006

66 east asian policyeast asian policyeast asian policyeast asian policyeast asian policy
Diverging Patterns of Trade StructureChina and India differ significantly in trade structure and, more importantly, in its
transformation over time. First of all, China’s trade and trade expansion have beendominated by the export and import of commodities. For India, service trade has played
a much more important role in overall trade development. The divergence has becomeeven more evident in recent years. The share of commodities in China’s total exportwent up from 86% in 1994 to 91% in 2005, while that for India declined from 82% in1996 to 72% in recent years (Figure 5).
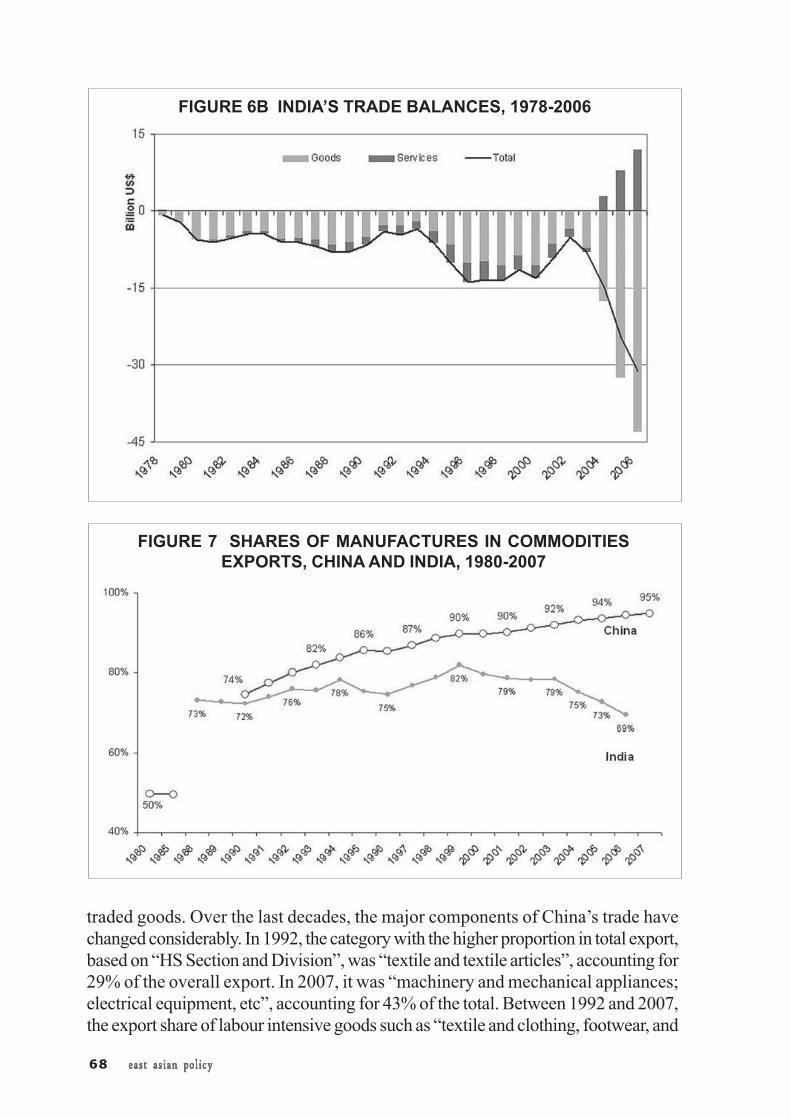
Moreover, commodities trade also contributed differently to the two countries’ tradeimbalances. In China, large and increasing surplus in commodities trade more thanoffsets its deficit in service trade, resulting in huge overall trade surplus (Figure 6a). InIndia, on the other hand, there is a persistent deficit in trade of commodities which hasincreased considerably in recent years. While there has been an increasing surplus inservice trade, it is far from sufficient to make up for the large deficit in commoditiestrade (Figure 6b).
The composition of goods traded by the two countries also differs considerably. InChina, the transformation is characterised by the continuous increase in the export ofmanufactured goods. Between 1980 and 1985, for example, manufactures accountedfor about half of China’s total export. The figure had since increased rapidly to 74% in1990 and further to 95% in 2007 (Figure 7).
The transformation for India has been neither consistent nor significant. Between1988 and 1999, the share of manufactured goods in India’s commodities exportfluctuated between 73% and 82%. Since then, it has been declining, and rather sharplysince 2003, to 69% in 2006. To some extent, this reflects the lack of structural
FIGURE 4 RATIO OF NET EXPORT TO TOTAL TRADE, CHINAAND INDIA, 1990-2006

east asian policyeast asian policyeast asian policyeast asian policyeast asian policy 67
transformation in the domestic economy. Appendix Table B shows that the contributionof industry to India’s GDP remains at less than 30%, considerably less than that ofChina where industry contributes to about half of the country’s GDP.
Indeed, structural changes in India’s trade have been much less intensive, comparedto China’s. This can be shown more clearly by examining the composition of the country’s
FIGURE 5 SHARES OF COMMODITIES IN TOTAL EXPORT,CHINA AND INDIA, 1978-2005
FIGURE 6A CHINA’S TRADE BALANCES, 1982-2006
68 east asian policyeast asian policyeast asian policyeast asian policyeast asian policy
traded goods. Over the last decades, the major components of China’s trade havechanged considerably. In 1992, the category with the higher proportion in total export,based on “HS Section and Division”, was “textile and textile articles”, accounting for29% of the overall export. In 2007, it was “machinery and mechanical appliances;electrical equipment, etc”, accounting for 43% of the total. Between 1992 and 2007,the export share of labour intensive goods such as “textile and clothing, footwear, and
FIGURE 6B INDIA’S TRADE BALANCES, 1978-2006
FIGURE 7 SHARES OF MANUFACTURES IN COMMODITIESEXPORTS, CHINA AND INDIA, 1980-2007

east asian policyeast asian policyeast asian policyeast asian policyeast asian policy 69
other miscellaneous manufactured articles” dropped from over 40% of total export to22% (Figure 8a).
On the other hand, export share of the relatively more capital and technology intensivegoods such as “machinery and instruments” increased considerably from 19% in 1992to 51% in 2007. More recently, trade of goods with higher sophistication also grewsubstantially. In 2007, for example, import and export of high-technology productsrespectively accounted for 30% and 29% of the total, up from 26% and 18% in 2001.
In the case of India, considerable structural transformation within the trade of goodsdid not take place till after 2000. Even then, the changes have been much more modest,relative to those of China. In 1988, the top three categories with the higher exportshares were “textile and textile articles” (23%), “natural or cultured pearls, precious orsemi-precious stones” (22%), and “vegetable products” (11%). In 2006, export wasstill dominated by resource products and low-skilled labour intensive goods. The topthree items were “mineral products” (20%), “textile and textile articles” (15%), and“natural or cultured pearls, precious or semi-precious stones” (13%). As is shown inFigure 8b, although export share of labour intensive goods such as “textile and clothing,footwear, and other miscellaneous manufactured articles” was almost halved from around30% in the early 1990s to 17% in 2006, export share of more sophisticated manufactured“machinery and instruments” increased only slightly from 8% in 1988 to 12% in 2006.High technology exports only amounted to less than 5% of India’s total export in 2004.
There is thus evident disparity between China’s and India’s trade development,particularly in their structural transformation. A key factor underlying such divergence isin the different role of foreign investment. In China, foreign direct investments are essentialto China’s trade expansion and subsequent structural upgrading. In the process,investment from neighbouring economies in East and Southeast Asian economies hasbeen particularly important. Initiated as an export platform for many businesses from
FIGURE 8A SHARES IN CHINA’S TOTAL EXPORT, SELECTEDPRODUCTS, 1992-2007

70 east asian policyeast asian policyeast asian policyeast asian policyeast asian policy
the region, China has grown to become a critical link in Asia’s growing regional productionnetwork. Consequently, China has considerably reshaped trade relations within Asia aswell as Asia’s trade relations with the developed countries in the West.
By hosting increasing number of export-oriented foreign businesses, often targetingat consumers in the industrial world, China is accumulating huge trade surpluses,especially with the United States and the European Union. On the other hand, China isincurring growing trade deficit with its neighbouring economies in East and SoutheastAsia. Between 1994 and 2001, China had an average trade surplus of US$24 billion ayear, or about 7% of total trade. Since 2001, when China joined the World TradeOrganisation, trade surplus had further surged rapidly, from US$23 billion in 2001 toUS$262 billion in 2007, a nominal increase of 51% a year. It is important to point outthat foreign invested enterprises are the main contributor to China’s trade surplus. In2007, for example, China’s foreign-invested enterprises (FIEs) had a trade surplus ofUS$136 billion, 52% of the country’s total.
Trade surpluses with the US and EU are the main source of such huge trade surplus,each amounting to US$163 billion and US$134 billion in 2007. On the other hand,China’s trade deficit with its Asian neighbours also rose rapidly. The three economieswith which China has the largest trade deficit are Taiwan, Korea and Japan, eachamounting to US$78 billion, US$48 billion and US$32 billion in 2007. China also hastrade deficit with ASEAN in recent years although the amount has decreased since2006 (Figure 9). In effect, China is importing heavily from the more developed neighboursin Asia, particularly parts and components for processing and assembling, beforeexporting finished products to consumers in the developed world. This reflects thestrength of China’s integration with economies in Asia. In fact, Asia provides abouttwo-thirds of China’s total import, while receiving about half of China’s total export.
FIGURE 8B SHARES IN INDIA’S TOTAL EXPORT, SELECTEDPRODUCTS, 1988-2006

east asian policyeast asian policyeast asian policyeast asian policyeast asian policy 71
Growing foreign investment, in total amount and in technological complexity, hascontributed significantly to China’s trade expansion and restructuring. Most importantly,it enabled China to broaden and deepen its trade relations and production sharing withneighbouring economies. In comparison, foreign investment has played a much smallerrole in India’s trade development. Consequently, India is less integrated with othereconomies in Asia. Although India has strengthened its trade relations with Asianeconomies in recent years, especially since 2000, the overall effects are still limitedsince the total volume remains small.
Before the 1990s, India traded little with its Asian neighbours, with the exception ofJapan and oil exporting countries in the Middle East. In the past decade, especiallyafter 2000, India has strengthened its trade relations with mainland China and ASEANmembers. In 1980, for example, the only East Asian country included in the top 10markets for India’s export was Japan. In recent years, a number of East Asian economieshave climbed up the list of India’s main trading partners, especially Chinese mainland.In 2006, while the United States remained India’s largest export market (15% of thetotal), Chinese mainland, Singapore, Hong Kong Special Administrative Region(HKSAR), and Japan were among the top ten export destinations for India. Incomparison, however, India’s export of US$19 billion to the US in 2006 amounted to
FIGURE 9 CHINA’S NET EXPORT TO KEY TRADING PARTNERS,2001-2007

72 east asian policyeast asian policyeast asian policyeast asian policyeast asian policy
less than 10% of China’s export to the US. For import, China was the largest source in2006, accounting for 9.4% of the total. A number of Asian economies have also becomemore important in providing exports to India, including Singapore (3%), Malaysia (2.9%),Korea (2.6%), Japan (2.5%) and Indonesia (2.2%).
Although India has strengthened its trade relations with its Asian neighbours, India isstill much less integrated with regional economies and its overall impact limited. In 2006,for example, trade with India accounted for about 0.7% of Japan’s overall total. ForChina, export to and import from India accounted for a respective 2% and 1.5% of thecountry’s total in 2007, up from 0.6% in 2000. In 2006, Korea’s export to Indiaamounted to US$4.8 billion, equivalent to only 5% of its export to China.
Room to GrowDuring the past decades, both India and China have expanded their trade significantly,
which have been crucial to sustaining their remarkable economic growth. However, aclose examination of the key features of the two countries’ trade development, especiallywith respect to their structural changes, reveals many significant disparities. Overall,China has achieved much better scores in trade growth and transformation, whichcontributed to its better economic performance.
First of all, China is considerably more open to trade, as measured by trade to GDPratio, and contributed more significantly to world trade. Moreover, trade in goods is thedominant force in China’s trade expansion, while trade in services has played a muchmore important role in India’s trade growth. More importantly, foreign direct investmenthas been essential to China’s trade expansion and transformation. On one hand, export-oriented foreign invested enterprises are, to a large extent, responsible for China’srising trade surpluses. On the other hand, trade activities involving foreign investedenterprises have facilitated China’s integration with economies in the region as well asChina’s structural upgrading.
In contrast, while total trade has increased considerably, India continues to incur atrade deficit. This has been associated with limited restructuring in its commoditiestrade. To some extent, this is due to the lack of foreign investment. Consequently, Indiahas not been integrated into the intensifying regional production network, whichunderscored China’s rapid trade development.
There is plenty of room for India to catch up, including both domestic economictransformation and trade liberalisation. This would be important for India to sustain itsrecent economic growth and development. More importantly, continued economicdevelopment in India, as well as in other developing countries such as China, is crucialto the world economy, as the current financial crisis is fast spreading to all corners of theglobe.

east asian policyeast asian policyeast asian policyeast asian policyeast asian policy 73
APPENDIX TABLE AECONOMIC PERFORMANCE: SELECTED ASIAN ECONOMIES
Population GDP(million) Per Total Annual Growth (%)
capitaUS$ US$ 1960- 1970- 1980- 1990- 2000- 2006 2007
bn 1970 1980 1990 2000 20052007 2007 2007
China 1,321 2,460 3,250 5.2 5.5 10.3 9.7 9.3 11.1 11.9India 1123 977 1,098 3.4 3.6 5.8 5.5 6.3 8.8 8.7ASEAN-6 Singapore 4.6 35,162 161 8.8 8.3 6.7 7.4 3.4 6.9 7.7Indonesia 225 1,924 433 3.9 7.2 6.1 3.8 4.8 5.2 6.3Malaysia 27 6,947 186 6.5 7.9 5.3 6.5 4.4 5.5 6.3Philippines 88 1,624 144 5.1 6 1 3.3 4.4 5 7.3Thailand 66 3,736 245 8.4 7.1 7.6 3.8 5 4.5 4.7Vietnam 86 818 570 - - - 7.3 7.4 8.8 8.5
Sources: IMF; World Development Reports (various years)
APPENDIX TABLE B: GDP COMPOSITION (VALUE ADDED, % OF GDP)
1980 1985 1990 1995 2000 2005 2006
India
Agriculture 36 31 29 26 23 18 18
Industry 25 26 27 28 26 28 28
Services, etc. 40 43 44 46 50 54 55
China
Agriculture 30 28 27 20 15 13 12
Industry 49 43 42 47 46 48 48
Services, etc. 21 29 31 33 39 40 40
Source: World Development Indicators 2007, World Bank