Comparing physical properties of aminoglycoside antibiotics ...
126
University of Warsaw Faculty of Physics Julia Romanowska Comparing physical properties of aminoglycoside antibiotics’ binding sites in RNA and proteins PhD dissertation Supervisor: Joanna Trylska, PhD, Assoc. Prof. Centre of New Technologies, University of Warsaw Warsaw June 2012
Transcript of Comparing physical properties of aminoglycoside antibiotics ...
University of WarsawFaculty of Physics
Julia Romanowska
Comparing physical properties ofaminoglycoside antibiotics’ binding
sites in RNA and proteinsPhD dissertation
Supervisor:
Joanna Trylska, PhD, Assoc. Prof.
Centre of New Technologies,
University of Warsaw
Warsaw
June 2012
Abstract
Aminoglycoside antibiotics have been in use for more than 60 years, helping combat severebacterial infections. Due to this long time of usage, more and more bacteria become resistantto one or several drugs from this group. This spread of resistant species is alarming andadditionally, there is little knowledge about the mechanisms of bacterial resistance.
In order to broaden our understanding of how bacteria combat aminoglycosides, weperformed computer simulations of various molecules that bind aminoglycosides in a bac-terial cell: (i) the primary binding site, called the A-site and located in ribosomal RNA,wild type and with mutations that decrease the aminoglycoside binding affinity; and (ii) theaminoglycoside modifying enzymes (AMEs), which are produced by bacteria to inactivatethese drugs. The mutations of the RNA A-site were chosen based on previous experimentalstudies on whole bacteria. These studies showed that even single base substitutions weresufficient to make bacteria resistant, but did not explain how this resistance was gained onan atomic level. There are many AMEs and they vary a lot among themselves, yet they allhave a narrow specificity towards aminoglycosides, which are quite homogeneous group.The two main questions we have posed in our research are: (i) what are the physical groundsof bacteria becoming less susceptible to aminoglycosides due to RNA A-site mutations; and(ii) how different AMEs attract aminoglycosides and interact with them?
We performed all-atom molecular dynamics (MD) simulations of the A-site model withselected mutations and of AME representatives. In addition, the complexes of these biomol-ecules with aminoglycosides were simulated. For comparison, we also performed simula-tions of the wild type A-site model and of the aminoglycosides in water. We used variousbiophysical methods to analyze these simulations and to study: internal dynamics of thebiomolecules; electrostatic potential, shape, and volume of the binding pockets; types ofinteractions with aminoglycosides; and changes in conformations of aminoglycosides. Inaddition, we developed and implemented an algorithm that helps describe molecular mo-tions.
We found that different A-site mutations affect different features of the RNA bindingsite. Some of them changed the mobility of the nucleic bases, and therefore the shape of theA-site was altered. Other mutations changed the electrostatic potential inside the bindingsite, thus making it almost unrecognizable to aminoglycosides. The study of AMEs showedthat apart from their structural and sequence-related diversity, they differ in the internalmovement patterns. However, these enzymes interact with aminoglycosides very similarly,using mainly electrostatic interactions. Interestingly, we noticed that these interactions werecopied from the RNA:aminoglycoside complex. Our findings were in agreement with ex-perimental studies and also helped to explain some of their outcomes. The results presentedin this dissertation may help design new antibiotics that would overcome the bacterial re-sistance.

Dissertation title and summary in Polish
Analiza porównawcza własnosci fizycznych miejsc wiazania antybiotykówaminoglikozydowych w RNA i białkach
Od ponad 60 lat antybiotyki aminoglikozydowe sa z powodzeniem stosowane w szpi-talach przeciwko ciezkim infekcjom bakteryjnym. Jednak pojawianie sie coraz wiekszejliczby przypadków bakterii opornych na stosowane aminoglikozydy sprawia, ze badaniamechanizmów opornosci u bakterii staja kluczowe w dalszej skutecznej walce z infekcjamitego typu.
Przeprowadziłam komputerowe symulacje biomolekuł, które oddziałuja z antybioty-kami aminoglikozydowymi we wnetrzu komórek bakteryjnych. Badanymi obiektami sa:(i) główne miejsce wiazania aminoglikozydów, zwane miejscem A, w rybosomalnym RNA;natywne oraz z mutacjami powodujacymi wzrost opornosci u bakterii; a takze (ii) enzymymodyfikujace aminoglikozydy (ang. aminoglycoside modifying enzymes, AME), produkowaneprzez bakterie w celu chemicznej dezaktywacji tych leków. Motywacja do badan nad zmu-towanym miejscem A był brak informacji o zmianach jakie zachodza w fizycznych włas-nosciach miejsca A po róznych zamianach nukleotydów. Wiadomo jakie mutacje prowadzado opornosci oraz ze nawet pojedyncze zamiany nukleotydu moga miec bardzo wymierneskutki, ale nie wyjasniono jakie sa tego podstawy. Natomiast, w przypadku AME, celemprowadzenia symulacji było wyjasnienie w jaki sposób ta grupa białek jest w stanie bycjednoczesnie bardzo zróznicowana i wysoce specyficzna wzgledem aminoglikozydów.
Przeprowadziłam symulacje dynamiki molekularnej (MD) modelu miejsca A z wybra-nymi mutacjami oraz reprezentatywnych enzymów z trzech najwiekszych rodzin AME.Aby uzyskac opis oddziaływan miedzy tymi miejscami wiazacymi a aminoglikozydami,przeprowadziłam równiez symulacje MD tych biomolekuł w kompleksach z wybranymiantybiotykami. W celu analizy symulacji uzyłam metodologii z zakresu biofizyki teore-tycznej. Badałam wiele własnosci fizykochemicznych wybranych biomolekuł i ich kom-pleksów, m.in.: dynamike wewnetrzna, własnosci elektrostatyczne, kształt i objetosc miejscwiazania aminoglikozydów, a takze rodzaje oddziaływan z aminoglikozydami. Ponadto,stworzyłam nowa metode analizy zmian konformacyjnych w molekułach, która dokonujepodziału biomolekuł na tzw. dynamiczne domeny, na podstawie danych pochodzacych zsymulacji lub eksperymentów.
Z analizy symulacji rybosomalnego miejsca A wynika, ze mutacje róznych zasad wpły-waja na rózne własnosci fizyczne tego fragmentu RNA. W zaleznosci od połozenia mu-towanej zasady, zmieniał sie rozkład ładunków czastkowych w miejscu wiazacym lubkształt tego miejsca. Mutacje wpływały równiez na dynamike ruchów wewnetrznych miej-sca A. Analiza symulacji czasteczek AME wskazała, ze oprócz róznorodnosci struktur trze-ciorzedowych i sekwencji, wystepuje w tej grupie równiez róznorodnosc w ruchach we-wnetrznych. Pomimo tych róznic, wszystkie enzymy oddziaływały z aminoglikozydami wbardzo podobny sposób, głównie elektrostatycznie. Ponadto, te oddziaływania wydaja siebyc kopiowane z kompleksów, jakie aminoglikozydy tworza z miejscem A. Rezultaty moichbadan sa zgodne z poprzednimi doniesieniami eksperymentalnymi, a takze pomagaja wy-jasnic niektóre z nich. Wyniki opisane w tej pracy moga byc podstawa do zaprojektowaniazmodyfikowanych aminoglikozydów, które mogłyby byc aktywne nawet wobec opornychbakterii.
Acknowledgements:
I have met many wonderful people during this scientific journey towards a PhDdegree and I am grateful for all the nice words I heard and the atmosphere these
people created. I would definitely not have done it without my family, mydearest Lars and my faithful friends. It would not have been that fun without
my colleagues from the labs: Bionano, McCammon’s group and Reuter’s group.But most of all, it would not be possible at all without the encouragement,enormous amount of help and guidance, and sometimes very necessary but
always constructive criticism from my super supervisor, Joanna.
Thank you.
Funding:
The research was supported by ICM, University of Warsaw (G31-4), Polish Ministry of Sci-ence and Higher Education (N N301 245236 and N N301 033339), Foundation for PolishScience (Focus program and Team project (TEAM/2009-3/8) co-financed by European Re-gional Development Fund operated within Innovative Economy Operational Programme),the "HPC Infrastructure for Grand Challenges of Science and Engineering" Project, co-financedby the European Regional Development Fund under the Innovative Economy OperationalProgramme. The work at University of Bergen was co-financed by technical assistance fundsof the EEA Financial Mechanism and the Norwegian Financial Mechanism within the frame-work of the Scholarship and Training Fund.


List of publications
1. Romanowska, J., Reuter, N. & Trylska, J. (2012) Comparing aminoglycoside bindingsites in their bacterial modifying enzymes and ribosomal RNA, Proteins, preparingrevised manuscript (after Peer Review).
2. Romanowska, J., Nowinski, K. S. & Trylska, J. (2012) Determining geometrically stabledomains in molecular conformation sets, J. Chem. Theory Comput., preparing revisedmanuscript (after Peer Review).
3. Romanowska, J., McCammon, J. A. & Trylska, J. (2011) Understanding the Originsof Bacterial Resistance to Aminoglycosides through Molecular Dynamics MutationalStudy of the Ribosomal A-site. PLoS Comp. Biol., 7, e1002099.
4. Romanowska, J., Ekonomiuk, D. & Trylska, J. (2011) Computational studies of RNAdynamics and RNA-ligand interactions. Tor, Y. & Wanunu, M. (eds.), Methods forStudying Nucleic Acid Drug Interactions, chap. 15, Taylor & Francis.
5. Romanowska, J., Setny, P. & Trylska, J. (2008) Molecular dynamics study of the riboso-mal A-site. J. Phys. Chem. B., 112, 15227–15243.
7

Selected talks and poster
presentations
1. Mar. 26–29, 2007; Heidelberg, Germany; Biological Diffusion and Brownian DynamicsBrainstorm; poster presentation: “Dynamics of aminoglycosidic binding site in thesmall ribosomal subunit”;
2. Mar. 28–Apr. 3, 2008; Steamboat Springs, Colorado, USA; Computer-Aided DrugDesign; poster presentation: “Molecular dynamics study of the ribosomal A-site”;
3. Apr. 24–27, 2008; Warsaw, Poland; Bioinformatics 2008; poster presentation:“Molecular dynamics study of the ribosomal A-site”;
4. Oct. 3–5, 2008; Jadwisin, Poland; First Convention of the Polish BioinformaticsSociety; oral presentation: “Molecular dynamics study of the ribosomal A-site”;
5. Feb. 21–26, 2009; Zakopane, Poland; 36th Winter School of the Faculty of Biochemistry,Biophysics and Biotechnology of the Jagiellonian University Molecule interactionsin health and disease; oral presentation: “Molecular dynamics study of theribosomal A-site”;
6. Sept. 30, 2009; San Diego, CA, USA; prof. McCammon’s group meeting (UCSD, Dept.of Pharmacology); oral presentation: “Characteristics of chosen aminoglycosidicantibiotics binding sites”;
7. May 14–16, 2010; University of Warsaw, Poland; Advanced Bioinformatics Tools;poster presentation: “A variety of aminoglycoside complexes — in search of commonbinding site features”;
8. Jun. 13–16, 2010, Cetraro, Italy; International Society of Quantum Biology andPharmacology, 2010 President’s Meeting; poster and oral presentation: “Insights intoaminoglycosidic antibiotics’ recognition mechanisms”;
9. Sept. 28, 2010; Bergen, Norway; dr. Nathalie Reuter’s group meeting at University ofBergen; oral presentation: “Comparing physicochemical features of biomoleculesinteracting with aminoglycosidic antibiotics by means of computational modeling”;
10. Mar. 29, 2011; Anaheim, CA, USA; 241st American Chemical Society NationalMeeting; oral presentation: “Insights into aminoglycoside antibiotics recognitionmechanisms”;
11. May 4, 2011; University of Warsaw, Poland; Research Seminar “Mathematical Methodsin Biology” at Faculty of Mathematics, Informatics and Mechanics; oral presentation:“Physicochemical features of aminoglycoside modifying enzymes”;
9
10
12. May 22–26, 2011; Stockholm, Sweden; IXth European Symposium of The ProteinSociety; poster presentation: “Understanding aminoglycoside recognition byaminoglycoside modifying enzymes and ribosomal RNA”; awarded Protein ScienceYoung Investigator Travel Grant;
13. Sept. 13–16, 2011; Zurich, Switzerland; CECAM workshop: Dynamics ofProtein-Nucleic Acid Interactions: Integrating Simulations with Experiments;poster presentation: “Understanding aminoglycoside recognition by aminoglycosidemodifying enzymes and ribosomal RNA”;
14. Oct. 4–5, 2011; International Institute of Molecular and Cell Biology, Warsaw, Poland; TheModern Techniques for Drug Design Purposes; poster presentation:“Understanding aminoglycoside recognition by aminoglycoside modifying enzymesand ribosomal RNA”;
15. Nov. 16–19, 2011; Nałecz Institute of Biocybernetics and Biomedical Engineering, Warsaw,Poland; Multi-Pole Approach to Structural Biology; poster presentation:“Understanding aminoglycoside recognition by aminoglycoside modifying enzymesand ribosomal RNA”.


Contents
List of Figures 15
List of Tables 17
Abbreviations 18
1 Introduction 211.1 Aminoglycoside antibiotics . . . . . . . . . . . . . . . . . . . . . . . . . . . . . 22
1.1.1 Mode of action . . . . . . . . . . . . . . . . . . . . . . . . . . . . . . . . 221.1.2 Off-target binding sites . . . . . . . . . . . . . . . . . . . . . . . . . . . . 241.1.3 Bacterial resistance . . . . . . . . . . . . . . . . . . . . . . . . . . . . . . 241.1.4 A-site modifications . . . . . . . . . . . . . . . . . . . . . . . . . . . . . 251.1.5 Aminoglycoside modifying enzymes . . . . . . . . . . . . . . . . . . . 26
1.2 Computational studies of aminoglycosides and their binding sites . . . . . . . 281.3 Motivation of the research . . . . . . . . . . . . . . . . . . . . . . . . . . . . . . 291.4 Research aims and tools . . . . . . . . . . . . . . . . . . . . . . . . . . . . . . . 30
2 Methodology 312.1 Quantum calculations of electrostatic potential . . . . . . . . . . . . . . . . . . 312.2 Molecular mechanics and force field . . . . . . . . . . . . . . . . . . . . . . . . 33
2.2.1 Energy minimization . . . . . . . . . . . . . . . . . . . . . . . . . . . . . 342.3 Molecular dynamics . . . . . . . . . . . . . . . . . . . . . . . . . . . . . . . . . 35
2.3.1 Theory behind . . . . . . . . . . . . . . . . . . . . . . . . . . . . . . . . 352.3.2 Simulation setup . . . . . . . . . . . . . . . . . . . . . . . . . . . . . . . 37
2.4 Basic molecular dynamics data analysis . . . . . . . . . . . . . . . . . . . . . . 382.5 Describing internal motions . . . . . . . . . . . . . . . . . . . . . . . . . . . . . 39
2.5.1 Principal Component Analysis . . . . . . . . . . . . . . . . . . . . . . . 392.5.2 Conformer plots . . . . . . . . . . . . . . . . . . . . . . . . . . . . . . . 402.5.3 Correlated motions . . . . . . . . . . . . . . . . . . . . . . . . . . . . . . 40
2.6 Intra-molecular interactions . . . . . . . . . . . . . . . . . . . . . . . . . . . . . 412.7 Electrostatic description . . . . . . . . . . . . . . . . . . . . . . . . . . . . . . . 42
2.7.1 Poisson-Boltzmann model . . . . . . . . . . . . . . . . . . . . . . . . . . 422.7.2 Generalized Born model . . . . . . . . . . . . . . . . . . . . . . . . . . . 43
2.8 Assessment of the binding free energy . . . . . . . . . . . . . . . . . . . . . . . 43
3 Parameterization and preparation of the simulated systems 453.1 Aminoglycoside binding site in ribosomal RNA . . . . . . . . . . . . . . . . . 45
3.1.1 Starting structures . . . . . . . . . . . . . . . . . . . . . . . . . . . . . . 453.1.2 Preparation of the simulated systems . . . . . . . . . . . . . . . . . . . 463.1.3 Simulation conditions . . . . . . . . . . . . . . . . . . . . . . . . . . . . 47
13

14 CONTENTS
3.1.4 Choice of the force field . . . . . . . . . . . . . . . . . . . . . . . . . . . 473.1.5 Reliability of the dynamics of the A-site model . . . . . . . . . . . . . . 48
3.2 Aminoglycoside modifying enzymes . . . . . . . . . . . . . . . . . . . . . . . . 493.2.1 Starting structures . . . . . . . . . . . . . . . . . . . . . . . . . . . . . . 493.2.2 Preparation of the simulated systems . . . . . . . . . . . . . . . . . . . 493.2.3 Simulation conditions . . . . . . . . . . . . . . . . . . . . . . . . . . . . 50
3.3 Free aminoglycosides . . . . . . . . . . . . . . . . . . . . . . . . . . . . . . . . . 513.3.1 Simulation setup . . . . . . . . . . . . . . . . . . . . . . . . . . . . . . . 513.3.2 Parameterization validation . . . . . . . . . . . . . . . . . . . . . . . . . 51
3.4 Data analysis . . . . . . . . . . . . . . . . . . . . . . . . . . . . . . . . . . . . . . 55
4 Results and discussion 574.1 New method for identifying similarly moving atoms in molecular conforma-
tion sets . . . . . . . . . . . . . . . . . . . . . . . . . . . . . . . . . . . . . . . . . 584.1.1 GeoStaS algorithm . . . . . . . . . . . . . . . . . . . . . . . . . . . . . . 584.1.2 Tests on experimental and computational data . . . . . . . . . . . . . . 624.1.3 Summary . . . . . . . . . . . . . . . . . . . . . . . . . . . . . . . . . . . 69
4.2 Bacterial resistance mechanism 1: ribosomal RNA A-site mutations . . . . . . 704.2.1 Conformations of bound paromomycin . . . . . . . . . . . . . . . . . . 704.2.2 Internal dynamics of the bare ribosomal RNA A-site . . . . . . . . . . 724.2.3 Shapes and sizes of aminoglycoside binding pockets in RNA . . . . . 794.2.4 The U1406C/U1495A mutation changes the charge distribution inside
the A-site . . . . . . . . . . . . . . . . . . . . . . . . . . . . . . . . . . . 814.2.5 Short-range interactions formed by RNA with paromomycin . . . . . 824.2.6 Water molecules inside the aminoglycoside binding site in RNA . . . . 874.2.7 Proposed modifications of paromomycin . . . . . . . . . . . . . . . . . 884.2.8 Summary . . . . . . . . . . . . . . . . . . . . . . . . . . . . . . . . . . . 89
4.3 Bacterial resistance mechanism 2: enzymatic aminoglycoside modification . . 904.3.1 Conformations of bound kanamycin A . . . . . . . . . . . . . . . . . . 904.3.2 Internal dynamics of enzymes . . . . . . . . . . . . . . . . . . . . . . . 924.3.3 Shapes and sizes of aminoglycoside binding pockets in AMEs . . . . . 964.3.4 Electrostatic potential inside aminoglycoside binding sites . . . . . . . 974.3.5 Short-range interactions formed by the receptors with kanamycin A . 984.3.6 Water molecules inside aminoglycoside binding sites in AMEs . . . . 1044.3.7 Energetical analysis of kanamcyin A complexes . . . . . . . . . . . . . 1074.3.8 Summary . . . . . . . . . . . . . . . . . . . . . . . . . . . . . . . . . . . 109
5 Conclusions and outlook 111
Bibliography 115

List of Figures
1.1 Chemical structures of exemplary aminoglycosides . . . . . . . . . . . . . . . 221.2 Scheme of aminoglycoside action and bacterial resistance . . . . . . . . . . . . 231.3 Paromomycin binding site in the bacterial ribosome . . . . . . . . . . . . . . . 241.4 Different conformational states of A1492 and A1493 . . . . . . . . . . . . . . . 241.5 Schemes of reactions catalyzed by representative AMEs . . . . . . . . . . . . . 261.6 Visualization of selected AME structures and kanamycin A . . . . . . . . . . . 27
2.1 Illustration of force field components . . . . . . . . . . . . . . . . . . . . . . . . 342.2 Exemplary function for the Lennard-Jones-type van der Waals interactions . . 362.3 Periodic boundary conditions . . . . . . . . . . . . . . . . . . . . . . . . . . . . 372.4 Example of a correlated rotation . . . . . . . . . . . . . . . . . . . . . . . . . . 412.5 Examples of non-covalent interactions . . . . . . . . . . . . . . . . . . . . . . . 41
3.1 The RNA A-site model used in the simulations . . . . . . . . . . . . . . . . . . 463.2 Exposure to solvent of A1492 and A1493 in different ribosomal X-ray structures 483.3 Structures of the two aminoglycoside representatives . . . . . . . . . . . . . . 523.4 Conformations of the studied aminoglycosides measured by dihedral angles
of the linkages . . . . . . . . . . . . . . . . . . . . . . . . . . . . . . . . . . . . . 523.5 Distances between chosen hydrogen atoms of paromomycin . . . . . . . . . . 543.6 Distances between chosen hydrogen atoms of kanamycin A . . . . . . . . . . 54
4.1 Schematic representation of the workflow in the GeoStaS algorithm . . . . . . 594.2 Visualization of the results obtained from GeoStaS, for the NMR ensemble
1D1D . . . . . . . . . . . . . . . . . . . . . . . . . . . . . . . . . . . . . . . . . . 624.3 The optimal divisions for all tested NMR ensembles . . . . . . . . . . . . . . . 634.4 NMR ensembles with few conformations can be problematic for GeoStaS . . . 644.5 NMR ensembles containing nucleic acids, colored by the domains recognized
by GeoStaS . . . . . . . . . . . . . . . . . . . . . . . . . . . . . . . . . . . . . . . 644.6 Division into structural and dynamic domains of the GroEL monomer . . . . 664.7 Analysis of the correlation patterns in the GroEL monomer — DCCM versus
AMSM . . . . . . . . . . . . . . . . . . . . . . . . . . . . . . . . . . . . . . . . . 664.8 Division into dynamic domains of EF-Tu and EF-Tu:GDP complex . . . . . . . 674.9 Analysis of the correlation patterns in the EF-Tu:GDP complex — DCCM ver-
sus AMSM . . . . . . . . . . . . . . . . . . . . . . . . . . . . . . . . . . . . . . . 674.10 Comparison between the structural and dynamic domains for the EF-G pro-
tein and the protein:RNA complex — EF-Tu:tRNA . . . . . . . . . . . . . . . . 684.11 Division into dynamic domains found by GeoStaS for the simulation of H38
fragment . . . . . . . . . . . . . . . . . . . . . . . . . . . . . . . . . . . . . . . . 694.12 Conformations of paromomycin bound to different RNA receptors . . . . . . 71
15
16 LIST OF FIGURES
4.13 Histograms of per-residue RMSF values in the MD simulations of the A-sitemodels . . . . . . . . . . . . . . . . . . . . . . . . . . . . . . . . . . . . . . . . . 73
4.14 The number of hydrogen bonds in base pairs versus simulation time . . . . . 744.15 Conformations of the U1406�U1495 pair and its mutated alternatives . . . . . 754.16 Shift of base pairing pattern observed in some RNA simulations . . . . . . . . 764.17 Pseudo-dihedral angles describing the variation in the conformations of nu-
cleic bases . . . . . . . . . . . . . . . . . . . . . . . . . . . . . . . . . . . . . . . 774.18 Mobility of A1492 and A1493 in the MD simulations . . . . . . . . . . . . . . . 784.19 Conformations of bases forming the A-site taken from the most populated
clusters in each simulation . . . . . . . . . . . . . . . . . . . . . . . . . . . . . . 804.20 Areas of high sodium ion density in the free A-site . . . . . . . . . . . . . . . . 814.21 Change in paromomycin’s conformation in the A-site upon some mutations . 834.22 Distance between the center of mass of A1492(P) and A1493(P) and the centers
of mass of paromomycin’s ring . . . . . . . . . . . . . . . . . . . . . . . . . . . 844.23 Hydrogen bonds formed between ring II of paromomycin and RNA . . . . . 854.24 Representative structures of clusters from the MD simulations of A-site:PAR
complexes . . . . . . . . . . . . . . . . . . . . . . . . . . . . . . . . . . . . . . . 864.25 Areas of high water density in the mutated RNA binding sites . . . . . . . . . 874.26 Conformations of kanamycin A bound to different receptors . . . . . . . . . . 914.27 Difference in internal dynamics between the APO and HOLO states of the
enzymes . . . . . . . . . . . . . . . . . . . . . . . . . . . . . . . . . . . . . . . . 924.28 Histograms of the per-residue RMSF values from the simulations of AMEs . . 924.29 Dynamic domains found by GeoStaS based on conformations from the AME
trajectories . . . . . . . . . . . . . . . . . . . . . . . . . . . . . . . . . . . . . . . 934.30 Visualization of the first PC for the APH and AAC X-ray structures . . . . . . 944.31 Comparison of the trajectory-derived conformations with the experimental
structures of the AAC and APH enzymes . . . . . . . . . . . . . . . . . . . . . 954.32 Clustering of ANT conformations sampled in all the simulations . . . . . . . . 954.33 Histograms of aminoglycoside binding site volume in simulations of the A-
site and AMEs . . . . . . . . . . . . . . . . . . . . . . . . . . . . . . . . . . . . . 964.34 Comparison of the electrostatic potential in the aminoglycoside binding clefts
of different AME X-ray structures . . . . . . . . . . . . . . . . . . . . . . . . . . 974.35 Similar interactions formed with kanamycin A in different binding sites . . . 1024.36 Stacking interactions formed with kanamycin A in different receptors . . . . . 1034.37 Areas of high water density around kanamycin A in the AME binding sites . 1044.38 Water-mediated hydrogen bonds near kanamycin A in AME binding clefts . 1064.39 The most stable water molecules in the AME:KAN complexes . . . . . . . . . 1064.40 Per-residue decomposition of the MMGBSA free binding energy for the stud-
ied AME complexes . . . . . . . . . . . . . . . . . . . . . . . . . . . . . . . . . . 108
5.1 Graphical representation of key findings concerning mutations in the rRNAA-site . . . . . . . . . . . . . . . . . . . . . . . . . . . . . . . . . . . . . . . . . . 112
5.2 Graphical representation of key findings concerning AME-mediated amino-glycoside modifications. . . . . . . . . . . . . . . . . . . . . . . . . . . . . . . . 112

List of Tables
1.1 Level of resistance caused by exemplary mutations in the bacterial 16S rRNA 25
3.1 MD simulations of RNA . . . . . . . . . . . . . . . . . . . . . . . . . . . . . . . 463.2 Structures of AMEs that were used in the study . . . . . . . . . . . . . . . . . . 493.3 MD simulations of representative AMEs . . . . . . . . . . . . . . . . . . . . . . 50
4.1 Average RMSD and ligand RMSF for the RNA simulations . . . . . . . . . . . 724.2 Base pairing in the RNA simulations . . . . . . . . . . . . . . . . . . . . . . . . 764.3 Duration of the flipped-in conformations of A1492 and A1493 . . . . . . . . . 784.4 Direct hydrogen bonds formed between paromomycin and the ribosomal RNA
A-site in the simulation . . . . . . . . . . . . . . . . . . . . . . . . . . . . . . . . 824.5 Reproduction of the crystal water molecules in simulations of the A-site:PAR
complexes . . . . . . . . . . . . . . . . . . . . . . . . . . . . . . . . . . . . . . . 884.6 Common chemical features of amino acids inside the aminoglycoside binding
sites in AMEs. . . . . . . . . . . . . . . . . . . . . . . . . . . . . . . . . . . . . . 974.7 Direct hydrogen bonds formed between kanamycin A and the ribosomal RNA
A-site in the simulation . . . . . . . . . . . . . . . . . . . . . . . . . . . . . . . . 984.8 Direct hydrogen bonds formed between kanamycin A and AAC(60)-Ib . . . . 994.9 Direct hydrogen bonds formed between kanamycin A and APH(30,500)-IIIa . . 1004.10 Direct hydrogen bonds formed between kanamycin A and ANT(40)-I . . . . . 101
17
18 ABBREVIATIONS
Abbreviations, in alphabetical order
2-DOS = 2-deoxystreptamine;A-site = aminoacyl-tRNA binding site in the ribosome;AAC = aminoglycoside acetyltransferase;ACO = acetyl-coenzyme A;ADP, AMPCPP, ATP = adenosine diphosphate, adenosine 50-methylenediphosphate,
adenosine triphosphate;AG = aminoglycoside;AME = aminoglycoside modifying enzyme;AMSM = atomic movement similarity matrix;ANT = aminoglycoside nucleotidyltransferase;AO = atomic orbitals;APH = aminoglycoside phosphotransferase;APO state = here, non-active binary complex enzyme:cofactor;CG = conjugate gradients (minimization method);DCCM = dynamic cross-correlation matrix;DNA = deoxyribonucleic acid;ESP = electrostatic potential;GB = generalized Born;GDP, GTP = guanosine diphosphate, guanosine triphosphate;GTO = Gaussian-type orbital;HOLO state = here, active ternary complex enzyme:cofactor:aminoglycoside;KAN = kanamycin A;LCAO = linear combination of atomic orbitals;MD = molecular dynamics;MIC = minimal inhibitory concentration;MMGBSA, MMPBSA = molecular mechanics general Born surface area, molecular me-
chanics Poisson-Boltzmann surface area;MO = molecular orbital;NMA = normal mode analysis;NMR = nuclear magnetic resonance;PAR = paromomycin;PB = Poisson-Boltzmann (equation);PCA = principal component analysis;PDB = Protein Data Bank;PES = potential energy surface;PME = particle mesh Ewald;QM = quantum mechanics;RESP = restrained electrostatic potential method;RMSD = root-mean-square deviation;RMSF = root-mean-square fluctuation;RNA, mRNA, rRNA, tRNA = ribonucleic acid, messenger RNA, ribosomal RNA,
transfer RNA;S = svedberg, a measure of sedimentation time of a molecule:
1 S = 10�13 seconds = 100 fs;SASA = solvent accessible surface area;SD = steepest descent (minimization method);WT = wild-type.
19
Nucleic acid bases:A, Ade = adenine;C, Cyt = cytosine;G, Gua = guanine;U, Ura = uracil.
Amino acid names used in the text:Arg, R = arginine;ASH = protonated aspartic acid;Asp, D = aspartic acid;Asn, N = asparagine;Gln, Q = glutamine;Glu, E = glutamic acid;Gly, G = glycine;His, H = histidine;Ile, I = isoleucine;Lys, K = lysine;Phe, F = phenylalanine;Ser, S = serine;Thr, T = threonine;Trp, W = tryptophan;Tyr, Y = tyrosine.

Chapter 1
Introduction
Bacterial cells are typically only several micrometers in size and visible only under amicroscope. Yet there are millions of these cells in every inch of all that surrounds us. Somebacteria can cause a number of infectious diseases that can be fatal, while others are neces-sary for human health. Since the 19th century discovery of the connection between certaindiseases and bacteria, there has been constant fight between bacterial survival and humanattempts to eradicate pathogenic bacterial species. The first antibiotic, penicillin, was dis-covered by Alexander Fleming and was initially highly successful in controlling bacteria.Evolution, however, enabled bacterial species to resist the antibiotics.1 Their short prolif-eration time, sometimes as short as minutes,2 and their ability to mutate and incorporateexternal DNA, makes their resistance just a matter of time. Recent discoveries point to apossibility that some tools used by bacteria to subvert antibiotic action were available al-most from the beginning of life.3
Early antibiotic studies can be called discoveries — among numerous substances a re-searcher could only hope to find the one that would be lethal to bacteria while having mini-mal effects towards humans. Today, drug design is used to design inhibitory molecules thatare based on knowledge of the biochemical processes in a bacterial cell. Drug design re-quires many in-depth studies of the basic mechanisms underlying the modes of action andresistance towards specific antibiotics in order to explain and clarify the interactions of thedrug inside a bacterial cell and to propose development strategies.
While the final stages of drug development cannot be completed without experimentson living organisms, modern computational techniques can substantially reduce the timeand cost of the initial stages of drug development. Using the modern tools of theoretical bio-physics, the interactions between antibiotic molecules and their receptors in bacterial cellscan be reliably investigated with computational modeling.4, 5 Some of these methods enabledetailed studies of static structures, but most importantly, the dynamic features of biomol-ecules can be directly observed and measured. Theoretical approaches are now commonlyused in research related to drug design.6
Notably, drug development is not only about fighting new diseases. There is a con-stant need for better antibacterial agents due to the bacterial resistance that develops againstwidely used drugs. This is especially important for antibiotics used only in hospitals againstthe multidrug resistant bacteria species. One example is the treatment of multi-drug resis-tant tuberculosis with aminoglycoside antibiotics (AGs),7 which are still successfully usedbut the resistance to these antibiotics is spreading. According to the World Health Orga-nization (WHO), in some regions more than 18% of new tuberculosis cases are multi-drugresistant.8 Therefore, there is a pressing need to understand how bacteria fight these antibi-otics, so that better drugs can be designed.
21
22 INTRODUCTION
1.1 Aminoglycoside antibiotics
The history of aminoglycosides began with the discovery of streptomycin in the 1940sin the laboratory of Dr Selman Abraham Waksman.9 Since then, aminoglycosides have beensuccessfully used against severe bacterial infections. This class of antibiotics is active againstmany species of Gram-positive and Gram-negative bacteria.10 Streptomycin was the firstefficient weapon against deadly tuberculosis, which was an important breakthrough andbrought its discoverer the Nobel prize in 1952.
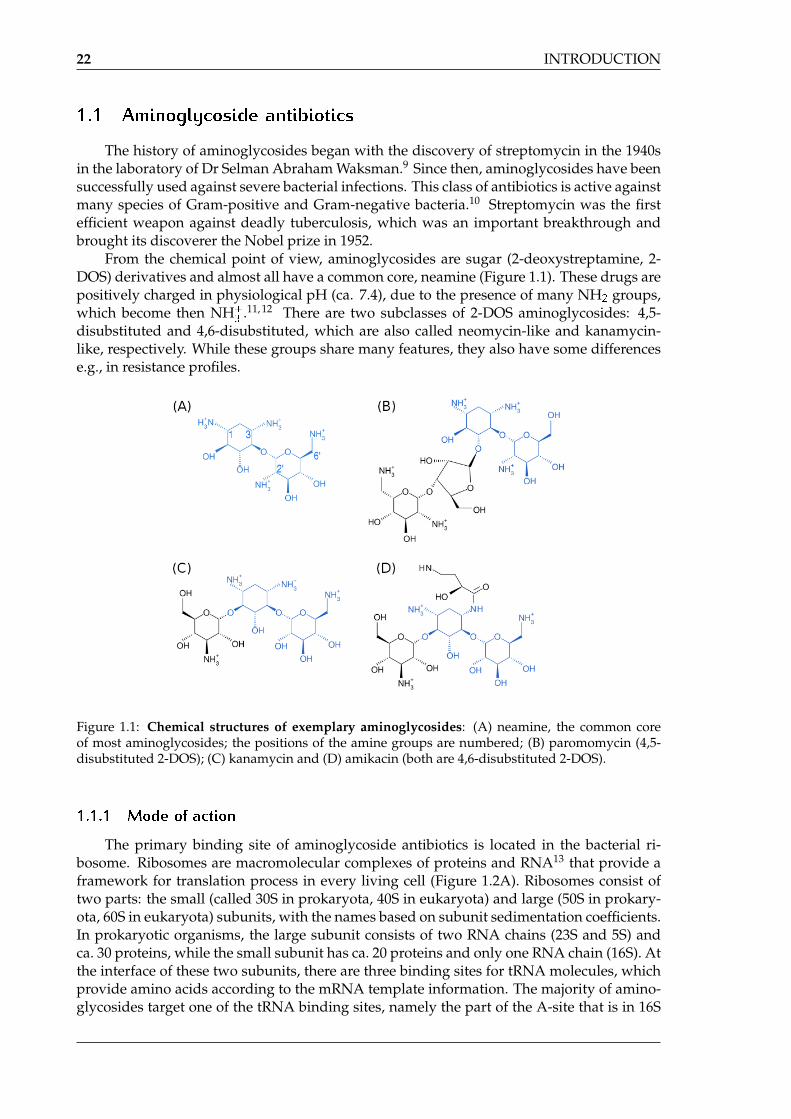
From the chemical point of view, aminoglycosides are sugar (2-deoxystreptamine, 2-DOS) derivatives and almost all have a common core, neamine (Figure 1.1). These drugs arepositively charged in physiological pH (ca. 7.4), due to the presence of many NH2 groups,which become then NH+
3 .11, 12 There are two subclasses of 2-DOS aminoglycosides: 4,5-disubstituted and 4,6-disubstituted, which are also called neomycin-like and kanamycin-like, respectively. While these groups share many features, they also have some differencese.g., in resistance profiles.
Figure 1.1: Chemical structures of exemplary aminoglycosides: (A) neamine, the common coreof most aminoglycosides; the positions of the amine groups are numbered; (B) paromomycin (4,5-disubstituted 2-DOS); (C) kanamycin and (D) amikacin (both are 4,6-disubstituted 2-DOS).
1.1.1 Mode of action
The primary binding site of aminoglycoside antibiotics is located in the bacterial ri-bosome. Ribosomes are macromolecular complexes of proteins and RNA13 that provide aframework for translation process in every living cell (Figure 1.2A). Ribosomes consist oftwo parts: the small (called 30S in prokaryota, 40S in eukaryota) and large (50S in prokary-ota, 60S in eukaryota) subunits, with the names based on subunit sedimentation coefficients.In prokaryotic organisms, the large subunit consists of two RNA chains (23S and 5S) andca. 30 proteins, while the small subunit has ca. 20 proteins and only one RNA chain (16S). Atthe interface of these two subunits, there are three binding sites for tRNA molecules, whichprovide amino acids according to the mRNA template information. The majority of amino-glycosides target one of the tRNA binding sites, namely the part of the A-site that is in 16S

Aminoglycoside antibiotics 23
rRNA, i.e., in the small ribosomal subunit14 (Figure 1.3).
The sequence of the 16S rRNA A-site (Figure 1.3B) is highly conserved among dif-ferent species and displays high similarity even between bacterial and human sequences(ca. 80%).15, 16 This similarity is responsible for the wide spectrum of aminoglycosidic ac-tion, however, it also enables these antibiotics to bind to human ribosomes, which can resultin toxicity.17 The most conserved residues in the A-site sequence are two adenines: A1492and A1493 (numbering as in Escherichia coli is used throughout the text). These residuesform a bulge in this helical rRNA fragment, and in the native ribosome they are very mo-bile, alternating between the flipped-out and flipped-in states18, 19 (Figure 1.4). This mobilityis needed for the correct recognition of a tRNA molecule that carries an amino acid match-ing the mRNA codon.20–24 When A1492 and A1493 are in the flipped-out state, they interactwith other parts of the 16S rRNA, and send a signal that the tRNA can be accepted bythe ribosome. When an aminoglycoside is bound, the adenines are locked in the flipped-out state11, 25–27 (Figure 1.3C), and therefore the acceptance ratio is almost the same for anytRNA, without differentiation between the cognate, near- and non-cognate. Consequently,the resulting proteins are malfunctioning, which eventually leads to bacterial cell death (Fig-ure 1.2B).
Apart from this diminished translation fidelity, some aminoglycosides block the correctassembly of the ribosomal subunits.9 More recently, another aminoglycoside feature hasdrawn attention, wherein binding of some aminoglycosides, e.g., paromomycin, to the ribo-some allows the translation to proceed past the AUG stop codon on mRNA. This function,termed a stop-codon read-through ability,28, 29 could be useful in treating genetic diseasescaused by a premature stop codon mutation in humans, wherein ribosomes create trun-cated proteins that do not function properly. Several modified aminoglycosides have beenproposed that could act in human cells29 to restore the proteins to their native length.
Figure 1.2: Scheme of aminoglycoside action and bacterial resistance. (A) Normal translation pro-cess; (B) binding of an aminoglycoside (AG) to the 30S subunit increases the translation error rate,thus producing malfunctioning proteins; (C) specific mutations within the aminoglycoside bindingsite result in diminished drug affinity; (D) production of aminoglycoside modifying enzymes (AME)by bacteria; the chemically altered antibiotics are not able to bind to the ribosomal binding site.

24 INTRODUCTION
Figure 1.3: Paromomycin binding site in the bacterial ribosome: (A) cartoon representation of theentire ribosome during the translation process, with the small subunit in blue (16S rRNA) and cyan(proteins), and the large subunit in green (5S and 23S rRNA) and lime (proteins), the tRNA moleculesare yellow and paromomycin is presented as red spheres; (B) the sequence of the aminoglycosidebinding site in the E. coli 16S rRNA; (C) paromomycin (shown as spheres) bound to 16S rRNA, thebases marked yellow are A1492, A1493 (both in the flipped-out state) and A1408.
Figure 1.4: Different conformational states of A1492 and A1493, presented as a visualization ofseveral X-ray structures of the A-site model or the entire 30S subunit. Each structure is identified byits PDB code (1J5E,30 1T0E,26 2ET831).
1.1.2 O�-target binding sites
Inside the cell, aminoglycosides have a high net positive charge that causes a naturalattraction to negatively charged molecules inside a cell, mainly nucleic acid chains. Forexample, it has been shown that aminoglycosides can bind and stabilize DNA triplexes.32
However, it is mainly RNA that interacts with these drugs inside living cells33 and onlyspecific sequences can effectively bind these antibiotics.34–36 These specific RNAs includeribozymes (i.e., RNA fragments that are capable of RNA cleavage), aptamers (also calledRNA switches) or even HIV mRNA fragments.37, 38 This binding results in a specific func-tion, with aminoglycosides affecting the hammerhead ribozyme cleavage39 and inhibitingviral replication by blocking the necessary conformational changes of viral mRNAs.37
1.1.3 Bacterial resistance
Although aminoglycosides can bind to several different sites in various RNA chains,their practical use shows that the efficacy in binding to the primary ribosomal binding siteis sufficient to combat bacterial infections. Even though the majority of patients currently

Aminoglycoside antibiotics 25
respond well to aminoglycoside treatment, more and more cases of resistant bacterial strainsare being reported in clinics worldwide.9 One measure of the resistance level is the minimalinhibitory concentration (MIC; Chapter 2 in Ref.40), which is the lowest concentration of adrug (in �g/ml) needed to completely stop bacterial growth, as determined after a minimum16 h incubation. For susceptible bacteria, the aminoglycoside MIC is around 5 �g/ml butfor resistant strains the MIC can increase by 1000-fold or more (e.g., Refs.41, 42).
There are three main modes of the bacterial resistance to aminoglycoside antibiotics:14, 28
(i) decreasing the number of drug molecules inside the cell (via active and passive efflux);(ii) changing the primary binding site through mutation or methylation of A-site RNA bases(Figure 1.2C); and (iii) enzymatic chemical modification of the drugs (Figure 1.2D). The lasttwo modes are the main focus of this thesis, and are introduced in the two following sections.
1.1.4 A-site modi�cations
Aminoglycosides target the very basic process in bacterial cells, thus the majority ofthe spontaneous mutations within the binding site are lethal for bacteria.43, 44 Moreover,there are usually several copies of genes encoding 16S rRNA14 so that even when one RNAcopy carries a resistance-causing sequence, the others remain susceptible. Experiments haveshown that only specific mutations result in living resistant bacteria with even single-pointmutations being sufficient to promote survival41, 42, 45–47 (Table 1.1 presents exemplary mu-tations together with their MIC values).
Table 1.1: Level of resistance caused by exemplary mutations in the bacterial 16S rRNA.See Figure 1.3B for base numbering.
MIC [�g/ml]mutation paromomycin kanamycin A amikacin reference
WT 1 1 1 41
A1408G 64 >1024 >1024 41, 48
G1491A 32 2 1 41, 48
G1491U 512 128 32 41, 48
U1406C 64 32–64 4 41, 49
U1495A 256–512 512 128–256 41, 49
U1406C/U1495A >1024 >1024 1024 41, 49
U1406C/U1495G >1024 >1024 128 41, 49
The most important difference between bacterial and human A-site sequences is at base1408, which is adenine (A) in prokaryota and guanine (G) in eukaryota.50 Bacteria withan A1408G mutation are highly resistant (i.e., having a broad resistance profile) and theirproliferation rate is almost the same as for the wild type.51 There are many other muta-tions that give high levels of resistance, however, they also lead to diminished translationefficiency, which prolongs the time of bacterial growth. Moreover, not every mutation isequally efficient against every aminoglycoside — different distribution patterns of OH andNH2 substituents in aminoglycosides correlate with different resistance profiles of bacteria(e.g., Refs.41, 42, 52). Nevertheless, the double mutation U1406C/U1495A gives a very broadresistance profile.45 Interestingly, a similarly broad profile was found in bacteria possess-ing only one of these two substitutions, namely U1495A, while the other single mutation,U1406C, did not produce significant effects. Although some mutations result in high levelsof resistance, they are not common among bacteria. Researchers have demonstrated thatthe most frequently occurring mutations are also the most profitable,51 i.e., they decreasethe efficiency of aminoglycosides significantly while not slowing down bacterial growth.
26 INTRODUCTION
Nevertheless, only a few bacterial species can use this resistance method, namely thesespecies that possess only one copy of the gene encoding the 16S rRNA chain. More recently,post-transcriptional methylation of this RNA fragment was shown to cause resistance inseveral Gram-negative pathogens.53, 54 This is an even smaller change than a single-pointmutation but it still can produce high levels of resistance (MIC > 256 �g/ml53), albeit againstfewer aminoglycosides.
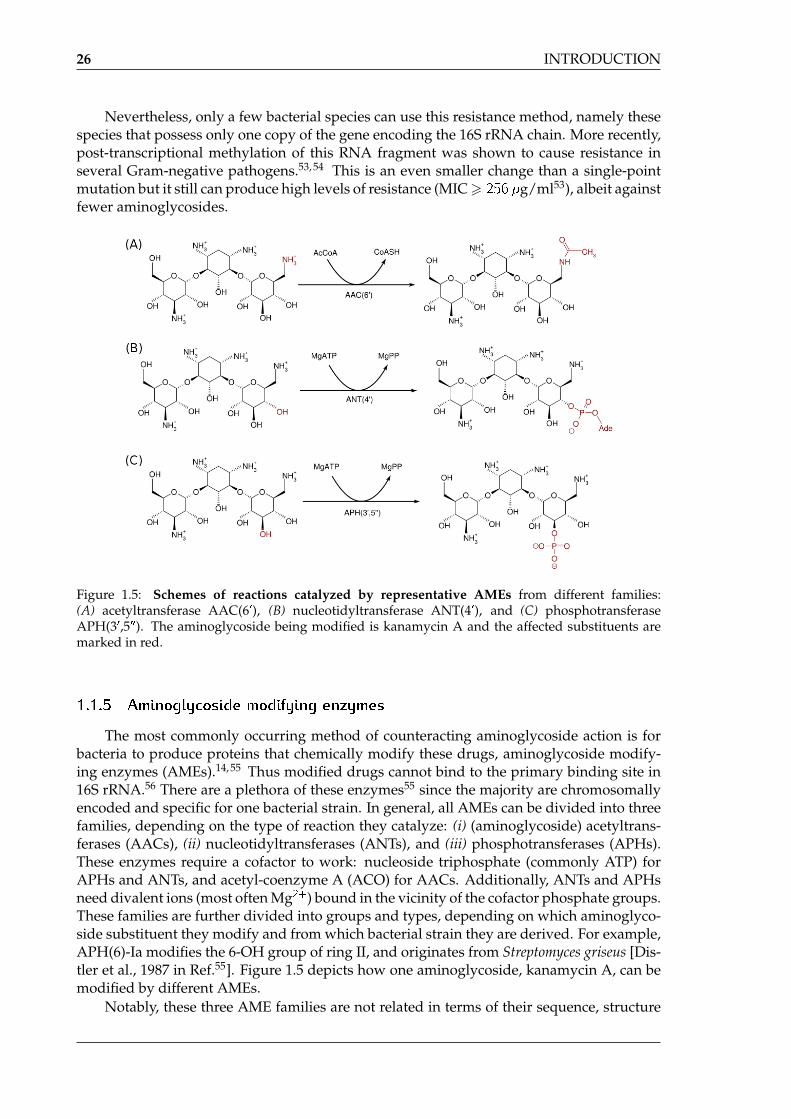
Figure 1.5: Schemes of reactions catalyzed by representative AMEs from different families:(A) acetyltransferase AAC(60), (B) nucleotidyltransferase ANT(40), and (C) phosphotransferaseAPH(30,500). The aminoglycoside being modified is kanamycin A and the affected substituents aremarked in red.
1.1.5 Aminoglycoside modifying enzymes
The most commonly occurring method of counteracting aminoglycoside action is forbacteria to produce proteins that chemically modify these drugs, aminoglycoside modify-ing enzymes (AMEs).14, 55 Thus modified drugs cannot bind to the primary binding site in16S rRNA.56 There are a plethora of these enzymes55 since the majority are chromosomallyencoded and specific for one bacterial strain. In general, all AMEs can be divided into threefamilies, depending on the type of reaction they catalyze: (i) (aminoglycoside) acetyltrans-ferases (AACs), (ii) nucleotidyltransferases (ANTs), and (iii) phosphotransferases (APHs).These enzymes require a cofactor to work: nucleoside triphosphate (commonly ATP) forAPHs and ANTs, and acetyl-coenzyme A (ACO) for AACs. Additionally, ANTs and APHsneed divalent ions (most often Mg2+) bound in the vicinity of the cofactor phosphate groups.These families are further divided into groups and types, depending on which aminoglyco-side substituent they modify and from which bacterial strain they are derived. For example,APH(6)-Ia modifies the 6-OH group of ring II, and originates from Streptomyces griseus [Dis-tler et al., 1987 in Ref.55]. Figure 1.5 depicts how one aminoglycoside, kanamycin A, can bemodified by different AMEs.
Notably, these three AME families are not related in terms of their sequence, structure
Aminoglycoside antibiotics 27
or evolution. With regard to structure, the AAC family can be assigned to the GCN5-relatedN-acetyltransferase (GNAT) superfamily,57 while the function of APH enzymes links themto the protein kinase family,58 although the sequence similarity between these two groups isvery low. ANTs are unrelated to any other known enzymatic group. Below, we present thecurrent state of knowledge for three selected enzymes that represent the different families:AAC(60)-Ib, ANT(40)-I and APH(30,500)-IIIa.
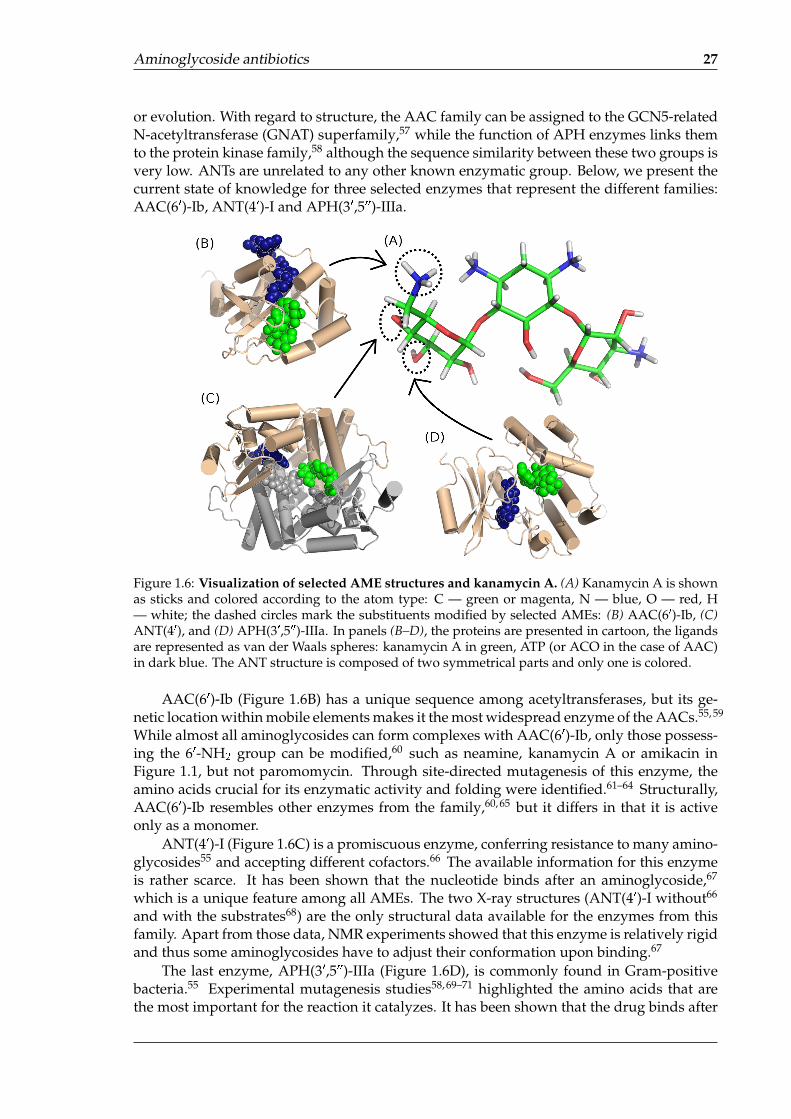
Figure 1.6: Visualization of selected AME structures and kanamycin A. (A) Kanamycin A is shownas sticks and colored according to the atom type: C — green or magenta, N — blue, O — red, H— white; the dashed circles mark the substituents modified by selected AMEs: (B) AAC(60)-Ib, (C)ANT(40), and (D) APH(30,500)-IIIa. In panels (B–D), the proteins are presented in cartoon, the ligandsare represented as van der Waals spheres: kanamycin A in green, ATP (or ACO in the case of AAC)in dark blue. The ANT structure is composed of two symmetrical parts and only one is colored.
AAC(60)-Ib (Figure 1.6B) has a unique sequence among acetyltransferases, but its ge-netic location within mobile elements makes it the most widespread enzyme of the AACs.55, 59
While almost all aminoglycosides can form complexes with AAC(60)-Ib, only those possess-ing the 60-NH2 group can be modified,60 such as neamine, kanamycin A or amikacin inFigure 1.1, but not paromomycin. Through site-directed mutagenesis of this enzyme, theamino acids crucial for its enzymatic activity and folding were identified.61–64 Structurally,AAC(60)-Ib resembles other enzymes from the family,60, 65 but it differs in that it is activeonly as a monomer.
ANT(40)-I (Figure 1.6C) is a promiscuous enzyme, conferring resistance to many amino-glycosides55 and accepting different cofactors.66 The available information for this enzymeis rather scarce. It has been shown that the nucleotide binds after an aminoglycoside,67
which is a unique feature among all AMEs. The two X-ray structures (ANT(40)-I without66
and with the substrates68) are the only structural data available for the enzymes from thisfamily. Apart from those data, NMR experiments showed that this enzyme is relatively rigidand thus some aminoglycosides have to adjust their conformation upon binding.67
The last enzyme, APH(30,500)-IIIa (Figure 1.6D), is commonly found in Gram-positivebacteria.55 Experimental mutagenesis studies58, 69–71 highlighted the amino acids that arethe most important for the reaction it catalyzes. It has been shown that the drug binds after

28 INTRODUCTION
ATP and magnesium ions.72 By comparing available APH(30,500)-IIIa X-ray structures, theconformational changes of the enzyme before and after complexation with an aminoglyco-side could be studied,73–75 and the binding poses of different antibiotics compared.76, 77
Through a comparison of the available static structures of AME:AG complexes,67, 78–80
some aminoglycosides were found to be dynamic inside the binding sites, while otherschanged their conformation upon binding, but the majority were found to adopt the sameconformation as in the ribosomal A-site. This finding, unfortunately, hampers the processof designing modified aminoglycosides that would have a higher affinity towards the RNAbinding site than towards AMEs.
1.2 Computational studies of aminoglycosides
and their binding sites
Aminoglycoside antibiotics and their biological partner, RNA, have been a subject ofmany different computational studies. One of the first simulations concerning aminoglyco-sides was conducted by T. Hermann and E. Westhof,81 who showed that when these drugsbind to a hammerhead ribozyme, the positions of their amine groups match those of theMg2+ cations that are bound to the ribozyme during a normal cleavage. These cations arerequired for proper ribozyme folding and functioning, thus when the antibiotic is boundinstead, the ribozyme is no longer active.
Concerning the primary binding site of aminoglycosides, the rRNA A-site, Réblovaet al. analyzed the internal motion of helix 44 from 16S rRNA, which contains the A-site.82
These all-atom MD studies showed that adenines A1492 and A1493 are flexible, alternatingbetween the flipped-in and flipped-out states. There was also a transient hydrogen bond-ing between A1492 and A1408, when A1492 occupied the flipped-in conformation. Inter-estingly, only base 1492 was observed in the flipped-out conformation. A more completeview of the adenine flipping was presented in a study by K. Y. Sanbonmatsu83 that usedan enhanced sampling method, called Replica Exchange MD, to demonstrate that adenines,A1492 and A1493, are in a dynamic equilibrium between the flipped-in and flipped-outstates, which agreed with previous experiments.18, 19 These simulations also suggested alower energy barrier for the transition of A1492 than for A1493. Another MD simulationstudy compared the adenine mobility between the free A-site and a complex with an amino-glycoside.20 The researchers proposed an explanation for aminoglycoside action, where thebinding of aminoglycoside narrows the range of movement of A1492 and A1493, render-ing these bases incapable of functioning as the differentiating factor between cognate andnon-cognate tRNAs.
Several all-atom molecular dynamics (MD) studies of aminoglycosides complexed withthe A-site have been performed. Vaiana et al. showed that the A-site:PAR complex isstable and the interactions between the antibiotic and RNA are mostly electrostatic, butwater-mediated hydrogen bonds were also found to be important.84 Our previous stud-ies expanded these findings by comparing the A-site internal dynamics of wild-type andeukaryotic-like structures (i.e., possessing the A1408G mutation).85 Results from our MDsimulations showed that this mutation caused a change in the mobility of A1492 and A1493and also affected the electrostatic potential inside the binding cleft. Another study of theA-site complexes with different aminoglycosides revealed a correlation between the hydra-tion pattern around the bound drug and their computed binding affinity.86 This work alsodescribed how the dynamics of the U1406�U1495 base pair is affected by various antibiotics.Finally, Replica Exchange MD was used to study binding and unbinding of an aminoglyco-side to and from the A-site.87 Results from this study concluded that the steering mechanism

Motivation of the research 29
for the RNA:AG association is stochastic gating rather than induced fit, as was proposed ear-lier. This means that it is not the antibiotic that pushes the adenines A1492 and A1493 to theflipped-out state. Rather, the aminoglycoside has to wait for this state to occur in order tobind.
A more coarse-grained approach was used to investigate the association pathways foraminoglycosides approaching the A-site model88 and the whole 30S ribosomal subunit.89
The results from these Brownian dynamics simulations described the driving forces of thisassociation, wherein aminoglycosides appear not to find their 30S binding site immediatelybut instead they scan the surface for the right match. During the final steps of complexformation, the rate of association depends on both, electrostatic and steric interactions.
Finally, a binding free energy analysis has been reported90 that combined experimentaland computational methods. A detailed electrostatic analysis of both, the A-site model andthe whole 30S subunit, showed that the existing models and methods that calculate theelectrostatic contribution to the binding free energy yield reliable results, however, specificadjustments to the parameters are sometimes necessary.
In the case of AMEs, only two computational studies have been reported: of AAC(20)-Ic91
and AAC(3)-IIIb.92 This research, however, focused not on aminoglycosides but on the co-factor binding and dynamic response of the enzymes.
1.3 Motivation of the research
The Infectious Diseases Society of America published a new call in 2010, encourag-ing organizations and scientists to develop ten new antibiotics by the year 2020.93 In 2011,World Health Day, organized by WHO, was dedicated to drug resistance�. These two or-ganizations, among others, pointed out the diminishing focus of industry on antibacte-rial innovation, which resulted in only a few new antibiotics introduced to the market in2010, with most being slight modifications of older drugs. One reason for this decreasedoutput is the cost of developing a new drug, which is estimated to be on average severalbillions USD.94 However, another reason is the poor understanding of bacterial resistancemechanisms. Some general schemes are known, but their details often remain unclear. Thescientific project presented here seeks to describe the detailed mechanisms of bacterial re-sistance against aminoglycosides and can help speed the development of better antibioticsfrom this class.
In the case of aminoglycosides, the resistance methods developed by bacteria are notnew. To date, many modified aminoglycosides have been proposed in the hope that theywould have higher potency against resistant bacteria.95 Modifications to the drugs in-clude addition and/or substitution of chemical groups in known aminoglycosides (e.g.,Refs.96–101), fusion of aminoglycosides with other antibiotics (e.g., Ref.102) or even de novore-design of compounds having similar features.29 However, the majority of these modifieddrugs, even if they are active in vitro, fail to pass the in vivo tests, which emphasizes the needto extend our knowledge on the processes occurring inside bacterial cells.
The above mentioned experimental studies on the A-site mutations revealed the correla-tion between specific base substitutions and effectiveness of different aminoglycosides.45–47
However, these studies could not explain the underlying physical and chemical changesthat led to such an effect. Thus, the question can be posed: how does a change in only onebase substantially alter the susceptibility profile of a bacterium? Using molecular modelingof the mutated 16S rRNA A-site fragments and their dynamics, we searched for changesthat could explain this phenomenon.
�www.who.int/world-health-day/2011/en/index.html

30 INTRODUCTION
Furthermore, while there have been extensive studies of aminoglycoside modifyingenzymes in terms of kinetics and the thermodynamics of the chemical reactions they cat-alyze,14, 55 the general lack of structural data for AMEs coupled with their diversity, makescomputational studies of these enzymes difficult. This structural, functional and sequence-related diversity of AMEs is in stark contrast to their narrow specificity towards the amino-glycosides, which are a homologous group of antibiotics. This contradiction was the driv-ing force of the second part of the research presented here, which compares representativeAMEs according to the way they interact with aminoglycosides and seeks to identify simi-larities within their binding site features.
1.4 Research aims and tools
The main aim of the thesis is to compare and contrast physical features of the dif-ferent aminoglycoside binding sites to shed light onto aminoglycoside resistance mech-anisms at an atomic level. We have used a biophysical technique called molecular dynam-ics (MD) to investigate the dynamics of aminoglycosides and their complexes with theirpharmacologically-relevant primary binding site, 16S rRNA A-site model, and AME repre-sentatives: AAC(60)-Ib, APH(30,500)-IIIa and ANT(40)-I.
The all-atom simulation of the prokaryotic A-site model enabled us to study the internalmovements of this rRNA binding site, and specifically the bases that are responsible for thefidelity of translation and aminoglycoside binding. Next, we conducted simulations of theA-site model with specific nucleotide mutations, to look for changes in the physicochemi-cal properties that these mutations introduce. The simulations of the bare mutated A-sitemodels were complemented with the simulations of their complexes with aminoglycosides.Thus, our computational analysis could be compared with the experiments that providedata on bacterial resistance due to A-site mutations. Finally, we studied the dynamics of theAME representatives and compared the interactions formed with aminoglycosides in thesedifferent enzymes. Moreover, we related these interactions to those found in the rRNAbinding site.
We used the MD simulations to characterize the dynamics of the selected biomole-cules that bind aminoglycosides. There are many ways of analyzing MD simulations, andsometimes different tools must be used to examine proteins and nucleic acids. We haveinvestigated different physical and chemical properties of the simulated systems: hydro-gen bonding networks, residue fluctuations, patterns of internal motions, density of water,shape of binding pockets and energetics of aminoglycoside binding. MD simulations werecomplemented with other biophysical techniques such as the Poisson-Boltzmann model toinvestigate the electrostatics of the systems, principal component analysis (PCA) to iden-tify differences in biomolecular conformations, and molecular mechanics (MM) generalizedBorn (GB) solvent accessible (SA) approximation of the binding free energies of the com-plexes. In addition, we developed a new method that identifies dynamic domains based ona set of molecular conformations and helps describe the conformational changes occurringin biomolecules.

Chapter 2
Methodology
We studied the dynamics of aminoglycosides and selected biomolecules that bind theminside a bacterial cell. Moreover, we investigated and compared the interactions that wereformed in the complexes of these different biomolecules with aminoglycosides. This aimrequired use of a variety of computational tools. We employed MD simulations to studythe internal motions of the molecules, but we also analyzed static X-ray structures withthe use of Poisson-Boltzmann continuum electrostatic theory. The parameterization of theaminoglycoside molecules required application of quantum calculations. We used severalmethods to analyze the output of MD simulations — some were already implemented inthe available software and for some types of analyses we prepared our own scripts. Inaddition, we also developed a new algorithm and software to study the internal motionsof biomolecules based on their conformations. This chapter presents the theory behind ourresearch. The software we used is listed in the next chapter, section 3.4 Data analysis, and thenewly developed software is described in Chapter 4, section 4.1 New method for identifyingsimilarly moving atoms in molecular conformation sets.
2.1 Quantum calculations of electrostatic potential
In order to create an atomic model of a biomolecule, first one needs a set of coordinatesfor each atom. Typically, this is provided by experiments, X-ray analysis of crystallized bio-molecules or nuclear magnetic resonance (NMR) studies in solid-state or solutions.103 TheProtein Data Bank (PDB)104 stores the results of these experiments and provides a uniformdescription of biomolecular conformations.
The atomic positions are not enough, though, if one wants to study how the atomsinteract with each other. Here comes in physics. The proper, quantum mechanical (QM)approach requires taking into consideration interactions between each pair of the subatomicparticles in each atom, which is enclosed in the Schrödinger’s equation (Chapter 2 in Ref.105):
H(~R;~r) = E(~R;~r) ; (2.1)
where H denotes the full Hamiltonian of the studied system (i.e., the operator combiningpotential and kinetic energies); (~R;~r) is the wave function, dependent on positions of the
nuclei (~R) and of the electrons (~r); and E is the total energy of the system.Solving the Schrödinger’s equation is, however, infeasible even for a powerful com-
puter for any biologically relevant biomolecule, which contains several tens or hundreds ofatoms. However, one can notice that a nucleus of an atom moves much more slowly thanelectrons, due to its larger mass. Thus, when considering nuclei as static particles, only
31
32 METHODOLOGY
electron wave functions need to be calculated — this forms the Born-Oppenheimer approx-imation (see e.g., Chapter 6 in Ref.105 or Chapter 9 and 10 in Ref.106):
Hel(~r;~R)
el(~r;~R)
= Eelel(~r;~R)
; (2.2)
which describes the movement of electrons (~r) for a given static configuration of nuclei (~R).This assumption is valid only for atoms in their electronic ground state. The wave func-tion for an electron (el) is dependent on the coordinates and spin value. The part that iscontrolled by the coordinates is called the atomic orbital (AO).
Having described one atom, a problem appears when one wants to describe a molecule,i.e., a set of atoms that are connected in a precisely defined way through chemical bonds.An approach used here is called the molecular orbital theory (MO; e.g., Chapter 8 in Ref.105
or Ref.107), where the electrons originating from each atom are spread and mixed withinthe molecule, so that each of them contributes to each bond. This enables to ignore therelativistic effects and to present the wave function of a molecule as a linear combination ofthe wave functions of its atoms (LCAO, linear combination of atomic orbitals):
mol =∑a
ca a ; (2.3)
where index a traverses all atomic orbitals within the molecule; and ca are numerical coef-ficients.
Thus, to describe a molecule, the coefficients ca have to be found. This is obtainedthrough the self-consistent field method (e.g., Chapter 8 in Ref.105 or Ref.107), where aninitial guess is successively corrected until another iteration does not change the total en-ergy of the molecule. In this method, for the description of the atomic orbitals, one usesbase functions, commonly Gaussian-type functions. The standard basis sets are built fromlinear combinations of Gaussian-type orbitals (GTO). For example, the basis 6–31G* 108 de-scribes the orbital closest to the nucleus, with a linear combination of six GTOs (6-31G*);next, the other electrons are described by two combinations of three and one GTO, respec-tively (6–31G*); additionally, the asterisk (6–31G*) denotes that more accurate calculationsare provided for heavy atoms, where higher orbitals are included through the so-called po-larization functions.109 The mentioned basis set has been demonstrated to perform excellentfor aqueous solutions of biomolecules.110
Having found mol, one can calculate the total energy, Emol, from Equation 2.2, andthen the electrostatic potential (ESP, �) around a molecule:
Emol = �grad � : (2.4)
The obtained ESP can then be used for assigning partial charges to each modeled atomthat best reflect the QM-derived ESP. First, the guessed charges are used to calculate the ESP,which is then fitted, through the least-square fitting procedure, on the correct QM ESP. Thismethod is called restrained electrostatic potential method (RESP).110 Sometimes a simplermethod is used, where charges are assigned to atoms based on precalculated values storedin database. The charges are chosen to match the atom and bond type. One of the best mod-els is called AM1-BCC,111, 112 which gives charges comparable to those obtained throughquantum calculations on the 6–31G* basis set.113, 114
Molecular mechanics and force field 33
2.2 Molecular mechanics and force �eld
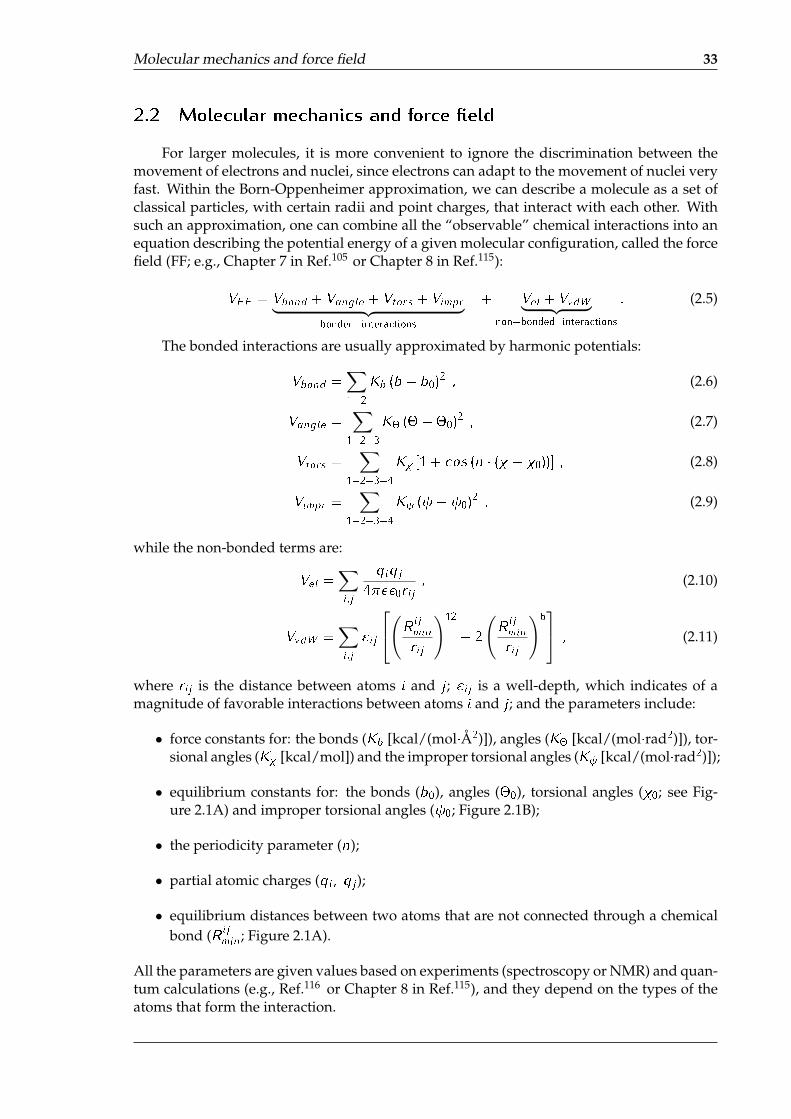
For larger molecules, it is more convenient to ignore the discrimination between themovement of electrons and nuclei, since electrons can adapt to the movement of nuclei veryfast. Within the Born-Oppenheimer approximation, we can describe a molecule as a set ofclassical particles, with certain radii and point charges, that interact with each other. Withsuch an approximation, one can combine all the “observable” chemical interactions into anequation describing the potential energy of a given molecular configuration, called the forcefield (FF; e.g., Chapter 7 in Ref.105 or Chapter 8 in Ref.115):
VFF = Vbond + Vangle + Vtors + Vimpr︸ ︷︷ ︸bonded interactions
+ Vel + VvdW︸ ︷︷ ︸non�bonded interactions
: (2.5)
The bonded interactions are usually approximated by harmonic potentials:
Vbond =∑1�2
Kb (b� b0)2 ; (2.6)
Vangle =∑
1�2�3
K� (���0)2 ; (2.7)
Vtors =∑
1�2�3�4
K� [1 + cos (n � (� � �0))] ; (2.8)
Vimpr =∑
1�2�3�4
K ( � 0)2 ; (2.9)
while the non-bonded terms are:
Vel =∑i;j
qiqj
4���0rij; (2.10)
VvdW =∑i;j
"ij
(R ijminrij
)12
� 2
(Rijmin
rij
)6 ; (2.11)
where rij is the distance between atoms i and j ; "ij is a well-depth, which indicates of amagnitude of favorable interactions between atoms i and j ; and the parameters include:
• force constants for: the bonds (Kb [kcal/(mol�Å2)]), angles (K� [kcal/(mol�rad2)]), tor-sional angles (K� [kcal/mol]) and the improper torsional angles (K [kcal/(mol�rad2)]);
• equilibrium constants for: the bonds (b0), angles (�0), torsional angles (�0; see Fig-ure 2.1A) and improper torsional angles ( 0; Figure 2.1B);
• the periodicity parameter (n);
• partial atomic charges (qi; qj );
• equilibrium distances between two atoms that are not connected through a chemicalbond (R ijmin; Figure 2.1A).
All the parameters are given values based on experiments (spectroscopy or NMR) and quan-tum calculations (e.g., Ref.116 or Chapter 8 in Ref.115), and they depend on the types of theatoms that form the interaction.

34 METHODOLOGY
Figure 2.1: Illustration of the force field components. See the text for description.
2.2.1 Energy minimization
The potential energy of a molecule depends on its conformation, i.e., the positions ofall atoms. As has been mentioned, these initial positions used in simulations are typicallyobtained from experiments. However, the X-ray derived structures lack coordinates forhydrogen atoms, and therefore these have to be added in silico. Moreover, usually one addsalso water and ions, to reproduce the natural environment of a molecule. This addition canresult in some atoms being too close to each other. Therefore, a minimization of energy isconducted prior to any other calculations. During the minimization, the atoms are beingslightly repositioned so as to reach the minimal potential energy of the whole system.
There are several algorithms for finding this minimum — in our simulations, two ofthem were used, namely the steepest descent (SD) and conjugate gradients (CG) algorithms.These fall into the category of linear descent search algorithms (see Chapter 10 in Ref.115),for which a general scheme is outlined below.
General linear descent search algorithm:
1. at a given point ~xi of the potential energy surface (PES) calculate the energy E(~xi) andits gradient ~gi = grad E(~xi);
2. create a search vector ~si (dependent on the type of algorithm);
3. move on PES along ~s:~xi+1 = ~xi + �i~si ; (2.12)
4. calculate the new energy E(~xi+1) and the energy difference: �E = E(~xi+1)� E(~xi);
5. repeat the above steps until �E < ".
In the above scheme, both �i and " are very small but non-zero real numbers. In orderto obtain the best �i value, the line-search algorithm is used. Using Equation 2.12, threedifferent movements (for three different �i values) along ~si are generated, and the energy inthese new points is calculated. Then, a polynomial is fitted to this set of points E(�i). Theminimum of this polynomial gives the best �i parameter for a given step.
SD and CG algorithms differ only in the definition of the search vector ~s. In SD it isbased only on the current point in PES: ~s SDi = �~gi= j~gij; while the CG version depends onthe previously chosen search vector and the current gradient: ~s CGi = �~gi= j~gij + �i ~s
CGi�1 ,
where �i is a constant dependent on the current and/or previous gradient vector, and it isspecific to each implementation of the CG algorithm.115

Molecular dynamics 35
The SD algorithm performs better when the search for the minimum is in the initialstage, but when being already close to the minimum, this approach can result even in step-ping over the minimum and continuing to the other slope of PES. This is undesirable, andtherefore, commonly, the minimization is started with SD and continued with CG, becausethe latter algorithm performs better near the minima.117
2.3 Molecular dynamics
2.3.1 Theory behind
With such a representation of the biomolecule and the interactions between its atoms,one can now proceed to calculate the forces:
~F = �grad(V(~x)
); (2.13)
which would lead to movement, according to the Newton’s equation:
~F = m � �~x : (2.14)
The analytical solution of the above equation, however, includes integrals, which are diffi-cult to implement in a computer, thus several approximate algorithms have been developed.The positions in consequent time steps, ~x(t��t) and ~x(t+�t), are expressed through Taylorapproximations truncated to the forth order terms (e.g., Ref.118 or Chapter 7 in Ref.105):
~x(t + �t)Taylor= ~x(t) + �t ~v (t) +
1
2�t2 ~a(t) +
1
6�t3 +O(�t4) ;
~x(t � �t)Taylor= ~x(t)� �t ~v (t) +
1
2�t2 ~a(t)�
1
6�t3 +O(�t4) :
Addition and subtraction of the above equations yields, respectively:
~x(t + �t) = 2~x(t)� ~x(t � �t) + ~a(t) �t2 +O(�t4) ;
~v (t) =~x(t + �t)� ~x(t � �t)
2�t+O(�t2) ;
where ~x, ~v � _~x are the position and velocity of an atom; �t is the timestep; and ~a � �~xdenotes acceleration, which can be obtained from Equation 2.14. This forms the so-calledVerlet algorithm,118 which is very efficient and gives accurate positions of atoms (O(�t4)).However, one of the disadvantages of the Verlet algorithm is that the velocities are com-puted with relatively large errors (O(�t2)), and therefore sometimes another approach isused, called leap-frog,118 which provides better estimation of the velocities. In the leap-frogalgorithm, an additional mid-point of the timestep is created to facilitate the evaluation ofthe mutually dependent positions and velocities:
~x(t + �t) = ~x(t) + ~v (t + 1=2�t) �t ;
~v (t + 1=2�t) = ~v (t � 1=2�t) + ~a(t) �t:
As mentioned previously, the initial positions are given, but the initial velocities have tobe somehow assigned. Most often, these are randomized values from the standard Maxwellianvelocity distribution, which are generated based on a number created from the current dateand time, in order to minimize the probability of repetition.118 The sequence of atomic posi-tions, velocities, and accelerations yields an MD trajectory.
36 METHODOLOGY
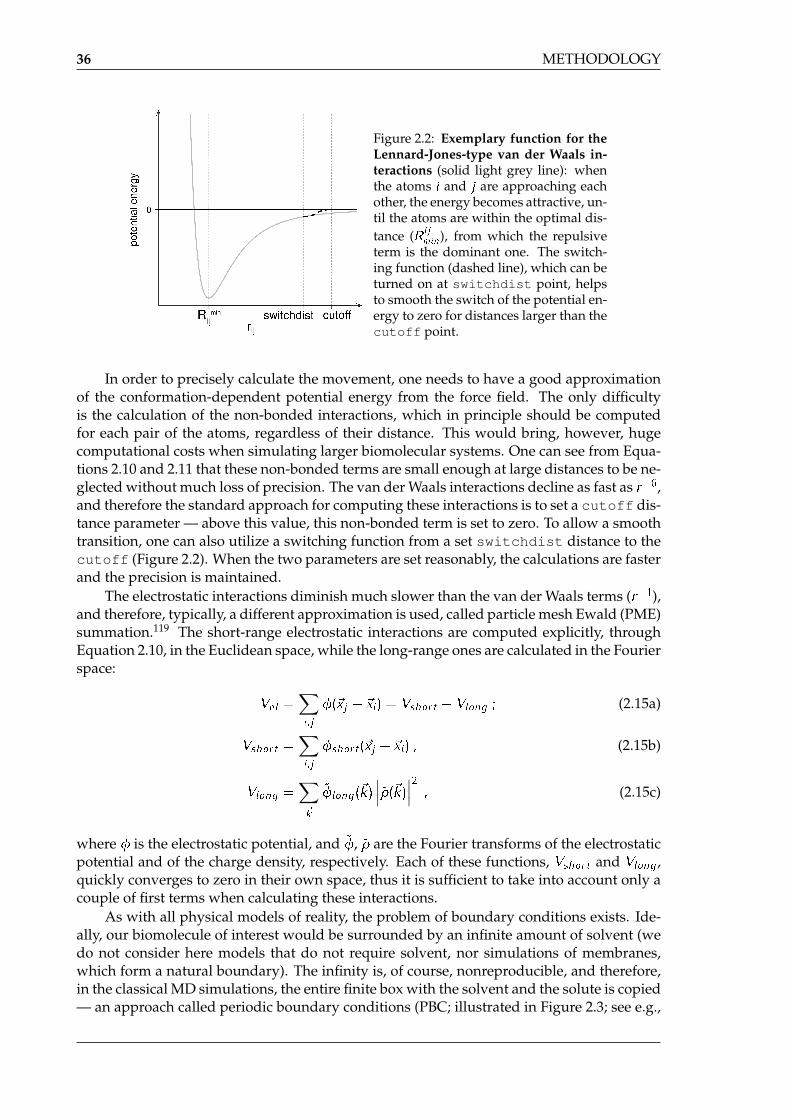
Figure 2.2: Exemplary function for theLennard-Jones-type van der Waals in-teractions (solid light grey line): whenthe atoms i and j are approaching eachother, the energy becomes attractive, un-til the atoms are within the optimal dis-tance (R ij
min), from which the repulsiveterm is the dominant one. The switch-ing function (dashed line), which can beturned on at switchdist point, helpsto smooth the switch of the potential en-ergy to zero for distances larger than thecutoff point.
In order to precisely calculate the movement, one needs to have a good approximationof the conformation-dependent potential energy from the force field. The only difficultyis the calculation of the non-bonded interactions, which in principle should be computedfor each pair of the atoms, regardless of their distance. This would bring, however, hugecomputational costs when simulating larger biomolecular systems. One can see from Equa-tions 2.10 and 2.11 that these non-bonded terms are small enough at large distances to be ne-glected without much loss of precision. The van der Waals interactions decline as fast as r�6,and therefore the standard approach for computing these interactions is to set a cutoff dis-tance parameter — above this value, this non-bonded term is set to zero. To allow a smoothtransition, one can also utilize a switching function from a set switchdist distance to thecutoff (Figure 2.2). When the two parameters are set reasonably, the calculations are fasterand the precision is maintained.
The electrostatic interactions diminish much slower than the van der Waals terms (r�1),and therefore, typically, a different approximation is used, called particle mesh Ewald (PME)summation.119 The short-range electrostatic interactions are computed explicitly, throughEquation 2.10, in the Euclidean space, while the long-range ones are calculated in the Fourierspace:
Vel =∑i;j
�(~xj � ~xi) = Vshort � Vlong ; (2.15a)
Vshort =∑i;j
�short(~xj � ~xi) ; (2.15b)
Vlong =∑~k
~�long(~k)∣∣∣~�(~k)∣∣∣2 ; (2.15c)
where � is the electrostatic potential, and ~�, ~� are the Fourier transforms of the electrostaticpotential and of the charge density, respectively. Each of these functions, Vshort and Vlong,quickly converges to zero in their own space, thus it is sufficient to take into account only acouple of first terms when calculating these interactions.
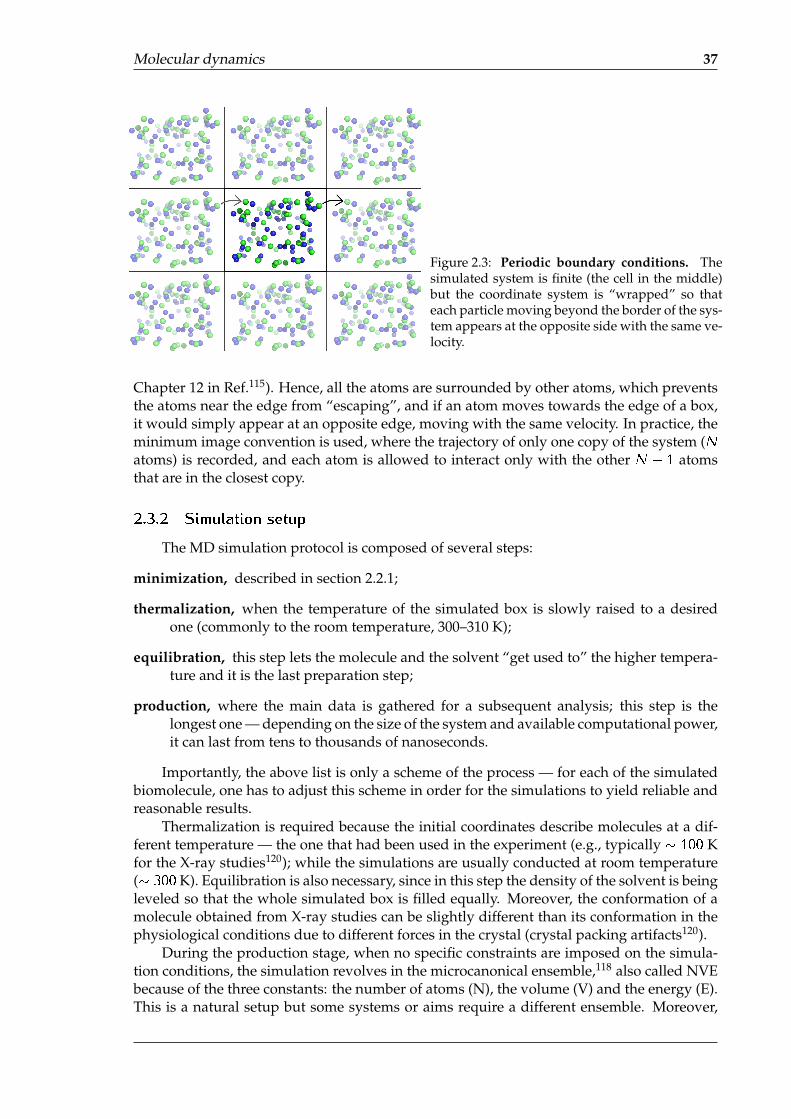
As with all physical models of reality, the problem of boundary conditions exists. Ide-ally, our biomolecule of interest would be surrounded by an infinite amount of solvent (wedo not consider here models that do not require solvent, nor simulations of membranes,which form a natural boundary). The infinity is, of course, nonreproducible, and therefore,in the classical MD simulations, the entire finite box with the solvent and the solute is copied— an approach called periodic boundary conditions (PBC; illustrated in Figure 2.3; see e.g.,
Molecular dynamics 37
Figure 2.3: Periodic boundary conditions. Thesimulated system is finite (the cell in the middle)but the coordinate system is “wrapped” so thateach particle moving beyond the border of the sys-tem appears at the opposite side with the same ve-locity.
Chapter 12 in Ref.115). Hence, all the atoms are surrounded by other atoms, which preventsthe atoms near the edge from “escaping”, and if an atom moves towards the edge of a box,it would simply appear at an opposite edge, moving with the same velocity. In practice, theminimum image convention is used, where the trajectory of only one copy of the system (Natoms) is recorded, and each atom is allowed to interact only with the other N � 1 atomsthat are in the closest copy.
2.3.2 Simulation setup
The MD simulation protocol is composed of several steps:
minimization, described in section 2.2.1;
thermalization, when the temperature of the simulated box is slowly raised to a desiredone (commonly to the room temperature, 300–310 K);
equilibration, this step lets the molecule and the solvent “get used to” the higher tempera-ture and it is the last preparation step;
production, where the main data is gathered for a subsequent analysis; this step is thelongest one — depending on the size of the system and available computational power,it can last from tens to thousands of nanoseconds.
Importantly, the above list is only a scheme of the process — for each of the simulatedbiomolecule, one has to adjust this scheme in order for the simulations to yield reliable andreasonable results.
Thermalization is required because the initial coordinates describe molecules at a dif-ferent temperature — the one that had been used in the experiment (e.g., typically � 100 Kfor the X-ray studies120); while the simulations are usually conducted at room temperature(� 300 K). Equilibration is also necessary, since in this step the density of the solvent is beingleveled so that the whole simulated box is filled equally. Moreover, the conformation of amolecule obtained from X-ray studies can be slightly different than its conformation in thephysiological conditions due to different forces in the crystal (crystal packing artifacts120).
During the production stage, when no specific constraints are imposed on the simula-tion conditions, the simulation revolves in the microcanonical ensemble,118 also called NVEbecause of the three constants: the number of atoms (N), the volume (V) and the energy (E).This is a natural setup but some systems or aims require a different ensemble. Moreover,
38 METHODOLOGY
the numerical errors and implementation issues may result in a rise of temperature and/orenergy if the simulation parameters were not adjusted to a given system. In this research,the NVE ensemble was used for relatively short simulations of compact proteins. The elon-gated RNA fragment was, however, simulated in the NPT ensemble. Because of its higherflexibility and being a fragment of a much bigger construct, it was more natural to apply theconstant pressure (P) and temperature (T) in this system. A simulation in the NPT ensembleis also termed Langevin dynamics (see Chapter 13 in Ref.115 or Ref.121), due to the Langevinequation used to describe the forces:
m � �~x(t) = ��V(~x(t)) � m _~x(t) + ~Fr(t) ; (2.16)
where is the collision parameter [1=s], which defines the friction; and ~Fr(t) denotes anadditional random force that is generated from a Gaussian distribution:⟨
~Fr(t)⟩= 0 ; (2.17a)⟨
~Fr(t)~Fr(t = 0)⟩= 2kBT0 m �(t) ; (2.17b)
where kB is the Boltzmann constant and �(t) is the Dirac delta function. These stochasticadditional forces mimic collisions between the solute and solvent molecules, which, as canbe seen in Equation 2.17b, provides a coupling to a heat bath with a set temperature of T0.
The timestep in the simulations has to be large enough to obtain long trajectories thatwould allow to observe biologically relevant motions, but short enough to reproduce allthe interactions correctly. Therefore, the optimal step is connected to the most vibratingbonds, i.e., bonds with hydrogen atoms. These are movements lasting approximately 10 fs(frequencies of around 3000 1=cm 122). Therefore, usually the timestep is set to a one orderhigher value of 1 fs. This can be extended to 2 fs when putting harmonic restraints on thesebonds formed with hydrogen atoms, as it is e.g., in the SHAKE algorithm.123
2.4 Basic molecular dynamics data analysis
MD simulations produce nowadays a lot of data that has to be carefully analyzed. Themost basic quantities are the temperature and the energy of the simulated system. In theclassical MD these values should stay leveled in the production phase; therefore, the firstcheck of the stability of the simulation is to visualize the time dependence of these values.The energy and temperature would naturally rise during the thermalization and equilibra-tion but should hit a plateau in the production stage.
However, the most important data obtained from MD simulations are the positions ofatoms versus time. These constitute sometimes even hundreds of thousands of conforma-tions of a studied molecule or complex. There are many ways one can analyze these data,depending on what the aim of the research is and what types of approximations were usedin the model. However, the first and basic analysis is to observe whether the molecule isinternally stable. Unless one performs a simulation of folding or unfolding, the global con-formation of the structure should be maintained if the simulation was prepared correctly.The standard procedure is to calculate the global root-mean-square deviation (RMSD) ofatomic positions from the reference structure, which is commonly the starting one.
RMSD(t) =
√√√√ 1
M
n∑i=1
mi j~xi(t)� ~xi(0)j2 ; (2.18)
Describing internal motions 39
where M = �ni=1mi; mi denotes the mass of atom i; n is the total number of atoms in themolecule; ~xi(t) shows the position of atom i in timestep t; and ~xi(0) points to the startingposition of atom i.
Another measure of compactness of the structure is the radius of gyration, Rgyr:
Rgyr(t) =
√M∣∣~xi(t)� ~xCOM(t)
∣∣2M
; (2.19)
where ~xCOM(t) is the position of center of mass (COM) at timestep t. This gives a roughestimate of the size of the sphere that would contain the given structure, and therefore, thebigger the radius, the less compact the conformation.
Naturally, in the initial stages of the simulation, i.e., minimization, thermalization andequilibration, RMSD and Rgyr should rise because the structure changes along with changesin the surrounding environment (raising temperature, interactions with added solvent orion molecules, etc.). However, in the production stage these values should rather oscillatearound a certain mean value, which indicates that the molecule maintains its native, foldedstate.
There might be, however, differences in the mobility of various fragments of a biomole-cule. Another standard measure, root-mean-square fluctuations (RMSF), shows how mucheach of the atoms or residues (i.e., amino acid or nucleotide) moves in the simulation, withregard to its average position:
RMSF(i) =
√√√√ 1
T
T∑t=1
j~xi(t)� h~xiij2 ; (2.20)
where i enumerates the residues or atoms; T is the total simulation time; and h~xii denotesthe mean position of atom i. These values can be compared with the experimental �-factors(temperature factors [Å2]), which are parameters used by crystallographers to refine thestructure (e.g., Chapter 7 in Ref.120). A �-factor tells us how much the atom in the crystalfluctuates isotropically around its position in the model — if that value is large (more than50 Å2), the position of the atom in the model is not well defined, and therefore, one canexpect high mobility of this atom in the MD simulation.
2.5 Describing internal motions
The measures described above, although quite crude, can indicate a biologically signif-icant event, e.g., a conformation change or large differences in mobility between biomolec-ular fragments. The identified event often must be more thoroughly examined using somemore advanced tools.
2.5.1 Principal Component Analysis
The raw data from an MD simulation constitute of fluctuating atoms, which can appearchaotic and difficult to quantify. A well known physical method can help to emphasizethe main directions of internal collective molecular motions. Principal component analysis(PCA) reduces the dimensionality of the movements and finds their main modes.124 This isdone by, first, calculating the covariance matrix, C :
Cij =⟨M
1
2
ii
(xi � hxii
)M
1
2
jj
(xj � hxji
)⟩; (2.21)
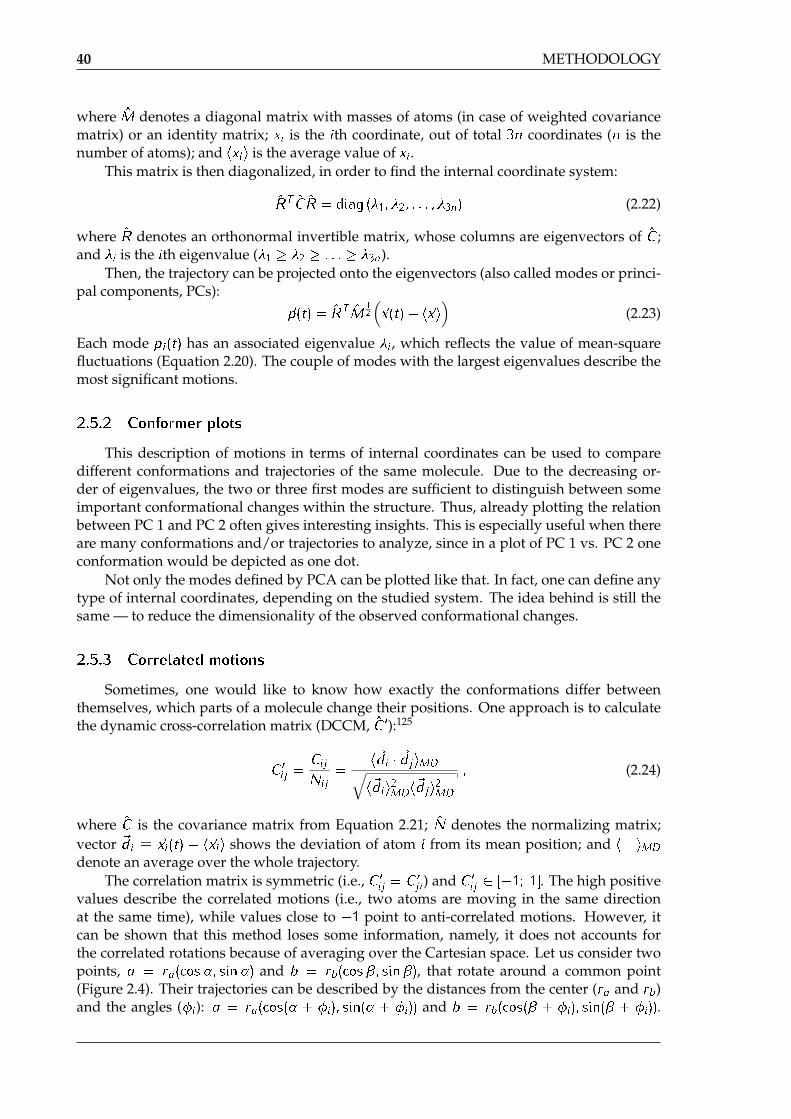
40 METHODOLOGY
where M denotes a diagonal matrix with masses of atoms (in case of weighted covariancematrix) or an identity matrix; xi is the ith coordinate, out of total 3n coordinates (n is thenumber of atoms); and hxii is the average value of xi.
This matrix is then diagonalized, in order to find the internal coordinate system:
RT C R = diag (�1; �2; : : : ; �3n) (2.22)
where R denotes an orthonormal invertible matrix, whose columns are eigenvectors of C ;and �i is the ith eigenvalue (�1 � �2 � : : : � �3n).
Then, the trajectory can be projected onto the eigenvectors (also called modes or princi-pal components, PCs):
~p(t) = RT M1
2
(~x(t)� h~xi
)(2.23)
Each mode pi(t) has an associated eigenvalue �i, which reflects the value of mean-squarefluctuations (Equation 2.20). The couple of modes with the largest eigenvalues describe themost significant motions.
2.5.2 Conformer plots
This description of motions in terms of internal coordinates can be used to comparedifferent conformations and trajectories of the same molecule. Due to the decreasing or-der of eigenvalues, the two or three first modes are sufficient to distinguish between someimportant conformational changes within the structure. Thus, already plotting the relationbetween PC 1 and PC 2 often gives interesting insights. This is especially useful when thereare many conformations and/or trajectories to analyze, since in a plot of PC 1 vs. PC 2 oneconformation would be depicted as one dot.
Not only the modes defined by PCA can be plotted like that. In fact, one can define anytype of internal coordinates, depending on the studied system. The idea behind is still thesame — to reduce the dimensionality of the observed conformational changes.
2.5.3 Correlated motions
Sometimes, one would like to know how exactly the conformations differ betweenthemselves, which parts of a molecule change their positions. One approach is to calculatethe dynamic cross-correlation matrix (DCCM, C 0):125
C 0ij =
Cij
Nij=
h~di � ~djiMD√h~dii
2MDh
~dji2MD
; (2.24)
where C is the covariance matrix from Equation 2.21; N denotes the normalizing matrix;vector ~di � ~xi(t) � h~xii shows the deviation of atom i from its mean position; and h iMDdenote an average over the whole trajectory.
The correlation matrix is symmetric (i.e., C 0ij = C 0
ji) and C 0ij 2 [�1; 1]. The high positive
values describe the correlated motions (i.e., two atoms are moving in the same directionat the same time), while values close to �1 point to anti-correlated motions. However, itcan be shown that this method loses some information, namely, it does not accounts forthe correlated rotations because of averaging over the Cartesian space. Let us consider twopoints, a = ra(cos�; sin�) and b = rb(cos�; sin�), that rotate around a common point(Figure 2.4). Their trajectories can be described by the distances from the center (ra and rb)and the angles (�i): a = ra(cos(� + �i); sin(� + �i)) and b = rb(cos(� + �i); sin(� + �i)).
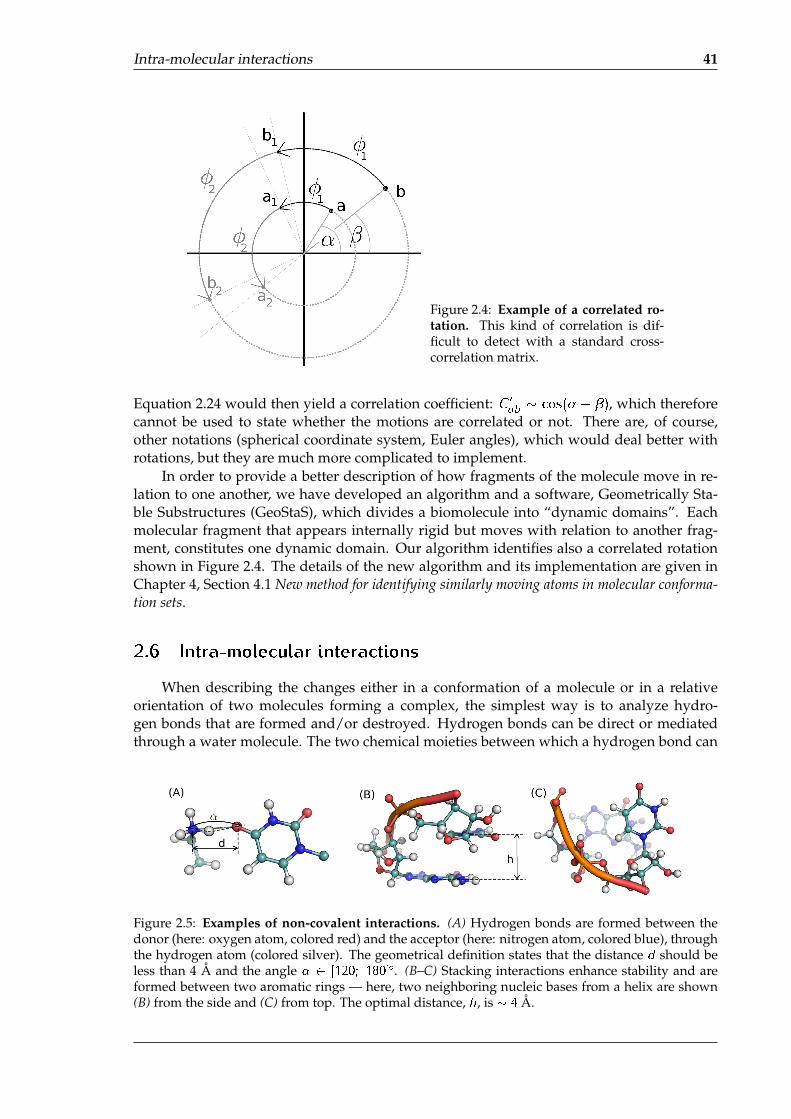
Intra-molecular interactions 41
Figure 2.4: Example of a correlated ro-tation. This kind of correlation is dif-ficult to detect with a standard cross-correlation matrix.
Equation 2.24 would then yield a correlation coefficient: C 0ab � cos(� � �), which therefore
cannot be used to state whether the motions are correlated or not. There are, of course,other notations (spherical coordinate system, Euler angles), which would deal better withrotations, but they are much more complicated to implement.
In order to provide a better description of how fragments of the molecule move in re-lation to one another, we have developed an algorithm and a software, Geometrically Sta-ble Substructures (GeoStaS), which divides a biomolecule into “dynamic domains”. Eachmolecular fragment that appears internally rigid but moves with relation to another frag-ment, constitutes one dynamic domain. Our algorithm identifies also a correlated rotationshown in Figure 2.4. The details of the new algorithm and its implementation are given inChapter 4, Section 4.1 New method for identifying similarly moving atoms in molecular conforma-tion sets.
2.6 Intra-molecular interactions
When describing the changes either in a conformation of a molecule or in a relativeorientation of two molecules forming a complex, the simplest way is to analyze hydro-gen bonds that are formed and/or destroyed. Hydrogen bonds can be direct or mediatedthrough a water molecule. The two chemical moieties between which a hydrogen bond can
Figure 2.5: Examples of non-covalent interactions. (A) Hydrogen bonds are formed between thedonor (here: oxygen atom, colored red) and the acceptor (here: nitrogen atom, colored blue), throughthe hydrogen atom (colored silver). The geometrical definition states that the distance d should beless than 4 Å and the angle � 2 [120; 180]�. (B–C) Stacking interactions enhance stability and areformed between two aromatic rings — here, two neighboring nucleic bases from a helix are shown(B) from the side and (C) from top. The optimal distance, h, is � 4 Å.

42 METHODOLOGY
be formed are called a donor and an acceptor (Figure 2.5A). The donor has at least one freeelectron pair, while the acceptor has to be able to “accept” an electron, i.e., is covalentlybonded to a hydrogen atom. The formal definition of a hydrogen bond126 is based on adistance between the donor and the acceptor and an angle between the three bond-formingatoms. The closer the angle is to 180�, the stronger the hydrogen bond. While the distancevaries depending on the atom type of the donor and acceptor, it is typically less than 4 Å.Thus, monitoring the distance and angle between possible donor–acceptor pairs is a simpleway of quantifying hydrogen bond networks during an MD simulation.
Another important non-bonding interaction type is stacking (Figure 2.5B–C), formedbetween two parallel aromatic rings. In an aromatic ring, the so-called delocalized elec-trons from � orbitals form an electron cloud over and under the ring. The two clouds fromtwo rings interact with each other through the stabilizing London dispersion forces and re-pulsive interactions between multipoles. Stacking is very important especially in nucleicacid structures, where the stacked nucleic bases stabilize e.g., the double helix (Chapter 8 inRef.127). In most of the force fields, this effect can be reproduced through the van der Waalsinteractions. The geometrical definition of the stacking is based on the distance between thetwo rings, which should stay around 4 Å.128 The van der Waals attractive force diminishesquite fast for larger distance, and it becomes very quickly repulsive when atoms are closer(see Equation 2.11). When trying to find stacking interactions in a simulated molecule, notonly the distance has to be taken into account — one has to check whether the rings are ina parallel orientation. This can be done by constructing vectors (~a and ~b) perpendicular tothe planes of the rings (A and B) and calculating a cosine of an angle between them:
AjjB , cos(](~a; ~b)
)� f1;�1g ; (2.25)
~a?A ; ~b?B :
2.7 Electrostatic description
2.7.1 Poisson-Boltzmann model
One of the very basic features of a molecule is its electrostatic potential (ESP). To calcu-late the ESP for large biomolecules, such as proteins or nucleic acids, one often uses contin-uum electrostatics theory. This theory is based on the nonlinear Poisson-Boltzmann equation(PB):129, 130
r � [�(~x)r�(~x)] = �4� �solute(~x)� 4�
ni∑i=1
qici exp
(�qi�(~x)
kBT
); (2.26)
where r is a divergence operator; �(~x) describes the position-dependent dielectric func-tion; �(~x) is the ESP at position ~x; �solute(~x) denotes the charge density of the solute andthe Boltzmann distribution �total(~x) =
∑ni
i=1 qici exp (�qi�(~x)=kBT ) is used to describe thesolvent charge density, coming from ions (ni is the number of all ion types, each with chargeof qi); ci denotes the concentration of ions of type i; kB is the Boltzmann constant.
Solving Equation 2.26 gives us �(~x), but the analytical solution is not possible for arbi-trary shaped objects such as biomolecules. Therefore, several methods have been developedto obtain the numerical solutions of PB equation, including the finite-difference or boundaryelement methods.129, 131 Sometimes, the full PB equation can be approximated by its linearversion, which is obtained when the exponent in the charge distribution in Equation 2.26is approximated by a Taylor series truncated to the first-order term exp (�qi�(~x)=kBT ) �

Assessment of the binding free energy 43
1 � qi�(~x)=kBT . This holds when the energies are much smaller than the thermal energy,qi�(~x)� kBT , which can be assumed for dilute solutions or monovalent electrolytes. Then,the electrostatic energy (GPB) of a given biomolecular conformation can be found through a“charging” process:
GPB =1
2
∫�(~x) �(~x) d~x : (2.27)
2.7.2 Generalized Born model
However, even with such an approximation the calculations for hundreds of confor-mations of a biomolecule can be too time- and resource-consuming to conduct. Therefore,one may choose another approximation, where a molecule is built of many non-overlappingspheres with point charges. This enables to represent the electrostatic solvation free energythrough the use of the well-known Born formula for each of the spheres:131
Gi;GB = �
(1�
1
�sol
)q2i2a
; (2.28)
and the total electrostatic energy for the molecule would be:
GGB ' �
(1�
1
�sol
)1
2
∑i;j
qiqj
fGBij; (2.29)
where �sol is the dielectric constant of the solvent; the summation includes all the “atom”pairs in the molecule; and fGBij is a function of the distance between atoms i and j , and of theeffective Born radii of the atoms, Ri. In the GB approximation this effective radius dependsnot only on the radius of atom i but also on radii and positions of other atoms. Therefore,when creating the force field parameters for the molecule, one should include these specificeffective radii in the parameterization. The main issue with the GB method is its applica-bility mainly to spherically symmetric systems, due to the formulation of Equation 2.28.Recently, however, a method has been developed that includes a scaling factor for the Bornradii of the atoms buried beneath the surface of a molecule.132 This approach yields theelectrostatic energies comparable to those obtained with the PB method but is much faster.
2.8 Assessment of the binding free energy
When analyzing a structure of a complex, it is often desired to know how well themolecules fit to each other, which can be measured by their free energy of binding. Thisvalue is especially important when performing calculations associated with the drug designprocess. Sometimes the two compared complexes may behave similarly in a simulation, butthere can be a difference in the binding free energy, which could point to a potentially betterdrug. One of the methods used with biomolecular simulations to estimate the binding freeenergies is MMPBSA or MMGBSA, which is named after the division of the total free en-ergy into terms calculated through Molecular Mechanics, PB (or GB), and solvent accessiblesurface. This method is outlined below.
The binding free energy is naturally defined as a difference between the free energy ofthe complex and its substrates separately, thus first the free energies of the receptor and theligand that form the complex have to be calculated. According to thermodynamics, the totalenergy available in an isolated system (also known as Gibbs free energy, G) is combined of

44 METHODOLOGY
enthalpy (H) and entropy (S) (see e.g., Chapter 8 in Ref.133):
G = H � T � S : (2.30)
The enthalpic part is connected to the internal chemical properties and the energy of inter-action with the solvent, thus it can be assessed by the force field energy value (also calledmolecular mechanics term, VFF ) and the solvation energy (GPBSA or GGBSA):129, 134
H = VFF + GGBSA : (2.31)
The solvation energy is computed through submerging the molecule in an implicit solventmedium, even though the simulations were performed with atomic representation of thewater. That is due to implicit models being less computationally demanding and incor-porating all the features of the discrete model (such as hydrophobicity or a high dielectricenvironment) but averaged. Also, one does not need to worry about boundary conditions,since in the calculations the implicit solvent can be assumed infinite. The solvation energyis thus obtained as follows:129, 134
1. all the molecular charges are zeroed in vacuum;2. the uncharged solute is solvated;3. all charges are restored in the implicit solvent environment.
Therefore, the solvation energy can be dissected into:
GGBSA = GSA �Wvac +Wsol ; (2.32)
where GSA and Gpol = �Wvac +Wsol are the non-polar and polar terms, respectively; Wvac
and Wsol denote the work needed for discharging the molecule in vacuum and re-chargingit in solvent, respectively.
The polar term is calculated as described in Section 2.7 Electrostatic description. The non-polar part above is estimated by the solvent accessible surface area (SASA) of the molecule:GSA = � SASA, where [kcal/(mol�Å2)] is the surface tension.
The entropic part from Equation 2.30 is associated with the level of order in the struc-ture, i.e., how rigid it is. This term is much more difficult to calculate. There are severalapproximations, including the quasi-harmonic approximation135 or based on the normalmode analysis.136 All these methods, however, become unreliable when a big conforma-tional change upon binding is anticipated. This is the case with aminoglycosides, whichhave many rotatable bonds, thus their conformation can be significantly altered when form-ing a complex. In our calculations, after several trials, we decided not to include the entropicterm, and therefore the resulting values serve only as a comparison and cannot be treated asabsolute.
MD simulation provides multiple conformations, and for each of those the free energyvalue can be computed and then averaged (hGi). Then, the final binding free energy isobtained:
�G = hGcomplexi �(hGreceptori+ hGligandi
): (2.33)
Although, generally this type of calculation does not yield absolute values, when comparingthe resulting energy for different complexes their order is the same as for the experiments(e.g., Refs.86, 90). Therefore, the MMPB(GB)SA method is often used for a rough estimation ofthe binding free energy but it is especially valuable in a detailed investigation of the contri-butions of individual residues (see e.g., Refs.137–139). This energy can be easily decomposedinto terms that originate from specific residues. This kind of information is helpful whendesigning modifications of drugs.
Chapter 3
Parameterization and preparation of
the simulated systems
The main aim of this study was to investigate aminoglycoside antibiotics recognitionand to provide insight to the underlying mechanisms of bacterial resistance. MD simula-tions were conducted on a number of systems to study the interactions between amino-glycoside and RNA binding site models, as well as the representative modifying enzymes.Below, the details of the simulation preparation steps are outlined.
3.1 Aminoglycoside binding site in ribosomal RNA
3.1.1 Starting structures
In the cellular environment, aminoglycosides bind to the 30S ribosomal subunit14 (seeFigure 1.3). The entire 30S subunit is a large nucleoprotein complex of about 100 000 atoms30
and all-atom MD simulations of the entire 30S subunit are extremely computational de-manding even at the nanosecond timescale. However, it has been shown that these an-tibiotics also bind to fragments of this subunit, specifically to the models of the A-site.140, 141
Moreover, the thermodynamic features of this binding process are almost the same as for thebinding to the whole 30S subunit.140, 141 One of the A-site models is a symmetrical constructof two aminoglycoside binding sites, thus it can accommodate two drugs (Figure 3.1A),which immediately increases the statistics of observations (we can assume that there is nomutual dependence of these binding sites, since they are divided by eight canonical basepairs).84, 90, 141
We chose the complexes of the model A-site with two aminoglycosides, paromomycin(PAR, PDB ID: 1J7T,142 resolution of 2.5 Å) and kanamycin A (KAN, PDB ID: 2ESI,31 reso-lution of 3.00 Å). These two drugs represent the two classes of aminoglycosides: 4,5- and4,6-disubstituted 2-DOS (see Figure 1.1B–C). The complex of the A-site with kanamycin Awas simulated in order to have a reference for the subsequent simulations of aminoglyco-side modifying enzymes (described below). The complex with PAR was subjected to in silicomutations (presented in Figure 3.1B). We have chosen those mutations that introduced highlevel of resistance, especially against paromomycin, as reported in the experiments on wholebacteria (referenced to and described in Table 3.1). Also the A1408G mutation confers highresistance in bacteria (see Table 1.1). We studied this mutation as a separate project and theresults have been published previously.85 Here, we focus on some other base substitutions.All types of simulations concerning the A-site are listed in Table 3.1.
45
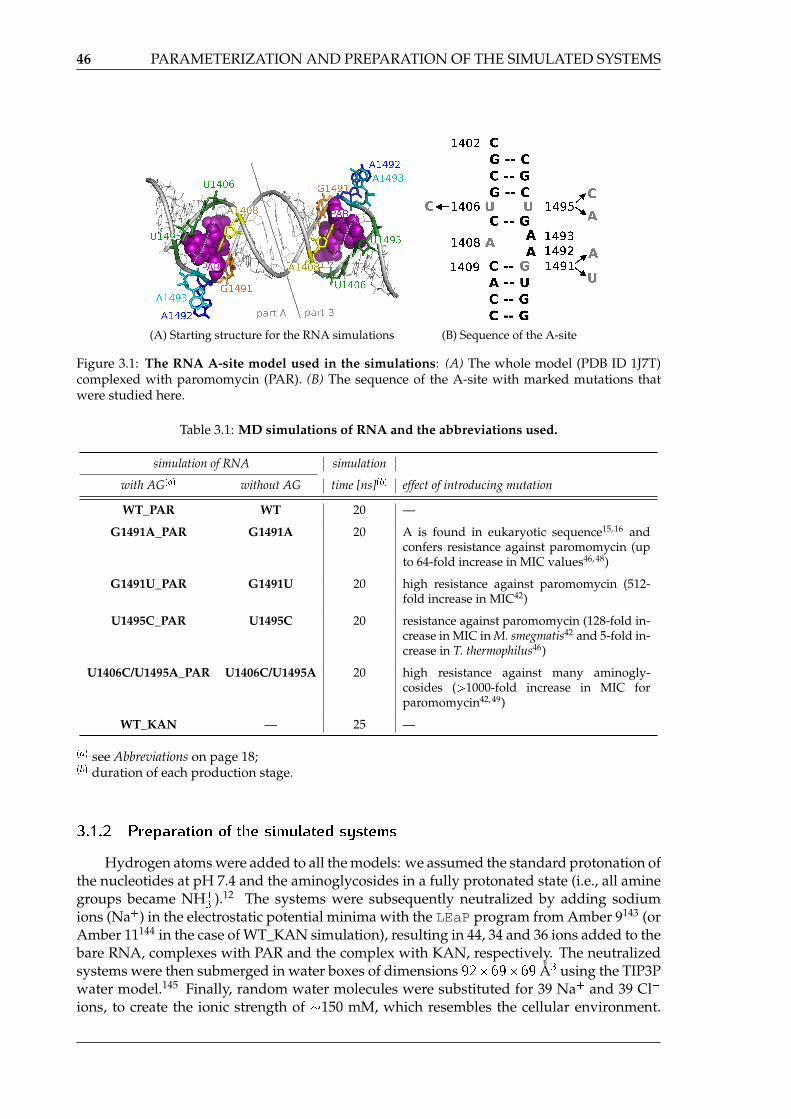
46 PARAMETERIZATION AND PREPARATION OF THE SIMULATED SYSTEMS
(A) Starting structure for the RNA simulations (B) Sequence of the A-site
Figure 3.1: The RNA A-site model used in the simulations: (A) The whole model (PDB ID 1J7T)complexed with paromomycin (PAR). (B) The sequence of the A-site with marked mutations thatwere studied here.
Table 3.1: MD simulations of RNA and the abbreviations used.
simulation of RNA simulation
with AG(a) without AG time [ns](b) effect of introducing mutation
WT_PAR WT 20 —
G1491A_PAR G1491A 20 A is found in eukaryotic sequence15, 16 andconfers resistance against paromomycin (upto 64-fold increase in MIC values46, 48)
G1491U_PAR G1491U 20 high resistance against paromomycin (512-fold increase in MIC42)
U1495C_PAR U1495C 20 resistance against paromomycin (128-fold in-crease in MIC in M. smegmatis42 and 5-fold in-crease in T. thermophilus46)
U1406C/U1495A_PAR U1406C/U1495A 20 high resistance against many aminogly-cosides (>1000-fold increase in MIC forparomomycin42, 49)
WT_KAN — 25 —
(a) see Abbreviations on page 18;(b) duration of each production stage.
3.1.2 Preparation of the simulated systems
Hydrogen atoms were added to all the models: we assumed the standard protonation ofthe nucleotides at pH 7.4 and the aminoglycosides in a fully protonated state (i.e., all aminegroups became NH+
3 ).12 The systems were subsequently neutralized by adding sodiumions (Na+) in the electrostatic potential minima with the LEaP program from Amber 9143 (orAmber 11144 in the case of WT_KAN simulation), resulting in 44, 34 and 36 ions added to thebare RNA, complexes with PAR and the complex with KAN, respectively. The neutralizedsystems were then submerged in water boxes of dimensions 92�69�69 Å3 using the TIP3Pwater model.145 Finally, random water molecules were substituted for 39 Na+ and 39 Cl�
ions, to create the ionic strength of �150 mM, which resembles the cellular environment.
Aminoglycoside binding site in ribosomal RNA 47
In the crystal structure used for the WT_KAN simulation an additional KAN molecule isbound non-specifically. This was removed from the structure prior to the system setup.For all the RNA systems we have used the Amber ff99146 force field. Parameters for theantibiotics were prepared in Amber and the parameterization process is described below, inSection 3.3 Free aminoglycosides.
3.1.3 Simulation conditions
The simulation protocol was specifically designed for a system containing short RNAhelix. Due to complicated RNA architectures and high charge, the procedure has to bedifferent than for proteins.147
1. The minimization was performed by sander program from Amber: 8 000 steps ofSD and 2 000 steps of CG. All heavy atoms (i.e., not hydrogens) were restrained withharmonic position constraints (with constraint coefficient k = 100 kcal=(mol�Å2)).
2. During the thermalization, temperature was gradually increased from 30 to 310 Kand the constraints were weakened to k = 50 kcal=(mol�Å2) for the first 85 ps, andk = 25 kcal=(mol�Å2) for the next 35 ps.
3. Next, there was the two-step equilibration: during the first 300 ps the constraints weregradually weakened and for the last 600 ps only the terminal nucleotides(k = 0:35 kcal=(mol�Å2)) plus the phosphate atoms (P; k = 0:25 kcal=(mol�Å2)) wereassigned small constraints. The values of these constraints was adjusted so as to matchthe thermal fluctuations (i.e., the �-factors) for the analogous atoms from the crystalstructure of the whole 30S subunit (PDB id: 1IBK148).
4. The last stage, production, was performed with the same constraints as for the secondequilibration step, and lasted 20 or 25 ns (see Table 3.1). In the tests, the removal ofconstraints on terminal nucleotides resulted in fraying ends, and because in the wholeribosome, the A-site is contained within a longer helix, we did not want to allow forthe fraying termini.
The simulations were performed in NAMD149 in the NPT ensemble: the temperaturewas controlled by Langevin thermostat (collision frequency of 1 per ps), and the pressure(1 atmosphere) was maintained using the Langevin piston method.121, 150 Electrostatic inter-actions were calculated using PME,119 and a cutoff of 12 Å was used to limit the direct spacesum. The SHAKE algorithm123 was used to constrain all the bonds with hydrogen atoms,which enabled a 2-fs long timestep.
3.1.4 Choice of the force �eld
The simulations of RNA were conducted in ff99 Amber force field. During our studynewer force fields parameters became available, namely the ff10151–153 model, with an im-proved description of the torsional angles for the sugar–base (� angle) and sugar–phosphate(� and angles) linkages in long simulations (> 50 ns). Our trajectories were, however,shorter (maximum 25 ns), and therefore, the used parameters should not bias the outcome.Banáš et al.152 have shown that simulations of RNA in ff99 could lead to a severe disruptionof the secondary helical structure, due to misparameterized � angle. However, throughoutour simulations, we have not observed the described switch of � values from � �150� to� �90� (the mean value calculated for all the residues for the whole simulation time reachedmaximum of�132� for the G1491U simulation). Moreover, recently we have also performed
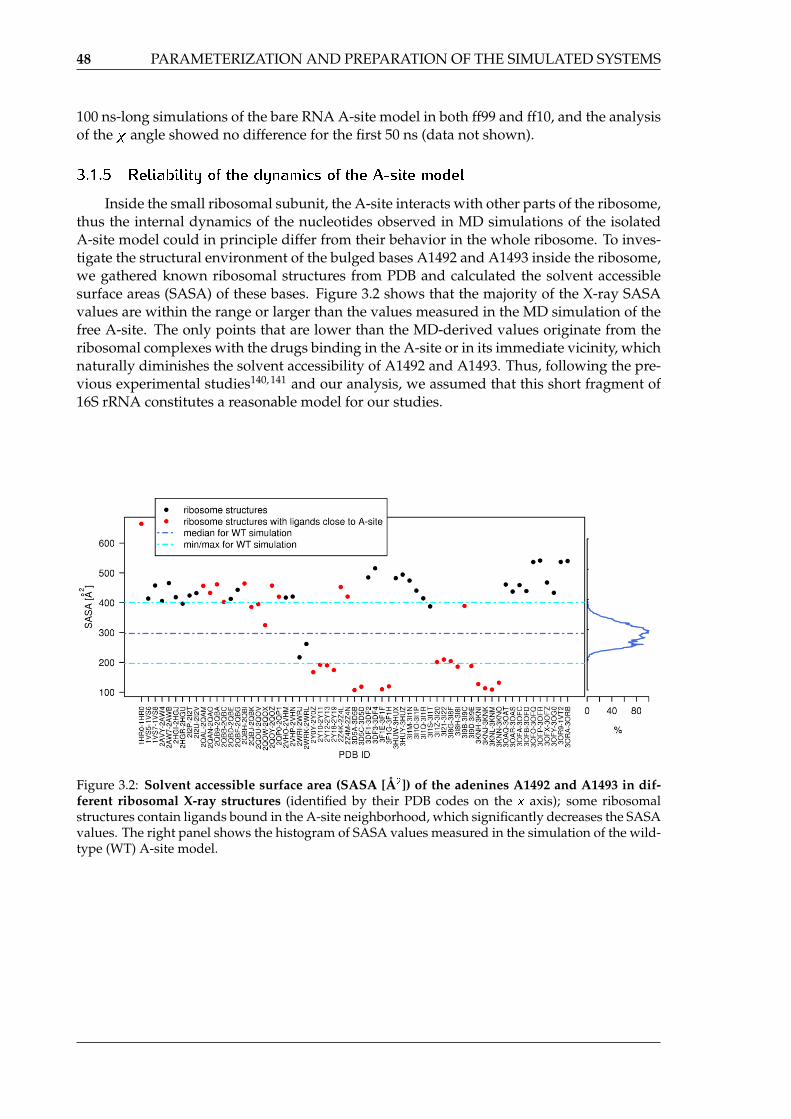
48 PARAMETERIZATION AND PREPARATION OF THE SIMULATED SYSTEMS
100 ns-long simulations of the bare RNA A-site model in both ff99 and ff10, and the analysisof the � angle showed no difference for the first 50 ns (data not shown).
3.1.5 Reliability of the dynamics of the A-site model
Inside the small ribosomal subunit, the A-site interacts with other parts of the ribosome,thus the internal dynamics of the nucleotides observed in MD simulations of the isolatedA-site model could in principle differ from their behavior in the whole ribosome. To inves-tigate the structural environment of the bulged bases A1492 and A1493 inside the ribosome,we gathered known ribosomal structures from PDB and calculated the solvent accessiblesurface areas (SASA) of these bases. Figure 3.2 shows that the majority of the X-ray SASAvalues are within the range or larger than the values measured in the MD simulation of thefree A-site. The only points that are lower than the MD-derived values originate from theribosomal complexes with the drugs binding in the A-site or in its immediate vicinity, whichnaturally diminishes the solvent accessibility of A1492 and A1493. Thus, following the pre-vious experimental studies140, 141 and our analysis, we assumed that this short fragment of16S rRNA constitutes a reasonable model for our studies.
Figure 3.2: Solvent accessible surface area (SASA [Å2]) of the adenines A1492 and A1493 in dif-ferent ribosomal X-ray structures (identified by their PDB codes on the x axis); some ribosomalstructures contain ligands bound in the A-site neighborhood, which significantly decreases the SASAvalues. The right panel shows the histogram of SASA values measured in the simulation of the wild-type (WT) A-site model.
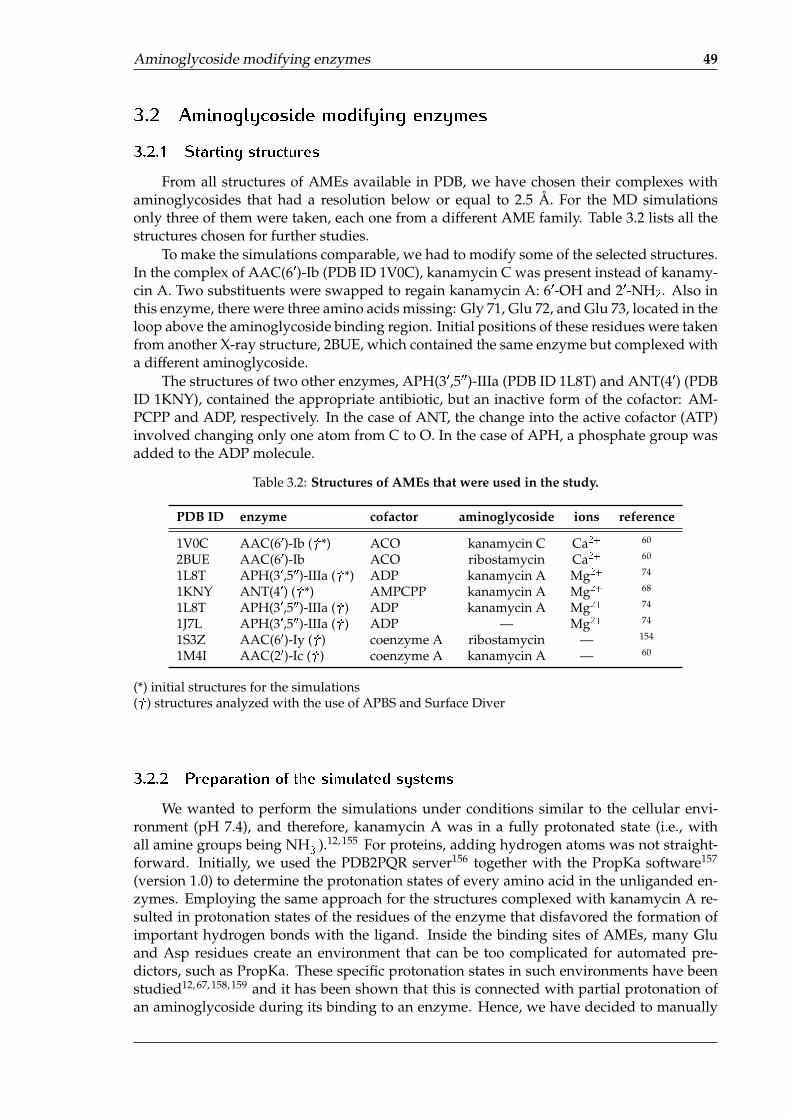
Aminoglycoside modifying enzymes 49
3.2 Aminoglycoside modifying enzymes
3.2.1 Starting structures
From all structures of AMEs available in PDB, we have chosen their complexes withaminoglycosides that had a resolution below or equal to 2.5 Å. For the MD simulationsonly three of them were taken, each one from a different AME family. Table 3.2 lists all thestructures chosen for further studies.
To make the simulations comparable, we had to modify some of the selected structures.In the complex of AAC(60)-Ib (PDB ID 1V0C), kanamycin C was present instead of kanamy-cin A. Two substituents were swapped to regain kanamycin A: 60-OH and 20-NH2. Also inthis enzyme, there were three amino acids missing: Gly 71, Glu 72, and Glu 73, located in theloop above the aminoglycoside binding region. Initial positions of these residues were takenfrom another X-ray structure, 2BUE, which contained the same enzyme but complexed witha different aminoglycoside.
The structures of two other enzymes, APH(30,500)-IIIa (PDB ID 1L8T) and ANT(40) (PDBID 1KNY), contained the appropriate antibiotic, but an inactive form of the cofactor: AM-PCPP and ADP, respectively. In the case of ANT, the change into the active cofactor (ATP)involved changing only one atom from C to O. In the case of APH, a phosphate group wasadded to the ADP molecule.
Table 3.2: Structures of AMEs that were used in the study.
PDB ID enzyme cofactor aminoglycoside ions reference
1V0C AAC(60)-Ib (y*) ACO kanamycin C Ca2+ 60
2BUE AAC(60)-Ib ACO ribostamycin Ca2+ 60
1L8T APH(30,500)-IIIa (y*) ADP kanamycin A Mg2+ 74
1KNY ANT(40) (y*) AMPCPP kanamycin A Mg2+ 68
1L8T APH(30,500)-IIIa (y) ADP kanamycin A Mg2+ 74
1J7L APH(30,500)-IIIa (y) ADP — Mg2+ 74
1S3Z AAC(60)-Iy (y) coenzyme A ribostamycin — 154
1M4I AAC(20)-Ic (y) coenzyme A kanamycin A — 60
(*) initial structures for the simulations(y) structures analyzed with the use of APBS and Surface Diver
3.2.2 Preparation of the simulated systems
We wanted to perform the simulations under conditions similar to the cellular envi-ronment (pH 7.4), and therefore, kanamycin A was in a fully protonated state (i.e., withall amine groups being NH+
3 ).12, 155 For proteins, adding hydrogen atoms was not straight-forward. Initially, we used the PDB2PQR server156 together with the PropKa software157
(version 1.0) to determine the protonation states of every amino acid in the unliganded en-zymes. Employing the same approach for the structures complexed with kanamycin A re-sulted in protonation states of the residues of the enzyme that disfavored the formation ofimportant hydrogen bonds with the ligand. Inside the binding sites of AMEs, many Gluand Asp residues create an environment that can be too complicated for automated pre-dictors, such as PropKa. These specific protonation states in such environments have beenstudied12, 67, 158, 159 and it has been shown that this is connected with partial protonation ofan aminoglycoside during its binding to an enzyme. Hence, we have decided to manually
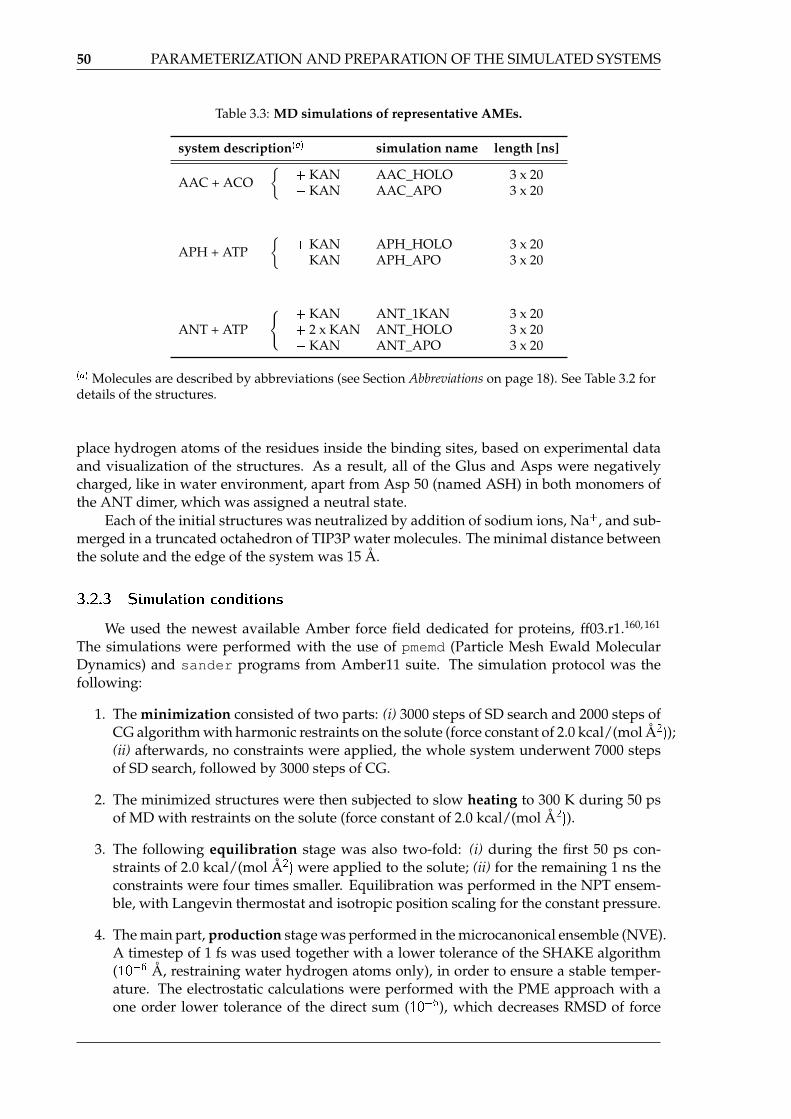
50 PARAMETERIZATION AND PREPARATION OF THE SIMULATED SYSTEMS
Table 3.3: MD simulations of representative AMEs.
system description(a) simulation name length [ns]
AAC + ACO{
+ KAN AAC_HOLO 3 x 20� KAN AAC_APO 3 x 20
APH + ATP{
+ KAN APH_HOLO 3 x 20� KAN APH_APO 3 x 20
ANT + ATP
{+ KAN ANT_1KAN 3 x 20+ 2 x KAN ANT_HOLO 3 x 20� KAN ANT_APO 3 x 20
(a) Molecules are described by abbreviations (see Section Abbreviations on page 18). See Table 3.2 fordetails of the structures.
place hydrogen atoms of the residues inside the binding sites, based on experimental dataand visualization of the structures. As a result, all of the Glus and Asps were negativelycharged, like in water environment, apart from Asp 50 (named ASH) in both monomers ofthe ANT dimer, which was assigned a neutral state.
Each of the initial structures was neutralized by addition of sodium ions, Na+, and sub-merged in a truncated octahedron of TIP3P water molecules. The minimal distance betweenthe solute and the edge of the system was 15 Å.
3.2.3 Simulation conditions
We used the newest available Amber force field dedicated for proteins, ff03.r1.160, 161
The simulations were performed with the use of pmemd (Particle Mesh Ewald MolecularDynamics) and sander programs from Amber11 suite. The simulation protocol was thefollowing:
1. The minimization consisted of two parts: (i) 3000 steps of SD search and 2000 steps ofCG algorithm with harmonic restraints on the solute (force constant of 2.0 kcal/(mol Å2));(ii) afterwards, no constraints were applied, the whole system underwent 7000 stepsof SD search, followed by 3000 steps of CG.
2. The minimized structures were then subjected to slow heating to 300 K during 50 psof MD with restraints on the solute (force constant of 2.0 kcal/(mol Å2)).
3. The following equilibration stage was also two-fold: (i) during the first 50 ps con-straints of 2.0 kcal/(mol Å2) were applied to the solute; (ii) for the remaining 1 ns theconstraints were four times smaller. Equilibration was performed in the NPT ensem-ble, with Langevin thermostat and isotropic position scaling for the constant pressure.
4. The main part, production stage was performed in the microcanonical ensemble (NVE).A timestep of 1 fs was used together with a lower tolerance of the SHAKE algorithm(10�6 Å, restraining water hydrogen atoms only), in order to ensure a stable temper-ature. The electrostatic calculations were performed with the PME approach with aone order lower tolerance of the direct sum (10�6), which decreases RMSD of force

Free aminoglycosides 51
errors.144 Both, the temperature and the total potential energy were stable, with fluc-tuations around the mean of less than 0.5% and 0.01%, respectively.
For each of the systems, the simulation was repeated three times, each time with differ-ent initial velocities. This increases the sampling of the molecular conformational space andthe statistical relevance of the findings. Table 3.3 presents a summary of all the simulations.
3.3 Free aminoglycosides
3.3.1 Simulation setup
Simulations of the two aminoglycosides, paromomycin (4,5-disubstituted DOS) andkanamycin A (4,6-disubstituted DOS), were performed in explicit water, in order to checkthe correctness of the parameterization. The initial positions of the atoms of the drugs weretaken from the structures of their complexes that had the best resolution: 1J7T142 for PAR(2.5 Å), and 1ND4162 (2.1 Å) for KAN. Almost all of the amine groups of paromomycin12, 163
and kanamycin A155 have pKa values> 7:4, which means that these are protonated at phys-iological pH. The pKa value of one substituent, namely group 3-NH2 in both of these antibi-otics (see Figure 1.1), was found to be slightly lower than 7 in water, however, it was shownthat the environment of the RNA A-site or enzymes promotes full protonation of aminogly-cosides.12 Thus, for the simulations of the drugs alone, we have added hydrogens to all oftheir amine groups, in order to use these structures and parameters in the simulations of thecomplexes. This resulted in the total charge of +5 and +4 for PAR and KAN, respectively.
The parameters were based on GAFF (General Amber Force Field).164 For paromomy-cin, the partial atomic charges were taken from a standard set called AM1BCC.165 In the caseof kanamycin A, charges were fitted by antechamber with the RESP algorithm, based onthe electrostatic potential calculated by Gaussian166 with the GTO 6–31G* basis set.
Both drugs were neutralized by adding chloride ions, Cl�, prior to putting them intoa truncated octahedron of TIP3P water molecules. The minimal distance between the drugand water edge was 15 Å. The simulations of aminoglycosides were carried out with theuse of sander from Amber11. The protocol was essentially the same as for the simulationsof the enzymes. We performed three simulations per aminoglycoside, each one with dif-ferent initial velocities, each production lasting 10 ns. The length of each simulation wasshort because our aim was only to validate the force field parameters and not to thoroughlyinvestigate the conformational phase space of these molecules.
3.3.2 Parameterization validation
Aminoglycoside antibiotics posses several rings that are connected through flexiblelinkages (see Figure 3.3). The different conformations they adopt can be quantified by mea-suring the dihedral angles of the atoms in the linkages, as proposed in Refs.52, 167 The gen-eral definitions are: �(H1sugar–C1sugar–O1sugar–Cx) and (C1sugar–O1sugar–Cx–Hx), where“x” depends on the linkage. For example, for linkage I/II in kanamycin A: �(H10–C10–O10–C4) and (C10–O10–C4–H4); see Figure 3.3B for the numbering of atoms. Figure 3.4 showsthe results for the two studied aminoglycosides; the measurements were done for MD simu-lations in explicit water. Each linkage has one conformation that is the most populated, butthe range of the observed dihedral angles is quite wide. Importantly, linkage I/II behavessimilarly for both studied antibiotics. This is expected, since rings I and II are common to themajority of aminoglycosides. These two drugs, however, belong to two different subgroups— kanamycin A is a 4,6-DOS, while paromomycin is a 4,5-DOS. Therefore, linkages II/IIIscan different parts of the �/ conformational space.

52 PARAMETERIZATION AND PREPARATION OF THE SIMULATED SYSTEMS
(A) paromomycin (B) kanamycin A
Figure 3.3: Starting structures of the two aminoglycoside representatives, shown as sticks, coloredby atom type: C — magenta or green, N — blue, O — red and H — white. The rings are numberedwith Arabic numbers and the atoms referred to in the text are labeled.
Figure 3.4: Conformations of the studied aminoglycosides, (A) kanamycin A and (B) paromomycin(only the representative conformations are shown), measured by dihedral angles of linkages: (C),(E)linkage I/II, (D),(F) linkage II/III, and (G) linkage III/IV.
There were no experimental data exactly for paromomycin, thus we have compared theMD-derived values with the NMR data for neomycin B,167 which differs from paromomy-cin only in one substituent (60-NH2 instead of 60-OH). Moreover, these experiments wereconducted at pH values of 4.7 and 9.7, while in the simulations, we mimicked pH 7.4. TheNMR experiments52, 167 showed that linkage I/II for both aminoglycosides acquired mostoften a syn- orientation ( � 0�), and the population of anti- orientation ( � 180� or � �180�) had a different pH dependence for these two drugs. In the case of kanamy-cin A, the anti- orientation was sampled most often at low pH, and it diminished at highpH. On the contrary, for neomycin B, only at high pH the anti- orientation of linkage I/IIwas measurable. In the simulations, we observed only the syn- orientation (Figure 3.4C,E).
Linkage II/III was found to acquire only syn- orientation for kanamycin A,52 while
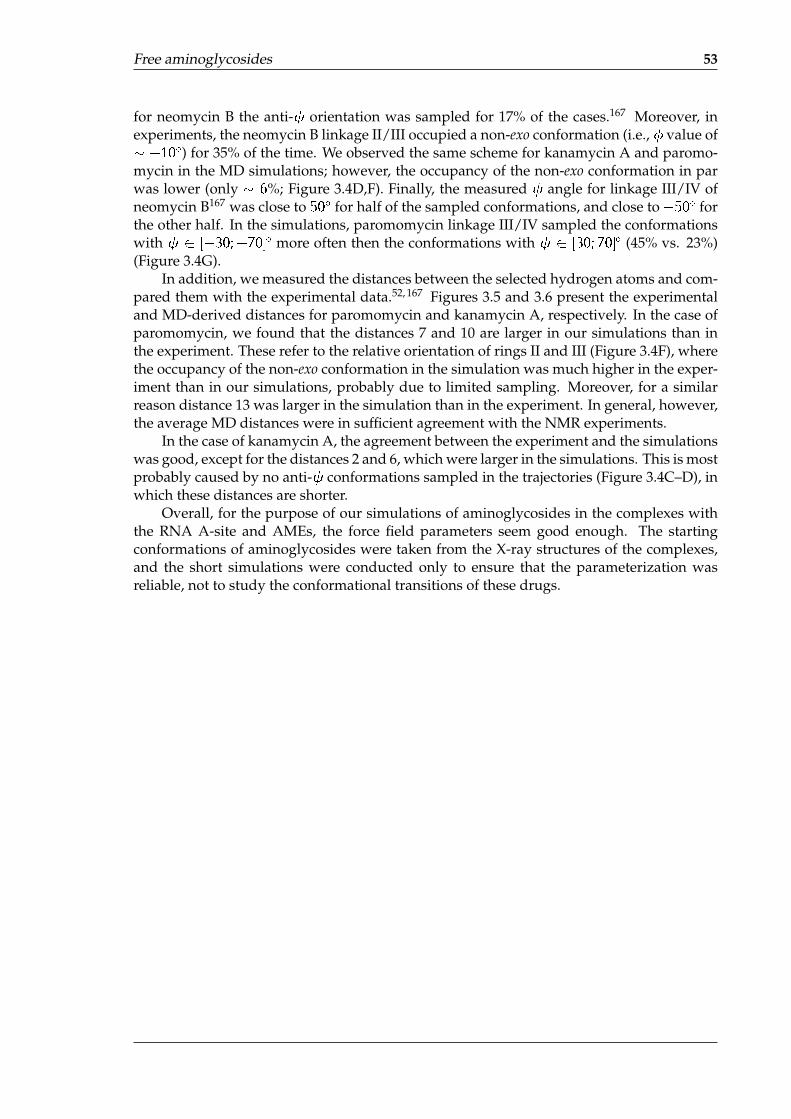
Free aminoglycosides 53
for neomycin B the anti- orientation was sampled for 17% of the cases.167 Moreover, inexperiments, the neomycin B linkage II/III occupied a non-exo conformation (i.e., � value of� �10�) for 35% of the time. We observed the same scheme for kanamycin A and paromo-mycin in the MD simulations; however, the occupancy of the non-exo conformation in parwas lower (only � 6%; Figure 3.4D,F). Finally, the measured angle for linkage III/IV ofneomycin B167 was close to 50� for half of the sampled conformations, and close to �50� forthe other half. In the simulations, paromomycin linkage III/IV sampled the conformationswith 2 [�30;�70]� more often then the conformations with 2 [30; 70]� (45% vs. 23%)(Figure 3.4G).
In addition, we measured the distances between the selected hydrogen atoms and com-pared them with the experimental data.52, 167 Figures 3.5 and 3.6 present the experimentaland MD-derived distances for paromomycin and kanamycin A, respectively. In the case ofparomomycin, we found that the distances 7 and 10 are larger in our simulations than inthe experiment. These refer to the relative orientation of rings II and III (Figure 3.4F), wherethe occupancy of the non-exo conformation in the simulation was much higher in the exper-iment than in our simulations, probably due to limited sampling. Moreover, for a similarreason distance 13 was larger in the simulation than in the experiment. In general, however,the average MD distances were in sufficient agreement with the NMR experiments.
In the case of kanamycin A, the agreement between the experiment and the simulationswas good, except for the distances 2 and 6, which were larger in the simulations. This is mostprobably caused by no anti- conformations sampled in the trajectories (Figure 3.4C–D), inwhich these distances are shorter.
Overall, for the purpose of our simulations of aminoglycosides in the complexes withthe RNA A-site and AMEs, the force field parameters seem good enough. The startingconformations of aminoglycosides were taken from the X-ray structures of the complexes,and the short simulations were conducted only to ensure that the parameterization wasreliable, not to study the conformational transitions of these drugs.
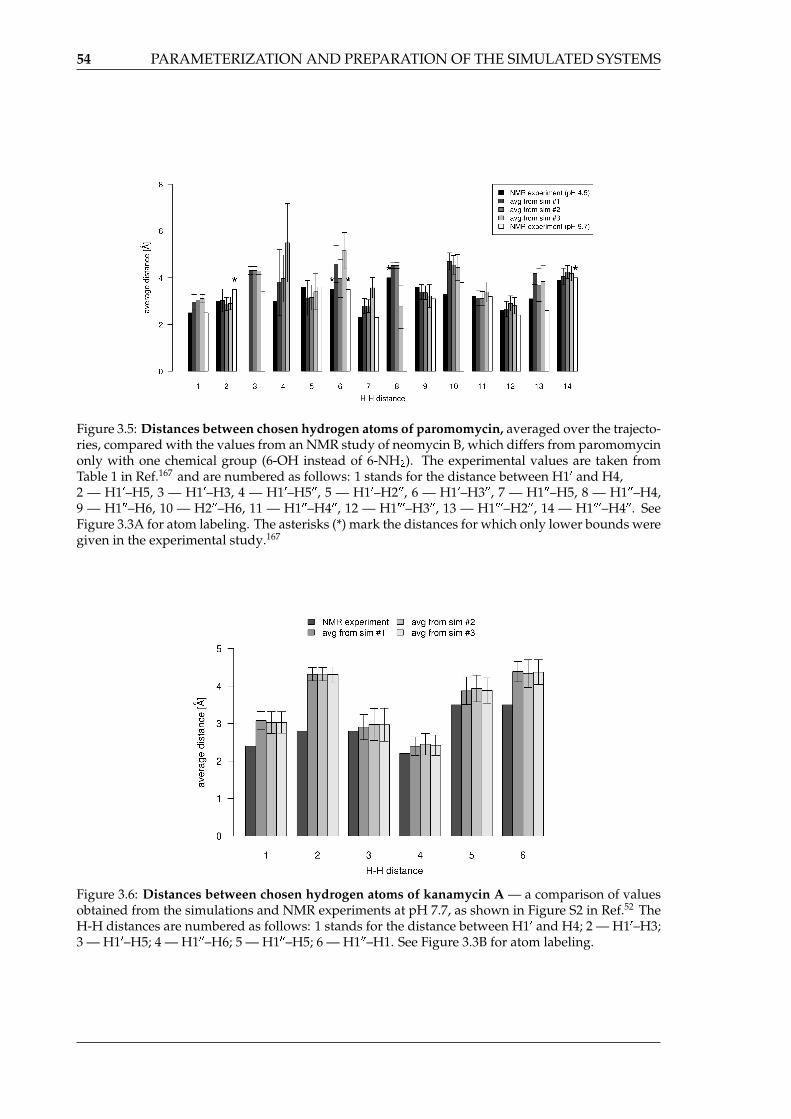
54 PARAMETERIZATION AND PREPARATION OF THE SIMULATED SYSTEMS
Figure 3.5: Distances between chosen hydrogen atoms of paromomycin, averaged over the trajecto-ries, compared with the values from an NMR study of neomycin B, which differs from paromomycinonly with one chemical group (6-OH instead of 6-NH2). The experimental values are taken fromTable 1 in Ref.167 and are numbered as follows: 1 stands for the distance between H10 and H4,2 — H10–H5, 3 — H10–H3, 4 — H10–H500, 5 — H10–H200, 6 — H10–H300, 7 — H100–H5, 8 — H100–H4,9 — H100–H6, 10 — H200–H6, 11 — H100–H400, 12 — H1000–H300, 13 — H1000–H200, 14 — H1000–H400. SeeFigure 3.3A for atom labeling. The asterisks (*) mark the distances for which only lower bounds weregiven in the experimental study.167
Figure 3.6: Distances between chosen hydrogen atoms of kanamycin A — a comparison of valuesobtained from the simulations and NMR experiments at pH 7.7, as shown in Figure S2 in Ref.52 TheH-H distances are numbered as follows: 1 stands for the distance between H10 and H4; 2 — H10–H3;3 — H10–H5; 4 — H100–H6; 5 — H100–H5; 6 — H100–H1. See Figure 3.3B for atom labeling.
Data analysis 55
3.4 Data analysis
For visualization of the trajectories, we used VMD168 and PyMol Molecular GraphicsSystem (Schrödinger, LLC., www.pymol.org). The plots and graphs were produced in theR environment.169 VMD was also used to measure the following quantities (through customTcl/Tk scripts):� the dihedral angles;� the average density of water or ions inside the binding sites;� SASA;� and the stacking interactions.
The basic measures, i.e., RMSD and RMSF, were calculated with either g_rms andg_rmsf programs of the GROMACS package170–172 or ptraj of AmberTools. ptraj wasalso used for the following analyses:� clustering of conformations: average linkage method was used; we performed this hierar-
chical clustering till all the clusters were merged and then we chose the number of clustersthat would give the optimal distribution of the conformations, based on the methodologydescribed in Ref.;173
� finding hydrogen bonds between the ligand and the receptor; maximal distance between thedonor and the acceptor was set to 3:5 Å and the angle was minimum 120�;
� measuring distances between atoms or centers of mass of residues;� outputting the average conformations.
To analyze the tertiary structures of the simulated RNA, we used the 3DNA software,174
which measures various helical parameters of nucleic acids, including the glycosidic angle� , the number of hydrogen bonds between bases in a pair or the opening angle of a basepair. The method is based on a geometrical analysis and comparison of the nucleotide con-formation from the simulation to a template structure.
From the pharmacological point of view, the volume of a binding pocket is an importantfeature of a receptor because it can be critical when designing drugs and checking theirefficiency. It is easy to find and define a binding pocket on a surface of a protein (e.g., Ref.175),but it is not straightforward for RNA structures since there are many cavities on a surfaceof e.g., a double helix. We have chosen the POVME software176 for calculating the volumeof binding sites because it offers a generic approach and the area of the binding pocketcan be precisely defined by the user. The implemented algorithm measures the volume of achosen cavity by placing beads on a grid wherever the bead does not contact any atom of themolecule. Thus, the sum of placed beads times the grid resolution yields the total volume.The volumes were measured without the aminoglycoside inside the binding site.
PCA was done with the use of bio3d package177 for R. Adaptive Poisson-BoltzmannSolver (APBS)178 was used to calculate the ESP of the X-ray structures of AME ternary com-plexes (enzyme:cofactor:aminoglycoside). However, for the calculations, we deleted theaminoglycoside that was in the X-ray structure. Next, the Surface Diver software179 wasused to compare these potentials in relation to an aminoglycoside core (i.e., neamine part)inside the binding cleft. Surface Diver performs a decomposition of ESP into spherical har-monics, and therefore, the compared molecules do not need to be structurally or sequencerelated.
The binding free energy and its per-residue decomposition was computed by MMPBSA.py,a part of AmberTools, on total of 3333 frames from each trajectory, i.e., every 6 ps. For calcu-lating the electrostatic interactions, we chose the simpler generalized Born model132 insteadof the Poisson-Boltzmann model180 because of the large sizes of simulated systems and large
56 PARAMETERIZATION AND PREPARATION OF THE SIMULATED SYSTEMS
number of simulations. The calculated energy accounts only for the enthalpic part of the to-tal binding free energy (Ecalc � H; see Chapter 2, Section 2.8 Assessment of the binding freeenergy), and therefore we used the calculated values only to compare the contributions com-ing from single residues. Moreover, the experimental data on the free energy of binding ofaminoglycosides to AMEs is scarce, thus we could not relate to them the calculated energyvalues.
In the AAC_HOLO and APH_HOLO simulations, some water molecules close to kana-mycin A atoms were especially stable (calculated �–factors were less than 30 Å2), thus wedecided to include them as part of the receptor when calculating the energies. However, ineach of the three separate APH_HOLO simulations, these were different water molecules.Therefore, we performed three separate calculations for each APH_HOLO simulation andthen we combined the results using the weighted mean (��) and the unbiased error estima-tion (� ):
�� =�Ni=1wixi
V1;
�2 =V1
V 21 � V2
N∑i=1
wi(xi � ��)2 ;
where wi is the weight of element xi (here the weights are reciprocals of standard errors ofenergy values calculated for each of the simulations); N = 3 is the number of simulations;V1 = �iwi and V2 = �iw
2i .
To determine which residues are contributing the most to kanamycin A binding toAMEs, we used a measure introduced in Ref.181 The amino acid efficiency is defined asfollows:
EFF =�EresNhvy
;
where �Eres is a total contribution of a residue (difference of the MMGBSA energy for theresidue in the APO and HOLO states), and Nhvy is a number of heavy atoms in this residue.
Chapter 4
Results and discussion
We used several tools of theoretical biophysics to investigate the binding sites of amino-glycosides located in different biomolecules: the ribosomal RNA A-site and three AME rep-resentatives. We focused on two types of bacterial resistance: (i) mutations in the RNA bind-ing site; and (ii) modification of aminoglycosides by the bacterial enzymes. We analyzed the“static” X-ray structures but the most important conclusions are based on the results frommolecular dynamics simulations of these different molecules and their complexes with twoaminoglycoside representatives, kanamycin A and paromomycin. This wide range of struc-tures and the biochemical differences between them, required the usage of various methods.We also developed a new method for conformational analysis. In this study, we aimed atcharacterizing and comparing the environments that these biomolecules provide and thetypes of interactions formed with aminoglycosides.
This chapter is organized as follows. First, we present our new tool for analyzing in-ternal dynamics of biomolecules, and we demonstrate its usability through a series of testsin Section 4.1 New method for identifying similarly moving atoms in molecular conformation sets.Next, in Section 4.2 Bacterial resistance mechanism 1: ribosomal RNA A-site mutations, we de-scribe and discuss the results from the MD simulations of the mutated A-site models. Fi-nally, Section 4.3 Bacterial resistance mechanism 2: enzymatic aminoglycoside modification focuseson the MD simulations of AMEs, where the results are explained and discussed.
57

58 RESULTS AND DISCUSSION
4.1 New method for identifying similarly moving atoms
in molecular conformation sets
Currently, the simulations produce even hundreds of thousands of molecular confor-mations that have to be carefully analyzed. Especially in classical MD, these conformationsare most of the time very similar to one another, due to the intrinsic limitation of samplingrestricted to only a couple of local energetical minima. Therefore, noticing a larger transitioncan be difficult. To make it easier, one often decreases the dimensionality of the descriptionof molecular motion. One of the methods is searching for similarity in atomic motions. Theclassical approach involves calculation of cross-correlation coefficients, which yield DCCM.This approach, however, has some limitations, as explained in Chapter 2, Section 2.5.3 Corre-lated motions. Therefore, we proposed an alternative method, where the molecule is dividedinto so-called “dynamic domains”, based on its conformations. These dynamic domainscan be defined as parts of the molecule that stay internally rigid but move in relation to oneanother. The idea is not new — the first algorithm and software, Hingefind, was proposedby W. Wriggers and K. Schulten in 1997.182 Their algorithm compares two conformations ofa protein by least-square fitting, and then finds the stable fragments and defines a rotationaxis. DomainFinder, designed by Konrad Hinsen,183, 184 is perhaps more commonly used.Based on a normal mode analysis, DomainFinder finds the directions of harmonic motionsof atoms around their energetic minimum.136 find.core from the R package bio3d,177 findsthe atoms that are invariant in a molecule, based on its conformations or alignment to a sim-ilar set of structures. FindCore algorithm185 analyzes variation of distances between pairsof atoms and also outputs the “core atoms”, i.e., the atoms that change their positions theleast. It does not, however, predict a clear division into dynamic domains. The CYRANGEprogram186 gives this division explicitly, but it was optimized to analyze the data from NMRexperiments, not MD simulations. Next, the DynDom database187, 188 calculates and storesa division into dynamic domains for proteins that have two experimentally resolved con-formations. A more recent server, PiSQRD,189, 190 uses a covariance matrix to extract low-energy modes of motions, and, based on these modes, the atoms are grouped into dynamicdomains.
The presented list of software and methods shows that a lot has been already doneto analyze the internal dynamics of molecules. However, none of these approaches wasdesigned to deal with large datasets that come from simulations — they focus on experi-mentally resolved conformations. Moreover, all of the mentioned software analyzes onlyproteins. Therefore, we found a need to create a similar tool that would deal well with dataproduced by simulations and that could be also applied for nucleic acids. Additionally, wewanted to improve the way of detecting the correlations of motions and find a method thatdoes not depend on the order of conformations and the type of molecules being analyzed.
Below, we describe our new algorithm, the implementation (Geometrically Stable Sub-structures, GeoStaS) and its testing on experimental data (obtained from NMR) and MDsimulations, of proteins, nucleic acids and their complexes. The software is open source andfreely available for download: http://bitbucket.org/jrom/geostas orhttp://bionano.icm.edu.pl/Software/GeoStaS.
4.1.1 GeoStaS algorithm
The workflow of GeoStaS algorithm is presented in Figure 4.1. The algorithm is basedon finding similar atomic motions. Instead of concentrating on the whole molecule, weextract trajectories of individual atoms from the provided set of molecular conformations(which can be a trajectory from a simulation or an ensemble of experimentally resolved
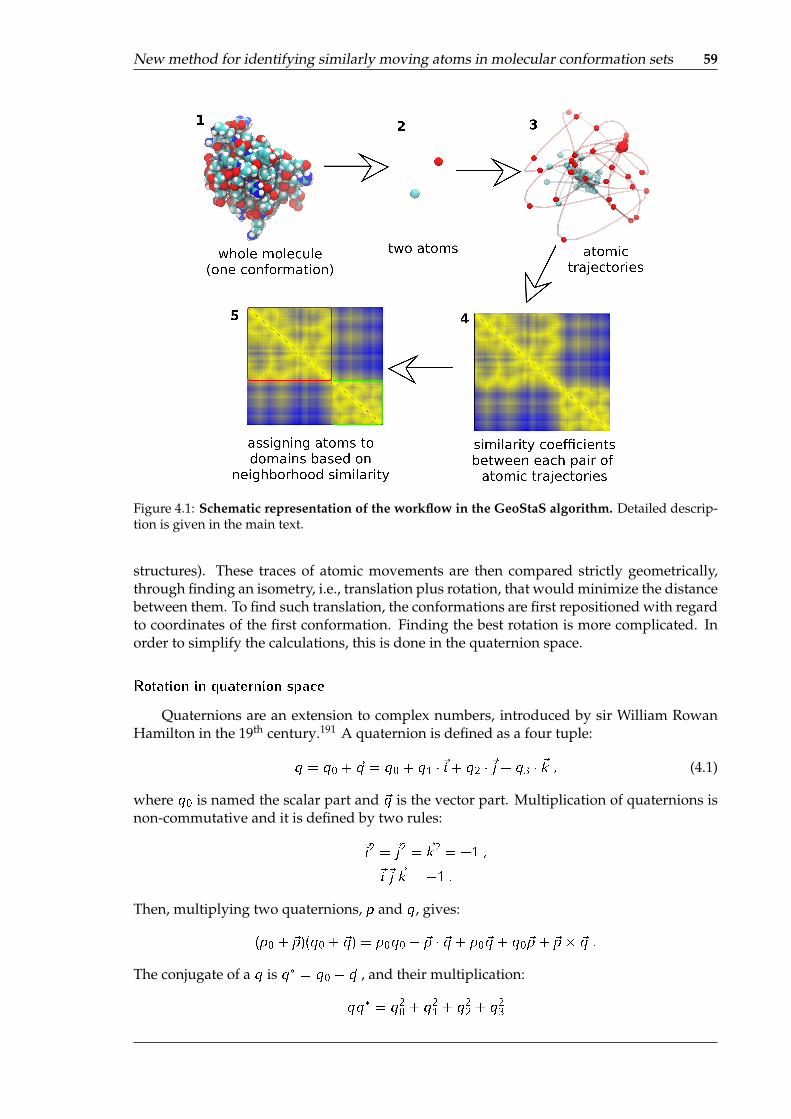
New method for identifying similarly moving atoms in molecular conformation sets 59
Figure 4.1: Schematic representation of the workflow in the GeoStaS algorithm. Detailed descrip-tion is given in the main text.
structures). These traces of atomic movements are then compared strictly geometrically,through finding an isometry, i.e., translation plus rotation, that would minimize the distancebetween them. To find such translation, the conformations are first repositioned with regardto coordinates of the first conformation. Finding the best rotation is more complicated. Inorder to simplify the calculations, this is done in the quaternion space.
Rotation in quaternion space
Quaternions are an extension to complex numbers, introduced by sir William RowanHamilton in the 19th century.191 A quaternion is defined as a four tuple:
q = q0 + ~q = q0 + q1 �~i+ q2 � ~j + q3 � ~k ; (4.1)
where q0 is named the scalar part and ~q is the vector part. Multiplication of quaternions isnon-commutative and it is defined by two rules:
~i2 = ~j2 = ~k2 = �1 ;
~i ~j ~k = �1 :
Then, multiplying two quaternions, p and q, gives:
(p0 + ~p)(q0 + ~q) = p0q0 � ~p � ~q+ p0~q+ q0~p+ ~p� ~q :
The conjugate of a q is q� = q0 � ~q , and their multiplication:
qq� = q20 + q21 + q
22 + q
23

60 RESULTS AND DISCUSSION
gives a nonnegative real number.192
In the case of GeoStaS algorithm, the key feature of quaternions is that when construct-ing a quaternionic operator and applying it to a vector ~v in R3, we obtain the rotated vector~v 0 by angle � :
~v 0 = q ~v q�1 ; (4.2)q = cos(�=2) + ~a � sin(�=2) ; (4.3)
where ~a is the direction of ~q, i.e., the normalized vector part of q; and q�1 = q�=jqj2.The standard approach for performing a rotation in Cartesian space uses a rotation
matrix 3 � 3 that contains trigonometric functions of rotation angle, which are difficult toimplement. In the quaternion space, one needs only four parameters (one quaternion) andthere are no trigonometric functions. Kneller et al.193 have presented an elegant way ofimplementing this search for the best rotation in quaternion space. It can be reduced to asimple eigenproblem:
M � q = � q ; (4.4)
where q is the quaternion that describes the rotation; and � is a diagonal matrix. Matrix Mis of the following form:193
M =N∑k=1
[(~xi(k)� ~xj (k)
)2~uij (k)
T
~uij (k) Pij (k)
];
~uij (k) = ~xi(k)� ~xj (k) ;
Pij (k) = ~xi(k) � ~xj (k)T + ~xi(k)
T � ~xj (k) ;
where ~xi(k) and ~xj (k) describe the positions of the two atoms, i and j , respectively, in theconformation k ; and T denotes the transpose of a matrix. For each pair of atoms, their tracesare compared, yielding a separate eigenproblem of the form as in Equation 4.4.
The result is a set of four eigenvalues, where the largest value, �1, points to the best rota-tion, while the smallest value, �4, shows the worst one. Kneller et al. have shown that withthe smallest eigenvalue one gets also the normalized distance between the two comparedobjects:193
� =
(M11
�4
) 1
2
: (4.5)
The distance � 2 [0; 1], which discriminates between the parallel (� � 0) or anti-parallelorder (� � 1). Since in our algorithm, we want to find the atoms that move in the samedirection at the same time (i.e., that are correlated and not anti-correlated), we define a sim-ilarity coefficient as: SC = 1� �, so that higher values would describe better correlations.
Clustering of similarity matrix
These similarity coefficients are calculated per each pair of atomic trajectories and a so-called atomic movement similarity matrix (AMSM) is constructed (see Figure 4.1). Next, thismatrix has to be clustered into groups with maximal internal similarity. For this purpose, amodified nearest-neighbor graph algorithm194 is used. The atoms are represented as nodesof the graph. Edges, weighted with similarity coefficients (wij � SCij ), connect each twoatoms that are farther than four residues apart at a sequence level. The similarity coefficientsfor atoms closer than this limit are naturally very close to 1, thus including these valueswould bias the outcome of clustering and would not provide significant results. Atoms
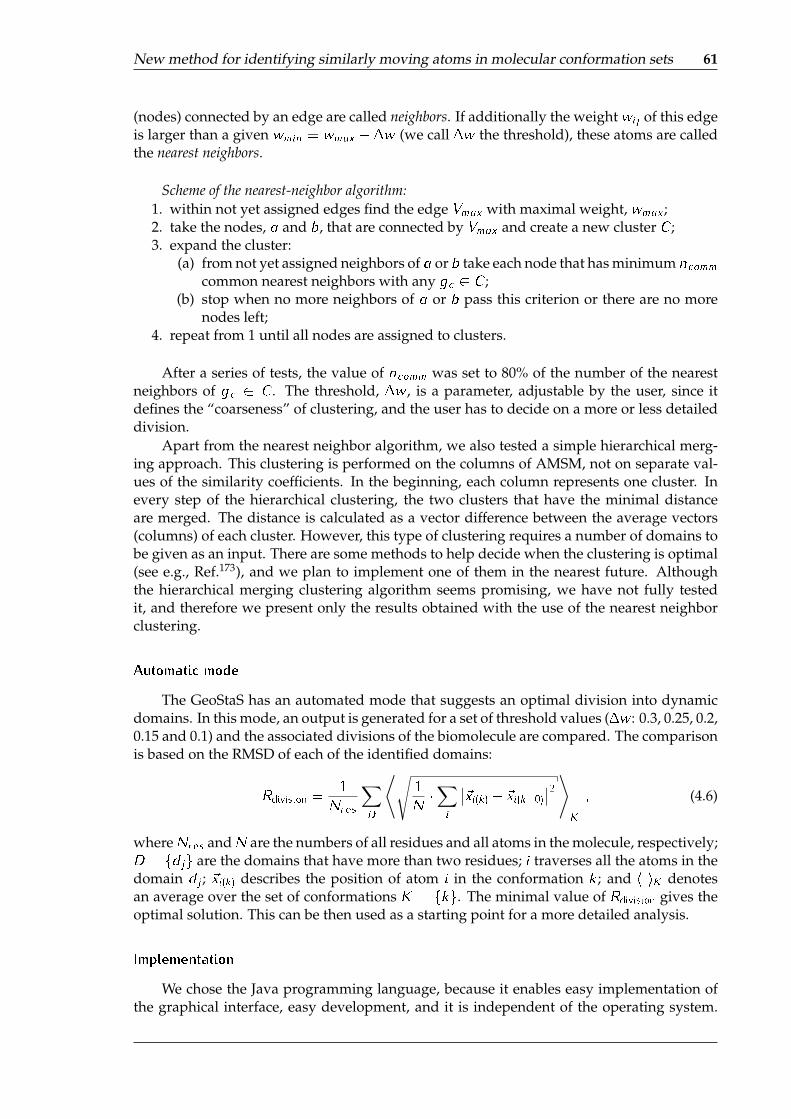
New method for identifying similarly moving atoms in molecular conformation sets 61
(nodes) connected by an edge are called neighbors. If additionally the weight wij of this edgeis larger than a given wmin = wmax � �w (we call �w the threshold), these atoms are calledthe nearest neighbors.
Scheme of the nearest-neighbor algorithm:1. within not yet assigned edges find the edge Vmax with maximal weight, wmax ;2. take the nodes, a and b, that are connected by Vmax and create a new cluster C ;3. expand the cluster:
(a) from not yet assigned neighbors of a or b take each node that has minimum ncommcommon nearest neighbors with any gc 2 C ;
(b) stop when no more neighbors of a or b pass this criterion or there are no morenodes left;
4. repeat from 1 until all nodes are assigned to clusters.
After a series of tests, the value of ncomm was set to 80% of the number of the nearestneighbors of gc 2 C . The threshold, �w , is a parameter, adjustable by the user, since itdefines the “coarseness” of clustering, and the user has to decide on a more or less detaileddivision.
Apart from the nearest neighbor algorithm, we also tested a simple hierarchical merg-ing approach. This clustering is performed on the columns of AMSM, not on separate val-ues of the similarity coefficients. In the beginning, each column represents one cluster. Inevery step of the hierarchical clustering, the two clusters that have the minimal distanceare merged. The distance is calculated as a vector difference between the average vectors(columns) of each cluster. However, this type of clustering requires a number of domains tobe given as an input. There are some methods to help decide when the clustering is optimal(see e.g., Ref.173), and we plan to implement one of them in the nearest future. Althoughthe hierarchical merging clustering algorithm seems promising, we have not fully testedit, and therefore we present only the results obtained with the use of the nearest neighborclustering.
Automatic mode
The GeoStaS has an automated mode that suggests an optimal division into dynamicdomains. In this mode, an output is generated for a set of threshold values (�w : 0.3, 0.25, 0.2,0.15 and 0.1) and the associated divisions of the biomolecule are compared. The comparisonis based on the RMSD of each of the identified domains:
Rdivision =1
Nres
∑D
⟨√1
N�∑i
∣∣~xi(k) � ~xi(k=0)∣∣2 ⟩K
; (4.6)
whereNres andN are the numbers of all residues and all atoms in the molecule, respectively;D = fdjg are the domains that have more than two residues; i traverses all the atoms in thedomain dj ; ~xi(k) describes the position of atom i in the conformation k ; and h iK denotesan average over the set of conformations K = fkg. The minimal value of Rdivision gives theoptimal solution. This can be then used as a starting point for a more detailed analysis.
Implementation
We chose the Java programming language, because it enables easy implementation ofthe graphical interface, easy development, and it is independent of the operating system.

62 RESULTS AND DISCUSSION
GeoStaS processes either the text file (in the PDB format — version 3.3� or the binary file(in the DCD format, used e.g., by the popular MD softwares NAMD149 or CHARMM195).The conformations are superimposed onto the first one, in order to remove the rotation andtranslation of the molecule as a whole. The user has to choose between the automatic andmanual mode, and whether to consider only the C� atoms (or phosphorus in case of nucleicacids) or three atoms per residue (i.e., C�-C-N for proteins and P-C30-C40 for nucleic acids).There are two types of output: the raw AMSM and the PDB file with the molecule dividedinto dynamic domains.
4.1.2 Tests on experimental and computational data
The tests were performed on more than 30 conformation sets from NMR experimentsand on several trajectories from MD simulations. The results showed that GeoStaS is capa-ble of correctly identifying dynamic domains in different structures: proteins, nucleic acidsand their complexes. This is a unique feature of GeoStaS, since all of the already availablesoftware accepted only protein structures as an input. Moreover, none of the other programsis able to efficiently handle large data files such as trajectories from molecular simulations.
Figure 4.2: Visualization of the results obtained from GeoStaS, for the NMR ensemble 1D1D:(A) the atomic movement similarity matrix (AMSM), the color bars in the bottom depict whichresidues are assigned to different domains; (B) one molecular conformation colored according tothe dynamic domains found by GeoStaS, (C) the whole NMR ensemble superimposed on the bluedomain.
Experimental data
Exemplary results are presented in Figure 4.2: AMSM, and the molecule colored ac-cording to the predicted dynamic domains. The presented molecule is a Rous sarcoma viruscapsid protein (PDB id 1D1D).196 Based on the 20 NMR conformations of this molecule,GeoStaS found four domains. This agrees with the analysis of the NOE signals,196 whichidentifies the N-terminal (red and blue fragments in Figure 4.2B) and C-terminal (orangefragment) domains as moving independently. Moreover, according to the experiment, onelinker between the helices (indicated by the red arrow in Figure 4.2B) is similarly flexible asthe linker between the domains (gray arrow). Thus, the movements of the helices connectedwith this red-colored linker could differ from the movement of the rest of the N-terminalfragment.
The outcome of the analysis of the experimental data was compared with the most re-cent program, CYRANGE.186 Figure 4.3 presents the domains found by GeoStaS with the
�www.wwpdb.org/documentation/format33/v3.3.html
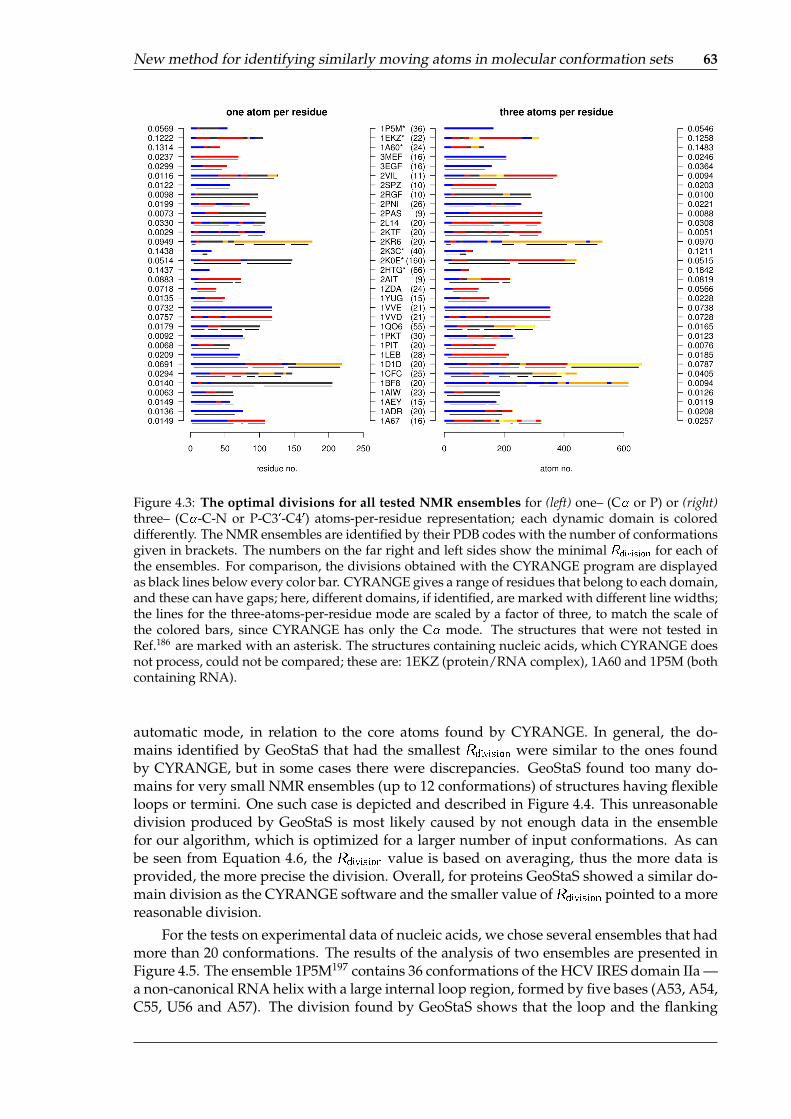
New method for identifying similarly moving atoms in molecular conformation sets 63
Figure 4.3: The optimal divisions for all tested NMR ensembles for (left) one– (C� or P) or (right)three– (C�-C-N or P-C30-C40) atoms-per-residue representation; each dynamic domain is coloreddifferently. The NMR ensembles are identified by their PDB codes with the number of conformationsgiven in brackets. The numbers on the far right and left sides show the minimal Rdivision for each ofthe ensembles. For comparison, the divisions obtained with the CYRANGE program are displayedas black lines below every color bar. CYRANGE gives a range of residues that belong to each domain,and these can have gaps; here, different domains, if identified, are marked with different line widths;the lines for the three-atoms-per-residue mode are scaled by a factor of three, to match the scale ofthe colored bars, since CYRANGE has only the C� mode. The structures that were not tested inRef.186 are marked with an asterisk. The structures containing nucleic acids, which CYRANGE doesnot process, could not be compared; these are: 1EKZ (protein/RNA complex), 1A60 and 1P5M (bothcontaining RNA).
automatic mode, in relation to the core atoms found by CYRANGE. In general, the do-mains identified by GeoStaS that had the smallest Rdivision were similar to the ones foundby CYRANGE, but in some cases there were discrepancies. GeoStaS found too many do-mains for very small NMR ensembles (up to 12 conformations) of structures having flexibleloops or termini. One such case is depicted and described in Figure 4.4. This unreasonabledivision produced by GeoStaS is most likely caused by not enough data in the ensemblefor our algorithm, which is optimized for a larger number of input conformations. As canbe seen from Equation 4.6, the Rdivision value is based on averaging, thus the more data isprovided, the more precise the division. Overall, for proteins GeoStaS showed a similar do-main division as the CYRANGE software and the smaller value of Rdivision pointed to a morereasonable division.
For the tests on experimental data of nucleic acids, we chose several ensembles that hadmore than 20 conformations. The results of the analysis of two ensembles are presented inFigure 4.5. The ensemble 1P5M197 contains 36 conformations of the HCV IRES domain IIa —a non-canonical RNA helix with a large internal loop region, formed by five bases (A53, A54,C55, U56 and A57). The division found by GeoStaS shows that the loop and the flanking
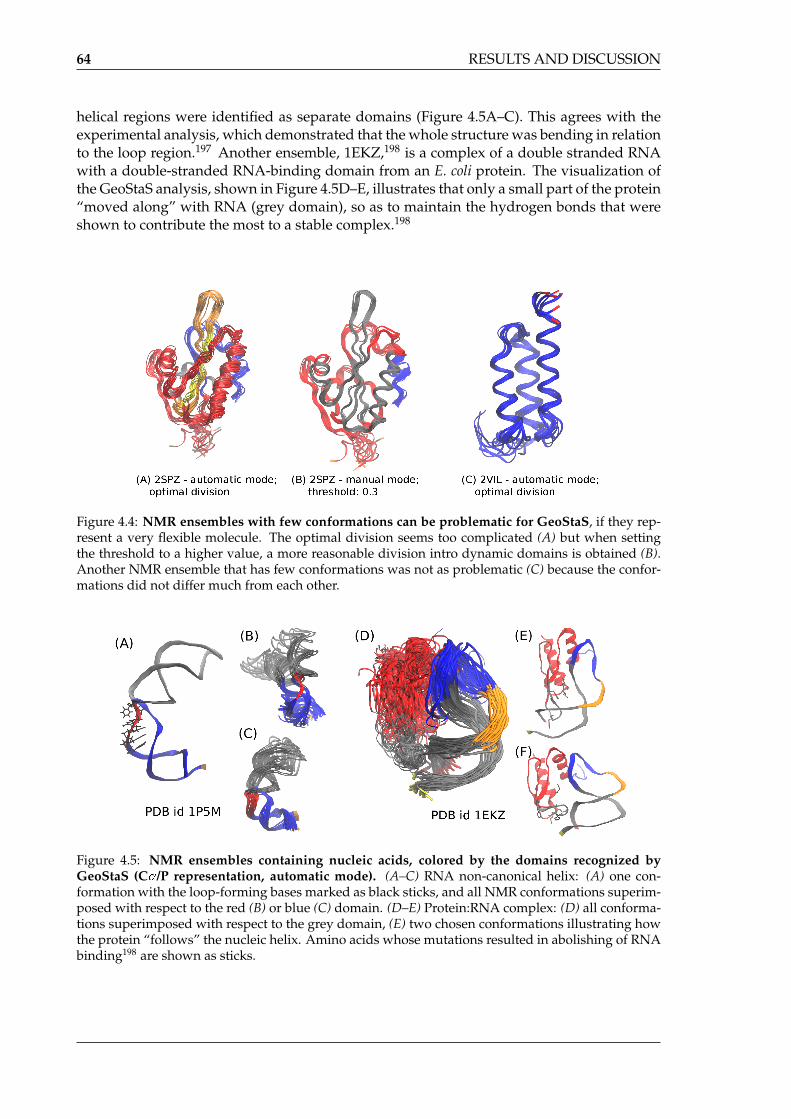
64 RESULTS AND DISCUSSION
helical regions were identified as separate domains (Figure 4.5A–C). This agrees with theexperimental analysis, which demonstrated that the whole structure was bending in relationto the loop region.197 Another ensemble, 1EKZ,198 is a complex of a double stranded RNAwith a double-stranded RNA-binding domain from an E. coli protein. The visualization ofthe GeoStaS analysis, shown in Figure 4.5D–E, illustrates that only a small part of the protein“moved along” with RNA (grey domain), so as to maintain the hydrogen bonds that wereshown to contribute the most to a stable complex.198
Figure 4.4: NMR ensembles with few conformations can be problematic for GeoStaS, if they rep-resent a very flexible molecule. The optimal division seems too complicated (A) but when settingthe threshold to a higher value, a more reasonable division intro dynamic domains is obtained (B).Another NMR ensemble that has few conformations was not as problematic (C) because the confor-mations did not differ much from each other.
Figure 4.5: NMR ensembles containing nucleic acids, colored by the domains recognized byGeoStaS (C�/P representation, automatic mode). (A–C) RNA non-canonical helix: (A) one con-formation with the loop-forming bases marked as black sticks, and all NMR conformations superim-posed with respect to the red (B) or blue (C) domain. (D–E) Protein:RNA complex: (D) all conforma-tions superimposed with respect to the grey domain, (E) two chosen conformations illustrating howthe protein “follows” the nucleic helix. Amino acids whose mutations resulted in abolishing of RNAbinding198 are shown as sticks.

New method for identifying similarly moving atoms in molecular conformation sets 65
Simulations
We aimed at facilitating the analysis of conformational changes in biomolecular simula-tions, and therefore the main tests were conducted on various trajectories obtained from MDsimulations. The first test was performed on the simulation of a GroEL chaperone monomercomplexed with ATP (Figure 4.6).199 The chaperonin GroEL is a large oligomeric protein(ca. 800 kDa) that helps fold non-native proteins in E. coli.200 After forming a complex withthe co-chaperonin GroES, it provides a protective chamber, where the substrate proteins re-gain their functional shape. During this complexation the subunits of GroEL undergo largeconformational changes, which have been extensively characterized.199, 201, 202
This analysis required using GeoStaS in the manual mode, probably due to the largesize of the system and the complexity of the movements. However, setting the thresholdto 0.05 gave an interesting division into dynamic domains, as presented in Figure 4.6B–C.Structural studies divide the GroEL monomer into three domains:201 equatorial, interme-diate, and apical, as illustrated in Figure 4.6A. The division found by GeoStaS resemblesthese structural domains, however, the apical and equatorial domains were subdivided intosmaller dynamic domains: yellow and gold fragments in the apical part, and blue, grey andred in the equatorial part. The yellow-colored dynamic domain contains helices K and L,which stay close to each other during the elevation of the apical domain while forming thechamber in the GroEL chaperone. Therefore, their movements should be slightly differentthan the movement of the rest of the apical domain. Moreover, the red-colored part of theequatorial domain consists of helices that interact with the bound ATP, which again wouldcause their movements to differ from the rest of the equatorial domain. This is again ingood agreement with previous structural studies highlighting the internal motions in theequatorial domain upon ATP binding.199, 203
We compared the similarity coefficients from our AMSM with the standard DCCM val-ues and we found some discrepancies. Figure 4.7 highlights some areas that differ betweenthese matrices. For example, AMSM showed correlations of motions of helices A, B and Cwith helix M and their anti-correlations with helices K and L, contrary to the DCCM analy-sis (area 1 in Figure 4.7). The four former helices (A, B and C from the equatorial domain,and M from the intermediate domain) move in the same direction during the first stage ofconformational changes in the GroEL cycle,202 while helices K and L, situated in the apicaldomain, move in an opposite direction during this transition. Therefore, the relations foundby AMSM seem reasonable. Moreover, helices F and G were anti-correlated with helices Qand R in DCCM, in contrast to AMSM (area 2). It has been shown that first, helices F and G(from the apical domain) approach the equatorial domain (thus also helices Q and R), inorder for the apical domain to move upwards and then to a fully opened conformation.202
Similar case is between helices N, O and helix F (area 3). Again, the relation found by AMSMseems justified.
Another test of a protein simulation was conducted on the trajectory of a bacterial elon-gation factor, EF-Tu204 (Figure 4.8). This protein complexates with GTP, and subsequentlywith aminoacylated tRNA, to deliver it to the ribosome. Next, thanks to the energy thatcomes from the GTP!GDP hydrolysis, the tRNA is released and the EF-Tu:GDP complexdissociates from the ribosome. Both, the experimental205–207 and computational studies204
showed that some parts of the protein were significantly more dynamic when GDP wasbound than without the nucleotide diphosphate — these fragments are termed switch Iand II. Our analysis correctly identified switch I as a distinct domain (colored orange inFigure 4.8B). In addition, the majority of switch II residues were assigned to a fragment ofthe red domain, which suggests that its movements differed from the movements of theneighboring residues, which were in the gray domain.
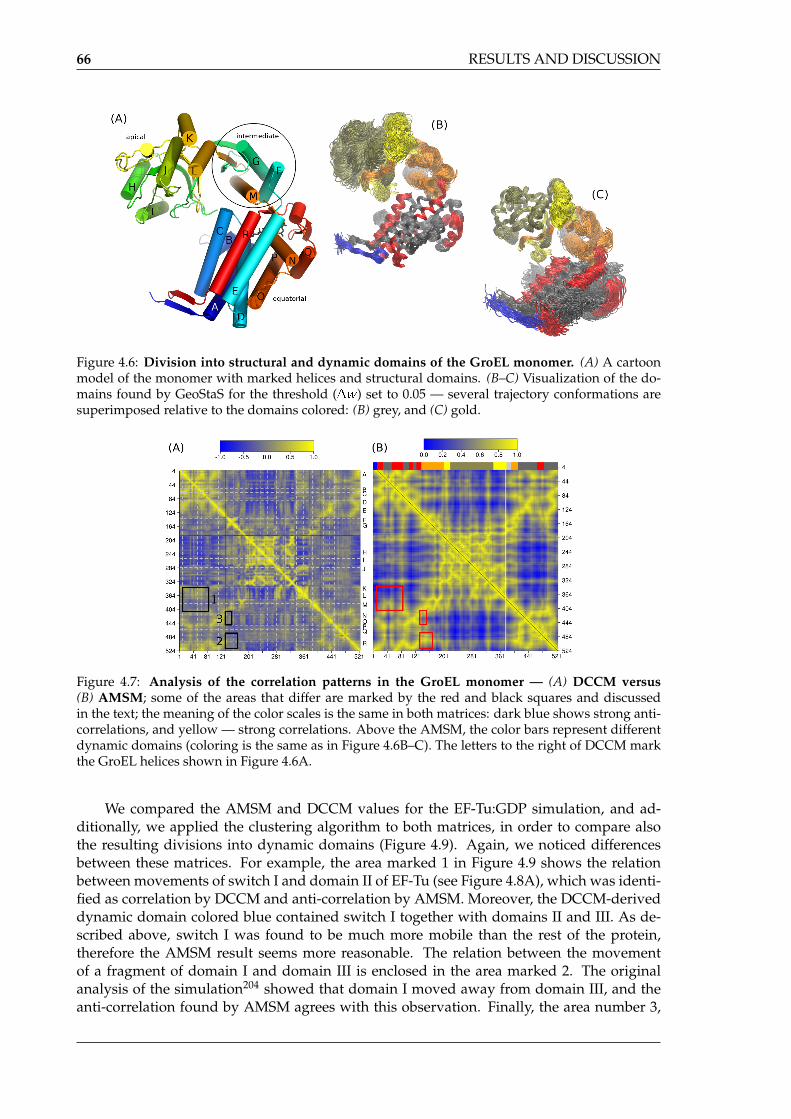
66 RESULTS AND DISCUSSION
Figure 4.6: Division into structural and dynamic domains of the GroEL monomer. (A) A cartoonmodel of the monomer with marked helices and structural domains. (B–C) Visualization of the do-mains found by GeoStaS for the threshold (�w) set to 0.05 — several trajectory conformations aresuperimposed relative to the domains colored: (B) grey, and (C) gold.
Figure 4.7: Analysis of the correlation patterns in the GroEL monomer — (A) DCCM versus(B) AMSM; some of the areas that differ are marked by the red and black squares and discussedin the text; the meaning of the color scales is the same in both matrices: dark blue shows strong anti-correlations, and yellow — strong correlations. Above the AMSM, the color bars represent differentdynamic domains (coloring is the same as in Figure 4.6B–C). The letters to the right of DCCM markthe GroEL helices shown in Figure 4.6A.
We compared the AMSM and DCCM values for the EF-Tu:GDP simulation, and ad-ditionally, we applied the clustering algorithm to both matrices, in order to compare alsothe resulting divisions into dynamic domains (Figure 4.9). Again, we noticed differencesbetween these matrices. For example, the area marked 1 in Figure 4.9 shows the relationbetween movements of switch I and domain II of EF-Tu (see Figure 4.8A), which was identi-fied as correlation by DCCM and anti-correlation by AMSM. Moreover, the DCCM-deriveddynamic domain colored blue contained switch I together with domains II and III. As de-scribed above, switch I was found to be much more mobile than the rest of the protein,therefore the AMSM result seems more reasonable. The relation between the movementof a fragment of domain I and domain III is enclosed in the area marked 2. The originalanalysis of the simulation204 showed that domain I moved away from domain III, and theanti-correlation found by AMSM agrees with this observation. Finally, the area number 3,
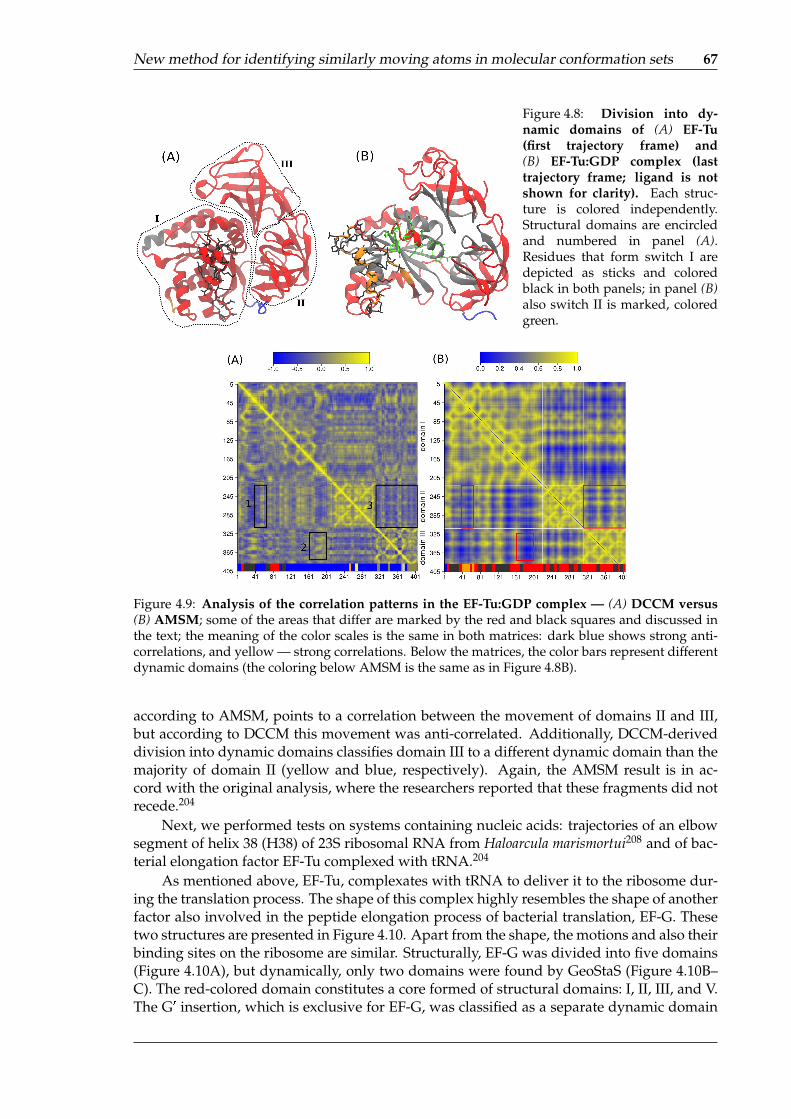
New method for identifying similarly moving atoms in molecular conformation sets 67
Figure 4.8: Division into dy-namic domains of (A) EF-Tu(first trajectory frame) and(B) EF-Tu:GDP complex (lasttrajectory frame; ligand is notshown for clarity). Each struc-ture is colored independently.Structural domains are encircledand numbered in panel (A).Residues that form switch I aredepicted as sticks and coloredblack in both panels; in panel (B)also switch II is marked, coloredgreen.
Figure 4.9: Analysis of the correlation patterns in the EF-Tu:GDP complex — (A) DCCM versus(B) AMSM; some of the areas that differ are marked by the red and black squares and discussed inthe text; the meaning of the color scales is the same in both matrices: dark blue shows strong anti-correlations, and yellow — strong correlations. Below the matrices, the color bars represent differentdynamic domains (the coloring below AMSM is the same as in Figure 4.8B).
according to AMSM, points to a correlation between the movement of domains II and III,but according to DCCM this movement was anti-correlated. Additionally, DCCM-deriveddivision into dynamic domains classifies domain III to a different dynamic domain than themajority of domain II (yellow and blue, respectively). Again, the AMSM result is in ac-cord with the original analysis, where the researchers reported that these fragments did notrecede.204
Next, we performed tests on systems containing nucleic acids: trajectories of an elbowsegment of helix 38 (H38) of 23S ribosomal RNA from Haloarcula marismortui208 and of bac-terial elongation factor EF-Tu complexed with tRNA.204
As mentioned above, EF-Tu, complexates with tRNA to deliver it to the ribosome dur-ing the translation process. The shape of this complex highly resembles the shape of anotherfactor also involved in the peptide elongation process of bacterial translation, EF-G. Thesetwo structures are presented in Figure 4.10. Apart from the shape, the motions and also theirbinding sites on the ribosome are similar. Structurally, EF-G was divided into five domains(Figure 4.10A), but dynamically, only two domains were found by GeoStaS (Figure 4.10B–C). The red-colored domain constitutes a core formed of structural domains: I, II, III, and V.The G0 insertion, which is exclusive for EF-G, was classified as a separate dynamic domain

68 RESULTS AND DISCUSSION
(colored blue) together with the flexible, solvent-exposed fragments. Almost the entire do-main IV was assigned to this blue domain, which is reasonable because this domain bendsupon binding of EF-G to the ribosome.
The division of the EF-Tu:tRNA complex is presented in Figures 4.10E–F. According tothe GeoStaS analysis, the anticodon arm of tRNA was moving separately, while the accep-tor stem together with the EF-Tu protein formed one dynamic domain (colored red). Thisresembles slightly the division of EF-G.
Figure 4.10: Comparison between the structural (panels A and D) and dynamic domains (panelsB–C and E–F) for the EF-G protein and the protein:RNA complex — EF-Tu:tRNA. In panels (C) and(F) several conformations from MD simulations are superimposed relative to the red domain. The di-vision of EF-G was calculated for the C� representation (automatic mode), while for the EF-Tu:tRNAthe presented division was for the three-atoms-per-residue representation (automatic mode).

New method for identifying similarly moving atoms in molecular conformation sets 69
Figure 4.11: Division into dynamic domains found by GeoStaS for the simulation of H38 frag-ment. (A) Initial structure of the H38 kink-turn region; the backbone is colored according to theoptimal division into dynamic domains found by GeoStaS with the one-atom-per-residue represen-tation. Snapshots from the simulation are superimposed with regard to the domain colored (B) redor (C) orange, to emphasize the movements observed in the trajectory.
The last case presented here is the analysis of the simulation of a H38 RNA fragmentfrom the bacterial ribosome.208 This RNA fragment forms a kink-turn motif, which is com-monly found in ribosomal RNA structures. The kink-turns are very dynamic, often initiatinglarge conformational changes.209 The dynamic domains found by GeoStaS show exactly thishigh flexibility, as visualized in Figure 4.11. The H38 kink-turn fragment is divided into fourparts, which emphasizes two types of motion: the bending mode, which changes the anglebetween the flanking helices, and the breathing mode of the helical parts. The same conclu-sions were drawn in the original paper,208 albeit only after many measurements of distancesand angles between the two strands. Our analysis simplifies this process.
4.1.3 Summary
We have presented an algorithm, GeoStaS, for dividing a molecule into dynamic do-mains based on its conformations. The novelty of this algorithm is its focus on geometriccomparison of the atom traces, which enables analysis of any set of conformations, regard-less of their order. Additionally, this approach properly recognizes all types of movementsimilarities, including rotational correlations. The algorithm was implemented in a graph-ical software, which has a minimal number of parameters and automatically suggests anoptimal solution. We have shown that with GeoStaS the analysis of internal molecular mo-tions can be simple. The software deals well with large datasets from simulations of variousbiomolecules, including proteins, nucleic acids and their complexes. The resulting divisioninto dynamic domains helps describe the changes between subsequent conformations. Weshowed that GeoStaS is able to identify the correlated vs. anti-correlated motions better thanthe standard cross-correlation matrix, because of accounting also for rotational correlations.
The algorithm presented here is generic because it can deal with any objects that arecomparable through geometric transformations. Therefore, not only conformations of onemolecule can be analyzed but also, for example, conformations of its mutated variants.Moreover, the outcome of the analysis can have different applications, such as for gener-ating different conformations for flexible docking procedures or fitting a model into lowresolution microscopy maps.

70 RESULTS AND DISCUSSION
4.2 Bacterial resistance mechanism 1: ribosomal RNA A-site
mutations
The two following sections describe the part of the research that focused on the twobacterial resistance mechanisms, namely the modifications of bases in the primary amino-glycoside binding site, the 16S rRNA A-site, and the production of the enzymes that chemi-cally alter aminoglycosides. First, we describe the results from our simulations of the A-sitemodels with different mutations, with and without paromomycin.
4.2.1 Conformations of bound paromomycin
To investigate the conformations that paromomycin adopts when bound to the mutatedA-site, we calculated the �= dihedral angles of paromomycin’s linkages, as described inSection 3.3.2 Parameterization validation. Figure 4.12 presents the �= conformations of par-omomycin in different A-site models. In the WT A-site, paromomycin adopted a conforma-tion that was also the most frequently sampled one in solution (compare Figure 4.12, top,with Figure 3.4E–G). Moreover, this conformation did not change when paromomycin com-plexated with the mutated RNA structures. Upon binding to different rRNA molecules,the mobility of all three linkages of paromomycin was only restrained to the region mostpopulated in water. The most flexible part of paromomycin was the ring IV, which pro-trudes from the A-site. Only in the G1491A and U1406C/U1495A simulations, this ring wasslightly more mobile than in the other simulations of the complexes.
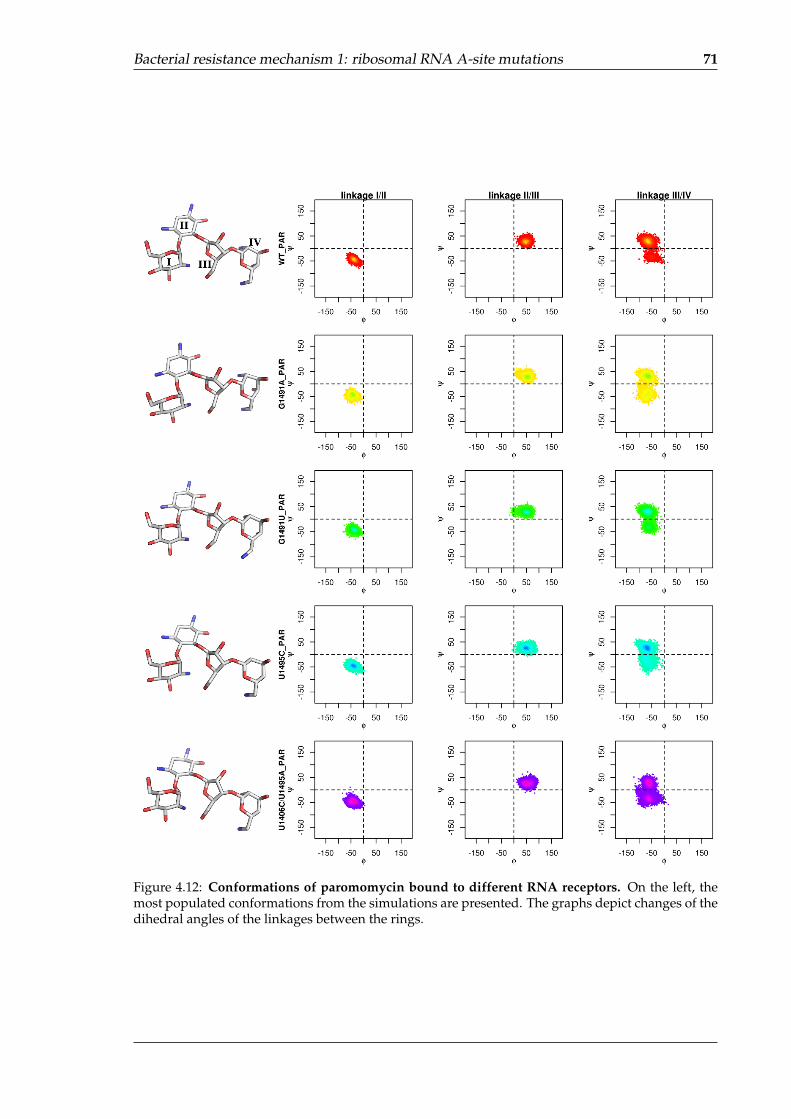
Bacterial resistance mechanism 1: ribosomal RNA A-site mutations 71
Figure 4.12: Conformations of paromomycin bound to different RNA receptors. On the left, themost populated conformations from the simulations are presented. The graphs depict changes of thedihedral angles of the linkages between the rings.
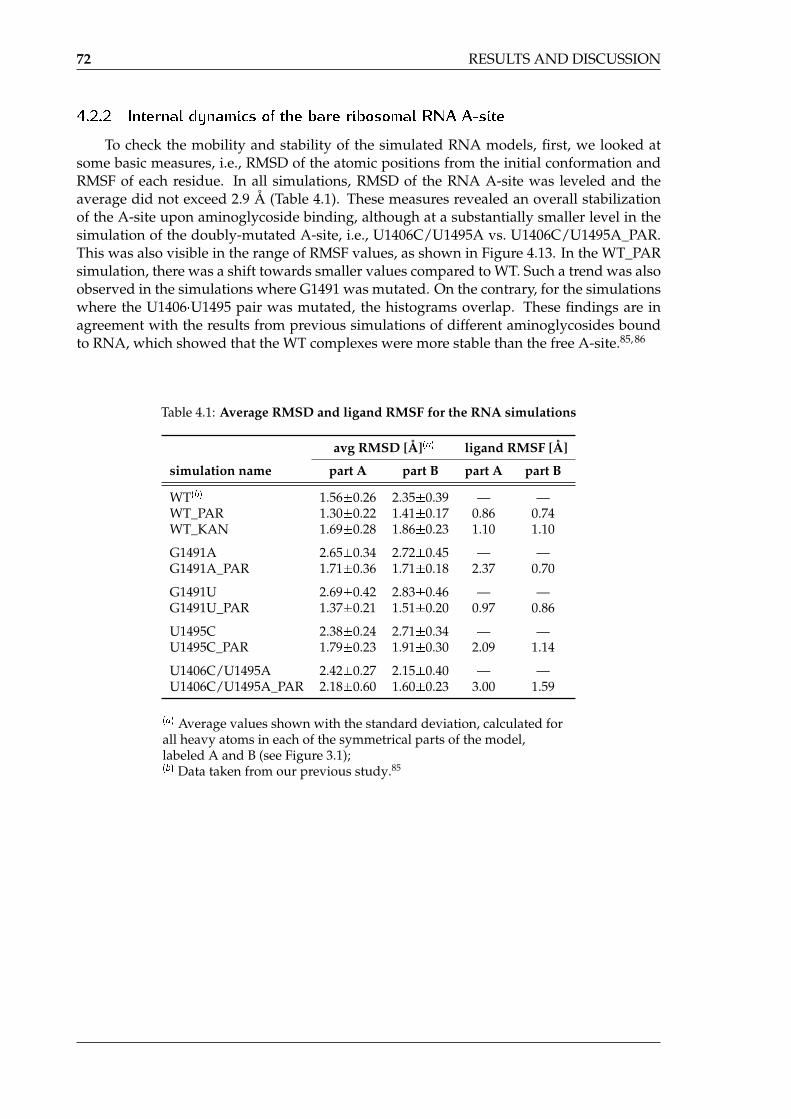
72 RESULTS AND DISCUSSION
4.2.2 Internal dynamics of the bare ribosomal RNA A-site
To check the mobility and stability of the simulated RNA models, first, we looked atsome basic measures, i.e., RMSD of the atomic positions from the initial conformation andRMSF of each residue. In all simulations, RMSD of the RNA A-site was leveled and theaverage did not exceed 2.9 Å (Table 4.1). These measures revealed an overall stabilizationof the A-site upon aminoglycoside binding, although at a substantially smaller level in thesimulation of the doubly-mutated A-site, i.e., U1406C/U1495A vs. U1406C/U1495A_PAR.This was also visible in the range of RMSF values, as shown in Figure 4.13. In the WT_PARsimulation, there was a shift towards smaller values compared to WT. Such a trend was alsoobserved in the simulations where G1491 was mutated. On the contrary, for the simulationswhere the U1406�U1495 pair was mutated, the histograms overlap. These findings are inagreement with the results from previous simulations of different aminoglycosides boundto RNA, which showed that the WT complexes were more stable than the free A-site.85, 86
Table 4.1: Average RMSD and ligand RMSF for the RNA simulations
avg RMSD [Å](a) ligand RMSF [Å]
simulation name part A part B part A part B
WT(b) 1.56�0.26 2.35�0.39 — —WT_PAR 1.30�0.22 1.41�0.17 0.86 0.74WT_KAN 1.69�0.28 1.86�0.23 1.10 1.10
G1491A 2.65�0.34 2.72�0.45 — —G1491A_PAR 1.71�0.36 1.71�0.18 2.37 0.70
G1491U 2.69�0.42 2.83�0.46 — —G1491U_PAR 1.37�0.21 1.51�0.20 0.97 0.86
U1495C 2.38�0.24 2.71�0.34 — —U1495C_PAR 1.79�0.23 1.91�0.30 2.09 1.14
U1406C/U1495A 2.42�0.27 2.15�0.40 — —U1406C/U1495A_PAR 2.18�0.60 1.60�0.23 3.00 1.59
(a) Average values shown with the standard deviation, calculated forall heavy atoms in each of the symmetrical parts of the model,labeled A and B (see Figure 3.1);(b) Data taken from our previous study.85
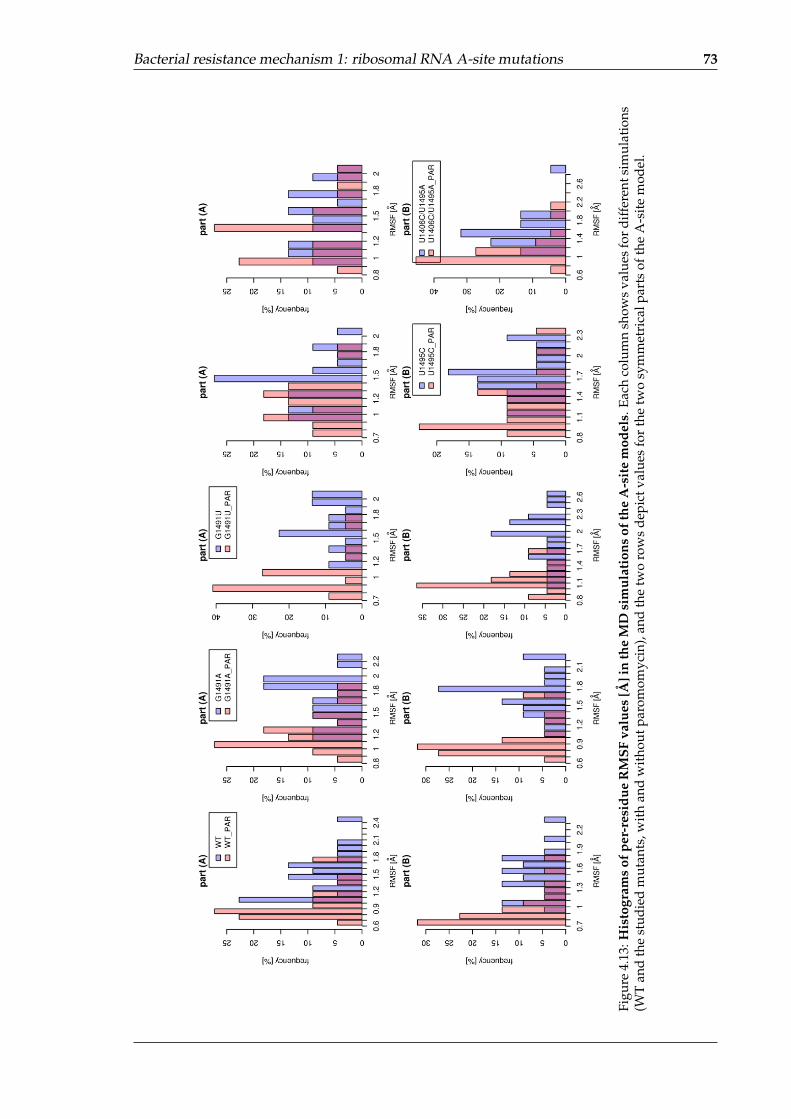
Bacterial resistance mechanism 1: ribosomal RNA A-site mutations 73
Figu
re4.
13:H
isto
gram
sof
per-
resi
due
RM
SFva
lues
[Å]i
nth
eM
Dsi
mul
atio
nsof
the
A-s
ite
mod
els.
Each
colu
mn
show
sva
lues
for
diff
eren
tsim
ulat
ions
(WT
and
the
stud
ied
mut
ants
,wit
han
dw
itho
utpa
rom
omyc
in),
and
the
two
row
sde
pict
valu
esfo
rth
etw
osy
mm
etri
calp
arts
ofth
eA
-sit
em
odel
.

74 RESULTS AND DISCUSSION
Monitoring hydrogen bonds in base pairs
To investigate the source of the observed differences in the RMSF ranges (Figure 4.13),we monitored each of the bases and base pairs in the simulations of the mutated structureswithout paromomycin. Figure 4.14 depicts the number of hydrogen bonds formed withineach base pair for three simulations: WT, G1491A, and U1406C/U1495A. We found thatsome base pairs were unstable in the simulations G1491A, G1491U, and U1406C/U1495A.Specifically, it appears that the double mutation did not provide enough stability for thenewly formed 1406C:1495A base pair, while the mutations of G1491 were causing disrup-tion of its pairing with the opposite RNA strand. In addition, we noticed that the bulgedadenines, A1492 and A1493, formed hydrogen bonds with the opposite A1408 more oftenin the structures with mutated base G1491 than in the remaining ones. These observationsare discussed in details below.
Figure 4.14: The number of hydrogen bonds in base pairs versus simulation time for selectedsimulations. The base pairs with mutated bases are marked red and the number of hydrogen bondsis depicted in grayscale code.
Stability of the U1406�U1495 pair is disrupted upon mutations
Previous studies have suggested that the stability of the U1406�U1495 base pair influ-ences the stability of the entire A-site.45, 84 Our simulations suggest that the double mutation(U1406C/U1495A) significantly interfered with the stability of this base pair. In the X-raystructure of the WT A-site (1J7T), the U�U pair is formed by two hydrogen bonds, which wasalso reproduced in our WT simulation, as shown in Figure 4.14A. In the doubly-mutated A-site, the resulting C:A pair shared maximally one hydrogen bond (Figure 4.14C). The struc-tures with neither of the uridines mutated preserved the wild type-like geometry of theU1406�U1495 pair with two hydrogen bonds, as presented in Figure 4.14B for the G1491A

Bacterial resistance mechanism 1: ribosomal RNA A-site mutations 75
Figure 4.15: Conformations of theU1406�U1495 pair and its mutated al-ternatives observed in the simulationsof the bare A-site models. The distri-bution of charges changed upon mu-tations — negatively charged moietiesare marked with red circles, positivelycharged ones are marked with bluesquares. [Figure taken from our published re-sults211]
simulation. In the U1495C structure, the resulting base pair (U1406:1495C) was formed withtwo or even three hydrogen bonds (data not shown). In summary, bases 1406 and 1495formed a pair for the majority of the simulation time in all simulations (Table 4.2); however,the geometry and hydrogen bonding strength of this pair varied. Figure 4.15 compares thedifferent base pairing observed for U1406�U1495 in the WT and mutated structures. In theWT simulation, the U1406�U1495 base pair adopted a stable conformation with two hydro-gen bonds (Figure 4.15A). The double mutation (U1406C/U1495A) resulted in a less stableC:A pair, which often adopted an experimentally observed conformationy (Figure 4.15B).However, sometimes the mutated 1406C base rotated to an almost perpendicular positionrelative to the other base (Figure 4.15C), which indicates a weak hydrogen bonding. We didnot observe such a behavior in any other simulation. For the majority of the U1495C sim-ulation time, the conformation of the U:C pair resembled a well-known 4-carbonyl-aminopattern127 (also called cis W.C./W.C.;210 depicted in Figure 4.15D). Sometimes a differenthydrogen bonding pattern occurred, as illustrated in Figure 4.15E.
In the U1406C/U1495A structure, upon the change of base 1495 from a smaller pyrim-idine (uracil) to a larger purine (adenine), the shape of the base pair was disrupted andduring the simulation the adenine was situated more towards the aminoglycoside bindingsite than the uracil in the wild type structure. This change in the 1406C�1495A pair geometrymay hinder paromomycin binding through steric clashes. However, it did not influence theoverall stability of the A-site model, which is in agreement with previous study.34 Only themobility of the A1492 and A1493 has been affected, as discussed below.
Importantly, also the charge distribution was altered upon mutations within theU1406�U1495 pair, as can be seen in Figure 4.15. In the WT structure, these two uracils pro-vide negatively charged C=O moieties that form hydrogen bonds with aminoglycosides.The double mutation deletes this negative potential completely, while the U1495C substitu-tion provides only one of the original moieties. Therefore, even if the geometry of the basepair was not altered, the change in the charge distribution could hinder forming of hydrogenbonds with an aminoglycoside binding to this site.
yAs reported in the Database of RNA base pair structures: http://bps.rutgers.edu/atlas/bppattern/ac_5

76 RESULTS AND DISCUSSION
Substitutions of base G1491 cause a shift in base-pairing
Another disruption in base pairing pattern involves G1491 in the simulations where itwas mutated to either 1491A or 1491U. Table 4.2 compares the duration of base pair form-ing for the relevant simulations. During the WT simulation, the G1491:C1409 base pair wasstable, forming three hydrogen bonds in both parts of the structure almost throughout thesimulation time (see Figure 4.14A). Introducing the mutation resulted in a poorly boundpair throughout the G1491A simulation, as was shown in Figure 4.14B, and even less stablein G1491U. The visualization of trajectories showed a shift in the base pairing pattern (Fig-ure 4.16), where some bases were in the flipped out position (1491A in Figure 4.16B or C1409and A1410 in Figure 4.16C). Due to the intrinsic flexibility of RNA such changes occur rel-atively often212 and we observed a similar shift in our previous study.85 Results presentedherein suggest that the different base pair pattern resulted in a change of the binding cleft’sshape (described below).
Table 4.2: Base pairing in the RNA simulations
duration of pairing [%]
base pairs # G1491A G1491U U1495C U1406C/U1495A WT(a)
1406 :(b) 1495(c) 100 99 98 99 81 84 89 90 96 97
A1408 : A1492 6 1 4 2 0 15 2 0 0 9A1493 49 36 47 25 6 24 0 0 50 25
C1409 : 1491(d) 29 34 16 21 not applicable 100 100A1492 32 16 18 10 not applicable
Percentage of simulation time when the base pairs were formed (i.e., at least one hydrogen bondwas present). Two values are shown for each simulation corresponding to two A-sites in the model.(a) data from our previous study;85
(b) this base is U in G1491A, G1491U, WT and U1495C; and C in U1406C/U1495A simulation;(c) this base is U in G1491A, G1491U and WT; C in U1495C; and A in U1406C/U1495A simulation;(d) this base is A in G1491A, U in G1491U, and C in the other simulations.
Figure 4.16: Shift of base pairing pattern observed in some RNA simulations.
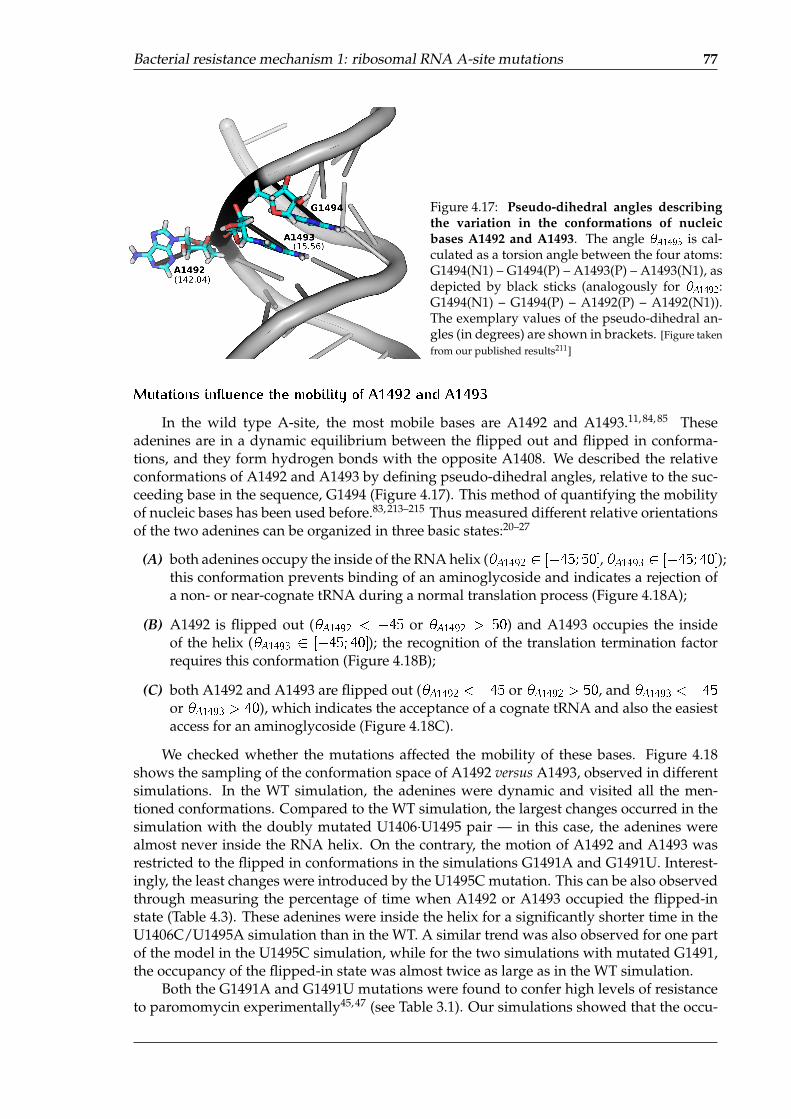
Bacterial resistance mechanism 1: ribosomal RNA A-site mutations 77
Figure 4.17: Pseudo-dihedral angles describingthe variation in the conformations of nucleicbases A1492 and A1493. The angle �A1493 is cal-culated as a torsion angle between the four atoms:G1494(N1) – G1494(P) – A1493(P) – A1493(N1), asdepicted by black sticks (analogously for �A1492:G1494(N1) – G1494(P) – A1492(P) – A1492(N1)).The exemplary values of the pseudo-dihedral an-gles (in degrees) are shown in brackets. [Figure takenfrom our published results211]
Mutations in uence the mobility of A1492 and A1493
In the wild type A-site, the most mobile bases are A1492 and A1493.11, 84, 85 Theseadenines are in a dynamic equilibrium between the flipped out and flipped in conforma-tions, and they form hydrogen bonds with the opposite A1408. We described the relativeconformations of A1492 and A1493 by defining pseudo-dihedral angles, relative to the suc-ceeding base in the sequence, G1494 (Figure 4.17). This method of quantifying the mobilityof nucleic bases has been used before.83, 213–215 Thus measured different relative orientationsof the two adenines can be organized in three basic states:20–27
(A) both adenines occupy the inside of the RNA helix (�A1492 2 [�45; 50], �A1493 2 [�45; 40]);this conformation prevents binding of an aminoglycoside and indicates a rejection ofa non- or near-cognate tRNA during a normal translation process (Figure 4.18A);
(B) A1492 is flipped out (�A1492 < �45 or �A1492 > 50) and A1493 occupies the insideof the helix (�A1493 2 [�45; 40]); the recognition of the translation termination factorrequires this conformation (Figure 4.18B);
(C) both A1492 and A1493 are flipped out (�A1492 < �45 or �A1492 > 50, and �A1493 < �45or �A1493 > 40), which indicates the acceptance of a cognate tRNA and also the easiestaccess for an aminoglycoside (Figure 4.18C).
We checked whether the mutations affected the mobility of these bases. Figure 4.18shows the sampling of the conformation space of A1492 versus A1493, observed in differentsimulations. In the WT simulation, the adenines were dynamic and visited all the men-tioned conformations. Compared to the WT simulation, the largest changes occurred in thesimulation with the doubly mutated U1406�U1495 pair — in this case, the adenines werealmost never inside the RNA helix. On the contrary, the motion of A1492 and A1493 wasrestricted to the flipped in conformations in the simulations G1491A and G1491U. Interest-ingly, the least changes were introduced by the U1495C mutation. This can be also observedthrough measuring the percentage of time when A1492 or A1493 occupied the flipped-instate (Table 4.3). These adenines were inside the helix for a significantly shorter time in theU1406C/U1495A simulation than in the WT. A similar trend was also observed for one partof the model in the U1495C simulation, while for the two simulations with mutated G1491,the occupancy of the flipped-in state was almost twice as large as in the WT simulation.
Both the G1491A and G1491U mutations were found to confer high levels of resistanceto paromomycin experimentally45, 47 (see Table 3.1). Our simulations showed that the occu-
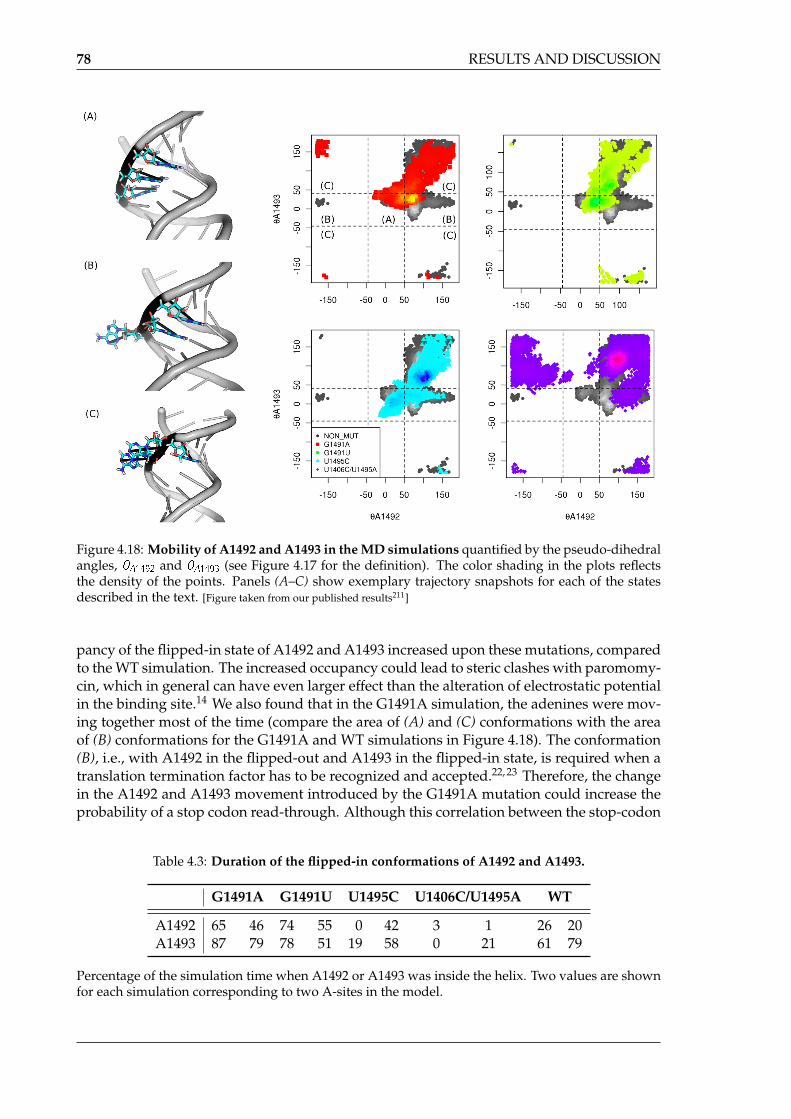
78 RESULTS AND DISCUSSION
Figure 4.18: Mobility of A1492 and A1493 in the MD simulations quantified by the pseudo-dihedralangles, �A1492 and �A1493 (see Figure 4.17 for the definition). The color shading in the plots reflectsthe density of the points. Panels (A–C) show exemplary trajectory snapshots for each of the statesdescribed in the text. [Figure taken from our published results211]
pancy of the flipped-in state of A1492 and A1493 increased upon these mutations, comparedto the WT simulation. The increased occupancy could lead to steric clashes with paromomy-cin, which in general can have even larger effect than the alteration of electrostatic potentialin the binding site.14 We also found that in the G1491A simulation, the adenines were mov-ing together most of the time (compare the area of (A) and (C) conformations with the areaof (B) conformations for the G1491A and WT simulations in Figure 4.18). The conformation(B), i.e., with A1492 in the flipped-out and A1493 in the flipped-in state, is required when atranslation termination factor has to be recognized and accepted.22, 23 Therefore, the changein the A1492 and A1493 movement introduced by the G1491A mutation could increase theprobability of a stop codon read-through. Although this correlation between the stop-codon
Table 4.3: Duration of the flipped-in conformations of A1492 and A1493.
G1491A G1491U U1495C U1406C/U1495A WT
A1492 65 46 74 55 0 42 3 1 26 20A1493 87 79 78 51 19 58 0 21 61 79
Percentage of the simulation time when A1492 or A1493 was inside the helix. Two values are shownfor each simulation corresponding to two A-sites in the model.

Bacterial resistance mechanism 1: ribosomal RNA A-site mutations 79
read-through and the G1491A mutation was previously reported,216 our simulations pro-vide the first mechanistic insight and propose an explanation of this event.
Moreover, A1492 and A1493 occupied the inside of the RNA helix for a longer timein the G1491A simulation than in G1491U. However, their mobility is required during thenormal translation process. Thus, this restraining may lead to worse “fitness” of bacteriapossessing a G1491A substitution, and explain why the mutation G1491U is more evolu-tionary profitable, as was proposed earlier.51
4.2.3 Shapes and sizes of aminoglycoside binding pockets in RNA
Mutations of G1491 in uenced the shape of RNA binding site
The observed shifts of the base pairing pattern in the RNA A-site can potentially in-fluence the volume and shape of the aminoglycoside binding site. The pocket boundariescan be easily identified in proteins, where they often form deep cavities on a surface ofa globular-shaped molecule. Contrary, the binding cleft in the RNA does not have clearboundaries. Nucleic acid helices have naturally long and wide cavities, called minor andmajor grooves, and the area of the binding cleft depends on the aminoglycoside. Thus,to describe the A-site binding pocket, we measured several distances between the atomspointing to the inside of the helix. Figure 4.19 shows the representative conformations ofthe A-site pockets, together with the relevant intramolecular distances.
In comparison with the WT simulation, the mutations of G1491 changed the shape ofthe cleft — it was more compact even though the bases A1492 and A1493 moved to theflipped-in state in all three simulations (WT, G1491A, and G1491U). As can be seen, thischange in shape was caused by a shift of the base pairing and twisting of base 1491. In thestructures with mutations in the U1406�U1495 pair, the conformations of the two adenineswere mostly flipped-out and led to a more open binding cleft.
Previous experimental studies hypothesized that the bonds formed between an amino-glycoside and a G1491A mutated A-site were weaker than in the native complex due to theless nucleophilic nature of an adenine than that of a guanine.42 However, our results pointto a different explanation, where an antibiotic could have difficulty fitting into the mutatedbinding site because of the apparent change in the shape of the cleft.

80 RESULTS AND DISCUSSION
Figure4.19:C
onformations
ofbases
forming
theA
-sitetaken
fromthe
mostpopulated
clustersin
eachsim
ulation;the
distancesbetw
eenthe
chosenatom
sare
labeled.

Bacterial resistance mechanism 1: ribosomal RNA A-site mutations 81
4.2.4 The U1406C/U1495A mutation changes the charge distributioninside the A-site
Aminoglycosides require a specific electrostatic potential inside a binding site becausethe majority of the interactions they form are of electrostatic nature.11, 217 We monitored thedistribution of sodium ions in our simulations of the bare A-site models to investigate thechange in the electrostatic potential of the paromomycin binding site, and to seek for anychanges in the distribution upon mutations.
Previously it was observed that in the WT A-site model, the sodium ions gathered closeto the phosphate groups of A1492 and A1493, and also in the position of the N3 group of par-omomycin from the complex.85 The mutations of G1491 made the ions gather slightly closerto the phosphate group of A1493 (by approximately 2 Å; Figure 4.20A–B). This indicatedonly a small change in the electrostatic potential, most likely caused by the two adenines be-ing in the flipped-in state for a longer period of time than in WT type A-site. In the U1495Csimulation, the area of maximal ion density was shifted � 3 Å towards the major groove,while the double mutation U1406C/U1495A caused the sodium ions to gather outside of thebinding site (Figure 4.20C–D). Since the ion density areas were not present close to the phos-phate groups of A1492 and A1493, an aminoglycoside would have difficulties recognizingthe doubly mutated A-site as its binding site. This corroborates with previous studies,45, 85
which showed that the negatively charged groups of the U1406�U1495 pair were importantfor forming a complex with an aminoglycoside.
Figure 4.20: Areas of high sodium ion density in the free A-site models: (A)–(C) > 0:066 ionsper Å3, (D) > 0:055 ions per Å3; violet areas present the data from the WT simulation, and greenareas — from the simulations of the mutated structures. The superimposed position of paromomycinis shown for clarity. Only the 1406, U1495, A1408, A1492, and A1493 bases are shown in atomicdetails. Hydrogen atoms were not shown for clarity of the image. [Figure taken from our published results211]
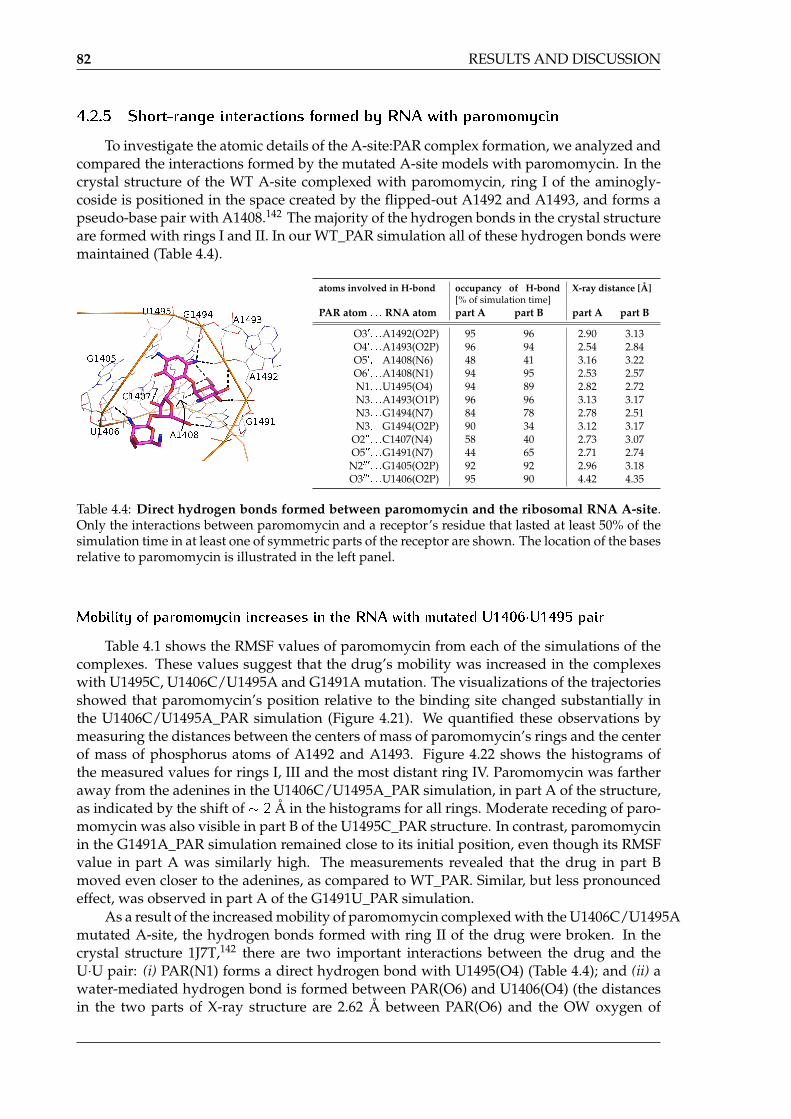
82 RESULTS AND DISCUSSION
4.2.5 Short-range interactions formed by RNA with paromomycin
To investigate the atomic details of the A-site:PAR complex formation, we analyzed andcompared the interactions formed by the mutated A-site models with paromomycin. In thecrystal structure of the WT A-site complexed with paromomycin, ring I of the aminogly-coside is positioned in the space created by the flipped-out A1492 and A1493, and forms apseudo-base pair with A1408.142 The majority of the hydrogen bonds in the crystal structureare formed with rings I and II. In our WT_PAR simulation all of these hydrogen bonds weremaintained (Table 4.4).
atoms involved in H-bond occupancy of H-bond[% of simulation time]
X-ray distance [Å]
PAR atom : : : RNA atom part A part B part A part B
O30: : :A1492(O2P) 95 96 2.90 3.13O40: : :A1493(O2P) 96 94 2.54 2.84O50: : :A1408(N6) 48 41 3.16 3.22O60: : :A1408(N1) 94 95 2.53 2.57N1: : :U1495(O4) 94 89 2.82 2.72N3: : :A1493(O1P) 96 96 3.13 3.17N3: : :G1494(N7) 84 78 2.78 2.51N3: : :G1494(O2P) 90 34 3.12 3.17
O200: : :C1407(N4) 58 40 2.73 3.07O500: : :G1491(N7) 44 65 2.71 2.74N2000: : :G1405(O2P) 92 92 2.96 3.18O3000: : :U1406(O2P) 95 90 4.42 4.35
Table 4.4: Direct hydrogen bonds formed between paromomycin and the ribosomal RNA A-site.Only the interactions between paromomycin and a receptor’s residue that lasted at least 50% of thesimulation time in at least one of symmetric parts of the receptor are shown. The location of the basesrelative to paromomycin is illustrated in the left panel.
Mobility of paromomycin increases in the RNA with mutated U1406�U1495 pair
Table 4.1 shows the RMSF values of paromomycin from each of the simulations of thecomplexes. These values suggest that the drug’s mobility was increased in the complexeswith U1495C, U1406C/U1495A and G1491A mutation. The visualizations of the trajectoriesshowed that paromomycin’s position relative to the binding site changed substantially inthe U1406C/U1495A_PAR simulation (Figure 4.21). We quantified these observations bymeasuring the distances between the centers of mass of paromomycin’s rings and the centerof mass of phosphorus atoms of A1492 and A1493. Figure 4.22 shows the histograms ofthe measured values for rings I, III and the most distant ring IV. Paromomycin was fartheraway from the adenines in the U1406C/U1495A_PAR simulation, in part A of the structure,as indicated by the shift of � 2 Å in the histograms for all rings. Moderate receding of paro-momycin was also visible in part B of the U1495C_PAR structure. In contrast, paromomycinin the G1491A_PAR simulation remained close to its initial position, even though its RMSFvalue in part A was similarly high. The measurements revealed that the drug in part Bmoved even closer to the adenines, as compared to WT_PAR. Similar, but less pronouncedeffect, was observed in part A of the G1491U_PAR simulation.
As a result of the increased mobility of paromomycin complexed with the U1406C/U1495Amutated A-site, the hydrogen bonds formed with ring II of the drug were broken. In thecrystal structure 1J7T,142 there are two important interactions between the drug and theU�U pair: (i) PAR(N1) forms a direct hydrogen bond with U1495(O4) (Table 4.4); and (ii) awater-mediated hydrogen bond is formed between PAR(O6) and U1406(O4) (the distancesin the two parts of X-ray structure are 2.62 Å between PAR(O6) and the OW oxygen of

Bacterial resistance mechanism 1: ribosomal RNA A-site mutations 83
water molecules W8 or W54; and 2.59 and 2.41 Å between W8(OW) and W54(OW), respec-tively, and U1406(O4)). These two interactions were maintained throughout our WT_PARsimulation. Moreover, in one part of the simulated structure, a direct hydrogen bond wasformed between PAR(O6) and U1406(O4) towards the end of the simulation (i.e., after ca. 11and 14 ns in two parts of the structure, respectively). Similar behavior was observed inthe G1491A_PAR simulation (Figure 4.23A–B). In contrast, in the simulation of the doublymutated complex, paromomycin did not form any hydrogen bonds with 1495A and the in-teraction with 1406C was formed sporadically (Figure 4.23C–E). As shown earlier, duringthe U1406C/U1495A_PAR simulation, the drug changed its position relative to the bindingsite, thus a different hydrogen bond was formed (Figure 4.23F), which led to destabilizationof the mutated base pair.
Our results demonstrated that the U1495C mutation exhibited smaller effect on paro-momycin binding than the U1406C/U1495A substitution, which is in agreement with theexperimental studies that showed the MIC values for bacteria possessing different muta-tions44, 45 (see Table 1.1). Hobbie et al. examined also the U1406C/U1495G mutation, whichdisrupts the base pair geometry and maintains only the negative charge of base 1495. Sur-prisingly, this substitution did not lead to significant rise in the MIC values, in contrast tothe other two mentioned mutations (see Table 1.1). Therefore, it seems like the negativecharge provided by the base in position 1495 is more important than the charge of the basein position 1406 or even than the geometry of this base pair.
Figure 4.21: Change in paromomycin’s conformation in the A-site upon some mutations. Thestructure with the double mutation U1406C/U1495A did not form a stably bound complex (compare(A) with (B)), but also in one part of G1491A mutated A-site the drug changed its conformation (C).[Figure taken from our published results211]
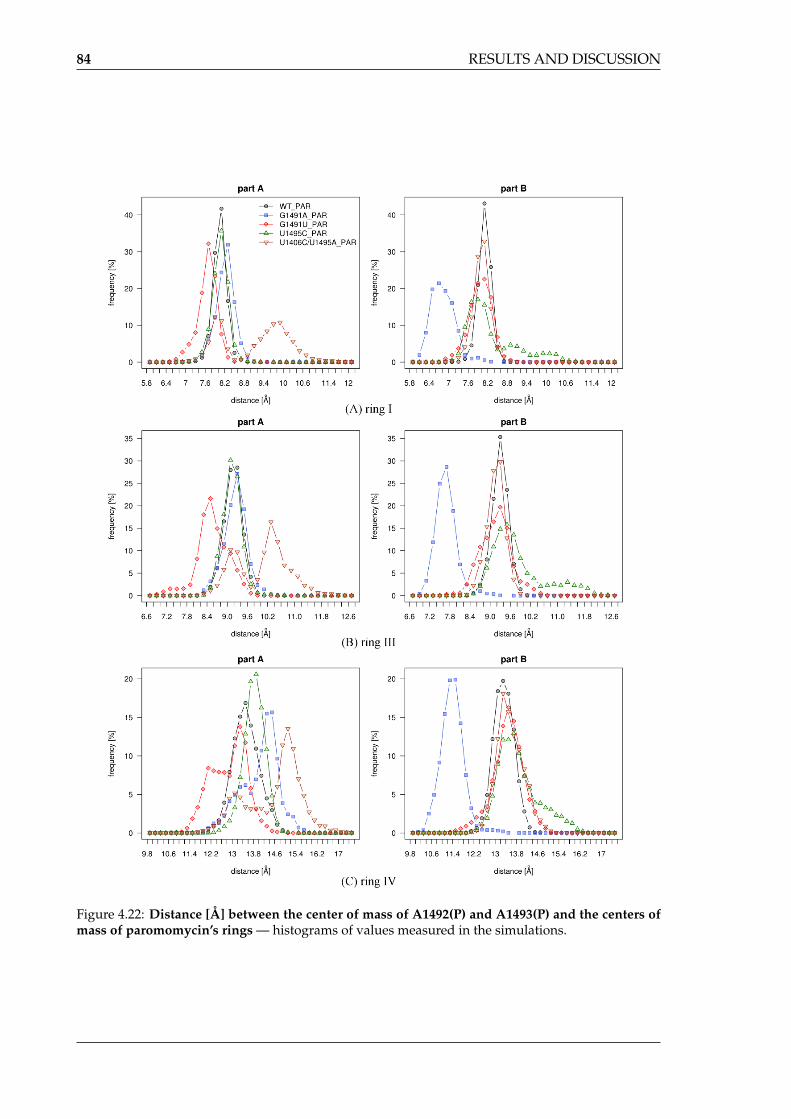
84 RESULTS AND DISCUSSION
Figure 4.22: Distance [Å] between the center of mass of A1492(P) and A1493(P) and the centers ofmass of paromomycin’s rings — histograms of values measured in the simulations.

Bacterial resistance mechanism 1: ribosomal RNA A-site mutations 85
Figure 4.23: Hydrogen bonds formed between ring II of paromomycin and RNA. Distances be-tween the atoms of the U1406�U1495 pair and paromomycin as a function of the simulation timealong with the trajectory snapshots labeling the measured distances. Data taken from simulations(A)–(B) G1491A_PAR and (C)–(F) U1406C/U1495A_PAR. Two plots depict values for the two A-sitesof the model. [Figure taken from our published results211]

86 RESULTS AND DISCUSSION
Figure 4.24: Representative structures of clusters from the MD simulations of A-site:PAR com-plexes, superimposed with regard to the phosphorous atoms. Structures from each cluster are col-ored differently: 1 — green, 2 — blue, 3 — red, 4 — yellow, 5 — cyan. Only paromomycin and basesA1492, A1493, and A1408 are shown in atomic detail. [Figure taken from our published results211]
Range of movement of A1492 and A1493 is increased in the complexes of mutated RNA
A-site
These differences in stability of the complexes can be further strengthened by visual-ization of the clustering of conformations from the MD simulations (Figure 4.24). All sim-ulations of the mutated structures allowed for a wider range of movement of A1492 andA1493 than WT_PAR. Especially in U1495C_PAR and U1406C/U1495A_PAR, the adenineswere much closer to the flipped in state. It has been suggested that the effectiveness ofaminoglycosides is correlated with the restriction of A1492 and A1493 to their flipped-outpositions,20, 218 and therefore, the visible widening of the range of their movement in thesimulations of mutated complexes versus the WT is in agreement with this hypothesis.
Experiments performed on the eukaryotic A-site with the A1491G substitution15 demon-strated a minor decrease in the translation error frequency, while the presence of an amino-glycoside caused a 10-fold increase of the error rate. This suggests that a reverse mutationin bacteria would be very beneficial in terms of resistance and would carry a low cost of aslight increase in the translation error rate in the absence of the drug. Our results provideevidence for this theory. In the G1491A_PAR simulation, A1492 and A1493 moved closer
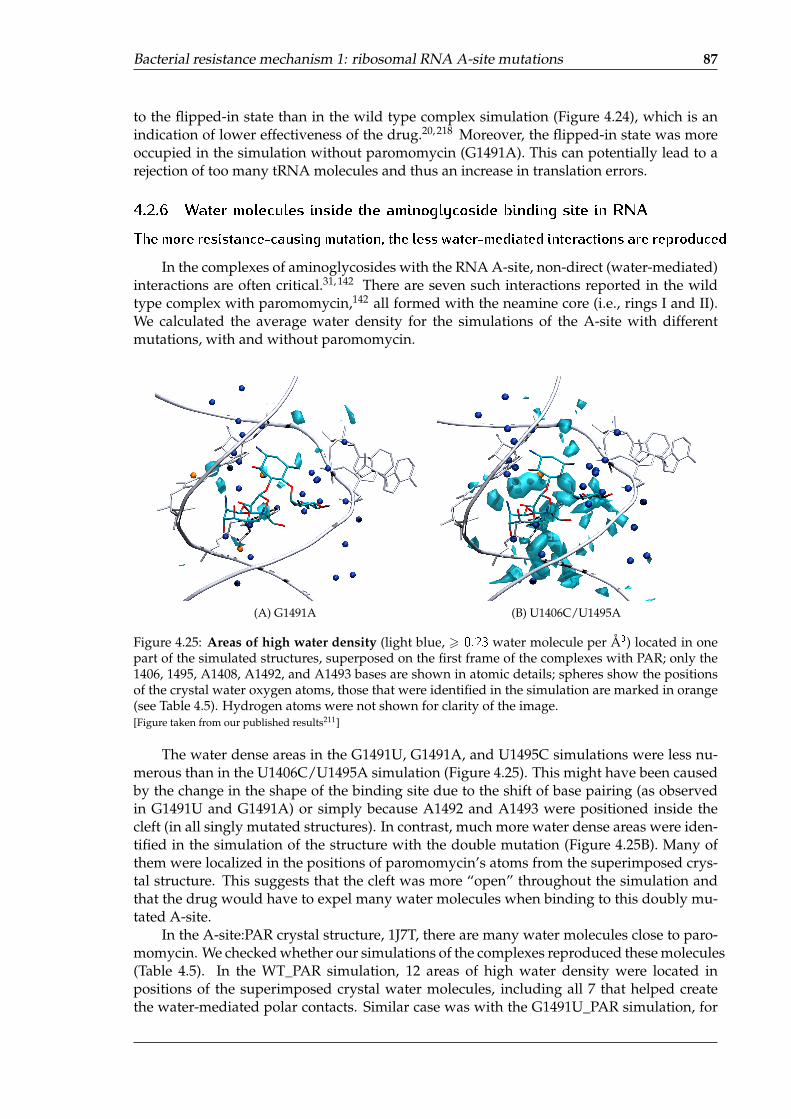
Bacterial resistance mechanism 1: ribosomal RNA A-site mutations 87
to the flipped-in state than in the wild type complex simulation (Figure 4.24), which is anindication of lower effectiveness of the drug.20, 218 Moreover, the flipped-in state was moreoccupied in the simulation without paromomycin (G1491A). This can potentially lead to arejection of too many tRNA molecules and thus an increase in translation errors.
4.2.6 Water molecules inside the aminoglycoside binding site in RNA
The more resistance-causing mutation, the less water-mediated interactions are reproduced
In the complexes of aminoglycosides with the RNA A-site, non-direct (water-mediated)interactions are often critical.31, 142 There are seven such interactions reported in the wildtype complex with paromomycin,142 all formed with the neamine core (i.e., rings I and II).We calculated the average water density for the simulations of the A-site with differentmutations, with and without paromomycin.
(A) G1491A (B) U1406C/U1495A
Figure 4.25: Areas of high water density (light blue, > 0:23 water molecule per Å3) located in onepart of the simulated structures, superposed on the first frame of the complexes with PAR; only the1406, 1495, A1408, A1492, and A1493 bases are shown in atomic details; spheres show the positionsof the crystal water oxygen atoms, those that were identified in the simulation are marked in orange(see Table 4.5). Hydrogen atoms were not shown for clarity of the image.[Figure taken from our published results211]
The water dense areas in the G1491U, G1491A, and U1495C simulations were less nu-merous than in the U1406C/U1495A simulation (Figure 4.25). This might have been causedby the change in the shape of the binding site due to the shift of base pairing (as observedin G1491U and G1491A) or simply because A1492 and A1493 were positioned inside thecleft (in all singly mutated structures). In contrast, much more water dense areas were iden-tified in the simulation of the structure with the double mutation (Figure 4.25B). Many ofthem were localized in the positions of paromomycin’s atoms from the superimposed crys-tal structure. This suggests that the cleft was more “open” throughout the simulation andthat the drug would have to expel many water molecules when binding to this doubly mu-tated A-site.
In the A-site:PAR crystal structure, 1J7T, there are many water molecules close to paro-momycin. We checked whether our simulations of the complexes reproduced these molecules(Table 4.5). In the WT_PAR simulation, 12 areas of high water density were located inpositions of the superimposed crystal water molecules, including all 7 that helped createthe water-mediated polar contacts. Similar case was with the G1491U_PAR simulation, for

88 RESULTS AND DISCUSSION
which only W19 was not reproduced. The other mutation of G1491 led to more changes inthe interactions with paromomycin and only eight water dense areas were close to the po-sitions of the crystal water molecules, of which only three represented the water-mediatedhydrogen bonds. This shows that the G1491A mutation influenced the complex stability.Although in the U1406C/U1495A simulation, there were many water dense areas, in thesimulation of the complex, only two water-mediated contacts were reproduced and only sixcrystal water molecules in total. This again demonstrates that the double mutation resultedin the weakest bound paromomycin.
Table 4.5: Reproduction of the crystal water molecules in simulations of the A-site:PAR complexes.
water molecule # G1491U_PAR G1491A_PAR U1406C/U1495A_PAR U1495C_PAR WT_PAR
W1 + � + + +W4 + + + + +(W7) (�) (�) (�) (�) (�)W8 (W54) (*) +(�) �(+) +(�) �(�) +(�)W9 (W2) (*) +(+) �(+) �(+) +(+) +(+)W12 � � � � �W13 (*) + � � � +W14 (*) + + + + +W15 � � � � �W19 (*) � � � � +W20 � + � + +W25 + + + + +W27 + � � � �W28 + � � + �W32 (*) + + � + +W44 (*) + + � + +(W45) (�) (�) (�) (�) (�)W49 + + +(near) + +W51 � + + + �
Selected water molecules of the 1J7T crystal structure and the corresponding high water densityareas in the MD simulations with paromomycin. “+” denotes water density areas higher than 0.22water molecules per Å3 observed in the position of the corresponding crystallographic watermolecule; “�” denotes lack of high water density in this position. Brackets denote water moleculeslocated in the second symmetric part of the RNA fragment. [Table taken from our published results211]
(*) these water molecules mediate the non-direct hydrogen bonds between paromomycin and RNAin the original crystal structure, 1J7T142
4.2.7 Proposed modi�cations of paromomycin
Based on our observations from the MD simulations, some modifications to paromomy-cin can be proposed. Please refer to Figure 3.3A for numbering of paromomycin atoms, andto Table 4.4 for the hydrogen bonds formed in the WT A-site:PAR complex. Concerning themutations of the U1406�U1495 bases, a substitution of the 2000–NH+
3 group with 2000–CH2NH+3
could improve the A-site:PAR stability, because it would allow the ring IV to interact withthe phosphate groups of both G1405 and U1490 or G1491, and thus, paromomycin wouldanchor more in the mutated A-site. This modification would also increase the stability of thecomplexes with mutated G1491, since we observed that paromomycin ring IV in these com-plexes formed hydrogen bonds with the RNA backbone, i.e., interactions between 2000–NH+
3
of paromomycin and G1405(O2P), and/or 6000–NH+3 and O2P of the mutated base 1491.
Bacterial resistance mechanism 1: ribosomal RNA A-site mutations 89
To strengthen the direct interactions with ring II, the 6–OH group of paromomycincould be substituted for CH2OH. This would enable creation of a direct hydrogen bondbetween U1406(O4) and PAR(O6), instead of a water-mediated one observed in the WTstructure84, 142 and in our WT_PAR simulation. Perhaps even farther strengthening could beachieved when swapping the amino group at 20 position (ring I) with the OH substituentat 30 position. The hydrogen bond between 30–OH and A1492(O2P) was less stable in theG1491A_PAR and the U1406C/U1495A_PAR simulations than in the WT_PAR, and a 30–NH+
3 group would form a stronger interaction with the phosphate.As has been shown, the least stably bound paromomycin was in the U1406C/U1495A_PAR
simulation. One of the important interactions in the WT complex involve the 3–NH+3 of par-
omomycin (ring II) and the phosphate groups of either G1494 or A1493, which was notmaintained in the simulation of the doubly mutated complex (after the equilibration, therewas an increase in distance from � 3:9 Å up to 4:9 Å). Therefore, an extension at this posi-tion (i.e., 3–CH2NH+
3 instead of an amine group) could improve binding, which may alsodiminish the effect of the double mutation U1406C/U1495A.
4.2.8 Summary
The results from our MD simulations of the A-site model with different mutationsshowed that the mutations influence different features of the paromomycin binding site.We have demonstrated that a substitution at position 1491 changed the base pairing pattern,which led to a more compact binding site. The shape of this binding site appears to be animportant factor of aminoglycoside affinity towards the A-site, and therefore the change in-troduced by the G1491 mutations hinders binding. The mobility of A1492 and A1493 wasalso affected in our G1491A and G1491U simulations, resulting in the adenines occupyingthe flipped-in state for most of the simulation time. Moreover, the G1491A mutation madethe adenines move together more often than in WT. This observation helps explain the in-creased stop codon read-through of the bacterial ribosomes carrying this mutation — therecognition of a termination factor requires that only A1492 be flipped-out, while A1493stays inside the helix. Since this conformational state of the adenines was sampled less oftenin the G1491A structure, it is more likely that a termination factor would be rejected by themutated ribosome.
The outcomes of the simulations of structures with the mutated U1406�U1495 pair con-firmed that these bases are important for aminoglycoside binding. They provide the nega-tively charged moieties that form hydrogen bonds with all aminoglycosides binding in thissite. Therefore, when the uridines are mutated, an aminoglycoside may have difficultiesin recognizing this cleft as its binding site. The double mutation introduced the most pro-nounced changes in our simulations, which is in agreement with the MIC studies that foundthat bacteria possessing this mutation were highly resistant to almost all aminoglycosides.Our U1406C/U1495A_PAR simulation showed that the complex with paromomycin wasnot stable and the range of movement of A1492 and A1493 was much wider than in theWT_PAR simulation. Aminoglycoside efficiency has been shown to correlate with the de-gree of adenine mobility restraint. Therefore, our simulations of the complexes qualitativelyconfirm this result.

90 RESULTS AND DISCUSSION
4.3 Bacterial resistance mechanism 2: enzymatic aminoglycoside
modi�cation
To gain a more complete view on bacterial resistance mechanisms against aminogly-cosides, we studied the most common mechanism, i.e., when bacteria produce enzymes(AMEs) that chemically modify aminoglycosides and inactivate them. We selected threeenzymes: AAC(60)-Ib, ANT(40) and APH(30,500)-IIIa. The ANT representative is active as ahomo dimer, and contains two aminoglycoside binding sites, both occupied by kanamycin Ain our ANT_HOLO simulations. Conversely, AAC and APH are active in their monomericstates. Below, we present the results from these MD simulations of AME representativesand their complexes with kanamycin A and from a simulation of the A-site:KAN complex,which was conducted as a reference. For the detailed list of the selected structures andperformed simulations, see Tables 3.2 and 3.3 in Chapter 3.
4.3.1 Conformations of bound kanamycin A
To study the conformational diversity of kanamycin in our simulations, we employedthe same measure as in the case of paromomycin, i.e., we monitored the �= dihedral anglesof the linkages (see Section 3.3.2 Parameterization validation for the definition). Figure 4.26gathers the results from these measurements. Kanamycin’s conformation in the complexwith the rRNA A-site was similar to the one that we found to be the most occupied in water(compare Figure 4.26, top, with Figure 3.4C–D). Linkage I/II acquired the same �/ val-ues for both aminoglycosides complexed with the native A-site (KAN and PAR; compareFigure 4.26, top with Figure 4.12, top). Notably, the kanamycin’s conformation in two ofthe studied enzymes (AAC and APH) was very similar to the one in the A-site. However,binding to ANT required a drastic conformational change in linkage I/II and also made link-age II/III more dynamic. This suggests that ANT binds kanamcyin A less tightly than otherenzymes. Previously reported X-ray and NMR experiments67, 68, 79 showed that the con-formation of several aminoglycosides bound to some AMEs is significantly different fromthe one adopted in the A-site. This fact was utilized to propose some conformationallyconstrained aminoglycoside derivatives80, 219 that disabled their binding to AMEs. How-ever, that strategy is very limited, since even if an aminoglycoside changed its conformationwhen binding to one AME, in the complexes with other AMEs the conformation would bethe same as acquired inside the A-site, and therefore constraining aminoglycosides wouldnot prevent binding to all possible bacterial AMEs.
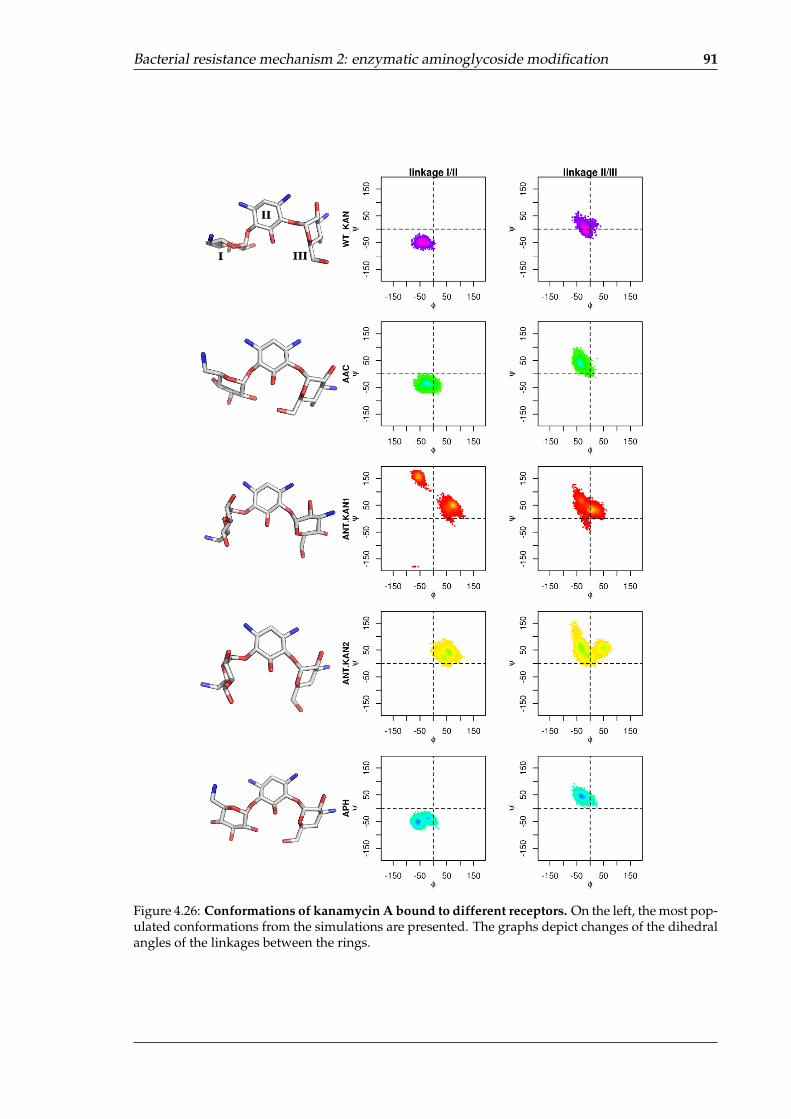
Bacterial resistance mechanism 2: enzymatic aminoglycoside modification 91
Figure 4.26: Conformations of kanamycin A bound to different receptors. On the left, the most pop-ulated conformations from the simulations are presented. The graphs depict changes of the dihedralangles of the linkages between the rings.

92 RESULTS AND DISCUSSION
4.3.2 Internal dynamics of enzymes
Flexibility patterns di�er among AMEs
The rRNA A-site bulge is flexible, and we have shown that even one-base substitutionscan change its internal dynamics. To investigate the dynamic features of AMEs, we lookedat the differences in RMSF between the APO (i.e., binary complex: enzyme + cofactor) andHOLO (i.e., ternary complex: enzyme + cofactor + kanamycin A) states of the enzymes.This difference in the residue fluctuations of each enzyme is presented in Figure 4.27. Themonomeric enzymes, i.e., AAC and APH, displayed the biggest changes in the residue mo-bility upon kanamycin A binding, especially the loops located over the binding site wererestrained in the HOLO states. On the contrary, the changes in RMSF between the APO andHOLO simulations were much smaller for the dimeric ANT. Moreover, this enzyme was theleast dynamic from all three structures, as indicated by the range of RMSF values presentedin Figure 4.28.
Figure 4.27: Difference in internal dynamics between the HOLO and APO states of the enzymes,presented as the difference in per-residue RMSF [Å] calculated for all simulations; the negative valuespoint to more mobile residues in the APO state. The residues that had abs(�RMSF) > 0:5; 0:3 or 0:4 Åfor APH, AAC and ANT, respectively, are labeled.
Figure 4.28: Histograms of the per-residue RMSF values from the simulations of AMEs; compari-son between the residue mobility in the APO and HOLO states.
We studied the enzymes’ dynamics with our new tool, GeoStaS, that analyzes the differ-ences and similarities in molecular motions. The GeoStaS analysis of the trajectories showsthe division of AMEs into dynamic domains (presented in Figure 4.29). The results indicatethat the flexibility patterns did not change upon kanamcyin binding for both ANT and AAC.In contrast, the APH enzyme displayed significantly different pattern of fluctuations in theAPO and HOLO simulations. To analyze this finding further, we collected all other exper-imental structures of AAC and APH, that were available in PDB. Then we performed PCA
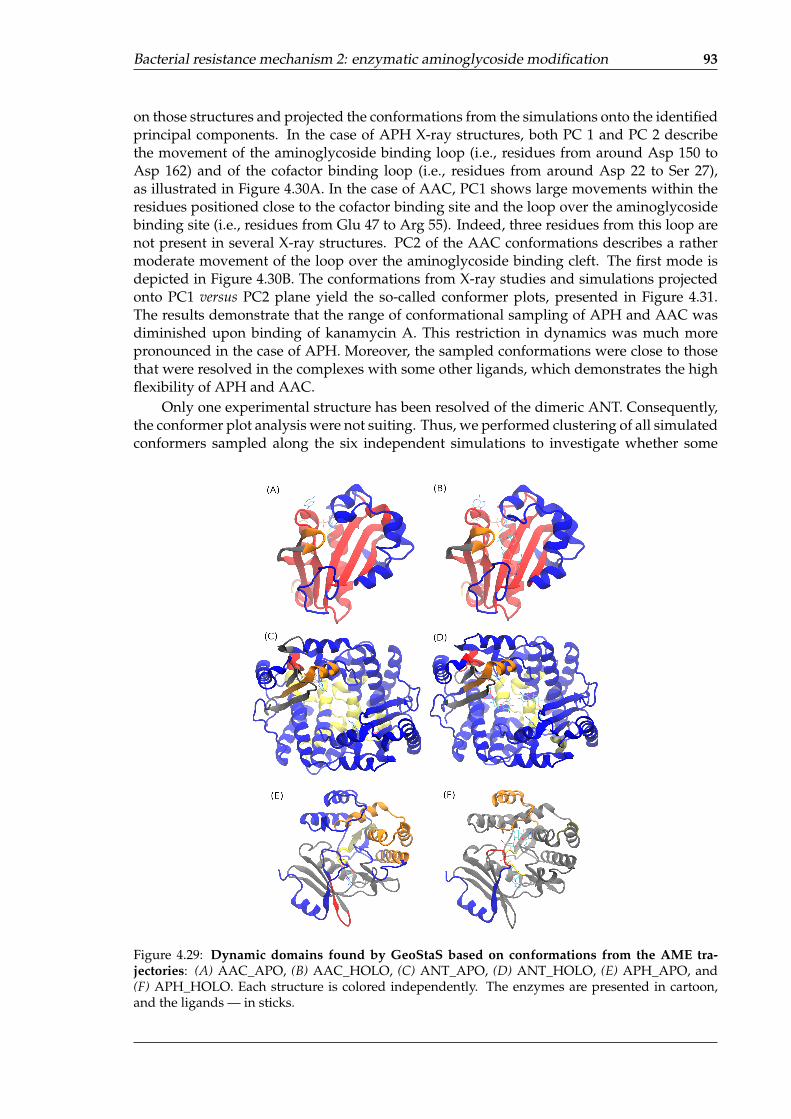
Bacterial resistance mechanism 2: enzymatic aminoglycoside modification 93
on those structures and projected the conformations from the simulations onto the identifiedprincipal components. In the case of APH X-ray structures, both PC 1 and PC 2 describethe movement of the aminoglycoside binding loop (i.e., residues from around Asp 150 toAsp 162) and of the cofactor binding loop (i.e., residues from around Asp 22 to Ser 27),as illustrated in Figure 4.30A. In the case of AAC, PC1 shows large movements within theresidues positioned close to the cofactor binding site and the loop over the aminoglycosidebinding site (i.e., residues from Glu 47 to Arg 55). Indeed, three residues from this loop arenot present in several X-ray structures. PC2 of the AAC conformations describes a rathermoderate movement of the loop over the aminoglycoside binding cleft. The first mode isdepicted in Figure 4.30B. The conformations from X-ray studies and simulations projectedonto PC1 versus PC2 plane yield the so-called conformer plots, presented in Figure 4.31.The results demonstrate that the range of conformational sampling of APH and AAC wasdiminished upon binding of kanamycin A. This restriction in dynamics was much morepronounced in the case of APH. Moreover, the sampled conformations were close to thosethat were resolved in the complexes with some other ligands, which demonstrates the highflexibility of APH and AAC.
Only one experimental structure has been resolved of the dimeric ANT. Consequently,the conformer plot analysis were not suiting. Thus, we performed clustering of all simulatedconformers sampled along the six independent simulations to investigate whether some
Figure 4.29: Dynamic domains found by GeoStaS based on conformations from the AME tra-jectories: (A) AAC_APO, (B) AAC_HOLO, (C) ANT_APO, (D) ANT_HOLO, (E) APH_APO, and(F) APH_HOLO. Each structure is colored independently. The enzymes are presented in cartoon,and the ligands — in sticks.
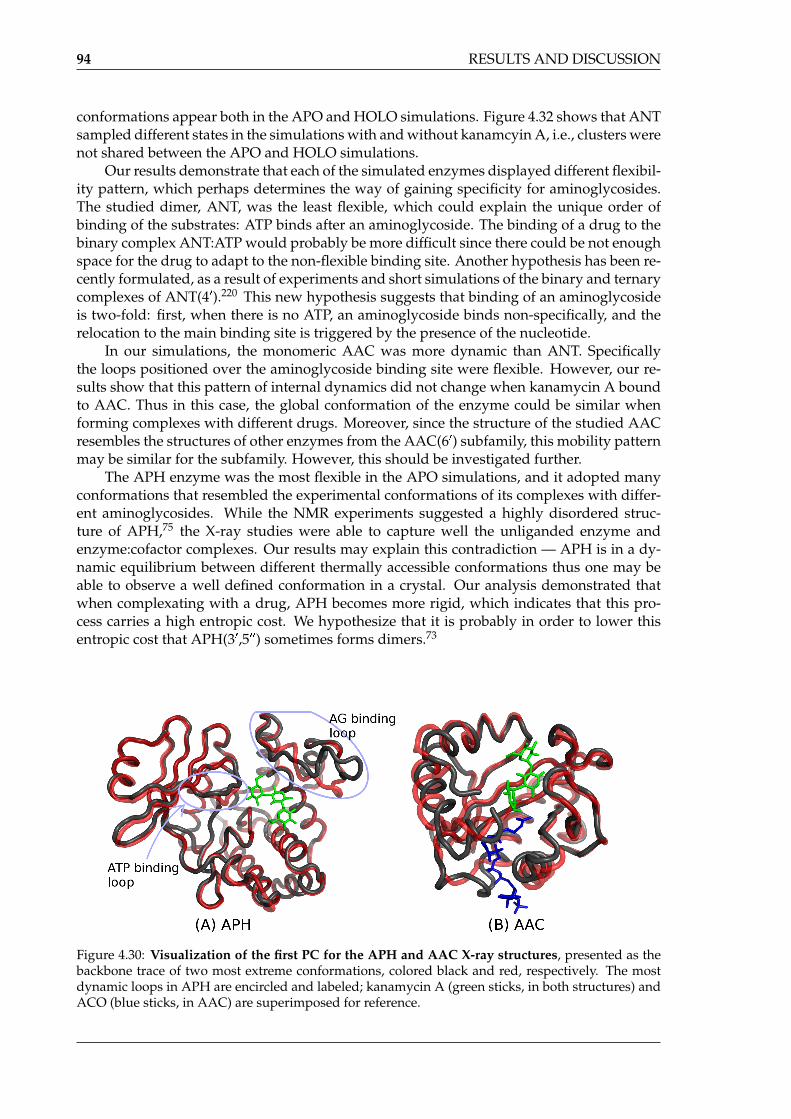
94 RESULTS AND DISCUSSION
conformations appear both in the APO and HOLO simulations. Figure 4.32 shows that ANTsampled different states in the simulations with and without kanamcyin A, i.e., clusters werenot shared between the APO and HOLO simulations.
Our results demonstrate that each of the simulated enzymes displayed different flexibil-ity pattern, which perhaps determines the way of gaining specificity for aminoglycosides.The studied dimer, ANT, was the least flexible, which could explain the unique order ofbinding of the substrates: ATP binds after an aminoglycoside. The binding of a drug to thebinary complex ANT:ATP would probably be more difficult since there could be not enoughspace for the drug to adapt to the non-flexible binding site. Another hypothesis has been re-cently formulated, as a result of experiments and short simulations of the binary and ternarycomplexes of ANT(40).220 This new hypothesis suggests that binding of an aminoglycosideis two-fold: first, when there is no ATP, an aminoglycoside binds non-specifically, and therelocation to the main binding site is triggered by the presence of the nucleotide.
In our simulations, the monomeric AAC was more dynamic than ANT. Specificallythe loops positioned over the aminoglycoside binding site were flexible. However, our re-sults show that this pattern of internal dynamics did not change when kanamycin A boundto AAC. Thus in this case, the global conformation of the enzyme could be similar whenforming complexes with different drugs. Moreover, since the structure of the studied AACresembles the structures of other enzymes from the AAC(60) subfamily, this mobility patternmay be similar for the subfamily. However, this should be investigated further.
The APH enzyme was the most flexible in the APO simulations, and it adopted manyconformations that resembled the experimental conformations of its complexes with differ-ent aminoglycosides. While the NMR experiments suggested a highly disordered struc-ture of APH,75 the X-ray studies were able to capture well the unliganded enzyme andenzyme:cofactor complexes. Our results may explain this contradiction — APH is in a dy-namic equilibrium between different thermally accessible conformations thus one may beable to observe a well defined conformation in a crystal. Our analysis demonstrated thatwhen complexating with a drug, APH becomes more rigid, which indicates that this pro-cess carries a high entropic cost. We hypothesize that it is probably in order to lower thisentropic cost that APH(30,500) sometimes forms dimers.73
Figure 4.30: Visualization of the first PC for the APH and AAC X-ray structures, presented as thebackbone trace of two most extreme conformations, colored black and red, respectively. The mostdynamic loops in APH are encircled and labeled; kanamycin A (green sticks, in both structures) andACO (blue sticks, in AAC) are superimposed for reference.
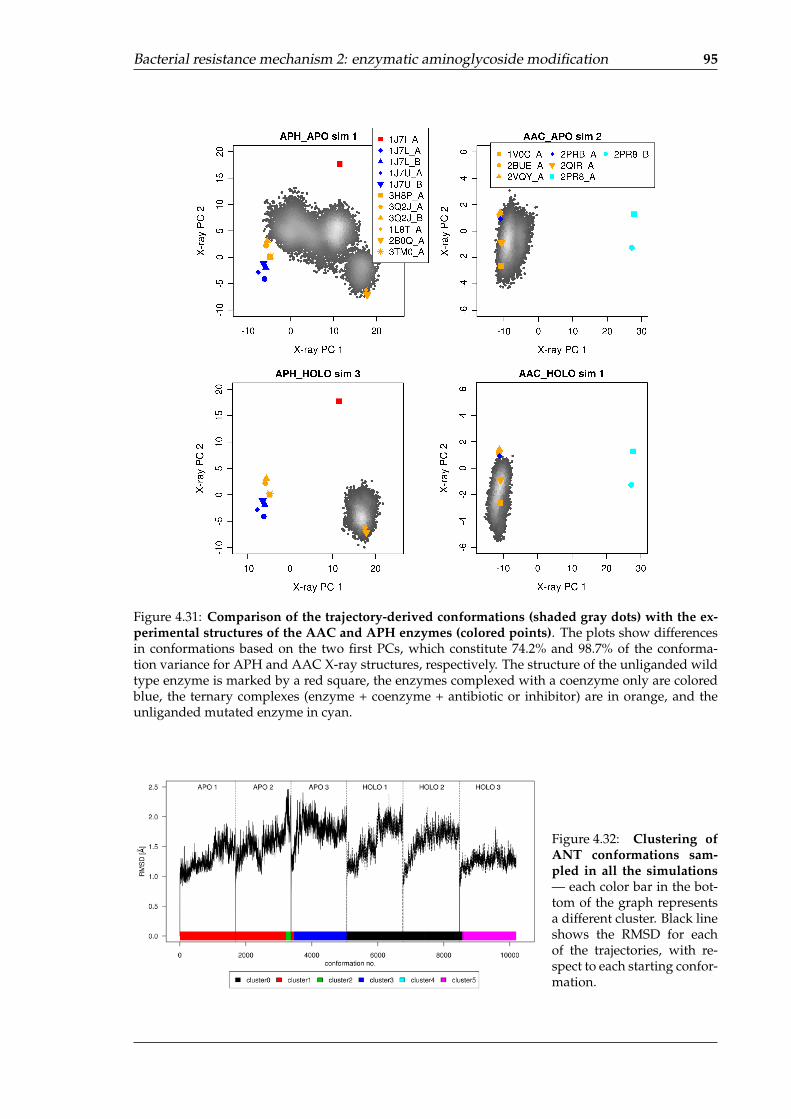
Bacterial resistance mechanism 2: enzymatic aminoglycoside modification 95
Figure 4.31: Comparison of the trajectory-derived conformations (shaded gray dots) with the ex-perimental structures of the AAC and APH enzymes (colored points). The plots show differencesin conformations based on the two first PCs, which constitute 74.2% and 98.7% of the conforma-tion variance for APH and AAC X-ray structures, respectively. The structure of the unliganded wildtype enzyme is marked by a red square, the enzymes complexed with a coenzyme only are coloredblue, the ternary complexes (enzyme + coenzyme + antibiotic or inhibitor) are in orange, and theunliganded mutated enzyme in cyan.
Figure 4.32: Clustering ofANT conformations sam-pled in all the simulations— each color bar in the bot-tom of the graph representsa different cluster. Black lineshows the RMSD for eachof the trajectories, with re-spect to each starting confor-mation.

96 RESULTS AND DISCUSSION
Figure 4.33: Histograms of aminoglycoside binding site volume [Å3] in the simulations of theA-site and AMEs.
4.3.3 Shapes and sizes of aminoglycoside binding pockets in AMEs
Volume of binding pocket is greatly reduced upon aminoglycoside binding in APH
We measured the volume of kanamycin A binding sites to compare the pockets amongthe selected AMEs and between AMEs and the rRNA A-site. Therefore, when defining thespace of the pocket on the RNA, we have decided to include only the space that would beoccupied by kanamycin A. However, we note that an aminoglycoside of different shape andsize could also fit into the pocket and could give different volume values because this RNAstructure is flexible and the cavity is long and wide. Figure 4.33 compares the volumes ofthe binding pockets in AMEs from the APO and HOLO simulations of each enzyme, and thevolume of kanamcyin A binding site from the simulations of the A-site. In the RNA:KANcomplex, the histogram was narrowed to the larger values compared to the simulation ofthe bare RNA, because the adenines A1492 and A1493 were restricted to their flipped-outconformation. Both for AAC and ANT the cleft’s volume did not change upon bindingof kanamcyin. In contrast, the space available for an aminoglycoside in APH_HOLO wasmuch smaller than in APH_APO. Together with the previously described results on theinternal dynamics of this enzyme, this suggests that the residues around the aminoglycosidebinding site in APH are very flexible and the enzyme adapts to the shape of aminoglycosideswhen forming the complex, which suggests an induced fit mechanism of binding.
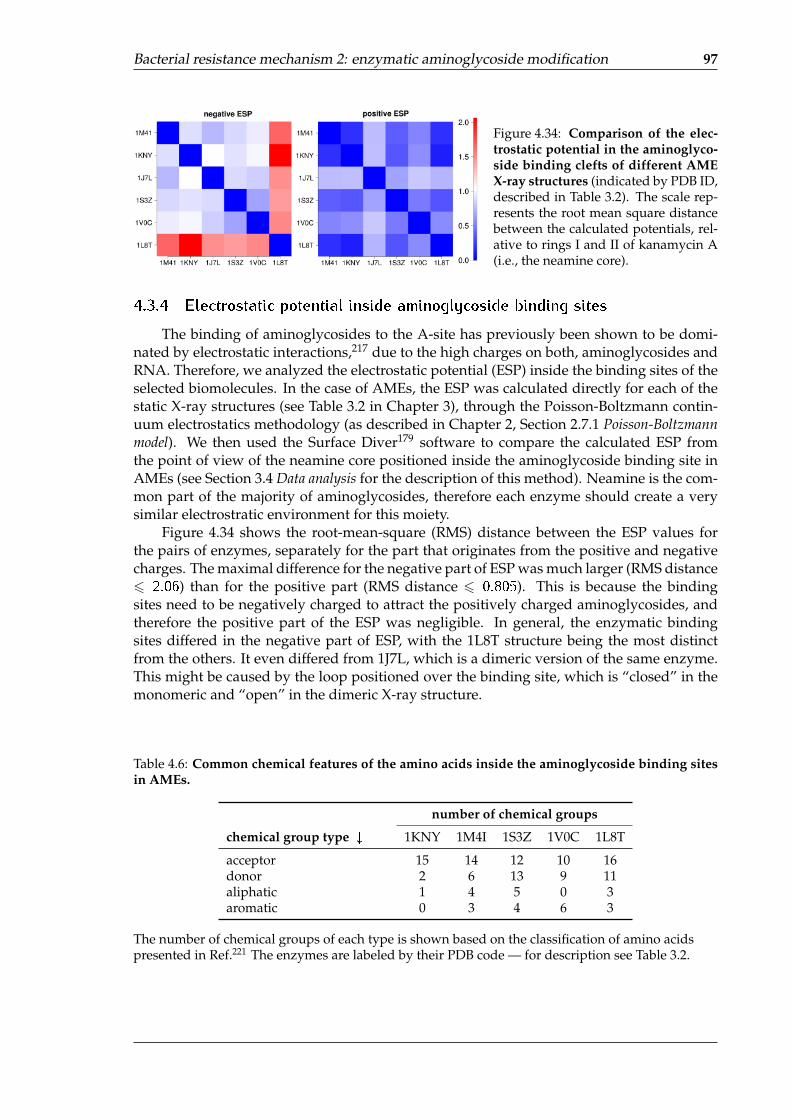
Bacterial resistance mechanism 2: enzymatic aminoglycoside modification 97
Figure 4.34: Comparison of the elec-trostatic potential in the aminoglyco-side binding clefts of different AMEX-ray structures (indicated by PDB ID,described in Table 3.2). The scale rep-resents the root mean square distancebetween the calculated potentials, rel-ative to rings I and II of kanamycin A(i.e., the neamine core).
4.3.4 Electrostatic potential inside aminoglycoside binding sites
The binding of aminoglycosides to the A-site has previously been shown to be domi-nated by electrostatic interactions,217 due to the high charges on both, aminoglycosides andRNA. Therefore, we analyzed the electrostatic potential (ESP) inside the binding sites of theselected biomolecules. In the case of AMEs, the ESP was calculated directly for each of thestatic X-ray structures (see Table 3.2 in Chapter 3), through the Poisson-Boltzmann contin-uum electrostatics methodology (as described in Chapter 2, Section 2.7.1 Poisson-Boltzmannmodel). We then used the Surface Diver179 software to compare the calculated ESP fromthe point of view of the neamine core positioned inside the aminoglycoside binding site inAMEs (see Section 3.4 Data analysis for the description of this method). Neamine is the com-mon part of the majority of aminoglycosides, therefore each enzyme should create a verysimilar electrostratic environment for this moiety.
Figure 4.34 shows the root-mean-square (RMS) distance between the ESP values forthe pairs of enzymes, separately for the part that originates from the positive and negativecharges. The maximal difference for the negative part of ESP was much larger (RMS distance6 2:06) than for the positive part (RMS distance 6 0:805). This is because the bindingsites need to be negatively charged to attract the positively charged aminoglycosides, andtherefore the positive part of the ESP was negligible. In general, the enzymatic bindingsites differed in the negative part of ESP, with the 1L8T structure being the most distinctfrom the others. It even differed from 1J7L, which is a dimeric version of the same enzyme.This might be caused by the loop positioned over the binding site, which is “closed” in themonomeric and “open” in the dimeric X-ray structure.
Table 4.6: Common chemical features of the amino acids inside the aminoglycoside binding sitesin AMEs.
number of chemical groups
chemical group type # 1KNY 1M4I 1S3Z 1V0C 1L8T
acceptor 15 14 12 10 16donor 2 6 13 9 11aliphatic 1 4 5 0 3aromatic 0 3 4 6 3
The number of chemical groups of each type is shown based on the classification of amino acidspresented in Ref.221 The enzymes are labeled by their PDB code — for description see Table 3.2.

98 RESULTS AND DISCUSSION
4.3.5 Short-range interactions formed by the receptors with kanamycin A
Comparison of AME:AG X-ray complexes
Next, we investigated how the different AMEs interact with aminoglycosides. We com-pared the amino acids that interact with aminoglycosides in different X-ray structures of theAME:AG complexes. While the amino acids that are within 5 Å from the bound antibioticdiffered in type, the chemical groups they display were similar. As presented in Table 4.6,the most common groups were acceptors of hydrogen bonds. This is due to aminoglyco-sides having many NH+
3 groups, which can act as donors. In the three structures, 1S3Z,1V0C, and 1L8T, apart from hydrogen bond acceptors there was also a similar number ofdonors. This can possibly help these enzymes be more promiscuous. The other types ofchemical groups were poorly represented inside the AME binding sites. Notably, even aro-matic groups were rare, although they could form stacking interactions with the rings ofaminoglycosides. Only in the binding site of 1V0C (AAC(60)-Ib) a substantial number ofaromatic groups could be found.
Kanamycin A in the rRNA binding site
The performed simulations (see Table 3.3) focused on interactions of AMEs with oneaminoglycoside, kanamycin A. However, first, we studied the A-site:KAN complex, to beable to compare and relate it to the AME complexes. Although kanamycin A has a slightlydifferent chemical structure and shape than paromomycin, it binds to the rRNA A-site in asimilar manner, utilizing mainly its two first rings (eight out of eleven hydrogen bonds areformed with rings I and II).31 In our WT_KAN simulation, all the hydrogen bonds from thecrystal structure were maintained, even though some lasted shorter in one of the bindingsites of the model than in the other, as can be seen from Table 4.7.
atoms involved in H-bond occupancy of H-bond[% of simulation time]
X-ray distance [Å]
KAN atom : : : RNA atom part A part B part A part B
O200: : :G1405(O6) 66 95 2.78 3.09N300: : :G1405(N7) 72 74 3.06 2.91N60: : :A1408(N1) 72 36 2.89 3.53O30: : :A1492(O2P) 91 93 2.63 2.94O40: : :A1492(O2P) 1 55 3.89 4.65N3: : :A1493(O1P) 21 92 3.07 3.04N60: : :A1493(O2P) 0 53 4.72 3.65O40: : :A1493(O2P) 91 33 2.65 2.7N3: : :A1493(O2P) 68 2 4.46 3.65N3: : :G1494(O2P) 91 90 2.89 2.77N3: : :G1494(N7) 73 48 2.81 2.66N1: : :U1495(O4) 83 97 2.57 2.63
Table 4.7: Direct hydrogen bonds formed between kanamycin A and the ribosomal RNA A-site.Only the interactions between kanamycin and the receptor’s residue that lasted at least 50% of thesimulation time in at least one of symmetric parts of the receptor are shown. The location of the basesrelative to kanamycin A is illustrated in the left panel.

Bacterial resistance mechanism 2: enzymatic aminoglycoside modification 99
AMEs mimic hydrogen bonding with KAN from the A-site:KAN complex
Next, we analyzed the simulations of the complexes that AMEs formed with kanamy-cin A. Compared to the complex formed with the A-site, slightly less hydrogen bonds wereformed in the AAC_HOLO simulations (nine or eight, depending on the simulation run),while in the ANT_HOLO simulations, they varied from 6 to 12. The APH:KAN complexwas the most stable, with 14 hydrogen bonds in each of the APH_HOLO simulation runs.The complete lists of hydrogen bonds formed in the binding sites are presented in Tables 4.8–4.10.
Naturally, since the aminoglycosides are positively charged in physiological pH, theyare attracted by the negatively charged RNA backbone. We found that AMEs mimic theseinteractions quite well (Figure 4.35A–B). During the simulations, the enzymes formed manyhydrogen bonds utilizing the Asp and Glu side chains. However, there were several caseswhere other amino acids formed equally stable interactions (Figure 4.35A), e.g., Ser 94 inthe ANT_HOLO simulation (in both monomers), Ser 98 in AAC_HOLO and Phe 264 inAPH_HOLO. The first two mentioned interactions were created through carbonyl groupsof the backbone. Phe 264 is the terminal residue in APH(30,500), and therefore, it utilizedits backbone carboxyl group, forming hydrogen bonds through either of the oxygens. Thisinteraction was shown to be conserved within the APH(30) subfamily.222
Table 4.8: Direct hydrogen bonds formed between kanamycin A and AAC(60)-Ib. Only the interac-tions between kanamycin and a receptor’s residue that lasted at least 50% of the simulation time inat least one of the simulations are shown. See Figure 4.35 for the kanamycin A atom numbering andthe location of the amino acids.
atoms involved in H-bond occupancy of H-bond[% of simulation time]
KAN atom : : : enzyme atom sim 1 sim 2 sim 3
O200: : :Glu73(OE1) 0 25 0O200: : :Glu73(OE2) 0 33 0O400: : :Glu73(OE1) 15 3 39O400: : :Glu73(OE2) 29 0 26N300: : :Glu73(OE1) 29 60 26N300: : :Glu73(OE2) 24 48 13O5: : :Gln91(NE2) 91 96 95N1: : :Ser98(O) 0 57 17N60: : :Asp115(OD2) 96 92 95N3: : :Asp115(OD2) 95 86 88N3: : :Asp152(OD1) 55 19 58N3: : :Asp152(OD2) 75 19 62O40: : :Asp179(OD1) 31 23 3O40: : :Asp179(OD2) 20 21 3N60: : :ACO(O) 87 85 83

100 RESULTS AND DISCUSSION
Table 4.9: Direct hydrogen bonds formed between kanamycin A and APH(30,500)-IIIa. Only the in-teractions between kanamycin and a receptor’s residue that lasted at least 50% of the simulation timein at least one of the simulations are shown. See Figure 4.35 for the kanamycin A atom numberingand the location of the amino acids.
atoms involved in H-bond occupancy of H-bond[% of simulation time]
KAN atom : : : enzyme atom sim 1 sim 2 sim 3
N60: : :Glu157(OE1) 66 31 42N60: : :Glu157(OE2) 70 70 29N3: : :Glu157(OE1) 15 0 66N3: : :Glu157(OE2) 86 0 33O5: : :Glu157(OE1) 0 57 0O5: : :Glu157(OE2) 0 33 0N1: : :Asn158(O) 92 36 94N1: : :Glu160(OE2) 100 96 100
N300: : :Glu160(OE1) 90 95 97O200: : :Glu160(OE2) 100 100 100O30: : :Asp190(OD1) 0 40 95O30: : :Asp190(OD2) 0 40 3N300: : :Arg226(O) 41 0 82N300: : :Glu230(OE1) 51 57 61N300: : :Glu230(OE2) 44 65 42O400: : :Glu230(OE1) 26 52 0O400: : :Glu230(OE2) 18 44 0N3: : :Asp261(O) 28 85 72N1: : :Glu262(OE2) 100 92 100N3: : :Glu262(O) 64 0 15N60: : :Phe264(O) 0 67 63N60: : :Phe264(OXT) 0 78 82N3: : :Phe264(O) 67 76 68O40: : :Phe264(O) 50 0 1O40: : :Phe264(OXT) 52 0 0O30: : :ATP(O3G) 99 0 3O40: : :ATP(O3G) 0 0 90
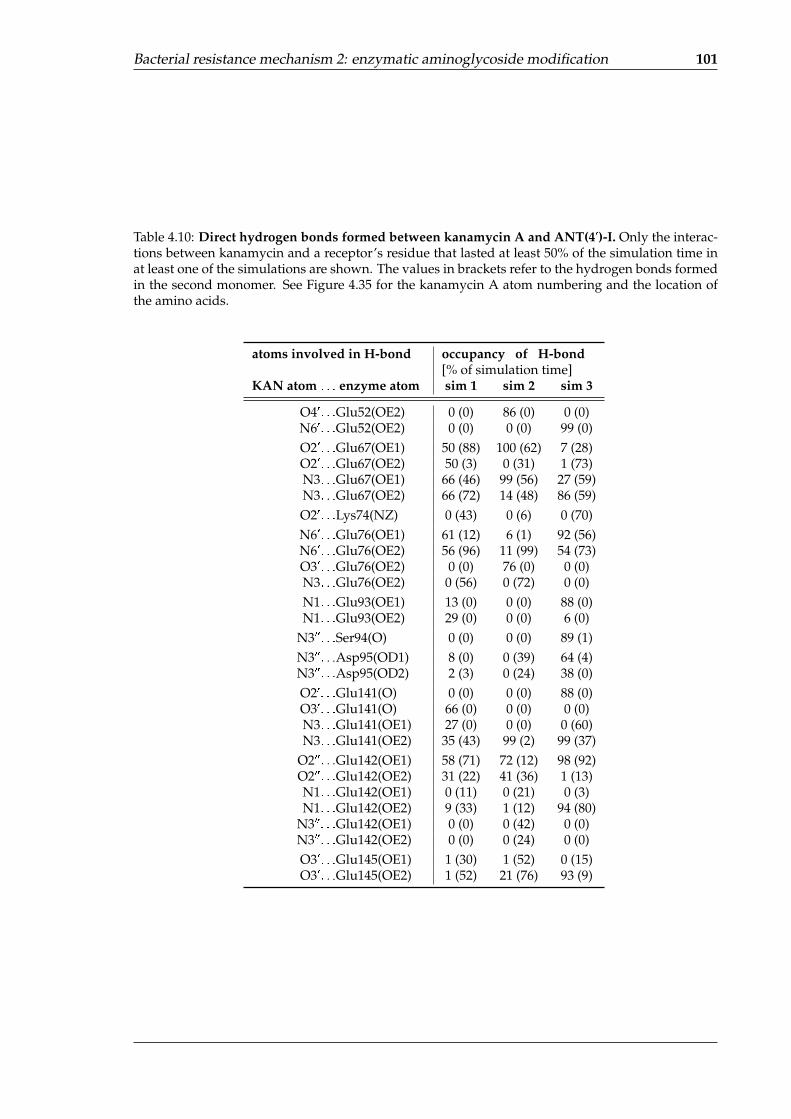
Bacterial resistance mechanism 2: enzymatic aminoglycoside modification 101
Table 4.10: Direct hydrogen bonds formed between kanamycin A and ANT(40)-I. Only the interac-tions between kanamycin and a receptor’s residue that lasted at least 50% of the simulation time inat least one of the simulations are shown. The values in brackets refer to the hydrogen bonds formedin the second monomer. See Figure 4.35 for the kanamycin A atom numbering and the location ofthe amino acids.
atoms involved in H-bond occupancy of H-bond[% of simulation time]
KAN atom : : : enzyme atom sim 1 sim 2 sim 3
O40: : :Glu52(OE2) 0 (0) 86 (0) 0 (0)N60: : :Glu52(OE2) 0 (0) 0 (0) 99 (0)O20: : :Glu67(OE1) 50 (88) 100 (62) 7 (28)O20: : :Glu67(OE2) 50 (3) 0 (31) 1 (73)N3: : :Glu67(OE1) 66 (46) 99 (56) 27 (59)N3: : :Glu67(OE2) 66 (72) 14 (48) 86 (59)O20: : :Lys74(NZ) 0 (43) 0 (6) 0 (70)N60: : :Glu76(OE1) 61 (12) 6 (1) 92 (56)N60: : :Glu76(OE2) 56 (96) 11 (99) 54 (73)O30: : :Glu76(OE2) 0 (0) 76 (0) 0 (0)N3: : :Glu76(OE2) 0 (56) 0 (72) 0 (0)N1: : :Glu93(OE1) 13 (0) 0 (0) 88 (0)N1: : :Glu93(OE2) 29 (0) 0 (0) 6 (0)
N300: : :Ser94(O) 0 (0) 0 (0) 89 (1)N300: : :Asp95(OD1) 8 (0) 0 (39) 64 (4)N300: : :Asp95(OD2) 2 (3) 0 (24) 38 (0)O20: : :Glu141(O) 0 (0) 0 (0) 88 (0)O30: : :Glu141(O) 66 (0) 0 (0) 0 (0)N3: : :Glu141(OE1) 27 (0) 0 (0) 0 (60)N3: : :Glu141(OE2) 35 (43) 99 (2) 99 (37)
O200: : :Glu142(OE1) 58 (71) 72 (12) 98 (92)O200: : :Glu142(OE2) 31 (22) 41 (36) 1 (13)N1: : :Glu142(OE1) 0 (11) 0 (21) 0 (3)N1: : :Glu142(OE2) 9 (33) 1 (12) 94 (80)
N300: : :Glu142(OE1) 0 (0) 0 (42) 0 (0)N300: : :Glu142(OE2) 0 (0) 0 (24) 0 (0)O30: : :Glu145(OE1) 1 (30) 1 (52) 0 (15)O30: : :Glu145(OE2) 1 (52) 21 (76) 93 (9)
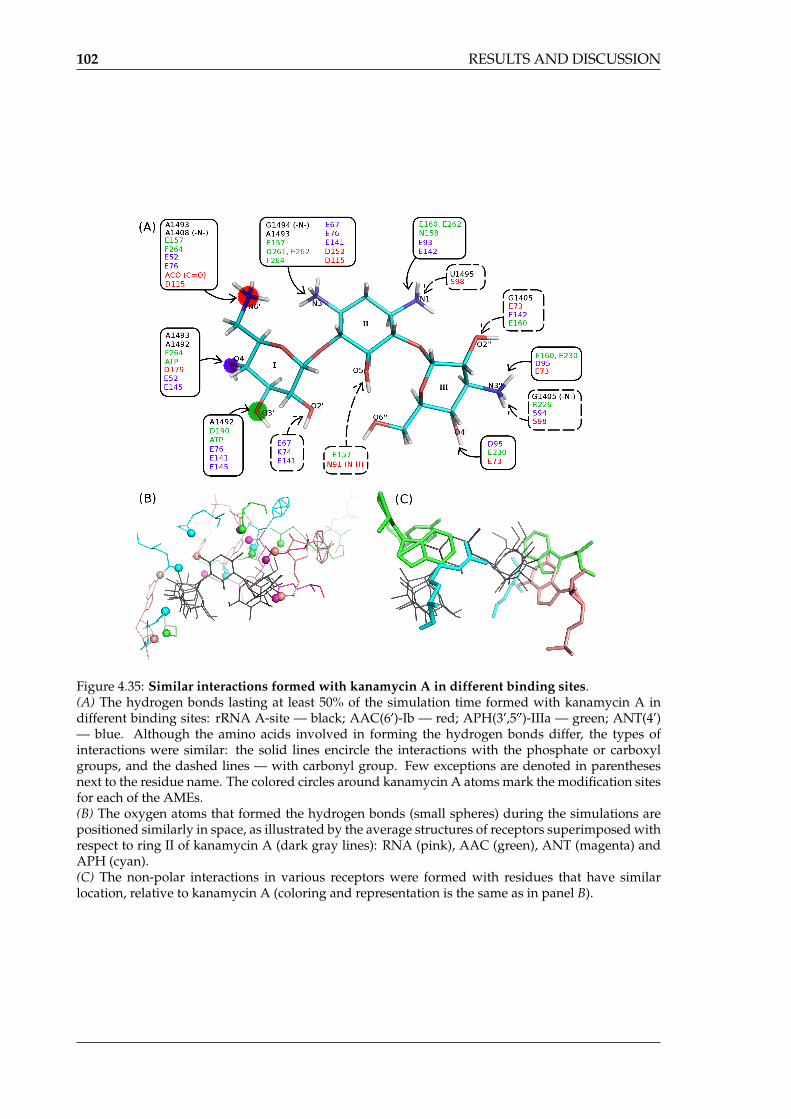
102 RESULTS AND DISCUSSION
Figure 4.35: Similar interactions formed with kanamycin A in different binding sites.(A) The hydrogen bonds lasting at least 50% of the simulation time formed with kanamycin A indifferent binding sites: rRNA A-site — black; AAC(60)-Ib — red; APH(30,500)-IIIa — green; ANT(40)— blue. Although the amino acids involved in forming the hydrogen bonds differ, the types ofinteractions were similar: the solid lines encircle the interactions with the phosphate or carboxylgroups, and the dashed lines — with carbonyl group. Few exceptions are denoted in parenthesesnext to the residue name. The colored circles around kanamycin A atoms mark the modification sitesfor each of the AMEs.(B) The oxygen atoms that formed the hydrogen bonds (small spheres) during the simulations arepositioned similarly in space, as illustrated by the average structures of receptors superimposed withrespect to ring II of kanamycin A (dark gray lines): RNA (pink), AAC (green), ANT (magenta) andAPH (cyan).(C) The non-polar interactions in various receptors were formed with residues that have similarlocation, relative to kanamycin A (coloring and representation is the same as in panel B).
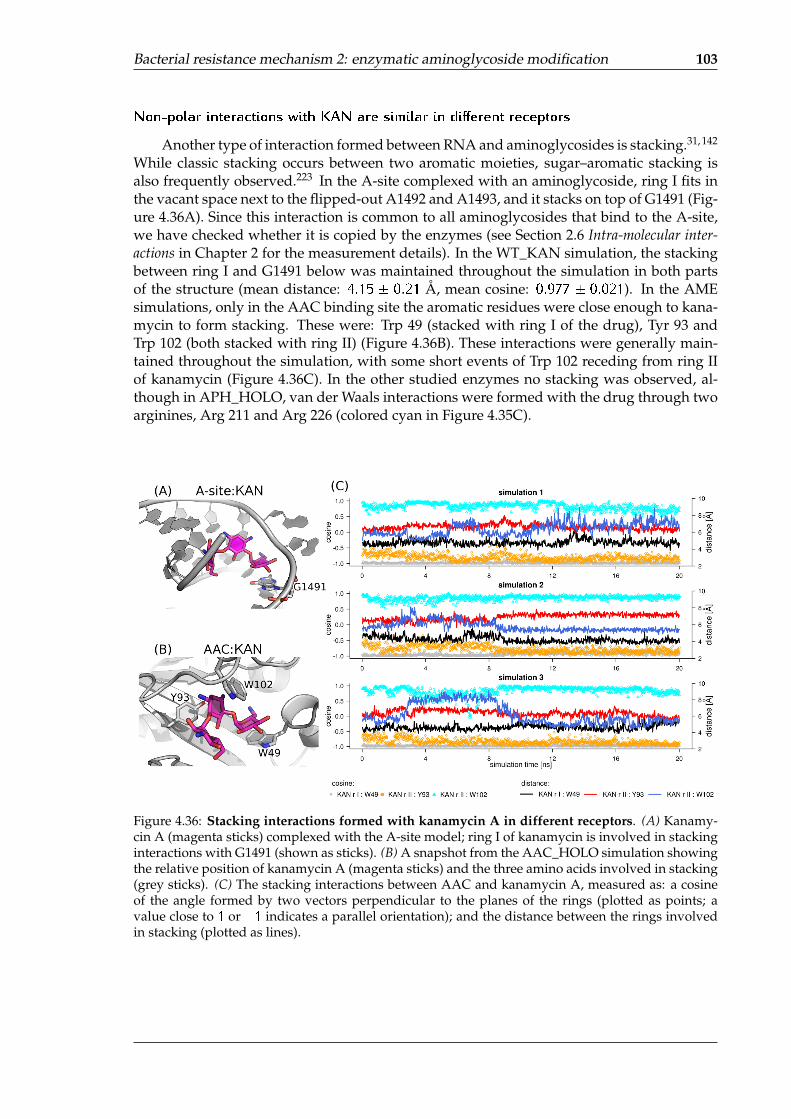
Bacterial resistance mechanism 2: enzymatic aminoglycoside modification 103
Non-polar interactions with KAN are similar in di�erent receptors
Another type of interaction formed between RNA and aminoglycosides is stacking.31, 142
While classic stacking occurs between two aromatic moieties, sugar–aromatic stacking isalso frequently observed.223 In the A-site complexed with an aminoglycoside, ring I fits inthe vacant space next to the flipped-out A1492 and A1493, and it stacks on top of G1491 (Fig-ure 4.36A). Since this interaction is common to all aminoglycosides that bind to the A-site,we have checked whether it is copied by the enzymes (see Section 2.6 Intra-molecular inter-actions in Chapter 2 for the measurement details). In the WT_KAN simulation, the stackingbetween ring I and G1491 below was maintained throughout the simulation in both partsof the structure (mean distance: 4:15 � 0:21 Å, mean cosine: 0:977 � 0:021). In the AMEsimulations, only in the AAC binding site the aromatic residues were close enough to kana-mycin to form stacking. These were: Trp 49 (stacked with ring I of the drug), Tyr 93 andTrp 102 (both stacked with ring II) (Figure 4.36B). These interactions were generally main-tained throughout the simulation, with some short events of Trp 102 receding from ring IIof kanamycin (Figure 4.36C). In the other studied enzymes no stacking was observed, al-though in APH_HOLO, van der Waals interactions were formed with the drug through twoarginines, Arg 211 and Arg 226 (colored cyan in Figure 4.35C).
Figure 4.36: Stacking interactions formed with kanamycin A in different receptors. (A) Kanamy-cin A (magenta sticks) complexed with the A-site model; ring I of kanamycin is involved in stackinginteractions with G1491 (shown as sticks). (B) A snapshot from the AAC_HOLO simulation showingthe relative position of kanamycin A (magenta sticks) and the three amino acids involved in stacking(grey sticks). (C) The stacking interactions between AAC and kanamycin A, measured as: a cosineof the angle formed by two vectors perpendicular to the planes of the rings (plotted as points; avalue close to 1 or �1 indicates a parallel orientation); and the distance between the rings involvedin stacking (plotted as lines).
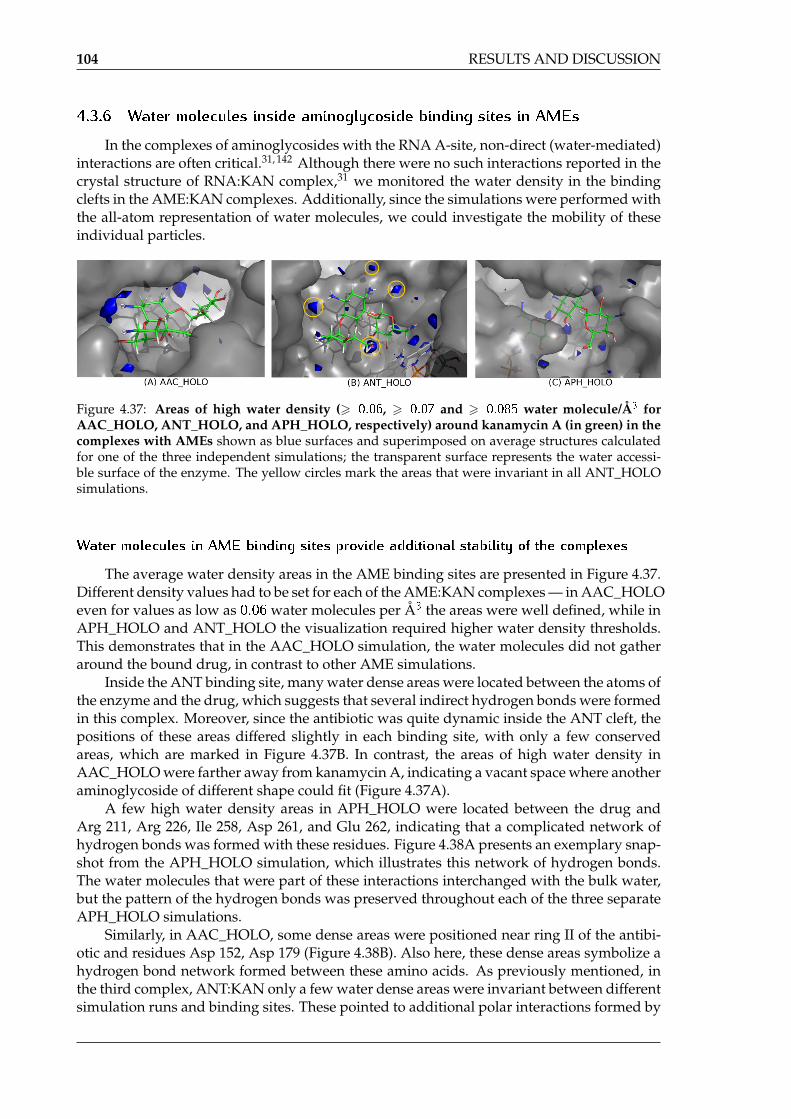
104 RESULTS AND DISCUSSION
4.3.6 Water molecules inside aminoglycoside binding sites in AMEs
In the complexes of aminoglycosides with the RNA A-site, non-direct (water-mediated)interactions are often critical.31, 142 Although there were no such interactions reported in thecrystal structure of RNA:KAN complex,31 we monitored the water density in the bindingclefts in the AME:KAN complexes. Additionally, since the simulations were performed withthe all-atom representation of water molecules, we could investigate the mobility of theseindividual particles.
Figure 4.37: Areas of high water density (> 0:06, > 0:07 and > 0:085 water molecule/Å3 forAAC_HOLO, ANT_HOLO, and APH_HOLO, respectively) around kanamycin A (in green) in thecomplexes with AMEs shown as blue surfaces and superimposed on average structures calculatedfor one of the three independent simulations; the transparent surface represents the water accessi-ble surface of the enzyme. The yellow circles mark the areas that were invariant in all ANT_HOLOsimulations.
Water molecules in AME binding sites provide additional stability of the complexes
The average water density areas in the AME binding sites are presented in Figure 4.37.Different density values had to be set for each of the AME:KAN complexes — in AAC_HOLOeven for values as low as 0:06 water molecules per Å3 the areas were well defined, while inAPH_HOLO and ANT_HOLO the visualization required higher water density thresholds.This demonstrates that in the AAC_HOLO simulation, the water molecules did not gatheraround the bound drug, in contrast to other AME simulations.
Inside the ANT binding site, many water dense areas were located between the atoms ofthe enzyme and the drug, which suggests that several indirect hydrogen bonds were formedin this complex. Moreover, since the antibiotic was quite dynamic inside the ANT cleft, thepositions of these areas differed slightly in each binding site, with only a few conservedareas, which are marked in Figure 4.37B. In contrast, the areas of high water density inAAC_HOLO were farther away from kanamycin A, indicating a vacant space where anotheraminoglycoside of different shape could fit (Figure 4.37A).
A few high water density areas in APH_HOLO were located between the drug andArg 211, Arg 226, Ile 258, Asp 261, and Glu 262, indicating that a complicated network ofhydrogen bonds was formed with these residues. Figure 4.38A presents an exemplary snap-shot from the APH_HOLO simulation, which illustrates this network of hydrogen bonds.The water molecules that were part of these interactions interchanged with the bulk water,but the pattern of the hydrogen bonds was preserved throughout each of the three separateAPH_HOLO simulations.
Similarly, in AAC_HOLO, some dense areas were positioned near ring II of the antibi-otic and residues Asp 152, Asp 179 (Figure 4.38B). Also here, these dense areas symbolize ahydrogen bond network formed between these amino acids. As previously mentioned, inthe third complex, ANT:KAN only a few water dense areas were invariant between differentsimulation runs and binding sites. These pointed to additional polar interactions formed by
Bacterial resistance mechanism 2: enzymatic aminoglycoside modification 105
the enzyme with kanamycin A, through the water molecules: (i) between the backbone moi-eties of Glu 141, Glu 142 and the oxygen O5 of KAN; (ii) between N1 of KAN and Glu 92,Ser 94, Asp 95; and (iii) between N3 of KAN and Glu 67, Glu 76 (Figure 4.38C).
In each simulation of the AME:KAN complexes, one or more water molecules wereexceptionally stable, with the calculated �-factor 6 30 Å2. While some of these “trapped”water molecules were positioned close to the bound drug, they never interacted with thedrug directly, only assisted in positioning the nearby residues. In ANT_HOLO, only a few ofthe trapped water molecules were located near one of the kanamycin A molecules and theyinteracted with different amino acids in each simulation. Therefore, perhaps these watermolecules were not significant for the complex formation. In the AAC_HOLO simulation,we found only one such stable water molecule, close to residues Tyr 93, Trp 103, Thr 151,Asp 152, Ile 114, and Asp 115 (Figure 4.39A). Interestingly, this was the same water moleculein each of the three independent runs of this simulation. In the last complex simulation,APH_HOLO, the trapped water molecules gathered close to the magnesium ions and helpedto stabilize the nearby amino acids, Asp 208 and Asp 190 (Figure 4.39B).
Although the strongest receptor:ligand interactions are those formed directly, watermolecules are often found in binding sites of experimentally resolved complex structures.It has been shown that these water molecules buried deeply inside active sites of enzymeshave different features from water in bulk.224 Moreover, displacing a water molecule thatbridges the receptor:ligand interaction and substituting it for a covalently bound moiety canlower the efficacy of binding.225 Other theoretical studies highlight the importance of tak-ing into account water-bridged interactions when analyzing structure activity relationshipsduring a drug design process.226 As described above, our simulations reveal potentiallyimportant sites for water-mediated interactions previously not explored.

106 RESULTS AND DISCUSSION
(A) APH_HOLO (B) AAC_HOLO
(C) ANT_HOLO
Figure 4.38: Water-mediated hydrogen bonds near kanamycin A in AME binding clefts. The bluesurfaces represent the areas of high water density (> 0:06, > 0:07 and > 0:085 water moleculesper Å3 for AAC_HOLO, ANT_HOLO, and APH_HOLO, respectively). In panels (A–B) the denseareas are superimposed on a snapshot from the simulations, which confirms that the shown water-bridged hydrogen bonds lasted for almost entire simulation. In panel (C) an average structure ofANT_HOLO is shown. The sticks are colored according to the atom type: H atoms are white, O —red, N — blue, C atoms of the antibiotic — green, other C atoms — cyan. The magnesium ion isshown as a pink sphere.
(A) AAC_HOLO (B) APH_HOLO
Figure 4.39: The most stable water molecules in the AME:KAN complexes. Snapshots from thesimulations showing the interactions between the enzyme, kanamycin A and the “trapped” watermolecules (in the case of APH_HOLO, �-factors for the water molecules for all three simulationswere 6 30 Å2; in the case of AAC_HOLO, mean �-factor for all three simulations was 13:5�2:3 Å2).The water molecules are shown as spheres, and the interacting residues — as sticks colored accordingto atom type: H atoms in white, O — red, N — blue, P — orange, C atoms of the antibiotic — green,C atoms of ATP or ACO — light blue, other C atoms — cyan. The magnesium ions are shown aspink spheres.
Bacterial resistance mechanism 2: enzymatic aminoglycoside modification 107
4.3.7 Energetical analysis of kanamcyin A complexes
Enzymes mimic predominantly electrostatic interactions
A per-residue decomposition of the MMGBSA binding free energies was performed toshow the most favorable interactions formed with kanamycin A in different receptors. InFigure 4.40 the five amino acids contributing the most to binding with kanamycin A are il-lustrated and their energetic contribution is decomposed into parts that come from the vander Waals (vdW), electrostatic (e-s) or non-polar term (related to the solvent accessible sur-face, sas). In the rRNA binding site, the phosphate backbone created the most favorableinteractions (phosphate groups of G1494 and A1493). However, the enzymes utilized theside chains of amino acids to mimic these interactions. As mentioned earlier, different aminoacids were involved in hydrogen bonding with kanamycin A, but the energetic analysisshows that the most important were Asp or Glu. In the A-site every aminoglycoside has itsring I stacked on top of G1491, which suggests that it is an important interaction. However,the energetical analysis shows that this base did not give a significant contribution to bind-ing (the van der Waals component of the energy was relatively strong, but the electrostaticpart did not favor binding; data not shown). This can possibly provide an explanation forthe majority of AMEs not reproducing the stacking inside their binding cleft. It could bemore efficient to focus on mimicking the electrostatic interactions. Moreover, amino acidsforming stacking have large hydrophobic side chains, which cannot change their conforma-tion as easily as e.g., Asp or Glu, and this flexibility is necessary if an enzyme is to adapt todifferent shapes and sizes of aminoglycosides.
The energetical analysis showed that the Glu residues from the aminoglycoside bindingloop in APH (residues from around Asp 150 to Asp 162) were the most important for kana-mycin A binding (Figure 4.40). In contrast, the amino acids forming the mobile loop in AAC(from Glu 47 to Arg 55) did not give such a strong contribution to the binding free energy —in the five most significant amino acids, only Trp 49 is present, contributing strongly throughthe stacking. This suggests that the role of this AAC fragment may be to block a prematurerelease of the drug from the binding pocket, while in APH, the loop specifically recognizesthe antibiotic. Importantly, the relative orientation of kanamycin A and the surface of thebinding pocket in APH is rotated by 180� when compared with the other two enzymes or theA-site, as can be seen in the bottom panels in Figure 4.40. This means that the most energet-ically favorable interactions were formed predominantly with rings II and III in the case ofthe APH_HOLO simulations, and with rings I and II in the case of the other receptors. Nev-ertheless, rings I and II were forming strong hydrogen bonds with APH, as shown earlier.Another uniqe feature of APH_HOLO is the high electrostatic contribution to binding of theC-terminal residues Asp 261, Glu 262 and Phe 264. These residues were forming hydrogenbonds with kanamycin A using both, their side chains and backbone, as shown by the de-composition of the energy in Figure 4.40 and by the hydrogen bond analysis in Table 4.9.These interactions are most likely the same in complexes with different aminoglycosides,because these amino acids are highly conserved within the APH(30) subfamily and impor-tant for the activity of these enzymes.222 The energetical analysis of the ANT:KAN complexis in agreement with recent mutational studies of ANT(40),220 which showed that the ANTdouble mutant E145Q/E76Q lacks enzyme activity, while the single mutants (E145Q andE76Q) had no substantial change in the reaction constants for modification of kanamycin A.Our energy decomposition demonstrated that both of these amino acids contribute favor-ably to the binding, and thus the lack of only one of these contributions would not have abig impact on the complex stability.

108 RESULTS AND DISCUSSION
Figure 4.40: Per-residue decomposition of the MMGBSA free binding energy for the studied AMEcomplexes (all energy values are given in kcal/mol).(three top panels) “Efficiency” was calculated as the ratio of the MMGBSA energy difference to thenumber of heavy atoms in the residue and only the five most important energetically residues areshown in order of decreasing significance. The MMGBSA energy difference (� energy) between thecalculated energy of a residue in the APO and HOLO simulations, is decomposed into: vdW = vander Waals interactions, e-s = electrostatic interactions, sas = non-polar contribution, related to thesolvent accessible surface area; abbreviations in brackets: bck = backbone, side = side chain.(bottom panels) The residues that favor kanamycin A binding (black sticks) are marked green andlabeled in the order of importance; the asterisks (*) mark ring I — notice that the orientation ofkanamycin A in the APH binding cleft is opposite to the one in the A-site.

Bacterial resistance mechanism 2: enzymatic aminoglycoside modification 109
4.3.8 Summary
The results from our simulations of AME representatives highlighted the similaritiesand differences between the aminoglycoside binding sites in these enzymes and in the rRNAA-site. The three enzymes were found to have different flexibility patterns, which we hy-pothesize correlates with different ways of achieving promiscuity towards aminoglycosides.The APH representative was the most flexible in the APO state, and it only stabilized uponcomplex formation with the drug. The different conformations sampled by this enzymeshow that the binding of the drug occurs through an induced fit mechanism. The AACenzyme was also flexible, mostly due to high mobility of the loops located over the amino-glycoside binding site. This finding is similar to what we observed in the APH simulations;however, in contrast to APH, the loop in AAC did not form energetically important inter-actions with the drug. We postulate that AAC is able to bind different aminoglycosidesbecause it possesses aromatic residues in the binding site that form stacking interactionswith the aminoglycoside rings. The third enzyme, ANT, was the least flexible, but its bind-ing site is comprised of many hydrogen bond donors that create direct and water-mediatedinteractions with aminoglycosides.
Our analysis demonstrated how similar the interactions formed by the enzymes andRNA with kanamycin A were. Although each enzyme has a slightly different electrostaticpotential inside its binding site, the hydrogen bonds and even stacking were literally copiedfrom the A-site:KAN complex. Energetic analysis confirmed that the most important in-teractions formed with kanamycin A were of the same nature, with Asp or Glu residuesmimicking the phosphate groups of RNA. In addition, we showed that water molecules areinvolved in stabilizing AME:KAN complexes, through a complicated network of hydrogenbonds with the amino acids inside the aminoglycoside binding sites.

Chapter 5
Conclusions and outlook
The research presented here focused on clarifying the atomic details of two mechanismsof bacterial resistance against aminoglycoside antibiotics: (i) mutations in the region of theprimary aminoglycoside binding site, the A-site in 16S rRNA; and (ii) chemical modificationof aminoglycosides by AMEs. The computational biophysical tools enabled us to study thestatic and dynamic features of the biomolecules that bind aminoglycosides inside bacterialcell. Additionally, we proposed a new tool that analyzes the conformations of a moleculeand defines its division into dynamic domains. This approach facilitates the description ofdynamic changes that can be sampled through NMR experiments or computer simulations.
In the first part of the research different mutations in the A-site were examined. Weshowed that these substitutions have different effects on the physicochemical features ofthis RNA fragment. Figure 5.1 illustrates this a concise manner. We have found that somemutations affected the shape of the aminoglycoside binding site, while some changed thecharge distribution. Our results are in accord with experimental findings and suggestedwhich aminoglycoside substituents should be modified so that aminoglycosides would alsobind to the mutated A-site to overcome mutation-related bacterial resistance.
Concerning the second bacterial resistance method, we have found both, similar anddissimilar features of the aminoglycoside binding sites in representative AMEs and RNA.We noted that the three AME representatives employ different techniques to effectively bindaminoglycosides that vary in shape and size. On the other hand, it appears that AMEs,built of amino acids, mimic the interaction sites from RNA, which is made of nucleic bases(illustrated in Figure 5.2). The energetic analysis showed that these interactions were copiedefficiently.
The main tool used here, MD simulation, enables detailed analysis of atomic interac-tions; however, due to its approximations, it has many drawbacks. The feature that mostinfluences the results is the limited sampling of one MD simulation, which is restricted toone or a few local energy minima. Therefore, we tried to increase the sampling by either sim-ulating two copies of a system or performing multiple simulation runs. However, even thiscannot guarantee observation of all conformations that are important for a given problem.Next, the force field is only a molecular-mechanics based approximation of a real descriptionof interatomic interactions, hence the potential energies of a molecule and the free bindingenergies give just a crude estimation of the real values and only their relative values can betaken into account. In addition, the time scales of conformational changes do not mirror theexperimental values, and therefore, the observations have only statistical meaning. More-over, even though the force fields have significantly improved since their first usage in the1970s, they are still far from being perfect. This is especially the case for RNA because theRNA-specific force fields were formulated only some time after the force fields for proteins.Nevertheless, when used with caution, MD simulation is a very powerful tool.
111

112 CONCLUSIONS AND OUTLOOK
Figure 5.1: Graphical representation of key findings concerning mutations in the rRNA A-site. Themutations studied here led to different changes in the physicochemical features of the binding site:the biggest changes were caused by the double mutation U1406C/U1495A, including disruption ofthe hydrogen bonds formed with its complex with paromomycin; mutations in position 1491 alteredthe shape of the binding cleft; all mutations affected the mobility of A1492 and A1493 (shown hereare exemplary values presenting the percentage of the simulation time when each adenine was in theflipped-in state).
Figure 5.2: Graphical representation of key findings concerning AME-mediated aminoglycosidemodifications. Kanamycin A is recognized and bound by different biomolecules: (from top right, anti-clockwise) the rRNA A-site, the very flexible APH(30,500)-IIIa, the dimeric and relatively rigid ANT(40),and the flexible AAC(60)-Ib. Despite the intrinsic differences in the entities that compose these recep-tors (nucleotides in RNA and amino acids in AMEs), these various biomolecules create very similarenvironment inside the aminoglycoside binding sites, utilizing mainly electrostatic interactions toeffectively bind aminoglycosides.

113
The results presented here may lead to some aminoglycoside modifications that wouldenable them to bind to the rRNA A-site but hinder binding to AMEs. Then, a properstructure-based drug design approach could be employed to yield several compounds thatcould be tested in the laboratory. Apart from application to antibiotic design, the AME su-perfamily presents an elegant system for studying the relation between structure and func-tion of a protein. The enzymes from the different families, AACs, ANTs, and APHs, differin structure, but still perform the same function. Moreover, the AAC(60)-Ib studied here hasa unique sequence but similar structure to other AAC(60) enzymes. The modeling meth-ods and comparative analysis of more AME:drug complexes could give insight into specificfeatures that must be present in order for different structures to perform a similar function.In addition, aminoglycosides and their receptors, especially RNA, are a strong test systemfor improving existing docking procedures. Not only must the drugs be adjusted to thereceptor, but both the RNA and AMEs have different conformations when bound to dif-ferent ligands, which was also shown here. Therefore, development of the flexible dockingprocedures is needed. Moreover, none of the well-established docking programs account forwater molecules in a binding site, which can significantly increase the stability of a complex.
Finally, we presented a new algorithm for analyzing conformational changes in biomol-ecules, GeoStaS. We have shown that our new approach performs better than a commonlyused tool, DCCM, to analyze MD simulations. Our algorithm and software correctly rec-ognizes correlated motions and can facilitate the analysis of large trajectories through vi-sualization of the identified dynamic domains. However, the implementation still needssome improvement. We plan to test another method of clustering AMSM, and improvethe process of choosing the optimal division into dynamic domains. Additionally, to com-plete the description of the conformational diversity of a molecule, we would like to finda representative set of conformations, i.e., cluster a trajectory. These transitions can thenbe presented as relations between the clusters, and the relative orientations of the dynamicdomains can efficiently describe the clusters. Such an approach would enable researchers tofocus on important details of the molecular interactions rather than on the time-consumingpost-processing of a trajectory.


Bibliography
[1] Sköld, O. (2011) Antibiotics and Antibiotic Resistance. Wiley.
[2] Eagon, R. G. (1962) Pseudomonas natriegens, a marine bacterium with a generation time ofless than 10 minutes. J Bacteriol, 83, 736–7.
[3] D’Costa, V. M., et al. (2011) Antibiotic resistance is ancient. Nature, 477, 457–461.
[4] Ditzler, M. A., Otyepka, M., Šponer, J., and Walter, N. G. (2010) Molecular Dynamics and Quan-tum Mechanics of RNA: Conformational and Chemical Change We Can Believe In. AccountsChem Res, 43, 40–47.
[5] Šponer, J. and Lankaš, F. (eds.) (2006) Computational studies of RNA and DNA. Springer.
[6] Schneider, G. and Baringhaus, K.-H. (2008) Molecular Design: Concepts and Applications. Wiley-VCH.
[7] Caminero, J. A., Sotgiu, G., Zumla, A., and Migliori, G. B. (2010) Best drug treatment formultidrug-resistant and extensively drug-resistant tuberculosis. Lancet Infect Dis, 10, 621–9.
[8] World Health Organization (2010) Multidrug and extensively drug-resistant TB (M/XDR-TB).Global Report on Surveillance and Response. Tech. rep., World Health Organization.
[9] Walsh, C. (2003) Antibiotics: Actions, Origins, Resistance. Amer Society for Microbiology.
[10] Vakulenko, S. B. and Mobashery, S. (2003) Versatility of aminoglycosides and prospects fortheir future. Clin Microbiol Rev, 16, 430–50.
[11] Jana, S. and Deb, J. K. (2006) Molecular understanding of aminoglycoside action and resistance.Appl Microbiol Biot, 70, 140–50.
[12] Kaul, M., Barbieri, C. M., Kerrigan, J. E., and Pilch, D. S. (2003) Coupling of Drug Protonation tothe Specific Binding of Aminoglycosides to the A Site of 16S rRNA: Elucidation of the Numberof Drug Amino Groups Involved and their Identities. J Mol Biol, 326, 1373–1387.
[13] Ramakrishnan, V. (2002) Ribosome structure and the mechanism of translation. Cell, 108, 557–72.
[14] Magnet, S. and Blanchard, J. S. (2005) Molecular insights into aminoglycoside action and resis-tance. Chem Rev, 105, 477–98.
[15] Tselika, S., Konstantinidis, T. C., and Synetos, D. (2008) Two nucleotide substitutions in theA-site of yeast 18S rRNA affect translation and differentiate the interaction of ribosomes withaminoglycoside antibiotics. Biochimie, 90, 908–17.
[16] Pfister, P., Risch, M., Brodersen, D. E., and Böttger, E. C. (2003) Role of 16S rRNA Helix 44 inRibosomal Resistance to Hygromycin B. Antimicrob Agents Ch, 47, 1496–502.
[17] Hobbie, S. N., Akshay, S., Kalapala, S. K., Bruell, C. M., Shcherbakov, D., and Böttger, E. C.(2008) Genetic analysis of interactions with eukaryotic rRNA identify the mitoribosome astarget in aminoglycoside ototoxicity. P Natl Acad Sci USA, 105, 20888–93.
[18] Fourmy, D., Yoshizawa, S., and Puglisi, J. D. (1998) Paromomycin binding induces a local con-formational change in the A-site of 16 S rRNA. J Mol Biol, 277, 333–45.
115

116 BIBLIOGRAPHY
[19] Lynch, S. R. and Puglisi, J. D. (2001) Structure of a eukaryotic decoding region A-site RNA.J Mol Biol, 306, 1023–35.
[20] Meroueh, S. O. and Mobashery, S. (2007) Conformational transition in the aminoacyl t-RNAsite of the bacterial ribosome both in the presence and absence of an aminoglycoside antibiotic.Chem Biol Drug Des, 69, 291–7.
[21] Fan-Minogue, H. and Bedwell, D. M. (2008) Eukaryotic ribosomal RNA determinants ofaminoglycoside resistance and their role in translational fidelity. RNA, 14, 148–57.
[22] Laurberg, M., Asahara, H., Korostelev, A., Zhu, J., Trakhanov, S., and Noller, H. F. (2008) Struc-tural basis for translation termination on the 70S ribosome. Nature, 454, 852–7.
[23] Korostelev, A., Asahara, H., Lancaster, L., Laurberg, M., Hirschi, A., Zhu, J., Trakhanov, S.,Scott, W. G., and Noller, H. F. (2008) Crystal structure of a translation termination complexformed with release factor RF2. P Natl Acad Sci USA, 105, 19684–9.
[24] McClory, S. P., Leisring, J. M., Qin, D., and Fredrick, K. (2010) Missense suppressor mutationsin 16S rRNA reveal the importance of helices h8 and h14 in aminoacyl-tRNA selection. RNA,16, 1925–34.
[25] Carter, A. P., Clemons, W. M., Brodersen, D. E., Morgan-Warren, R. J., Wimberly, B. T., andRamakrishnan, V. (2000) Functional insights from the structure of the 30S ribosomal subunitand its interactions with antibiotics. Nature, 407, 340–8.
[26] Shandrick, S., Zhao, Q., Han, Q., Ayida, B. K., Takahashi, M., Winters, G. C., Simonsen, K. B.,Vourloumis, D., and Hermann, T. (2004) Monitoring molecular recognition of the ribosomaldecoding site. Angew Chem Int Edit, 43, 3177–82.
[27] Chao, P.-W. and Chow, C. S. (2007) Monitoring aminoglycoside-induced conformationalchanges in 16S rRNA through acrylamide quenching. Bioorg Med Chem, 15, 3825–31.
[28] Houghton, J. L., Green, K. D., Chen, W., and Garneau-Tsodikova, S. (2010) The Future ofAminoglycosides: The End or Renaissance? ChemBioChem, 11, 880–902.
[29] Nudelman, I., Rebibo-Sabbah, A., Shallom-Shezifi, D., Hainrichson, M., Stahl, I., Ben-Yosef, T.,and Baasov, T. (2006) Redesign of aminoglycosides for treatment of human genetic diseasescaused by premature stop mutations. Bioorg Med Chem Lett, 16, 6310–5.
[30] Wimberly, B. T., Brodersen, D. E., Clemons, W. M., Morgan-Warren, R. J., Carter, A. P., Von-rhein, C., Hartsch, T., and Ramakrishnan, V. (2000) Structure of the 30S ribosomal subunit.Nature, 407, 327–39.
[31] François, B., Russell, R. J. M., Murray, J. B., Aboul-ela, F., Masquida, B., Vicens, Q., and West-hof, E. (2005) Crystal structures of complexes between aminoglycosides and decoding A siteoligonucleotides: role of the number of rings and positive charges in the specific binding lead-ing to miscoding. Nucl Acids Res, 33, 5677–90.
[32] Xi, H., Kumar, S., Dosen-Micovic, L., and Arya, D. P. (2010) Calorimetric and spectroscopicstudies of aminoglycoside binding to AT-rich DNA triple helices. Biochimie, 92, 514–529.
[33] Schroeder, R., Waldsich, C., and Wank, H. (2000) Modulation of RNA function by aminoglyco-side antibiotics. EMBO J, 19, 1–9.
[34] Recht, M. I., Fourmy, D., Blanchard, S. C., Dahlquist, K. D., and Puglisi, J. D. (1996) RNAsequence determinants for aminoglycoside binding to an A-site rRNA model oligonucleotide.J Mol Biol, 262, 421–36.
[35] Anderson, P. C. and Mecozzi, S. (2007) Minimum sequence requirements for the binding ofparomomycin to the rRNA decoding site A. Biopolymers, 86, 95–111.
[36] Tran, T. and Disney, M. D. (2010) Two-dimensional combinatorial screening of a bacterial rRNAA-site-like motif library: defining privileged asymmetric internal loops that bind aminoglyco-sides. Biochemistry, 49, 1833–42.
BIBLIOGRAPHY 117
[37] Hermann, T. and Westhof, E. (1998) RNA as a drug target: chemical, modelling, and evolution-ary tools. Curr Opin Biotech, 9, 66–73.
[38] Tor, Y. (2006) The ribosomal A-site as an inspiration for the design of RNA binders. Biochimie,88, 1045–51.
[39] Tor, Y. and Westhof, E. (1998) Deciphering RNA recognition: the hammerhead ribozyme. ChemBiol, 5, R277–R283.
[40] Lorian, V. (ed.) (2005) Antibiotics in Laboratory Medicine. Lippincott Williams & Wilkins.
[41] Hobbie, S. N., Pfister, P., Brüll, C., Westhof, E., and Böttger, E. C. (2005) Analysis of the contribu-tion of individual substituents in 4,6-aminoglycoside-ribosome interaction. Antimicrob AgentsCh, 49, 5112–8.
[42] Hobbie, S. N., Pfister, P., Bruell, C., Sander, P., François, B., Westhof, E., and Böttger, E. C. (2006)Binding of neomycin-class aminoglycoside antibiotics to mutant ribosomes with alterations inthe A site of 16S rRNA. Antimicrob Agents Ch, 50, 1489–96.
[43] De Stasio, E. A. and Dahlberg, A. E. (1990) Effects of mutagenesis of a conserved base-pairedsite near the decoding region of Escherichia coli 16 S ribosomal RNA. J Mol Biol, 212, 127–33.
[44] Recht, M. I., Douthwaite, S., Dahlquist, K. D., and Puglisi, J. D. (1999) Effect of mutations in theA site of 16 S rRNA on aminoglycoside antibiotic-ribosome interaction. J Mol Biol, 286, 33–43.
[45] Hobbie, S. N., Bruell, C., Kalapala, S., Akshay, S., Schmidt, S., Pfister, P., and Böttger, E. C.(2006) A genetic model to investigate drug-target interactions at the ribosomal decoding site.Biochimie, 88, 1033–43.
[46] Gregory, S. T., Carr, J. F., Rodriguez-Correa, D., and Dahlberg, A. E. (2005) Mutational analysisof 16S and 23S rRNA genes of Thermus thermophilus. J Bacteriol, 187, 4804–12.
[47] Vila-Sanjurjo, A., Lu, Y., Aragonez, J. L., Starkweather, R. E., Sasikumar, M., and O’Connor, M.(2007) Modulation of 16S rRNA function by ribosomal protein S12. Biochim Biophys Acta, 1769,462–71.
[48] Pfister, P., Hobbie, S. N., Brüll, C., Corti, N., Vasella, A., Westhof, E., and Böttger, E. C. (2005)Mutagenesis of 16S rRNA C1409-G1491 base-pair differentiates between 6’OH and 6’NH3+aminoglycosides. J Mol Biol, 346, 467–75.
[49] Pfister, P., Hobbie, S. N., Vicens, Q., Böttger, E. C., and Westhof, E. (2003) The molecular basisfor A-site mutations conferring aminoglycoside resistance: relationship between ribosomalsusceptibility and X-ray crystal structures. Chembiochem, 4, 1078–88.
[50] Lynch, S. R. and Puglisi, J. D. (2001) Structural origins of aminoglycoside specificity forprokaryotic ribosomes. J Mol Biol, 306, 1037–58.
[51] Shcherbakov, D., Akbergenov, R., Matt, T., Sander, P., Andersson, D. I., and Böttger, E. C.(2010) Directed mutagenesis of Mycobacterium smegmatis 16S rRNA to reconstruct the in-vivo evolution of aminoglycoside resistance in Mycobacterium tuberculosis. Mol Microbiol, 77,830–840.
[52] Corzana, F., Cuesta, I., Freire, F., Revuelta, J., Torrado, M., Bastida, A., Jiménez-Barbero, J., andAsensio, J. L. (2007) The pattern of distribution of amino groups modulates the structure anddynamics of natural aminoglycosides: implications for RNA recognition. J Am Chem Soc, 129,2849–2865.
[53] Doi, Y. and Arakawa, Y. (2007) 16S ribosomal RNA methylation: emerging resistance mecha-nism against aminoglycosides. Clin Infect Dis, 45, 88–94.
[54] Kimura, S. and Suzuki, T. (2010) Fine-tuning of the ribosomal decoding center by conservedmethyl-modifications in the Escherichia coli 16S rRNA. Nucl Acids Res, 38, 1341–1352.
[55] Ramirez, M. S. and Tolmasky, M. E. (2010) Aminoglycoside modifying enzymes. Drug ResistUpdate, 13, 151–71.

118 BIBLIOGRAPHY
[56] Llano-Sotelo, B., Azucena, E. F., Kotra, L. P., Mobashery, S., and Chow, C. S. (2002) Aminogly-cosides modified by resistance enzymes display diminished binding to the bacterial ribosomalaminoacyl-tRNA site. Chem Biol, 9, 455–463.
[57] Vetting, M. W., de Carvalho, L. P. S., Yu, M., Hegde, S. S., Magnet, S., Roderick, S. L., andBlanchard, J. S. (2005) Structure and functions of the GNAT superfamily of acetyltransferases.Arch Biochem Biophys, 433, 212–26.
[58] Daigle, D. M., McKay, G. A., Thompson, P. R., and Wright, G. D. (1999) Aminoglycoside an-tibiotic phosphotransferases are also serine protein kinases. Chem Biol, 6, 11–8.
[59] Lombès, T., Bégis, G., Maurice, F., Turcaud, S., Lecourt, T., Dardel, F., and Micouin, L. (2008)NMR-guided fragment-based approach for the design of AAC(60)-Ib ligands. ChemBioChem, 9,1368–71.
[60] Vetting, M. W., Park, C. H., Hegde, S. S., Jacoby, G. A., Hooper, D. C., and Blanchard, J. S. (2008)Mechanistic and structural analysis of aminoglycoside N-acetyltransferase AAC(60)-Ib and itsbifunctional, fluoroquinolone-active AAC(60)-Ib-cr variant. Biochemistry, 47, 9825–35.
[61] Rather, P. N., Munayyer, H., Mann, P. A., Hare, R. S., Miller, G. H., and Shaw, K. J. (1992)Genetic analysis of bacterial acetyltransferases: identification of amino acids determining thespecificities of the aminoglycoside 60-N-acetyltransferase Ib and IIa proteins. J Bacteriol, 174,3196–203.
[62] Shmara, A., Weinsetel, N., Dery, K. J., Chavideh, R., and Tolmasky, M. E. (2001) Systematicanalysis of a conserved region of the aminoglycoside 60-N-acetyltransferase type Ib. AntimicrobAgents Ch, 45, 3287–92.
[63] Casin, I., Hanau-Berçot, B., Podglajen, I., Vahaboglu, H., and Collatz, E. (2003) Salmonellaenterica serovar Typhimurium bla(PER-1)-carrying plasmid pSTI1 encodes an extended-spectrum aminoglycoside 60-N-acetyltransferase of type Ib. Antimicrob Agents Ch, 47, 697–703.
[64] Pourreza, A., Witherspoon, M., Fox, J., Newmark, J., Bui, D., and Tolmasky, M. E. (2005) Mu-tagenesis analysis of a conserved region involved in acetyl coenzyme A binding in the amino-glycoside 60-N-acetyltransferase type Ib encoded by plasmid pJHCMW1. Antimicrob Agents Ch,49, 2979–82.
[65] Burk, D. L., Ghuman, N., Wybenga-Groot, L. E., and Berghuis, A. M. (2003) X-ray structureof the AAC(60)-Ii antibiotic resistance enzyme at 1.8 A resolution; examination of oligomericarrangements in GNAT superfamily members. Protein Sci, 12, 426–437.
[66] Sakon, J., Liao, H. H., Kanikula, A. M., Benning, M. M., Rayment, I., and Holden, H. M. (1993)Molecular structure of kanamycin nucleotidyltransferase determined to 3 Å resolution. Bio-chemistry, 32, 11977–11984.
[67] Revuelta, J., Vacas, T., Torrado, M., Corzana, F., Gonzalez, C., Jiménez-Barbero, J., Menendez,M., Bastida, A., and Asensio, J. L. (2008) NMR-based analysis of aminoglycoside recognitionby the resistance enzyme ANT(40): the pattern of OH/NH3(+) substitution determines thepreferred antibiotic binding mode and is critical for drug inactivation. J Am Chem Soc, 130,5086–103.
[68] Pedersen, L. C., Benning, M. M., and Holden, H. M. (1995) Structural investigation of theantibiotic and ATP-binding sites in kanamycin nucleotidyltransferase. Biochemistry, 34, 13305–13311.
[69] Thompson, P. R., Hughes, D. W., and Wright, G. D. (1996) Mechanism of aminoglycoside 30-phosphotransferase type IIIa: His188 is not a phosphate-accepting residue. Chem Biol, 3, 747–55.
[70] Boehr, D. D., Thompson, P. R., and Wright, G. D. (2001) Molecular mechanism of aminogly-coside antibiotic kinase APH(30)-IIIa: roles of conserved active site residues. J Biol Chem, 276,23929–36.

BIBLIOGRAPHY 119
[71] Thompson, P. R., Boehr, D. D., Berghuis, A. M., and Wright, G. D. (2002) Mechanism of amino-glycoside antibiotic kinase APH(30)-IIIa: role of the nucleotide positioning loop. Biochemistry,41, 7001–7.
[72] Wu, L. and Serpersu, E. H. (2009) Deciphering Interactions of the AminoglycosidePhosphotransferase(30)- IIIa with its Ligands. Biopolymers, 91, 801–809.
[73] Burk, D. L., Hon, W. C., Leung, A. K., and Berghuis, A. M. (2001) Structural analyses of nu-cleotide binding to an aminoglycoside phosphotransferase. Biochemistry, 40, 8756–64.
[74] Fong, D. H. and Berghuis, A. M. (2002) Substrate promiscuity of an aminoglycoside antibioticresistance enzyme via target mimicry. EMBO J, 21, 2323–2331.
[75] Norris, A. L. and Serpersu, E. H. (2009) NMR detected hydrogen-deuterium exchange revealsdifferential dynamics of antibiotic- and nucleotide-bound aminoglycoside phosphotransferase3’-IIIa. J Am Chem Soc, 131, 8587–94.
[76] Cox, J. R., McKay, G. A., Wright, G. D., and Serpersu, E. H. (1996) Arrangement of Substratesat the Active Site of an Aminoglycoside Antibiotic 30-Phosphotransferase As Determined byNMR. J Am Chem Soc, 118, 1295–1301.
[77] Cox, J. R. and Serpersu, E. H. (1997) Biologically important conformations of aminoglycosideantibiotics bound to an aminoglycoside 30-phosphotransferase as determined by transferrednuclear Overhauser effect spectroscopy. Biochemistry, 36, 2353–2359.
[78] Cox, J. R., Ekman, D. R., DiGiammarino, E. L., Akal-Strader, A., and Serpersu, E. H. (2000)Aminoglycoside antibiotics bound to aminoglycoside-detoxifying enzymes and RNA adoptsimilar conformations. Cell Biochem Biophys, 33, 297–308.
[79] Serpersu, E. H., Cox, J. R., DiGiammarino, E. L., Mohler, M. L., Ekman, D. R., Akal-Strader,A., and Owston, M. (2000) Conformations of antibiotics in active sites of aminoglycoside-detoxifying enzymes. Cell Biochem Biophys, 33, 309–21.
[80] Bastida, A., et al. (2006) Exploring the use of conformationally locked aminoglycosides as anew strategy to overcome bacterial resistance. J Am Chem Soc, 128, 100–16.
[81] Hermann, T. and Westhof, E. (1999) Docking of cationic antibiotics to negatively charged pock-ets in RNA folds. J Med Chem, 42, 1250–61.
[82] Réblová, K., Lankaš, F., Rázga, F., Krasovska, M. V., Koca, J., and Šponer, J. (2006) Structure,dynamics, and elasticity of free 16S rRNA helix 44 studied by molecular dynamics simulations.Biopolymers, 82, 504–20.
[83] Sanbonmatsu, K. Y. (2006) Energy landscape of the ribosomal decoding center. Biochimie, 88,1053–9.
[84] Vaiana, A. C., Westhof, E., and Auffinger, P. (2006) A molecular dynamics simulation study ofan aminoglycoside/A-site RNA complex: conformational and hydration patterns. Biochimie,88, 1061–73.
[85] Romanowska, J., Setny, P., and Trylska, J. (2008) Molecular dynamics study of the ribosomalA-site. J Phys Chem B, 112, 15227–43.
[86] Chen, S.-Y. and Lin, T.-H. (2010) A molecular dynamics study on binding recognition betweenseveral 4,5 and 4,6-linked aminoglycosides with A-site RNA. J Mol Recognit, 23, 423–34.
[87] Vaiana, A. C. and Sanbonmatsu, K. Y. (2009) Stochastic gating and drug-ribosome interactions.J Mol Biol, 386, 648–61.
[88] Długosz, M., Antosiewicz, J. M., and Trylska, J. (2008) Association of aminoglycosidic antibi-otics with the ribosomal A-site studied with Brownian dynamics. J Chem Theory Comput, 4,549–559.
[89] Długosz, M. and Trylska, J. (2009) Aminoglycoside association pathways with the 30S riboso-mal subunit. J Phys Chem B, 113, 7322–30.

120 BIBLIOGRAPHY
[90] Yang, G., Trylska, J., Tor, Y., and McCammon, J. A. (2006) Binding of aminoglycosidic an-tibiotics to the oligonucleotide A-site model and 30S ribosomal subunit: Poisson-Boltzmannmodel, thermal denaturation, and fluorescence studies. J Med Chem, 49, 5478–90.
[91] Krishna, V., Kumar, K. S. V., Anishetty, S., and Pennathur, G. (2009) Investigations on DomainMovements of N-Acetyltransferase in Nano Scale. J Nanosci Nanotechno, 9, 5493–5496.
[92] Hu, X., Norris, A. L., Baudry, J. Y., and Serpersu, E. H. (2011) Coenzyme-A Binding to theAminoglycoside Acetyltransferase (3)-IIIb Increases Conformational Sampling of AntibioticBinding Site. Biochemistry, 50, 10559–10565.
[93] Infectious Diseases Society of America (2010) The 10 x ’20 Initiative: pursuing a global com-mitment to develop 10 new antibacterial drugs by 2020. Clin Infect Dis, 50, 1081–3.
[94] Herper, M. (2012) The Truly Staggering Cost Of Inventing New Drugs. Forbes.
[95] Zhou, J., Wang, G., Zhang, L.-H., and Ye, X.-S. (2007) Modifications of aminoglycoside antibi-otics targeting RNA. Med Res Rev, 27, 279–316.
[96] Hotta, K., Sunada, A., Ikeda, Y., and Kondo, S. (2000) Double stage activity in aminoglycosideantibiotics. J Antibiot, 53, 1168–74.
[97] Shaul, P., Green, K. D., Rutenberg, R., Kramer, M., Berkov-Zrihen, Y., Breiner-Goldstein, E.,Garneau-Tsodikova, S., and Fridman, M. (2011) Assessment of 6’- and 6”’-N-acylation ofaminoglycosides as a strategy to overcome bacterial resistance. Org Biomiol Chem, 9, 4057–63.
[98] Kondo, J., Pachamuthu, K., François, B., Szychowski, J., Hanessian, S., and Westhof, E. (2007)Crystal structure of the bacterial ribosomal decoding site complexed with a synthetic doublyfunctionalized paromomycin derivative: a new specific binding mode to an A-minor motifenhances in vitro antibacterial activity. ChemMedChem, 2, 1631–8.
[99] Baussanne, I., Bussière, A., Halder, S., Ganem-Elbaz, C., Ouberai, M., Riou, M., Paris, J.-M.,Ennifar, E., Mingeot-Leclercq, M.-P., and Décout, J.-L. (2010) Synthesis and antimicrobial eval-uation of amphiphilic neamine derivatives. J Med Chem, 53, 119–27.
[100] Yan, R.-B., Yuan, M., Wu, Y., You, X., and Ye, X.-S. (2011) Rational design and synthesis ofpotent aminoglycoside antibiotics against resistant bacterial strains. Bioorg Med Chem, 19, 30–40.
[101] Armstrong, E. S. and Miller, G. H. (2010) Combating evolution with intelligent design: theneoglycoside ACHN-490. Curr Opin Microbiol, 13, 565–73.
[102] Pokrovskaya, V., Belakhov, V., Hainrichson, M., Yaron, S., and Baasov, T. (2009) Design, synthe-sis, and evaluation of novel fluoroquinolone-aminoglycoside hybrid antibiotics. J Med Chem,52, 2243–54.
[103] Hammes, G. G. (2005) Spectroscopy for the Biological Sciences. Wiley-Interscience.
[104] Berman, H. M., Westbrook, J., Feng, Z., Gilliland, G., Bhat, T. N., Weissig, H., Shindyalov, I. N.,and Bourne, P. E. (2000) The Protein Data Bank. Nucl Acids Res, 28, 235–242.
[105] Piela, L. (2007) Ideas of Quantum Chemistry. Elsevier Science.
[106] Atkins, P. and de Paula, J. (2005) Physical Chemistry for the Life Sciences. Oxford University Press.
[107] Stenta, M. and Dal Peraro, M. (2011) An introduction to quantum chemical methods appliedto drug design. Front Biosci, 3, 1061–78.
[108] Rassolov, V. A., Ratner, M. A., Pople, J. A., Redfern, P. C., and Curtiss, L. A. (2001) 6-31G* basisset for third-row atoms. J Comput Chem, 22, 976–984.
[109] Frisch, M. J., Pople, J. A., and Binkley, J. S. (1984) Self-consistent molecular orbital methods 25.Supplementary functions for Gaussian basis sets. J Chem Phys, 80, 3265.
[110] Bayly, C. I., Cieplak, P., Cornell, W., and Kollman, P. A. (1993) A well-behaved electrostaticpotential based method using charge restraints for deriving atomic charges: the RESP model.J Phys Chem, 97, 10269–10280.
BIBLIOGRAPHY 121
[111] Jakalian, A., Bush, B. L., Jack, D. B., and Bayly, C. I. (2000) Fast, efficient generation of high-quality atomic charges. AM1-BCC model: I. Method. J Comput Chem, 21, 132–146.
[112] Jakalian, A., Jack, D. B., and Bayly, C. I. (2002) Fast, efficient generation of high-quality atomiccharges. AM1-BCC model: II. Parameterization and validation. J Comput Chem, 23, 1623–41.
[113] Mobley, D. L., Dumont, E., Chodera, J. D., and Dill, K. A. (2007) Comparison of charge modelsfor fixed-charge force fields: small-molecule hydration free energies in explicit solvent. J PhysChem B, 111, 2242–54.
[114] Tsai, K.-C., Chen, Y.-C., Hsiao, N.-W., Wang, C.-L., Lin, C.-L., Lee, Y.-C., Li, M., and Wang, B.(2010) A comparison of different electrostatic potentials on prediction accuracy in CoMFA andCoMSIA studies. Eur J Med Chem, 45, 1544–51.
[115] Schlick, T. (2006) Molecular Modeling and Simulation. An Interdisciplinary Guide. Springer.
[116] MacKerell, Jr., A. D. (2001) Atomistic Models and Force Fields. Becker, O. M., MacKerell, Jr.,A. D., Roux, B., and Watanabe, M. (eds.), Computational biochemistry and biophysics, pp. 7–38,Taylor & Francis.
[117] Becker, O. M. (2001) Conformational Analysis. Becker, O. M., MacKerell, Jr., A. D., Roux, B.,and Watanabe, M. (eds.), Computational biochemistry and biophysics, chap. 4, pp. 69–90, Taylor &Francis.
[118] Becker, O. M. and Watanabe, M. (2001) Dynamics methods. Becker, O. M., MacKerell, Jr., A. D.,Roux, B., and Watanabe, M. (eds.), Computational biochemistry and biophysics, chap. 3, pp. 39–67,Taylor & Francis.
[119] Darden, T., York, D., and Pedersen, L. (1993) Particle mesh Ewald: An Nlog(N) method forEwald sums in large systems. J Chem Phys, 98, 10089.
[120] Rhodes, G. (2006) Crystallography Made Crystal Clear, Third Edition: A Guide for Users of Macro-molecular Models (Complementary Science). Academic Press.
[121] Feller, S. E., Zhang, Y., Pastor, R. W., and Brooks, B. R. (1995) Constant pressure moleculardynamics simulation: The Langevin piston method. J Chem Phys, 103, 4613.
[122] (2000) Handbook of Chemistry and Physics, 81st Edition. CRC Press.
[123] Ryckaert, J.-P., Ciccotti, G., and Berendsen, H. J. C. (1977) Numerical integration of the cartesianequations of motion of a system with constraints: Molecular dynamics of n-alkanes. J ComputPhys, 23, 327–341.
[124] Amadei, A., Linssen, A. B. M., and Berendsen, H. J. C. (1993) Essential dynamics of proteins.Proteins, 17, 412–25.
[125] Harte, W. E., Swaminathan, S., Mansuri, M. M., Martin, J. C., Rosenberg, I. E., and Beveridge,D. L. (1990) Domain communication in the dynamical structure of human immunodeficiencyvirus 1 protease. P Natl Acad Sci USA, 87, 8864–8.
[126] Arunan, E., et al. (2011) Definition of the hydrogen bond (IUPAC Recommendations 2011).Pure Appl Chem, 83, 1637–1641.
[127] Bloomfield, V. A., Crothers, D. M., and Tinoco, I. (2000) Nucleic Acids: Structures, Properties, andFunctions. University Science Books.
[128] Sinnokrot, M. O., Valeev, E. F., and Sherrill, C. D. (2002) Estimates of the ab initio limit for pi-piinteractions: the benzene dimer. J Am Chem Soc, 124, 10887–93.
[129] Baker, N. A., Bashford, D., and Case, D. A. (2006) Implicit Solvent Electrostatics in Biomolecu-lar Simulation. New Algorithms for Macromolecular Simulation, vol. 49, pp. 263–295, Springer.
[130] Grochowski, P. and Trylska, J. (2008) Continuum molecular electrostatics, salt effects, and coun-terion binding–a review of the Poisson-Boltzmann theory and its modifications. Biopolymers,89, 93–113.

122 BIBLIOGRAPHY
[131] Darden, T. A. (2001) Treatment of Long-Range Forces and Potential. Becker, O. M., MacKerell,Jr., A. D., Roux, B., and Watanabe, M. (eds.), Computational biochemistry and biophysics, chap. 5,pp. 91–114, Taylor & Francis.
[132] Onufriev, A., Case, D. A., and Bashford, D. (2002) Effective Born radii in the generalized Bornapproximation: the importance of being perfect. J Comput Chem, 23, 1297–304.
[133] Dill, K. A. and Bromberg, S. (2002) Molecular Driving Forces: Statistical Thermodynamics in Chem-istry & Biology. Garland Science.
[134] Reddy, M. R. and Erion, M. D. (2001) Free energy calculations in rational drug design. KluwerAcademic/Plenum Publishers, 1st edn.
[135] Schäfer, H., Mark, A. E., and van Gunsteren, W. F. (2000) Absolute entropies from moleculardynamics simulation trajectories. J Chem Phys, 113, 7809.
[136] Hayward, S. (2001) Normal Mode Analysis of Biological Molecules. Becker, O. M., MacKerell,Jr., A. D., Roux, B., and Watanabe, M. (eds.), Computational biochemistry and biophysics, pp. 153–168, Taylor & Francis.
[137] Gohlke, H., Kiel, C., and Case, D. A. (2003) Insights into Protein–Protein Binding by BindingFree Energy Calculation and Free Energy Decomposition for the Ras–Raf and Ras–RalGDSComplexes. J Mol Biol, 330, 891–913.
[138] Cai, Y. and Schiffer, C. A. (2010) Decomposing the energetic impact of drug resistant mutationsin HIV-1 protease on binding DRV. J Chem Theory Comput, 6, 1358–1368.
[139] Desheng, L., Jian, G., Yuanhua, C., Wei, C., Huai, Z., and Mingjuan, J. (2011) Molecu-lar dynamics simulations and MM/GBSA methods to investigate binding mechanisms ofaminomethylpyrimidine inhibitors with DPP-IV. Bioorg Med Chem Lett, 21, 6630–5.
[140] Kaul, M. and Pilch, D. S. (2002) Thermodynamics of aminoglycoside-rRNA recognition: thebinding of neomycin-class aminoglycosides to the A site of 16S rRNA. Biochemistry, 41, 7695–706.
[141] Hermann, T. (2006) A-site model RNAs. Biochimie, 88, 1021–6.
[142] Vicens, Q. and Westhof, E. (2001) Crystal structure of paromomycin docked into the eubacterialribosomal decoding A site. Structure, 9, 647–58.
[143] Case, D. A., et al. (2006) AMBER 9. University of California, San Francisco.
[144] Case, D. A., et al. (2010) Amber 11. University of California, San Francisco.
[145] Jorgensen, W. L., Chandrasekhar, J., Madura, J. D., Impey, R. W., and Klein, M. L. (1983) Com-parison of simple potential functions for simulating liquid water. J Chem Phys, 79, 926.
[146] Wang, J., Cieplak, P., and Kollman, P. A. (2000) How well does a restrained electrostatic po-tential (RESP) model perform in calculating conformational energies of organic and biologicalmolecules? J Comput Chem, 21, 1049–1074.
[147] Hashem, Y. and Auffinger, P. (2009) A short guide for molecular dynamics simulations of RNAsystems. Methods, 47, 187–97.
[148] Ogle, J. M., Brodersen, D. E., Clemons, W. M., Tarry, M. J., Carter, A. P., and Ramakrishnan, V.(2001) Recognition of cognate transfer RNA by the 30S ribosomal subunit. Science, 292, 897–902.
[149] Phillips, J. C., Braun, R., Wang, W., Gumbart, J., Tajkhorshid, E., Villa, E., Chipot, C., Skeel,R. D., Kalé, L., and Schulten, K. (2005) Scalable molecular dynamics with NAMD. J ComputChem, 26, 1781–802.
[150] Martyna, G. J., Tobias, D. J., and Klein, M. L. (1994) Constant pressure molecular dynamicsalgorithms. J Comput Phys, 101, 4177–4189.
[151] Pérez, A., Marchán, I., Svozil, D., Šponer, J., Cheatham, III, T. E., Laughton, C. A., and Orozco,M. (2007) Refinement of the AMBER force field for nucleic acids: improving the description ofalpha/gamma conformers. Biophys J, 92, 3817–29.
BIBLIOGRAPHY 123
[152] Banáš, P., Hollas, D., Zgarbová, M., Jurecka, P., Orozco, M., Cheatham, III, T. E., Šponer, J., andOtyepka, M. (2010) Performance of Molecular Mechanics Force Fields for RNA Simulations:Stability of UUCG and GNRA Hairpins. J Chem Theory Comput, 6, 3836–3849.
[153] Yildirim, I., Kennedy, S. D., Stern, H. A., Hart, J. M., Kierzek, R., and Turner, D. H. (2012) Revi-sion of AMBER Torsional Parameters for RNA Improves Free Energy Predictions for TetramerDuplexes with GC and iGiC Base Pairs. J Chem Theory Comput, 8, 172–181.
[154] Vetting, M. W., Magnet, S., Nieves, E., Roderick, S. L., and Blanchard, J. S. (2004) A bacterialacetyltransferase capable of regioselective N-acetylation of antibiotics and histones. Chem Biol,11, 565–73.
[155] Fuentes-Martínez, Y., Godoy-Alcántar, C., Medrano, F., Dikiy, A., and Yatsimirsky, A. K. (2010)Protonation of kanamycin A: detailing of thermodynamics and protonation sites assignment.Bioorg Chem, 38, 173–80.
[156] Dolinsky, T. J., Czodrowski, P., Li, H., Nielsen, J. E., Jensen, J. H., Klebe, G., and Baker, N. A.(2007) PDB2PQR: expanding and upgrading automated preparation of biomolecular structuresfor molecular simulations. Nucl Acids Res, 35, W522–5.
[157] Li, H., Robertson, A. D., and Jensen, J. H. (2005) Very fast empirical prediction and rationaliza-tion of protein pKa values. Proteins, 61, 704–21.
[158] Ozen, C., Malek, J. M., and Serpersu, E. H. (2006) Dissection of aminoglycoside-enzyme in-teractions: a calorimetric and NMR study of neomycin B binding to the aminoglycosidephosphotransferase(30)-IIIa. J Am Chem Soc, 128, 15248–54.
[159] Chen-Goodspeed, M., Vanhooke, J. L., Holden, H. M., and Raushel, F. M. (1999) Kinetic Mecha-nism of Kanamycin Nucleotidyltransferase from Staphylococcus aureus. Bioorg Chem, 27, 395–408.
[160] Duan, Y., et al. (2003) A point-charge force field for molecular mechanics simulations of pro-teins based on condensed-phase quantum mechanical calculations. J Comput Chem, 24, 1999–2012.
[161] Lee, M. C. and Duan, Y. (2004) Distinguish protein decoys by using a scoring function basedon a new AMBER force field, short molecular dynamics simulations, and the generalized bornsolvent model. Proteins, 55, 620–34.
[162] Nurizzo, D., Shewry, S. C., Perlin, M. H., Brown, S. A., Dholakia, J. N., Fuchs, R. L.,Deva, T., Baker, E. N., and Smith, C. A. (2003) The Crystal Structure of Aminoglycoside-3’-Phosphotransferase-IIa, an Enzyme Responsible for Antibiotic Resistance. J Mol Biol, 327, 491–506.
[163] Barbieri, C. M. and Pilch, D. S. (2006) Complete thermodynamic characterization of the mul-tiple protonation equilibria of the aminoglycoside antibiotic paromomycin: a calorimetric andnatural abundance 15N NMR study. Biophys J, 90, 1338–49.
[164] Wang, J., Wolf, R. M., Caldwell, J. W., Kollman, P. A., and Case, D. A. (2004) Development andtesting of a general amber force field. J Comput Chem, 25, 1157–74.
[165] Jakalian, A., Jack, D. B., and Bayly, C. I. (2002) Fast, efficient generation of high-quality atomiccharges. AM1-BCC model: II. Parameterization and validation. J Comput Chem, 23, 1623–41.
[166] Frisch, M. J., et al., Gaussian 03, Revision C.02. Gaussian, Inc., Wallingford, CT, 2004.
[167] Asensio, J. L., Hidalgo, A., Cuesta, I., González, C., Cañada, J., Vicent, C., Chiara, J. L.,Cuevas, G., and Jiménez-Barbero, J. (2002) Experimental evidence for the existence of non-exo-anomeric conformations in branched oligosaccharides: NMR analysis of the structure anddynamics of aminoglycosides of the neomycin family. Chemistry, 8, 5228–40.
[168] Humphrey, W., Dalke, A., and Schulten, K. (1996) VMD: Visual molecular dynamics. J MolGraphics, 14, 33–38.
[169] R Development Core Team (2011) R: A Language and Environment for Statistical Computing.R Foundation for Statistical Computing, Vienna, Austria.

124 BIBLIOGRAPHY
[170] Berendsen, H. J. C., van der Spoel, D., and van Drunen, R. (1995) GROMACS: A message-passing parallel molecular dynamics implementation. Comput Phys Commun, 91, 43–56.
[171] Lindahl, E., Hess, B., and van der Spoel, D. (2001) Gromacs 3.0: A package for molecularsimulation and trajectory analysis. J Mol Model, 7, 306–317.
[172] van der Spoel, D., Lindahl, E., Hess, B., Groenhof, G., Mark, A. E., and Berendsen, H. J. C.(2005) GROMACS: Fast, flexible, and free. J Comput Chem, 26, 1701–1718.
[173] Shao, J., Tanner, S. W., Thompson, N., and Cheatham, III, T. E. (2007) Clustering MolecularDynamics Trajectories: 1. Characterizing the Performance of Different Clustering Algorithms.J Chem Theory Comput, 3, 2312–2334.
[174] Lu, X.-J. and Olson, W. K. (2003) 3DNA: a software package for the analysis, rebuilding andvisualization of three-dimensional nucleic acid structures. Nucl Acids Res, 31, 5108–21.
[175] Pérot, S., Sperandio, O., Miteva, M. A., Camproux, A.-C., and Villoutreix, B. O. (2010) Drug-gable pockets and binding site centric chemical space: a paradigm shift in drug discovery. DrugDiscov Today, 15, 656–667.
[176] Durrant, J. D., de Oliveira, C. A. F., and McCammon, J. A. (2011) POVME: an algorithm formeasuring binding-pocket volumes. J Mol Graph Model, 29, 773–6.
[177] Grant, B. J., Rodrigues, A. P. C., ElSawy, K. M., McCammon, J. A., and Caves, L. S. D. (2006)Bio3d: an R package for the comparative analysis of protein structures. Bioinformatics, 22, 2695–6.
[178] Baker, N. A., Sept, D., Joseph, S., Holst, M. J., and McCammon, J. A. (2001) Electrostatics ofnanosystems: Application to microtubules and the ribosome. P Natl Acad Sci USA, 98, 10037–10041.
[179] Długosz, M. and Trylska, J. (2008) Electrostatic similarity of proteins: application of three di-mensional spherical harmonic decomposition. J Chem Phys, 129, 015103.
[180] Srinivasan, J., Cheatham, III, T. E., Cieplak, P., Kollman, P. A., and Case, D. A. (1998) Contin-uum Solvent Studies of the Stability of DNA, RNA, and Phosphoramidate-DNA Helices. J AmChem Soc, 120, 9401–9409.
[181] Lafont, V., Schaefer, M., Stote, R. H., Altschuh, D., and Dejaegere, A. (2007) Protein-proteinrecognition and interaction hot spots in an antigen-antibody complex: free energy decomposi-tion identifies "efficient amino acids". Proteins, 67, 418–34.
[182] Wriggers, W. and Schulten, K. (1997) Protein domain movements: detection of rigid domainsand visualization of hinges in comparisons of atomic coordinates. Proteins, 29, 1–14.
[183] Hinsen, K. (1998) Analysis of domain motions by approximate normal mode calculations. Pro-teins, 33, 417–429.
[184] Hinsen, K., Thomas, A., and Field, M. J. (1999) Analysis of domain motions in large proteins.Proteins, 34, 369–382.
[185] Snyder, D. A. and Montelione, G. T. (2005) Clustering algorithms for identifying core atom setsand for assessing the precision of protein structure ensembles. Proteins, 59, 673–686.
[186] Kirchner, D. K. and Guntert, P. (2011) Objective identification of residue ranges for the super-position of protein structures. BMC Bioinformatics, 12, 170–181.
[187] Qi, G., Lee, R., and Hayward, S. (2005) A comprehensive and non-redundant database of pro-tein domain movements. Bioinformatics, 21, 2832–2838.
[188] Poornam, G. P., Matsumoto, A., Ishida, H., and Hayward, S. (2009) A method for the analysisof domain movements in large biomolecular complexes. Proteins, 76, 201–212.
[189] Aleksiev, T., Potestio, R., Pontiggia, F., Cozzini, S., and Micheletti, C. (2009) PiSQRD: a webserver for decomposing proteins into quasi-rigid dynamical domains. Bioinformatics, 25, 2743–2744.

BIBLIOGRAPHY 125
[190] Potestio, R., Pontiggia, F., and Micheletti, C. (2009) Coarse-grained description of protein in-ternal dynamics: an optimal strategy for decomposing proteins in rigid subunits. Biophys J, 96,4993–5002.
[191] Hamilton, S. W. R. and Hamilton, W. E. (1866) Elements of quaternions (Google eBook). Longmans,Green, & co.
[192] Kuipers, J. B. (2002) Quaternions and rotation sequences: a primer with applications to orbits,aerospace, and virtual reality. Princeton University Press.
[193] Kneller, G. R. and Calligari, P. (2006) Efficient characterization of protein secondary structurein terms of screw motions. Acta Crystallogr D, 62, 302–11.
[194] Keller, B., Daura, X., and van Gunsteren, W. F. (2010) Comparing geometric and kinetic clusteralgorithms for molecular simulation data. J Chem Phys, 132, 074110.
[195] Brooks, B. R., et al. (2009) CHARMM: The Biomolecular Simulation Program. J Comput Chem,30, 1545–1614.
[196] Campos-Olivas, R., Newman, J. L., and Summers, M. F. (2000) Solution structure and dynam-ics of the Rous sarcoma virus capsid protein and comparison with capsid proteins of otherretroviruses. J Mol Biol, 296, 633–649.
[197] Lukavsky, P. J., Kim, I., Otto, G. A., and Puglisi, J. D. (2003) Structure of HCV IRES domain IIdetermined by NMR. Nat Struct Biol, 10, 1033–1038.
[198] Ramos, A., Grünert, S., Adams, J., Micklem, D. R., Proctor, M. R., Freund, S., Bycroft, M.,St Johnston, D., and Varani, G. (2000) RNA recognition by a Staufen double-stranded RNA-binding domain. EMBO J, 19, 997–1009.
[199] Skjærven, L., Grant, B. J., Muga, A., Teigen, K., McCammon, J. A., Reuter, N., and Martinez, A.(2011) Conformational Sampling and Nucleotide-Dependent Transitions of the GroEL SubunitProbed by Unbiased Molecular Dynamics Simulations. PLoS Comput Biol, 7, e1002004.
[200] Horwich, A. L. and Fenton, W. A. (2009) Chaperonin-mediated protein folding: using a centralcavity to kinetically assist polypeptide chain folding. Q Rev Biophys, 42, 83–116.
[201] Xu, Z., Horwich, A. L., and Sigler, P. B. (1997) The crystal structure of the asymmetric GroEL-GroES-(ADP)7 chaperonin complex. Nature, 388, 741–750.
[202] Ma, J., Sigler, P. B., Xu, Z., and Karplus, M. (2000) A dynamic model for the allosteric mecha-nism of GroEL. J Mol Biol, 302, 303–313.
[203] de Groot, B. L., Vriend, G., and Berendsen, H. J. (1999) Conformational changes in the chaper-onin GroEL: new insights into the allosteric mechanism. J Mol Biol, 286, 1241–1249.
[204] Kulczycka, K., Długosz, M., and Trylska, J. (2011) Molecular dynamics of ribosomal elongationfactors G and Tu. Eur Biophys J, 40, 289–303.
[205] Nissen, P., Kjeldgaard, M., Thirup, S., Polekhina, G., Reshetnikova, L., Clark, B. F., and Nyborg,J. (1995) Crystal structure of the ternary complex of Phe-tRNAPhe, EF-Tu, and a GTP analog.Science, 270, 1464–1472.
[206] Abel, K., Yoder, M. D., Hilgenfeld, R., and Jurnak, F. (1996) An alpha to beta conformationalswitch in EF-Tu. Structure, 4, 1153–1159.
[207] Polekhina, G., Thirup, S., Kjeldgaard, M., Nissen, P., Lippmann, C., and Nyborg, J. (1996) Helixunwinding in the effector region of elongation factor EF-Tu-GDP. Structure, 4, 1141–1151.
[208] Réblová, K., Rázga, F., Li, W., Gao, H., Frank, J., and Šponer, J. (2010) Dynamics of the baseof ribosomal A-site finger revealed by molecular dynamics simulations and Cryo-EM. NucleicAcids Res, 38, 1325–1340.
[209] Rázga, F., Zacharias, M., Réblová, K., Koca, J., and Šponer, J. (2006) RNA kink-turns as molec-ular elbows: hydration, cation binding, and large-scale dynamics. Structure, 14, 825–835.

126 BIBLIOGRAPHY
[210] Leontis, N. B. and Westhof, E. (2001) Geometric nomenclature and classification of RNA basepairs. RNA, 7, 499–512.
[211] Romanowska, J., McCammon, J. A., and Trylska, J. (2011) Understanding the Origins of Bac-terial Resistance to Aminoglycosides through Molecular Dynamics Mutational Study of theRibosomal A-Site. PLoS Comput Biol, 7, e1002099.
[212] Batey, R., Rambo, R., and Doudna, J. A. (1999) Tertiary Motifs in RNA Structure and Folding.Angew Chem Int Edit, 38, 2326–2343.
[213] Horton, J. R., Ratner, G., Banavali, N. K., Huang, N., Choi, Y., Maier, M. A., Marquez, V. E.,MacKerell, Jr., A. D., and Cheng, X. (2004) Caught in the act: visualization of an intermediatein the DNA base-flipping pathway induced by HhaI methyltransferase. Nucl Acids Res, 32,3877–86.
[214] Huang, N. and MacKerell, Jr., A. D. (2004) Atomistic view of base flipping in DNA. Philos T RSoc A, 362, 1439–60.
[215] Sarzynska, J., Réblová, K., Šponer, J., and Kulinski, T. (2008) Conformational transitions offlanking purines in HIV-1 RNA dimerization initiation site kissing complexes studied byCHARMM explicit solvent molecular dynamics. Biopolymers, 89, 732–46.
[216] O’Connor, M., Brunelli, C. A., Firpo, M. A., Gregory, S. T., Lieberman, K. R., Lodmell, J. S.,Moine, H., Van Ryk, D. I., and Dahlberg, A. E. (1995) Genetic probes of ribosomal RNA func-tion. Biochem Cell Biol, 73, 859–68.
[217] Wang, H. and Tor, Y. (1997) Electrostatic Interactions in RNA Aminoglycosides Binding. J AmChem Soc, 119, 8734–8735.
[218] Kaul, M., Barbieri, C. M., and Pilch, D. S. (2006) Aminoglycoside-induced reduction in nu-cleotide mobility at the ribosomal RNA A-site as a potentially key determinant of antibacterialactivity. J Am Chem Soc, 128, 1261–71.
[219] Asensio, J. L., Hidalgo, A., Bastida, A., Torrado, M., Corzana, F., Chiara, J. L., García-Junceda,E., Cañada, J., and Jiménez-Barbero, J. (2005) A simple structural-based approach to preventaminoglycoside inactivation by bacterial defense proteins. Conformational restriction provideseffective protection against neomycin-B nucleotidylation by ANT4. J Am Chem Soc, 127, 8278–9.
[220] Matesanz, R., Diaz, J. F., Corzana, F., Santana, A. G., Bastida, A., and Asensio, J. L. (2012)Multiple keys for a single lock: the unusual structural plasticity of the nucleotidyltransferase(40)/kanamycin complex. Chemistry, 18, 2875–89.
[221] Schmitt, S., Kuhn, D., and Klebe, G. (2002) A new method to detect related function amongproteins independent of sequence and fold homology. J Mol Biol, 323, 387–406.
[222] Thompson, P. R., Schwartzenhauer, J., Hughes, D. W., Berghuis, A. M., and Wright, G. D. (1999)The COOH terminus of aminoglycoside phosphotransferase (30)-IIIa is critical for antibioticrecognition and resistance. J Biol Chem, 274, 30697–706.
[223] Díaz, M. D., Fernández-Alonso, M. D. C., Cuevas, G., Cañada, F. J., and Jiménez-Barbero, J.(2008) On the role of aromatic-sugar interactions in the molecular recognition of carbohydrates:A 3D view by using NMR. Pure Appl Chem, 80, 1827–1835.
[224] Young, T., Abel, R., Kim, B., Berne, B. J., and Friesner, R. A. (2007) Motifs for molecular recog-nition exploiting hydrophobic enclosure in protein-ligand binding. P Natl Acad Sci USA, 104,808–13.
[225] Michel, J., Tirado-Rives, J., and Jorgensen, W. L. (2009) Energetics of Displacing WaterMolecules from Protein Binding Sites: Consequences for Ligand Optimization. J Am Chem Soc,131, 15403–15411.
[226] Shah, F., Gut, J., Legac, J., Shivakumar, D., Sherman, W., Rosenthal, P. J., and Avery, M. A.(2012) Computer-aided drug design of falcipain inhibitors: virtual screening, structure-activityrelationships, hydration site thermodynamics, and reactivity analysis. J Chem Inf Model, 52,696–710.