Comparing of single reduction and CVT based transmissions on battery electric vehicle · ·...
9
Comparing of single reduction and CVT based transmissions on battery electric vehicle Jiageng Ruan 1 , Nong Zhang 1 , Paul Walker 1 1 University of Technology, Sydney Abstract With the deterioration of the air pollution, growing public concerns over the exhaustion of global fossil energy and the explosive growth of passenger vehicles, the improvement and popularity of electric vehicles (EVs) have increased in market share. The primary goal of EV powertrain design is achieving the same performance, e.g. launching and driving range, as that of Internal Combustion Engine vehicles. To realize this target, a novel propulsion system is proposed in this paper. A comparison of driving performance and energy saving are completed among single reduction, continuously variable transmission (CVT) and proposed system on EVs. The simulation results show that the optimized motor propulsion system has a significant improvement on battery energy saving, range extension and vehicle cost. Introduction Despite the long-term benefit of battery electric vehicles (EVs) to customers and environment, the initial cost and limited one-charge driving range present the major barrier for its wide spread commercialization. Therefore, it is necessary to pursue every possible avenue for minor efficiency gains. One of the possible methods is adding a multi-speed transmission system to EVs. A lot of researchers, e.g. Ren Q, Crolla D.A, et ac. have demonstrated that multi-speed gearbox can not only improve the overall drivability and motor efficiency, but also downsize the battery and motor. [1] Although, considering the cost and outstanding dynamic performance of electric motors, fixed ratio single reduction is widely adopted by most OEMs as a transmission system on EVs rather than multi-gear equipment. To achieve a better balance between dynamic and economic performance, an efficient, smooth-shifting and affordable multi-speed transmission is necessary for EVs. Not all transmission systems used in Internal Combustion Engine (ICE) vehicles are suitable for EVs. Manual transmission and automated manual transmission have inevitable torque interruption, which will offset the EVs innate advantage-smooth driving. [10] And the priority purpose of adding a multi-speed transmission system to EVs is extending the one-charge driving range. Thus, the lower efficiency of automatic transmission itself excludes itself based on these requirements. [11] CVT is possible to vary the transmission gear ratio without interruption of the torque flow. Therefore, an infinite number of ratios (between a minimum and maximum value) are possible. The key lies in its simple yet effective belt-and-pulley design. The CVT works with an all-metal chain that runs between cone-shaped curved pulleys. The transmission ratio between the engine and drive wheels changes in a smooth manner in relation to the variable axial gap between the pulleys. The gap defines the possible chain radii on the pulleys. Due to their mechanical layout and the need of torque converter to work with ICE vehicles, the efficiency of CVT is typically lower than that of single-speed ones and they can suffer from poor speed of response [3,4,5], particularly at launch [6]. As the gear ratio varying range in CVT is wide and continuous, the ratios control strategy needs to be compromised between fuel economy and drivability, which contributes to a poor speed response and dissatisfactory launching performance. [7, 8] However, with the ability of 100% torque delivery from standstill, wide speed range and excellent dynamic control ability of motor, the requirements for transmission system design for EVs are much simpler than that for ICE vehicles. Specific to continuously variable transmissions (CVT), the torque converter and hydraulic system can be removed, which is the most inefficient and complicated component. Furthermore, the infinite number of transmission ratios allows motor to always run at its optimum speed. It will be different in comparison of potential benefits from the viewpoint of overall powertrain efficiency. The variable ratios range will be narrower, which means a lighter and more compact CVT. In addition, the new generation push-belt CVT has the ability to transfer more than 400 Nm torque, which the insufficient transmission torque capacity was usually regarded as the main drawback of CVT, covering full range of most daily-used engines and motors. [9]. In this paper, a structure simplified and gear ratio rearranged CVT based EV model is proposed and demonstrated. A smaller motor and battery pack are selected in model, thanks to the contribution of CVT, whilst same vehicle performance is preserved. Then, ratios varying range and shifting schedule, aiming to The 14th IFToMM World Congress, Taipei, Taiwan, October 25-30, 2015 DOI Number: 10.6567/IFToMM.14TH.WC.OS17.010
Transcript of Comparing of single reduction and CVT based transmissions on battery electric vehicle · ·...

Comparing of single reduction and CVT based transmissions on battery electric vehicle
Jiageng Ruan1, Nong Zhang
1, Paul Walker
1
1 University of Technology, Sydney
Abstract
With the deterioration of the air pollution, growing
public concerns over the exhaustion of global fossil
energy and the explosive growth of passenger vehicles,
the improvement and popularity of electric vehicles (EVs)
have increased in market share. The primary goal of EV
powertrain design is achieving the same performance,
e.g. launching and driving range, as that of Internal
Combustion Engine vehicles. To realize this target, a
novel propulsion system is proposed in this paper. A
comparison of driving performance and energy saving
are completed among single reduction, continuously
variable transmission (CVT) and proposed system on
EVs. The simulation results show that the optimized
motor propulsion system has a significant improvement
on battery energy saving, range extension and vehicle
cost.
Introduction
Despite the long-term benefit of battery electric vehicles
(EVs) to customers and environment, the initial cost and
limited one-charge driving range present the major
barrier for its wide spread commercialization. Therefore,
it is necessary to pursue every possible avenue for minor
efficiency gains. One of the possible methods is adding a
multi-speed transmission system to EVs. A lot of
researchers, e.g. Ren Q, Crolla D.A, et ac. have
demonstrated that multi-speed gearbox can not only
improve the overall drivability and motor efficiency, but
also downsize the battery and motor. [1] Although,
considering the cost and outstanding dynamic
performance of electric motors, fixed ratio single
reduction is widely adopted by most OEMs as a
transmission system on EVs rather than multi-gear
equipment. To achieve a better balance between
dynamic and economic performance, an efficient,
smooth-shifting and affordable multi-speed transmission
is necessary for EVs.
Not all transmission systems used in Internal
Combustion Engine (ICE) vehicles are suitable for EVs.
Manual transmission and automated manual
transmission have inevitable torque interruption, which
will offset the EVs innate advantage-smooth driving. [10]
And the priority purpose of adding a multi-speed
transmission system to EVs is extending the one-charge
driving range. Thus, the lower efficiency of automatic
transmission itself excludes itself based on these
requirements. [11]
CVT is possible to vary the transmission gear ratio
without interruption of the torque flow. Therefore, an
infinite number of ratios (between a minimum and
maximum value) are possible. The key lies in its simple
yet effective belt-and-pulley design. The CVT works
with an all-metal chain that runs between cone-shaped
curved pulleys. The transmission ratio between the
engine and drive wheels changes in a smooth manner in
relation to the variable axial gap between the pulleys.
The gap defines the possible chain radii on the pulleys.
Due to their mechanical layout and the need of torque
converter to work with ICE vehicles, the efficiency of
CVT is typically lower than that of single-speed ones
and they can suffer from poor speed of response
[3,4,5], particularly at launch [6]. As the gear ratio
varying range in CVT is wide and continuous, the ratios
control strategy needs to be compromised between fuel
economy and drivability, which contributes to a poor
speed response and dissatisfactory launching
performance. [7, 8]
However, with the ability of 100% torque delivery from
standstill, wide speed range and excellent dynamic
control ability of motor, the requirements for
transmission system design for EVs are much simpler
than that for ICE vehicles. Specific to continuously
variable transmissions (CVT), the torque converter and
hydraulic system can be removed, which is the most
inefficient and complicated component. Furthermore, the
infinite number of transmission ratios allows motor to
always run at its optimum speed. It will be different in
comparison of potential benefits from the viewpoint of
overall powertrain efficiency. The variable ratios range
will be narrower, which means a lighter and more
compact CVT. In addition, the new generation push-belt
CVT has the ability to transfer more than 400 Nm torque,
which the insufficient transmission torque capacity was
usually regarded as the main drawback of CVT,
covering full range of most daily-used engines and
motors. [9].
In this paper, a structure simplified and gear ratio
rearranged CVT based EV model is proposed and
demonstrated. A smaller motor and battery pack are
selected in model, thanks to the contribution of CVT,
whilst same vehicle performance is preserved. Then,
ratios varying range and shifting schedule, aiming to
The 14th IFToMM World Congress, Taipei, Taiwan, October 25-30, 2015 DOI Number: 10.6567/IFToMM.14TH.WC.OS17.010

achieve better fuel economic performance, are designed.
The energy saving of whole integrated powertrain is
analysed, considering the efficiency improvement of
motor and energy loss in CVT. A comparing of
increased manufacturing cost and daily-use cost saving
between single reduction and CVT based EVs are
presented in final conclusion.
Powertrain Design Study
Simulation requirements and targets are listed in Table 1,
vehicle specifications are provided in Table 2.
TABLE 1: Performance Requirements
Performance specification Target performance
Acceleration 0-100km/h 12s
Top speed 120 km/h
Range @ 60kph 150 km
Range NEDC 100 km
Maximum Grade 30%
TABLE 2: Vehicle Specifications
Paramete
r
Description Value Units
m Vehicle mass 1760 kg
r Wheel radius 0.3125 m
Gear ratio -
CR Coefficient of rolling
resistance
0.016 -
g Gravity 9.81 ms2
φ Road incline -
CD Drag coefficient 0.28 -
A Vehicle frontal area 2.2 m2
Vehicle speed - m/s2
Batv Battery Voltage 380 v
Batc Battery Capacity 72 Ah
TABLE 3: Assumed Vehicle Specifications
Parameter Description Value Unit
Assumed Motor Peak/
Rated Torque
300/150 Nm
Assumed Motor Peak/
Rated Power
125/45 Kw
Assumed Motor Max Speed 8000 rpm
Single Reduction efficiency 0.95
CVT efficiency (Depend on
gear ratio)
0.9-0.95
Torque converter efficiency 0-1
Gear Ratio design for single reduction
The maximum speed achieved in the vehicle can be used
to determine the upper limit of gear ratio of single
reduction:
, thus:
7.9
The lower gear ratio limit is set based on the rolling
resistance for a specified grade (Table 1) over the
maximum motor torque multiplied by the overall
powertrain efficiency. This is given in equation (2). For
low vehicle speeds, the aerodynamic drag is assumed to
be zero and φ=30%, =300Nm:
Using the data provided in Tables 2 and 3 the minimum
usable gear ratio for different grades are presented below.
TABLE 4: Road grade design ratios
Grade Design ratio
30% 6.0
40% 7.7
Based on the above results, the single reduction gear
ratio is set to be:
Motor capacity design for battery electric vehicle
As we can see from figure 1, which is a typical
permanent magnetic motor characteristics map, output
torque varies with speed. From standstill to rated
rotation speed, motor can provide constant maximum
torque. Then, the available torque decreases with motor
speed rising.
FIGURE 1: PM Brushless Motor Properties
The motor should have the ability to propel vehicle
driving on designed maximum grade road a particular
Maximum output torque at particular speed
100 200 300 400 500 600 700 800
50
100
150
200
250
300
350
65%
70%
75%80%85%
87.5%90%
92.5%
94%
Motor Speed / 10 ( rpm)
Moto
r T
orq
ue(
Nm
)
speed, which is usually used to determine the maximum
available motor torque.
(
)
(
)
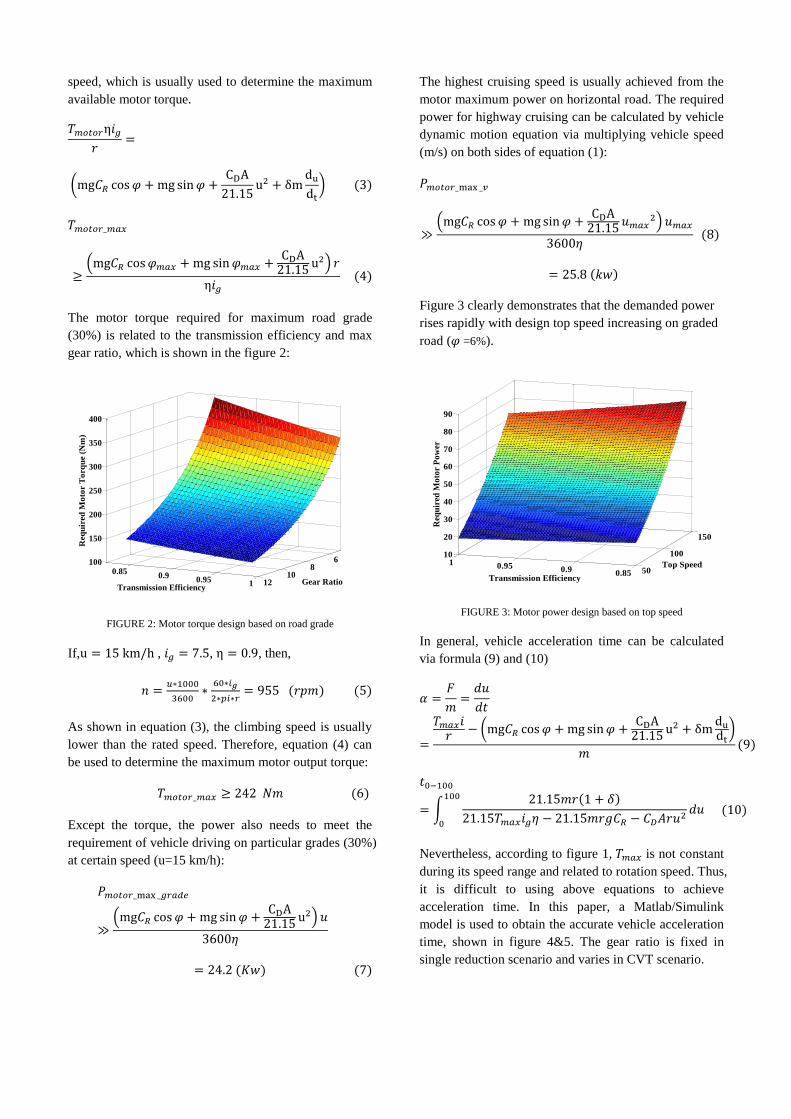
The motor torque required for maximum road grade
(30%) is related to the transmission efficiency and max
gear ratio, which is shown in the figure 2:
FIGURE 2: Motor torque design based on road grade
If, , , , then,
As shown in equation (3), the climbing speed is usually
lower than the rated speed. Therefore, equation (4) can
be used to determine the maximum motor output torque:
Except the torque, the power also needs to meet the
requirement of vehicle driving on particular grades (30%)
at certain speed (u=15 km/h):
(
)
The highest cruising speed is usually achieved from the
motor maximum power on horizontal road. The required
power for highway cruising can be calculated by vehicle
dynamic motion equation via multiplying vehicle speed
(m/s) on both sides of equation (1):
(
)
Figure 3 clearly demonstrates that the demanded power
rises rapidly with design top speed increasing on graded
road ( =6%).
FIGURE 3: Motor power design based on top speed
In general, vehicle acceleration time can be calculated
via formula (9) and (10)
(
)
∫
Nevertheless, according to figure 1, is not constant
during its speed range and related to rotation speed. Thus,
it is difficult to using above equations to achieve
acceleration time. In this paper, a Matlab/Simulink
model is used to obtain the accurate vehicle acceleration
time, shown in figure 4&5. The gear ratio is fixed in
single reduction scenario and varies in CVT scenario.
68
1012
0.850.9
0.95 1
100
150
200
250
300
350
400
Gear RatioTransmission Efficiency
Req
uir
ed
Mo
tor T
orq
ue (
Nm
)
50
100
150
0.850.90.95110
20
30
40
50
60
70
80
90
Top Speed
Transmission Efficiency
Req
uir
ed M
oto
r P
ow
er

Gear Ratio
Max Motor Torque
Vehicle Mass
Aero Drag
Acceleration Resistance
X
km/h to rpm
Wheel Radius
+-- -
/ IntegrateRolling Resistance
km/h
Transmission Efficiency
Scope
FIGURE 4: Acceleration time calculation
FIGURE 5: Acceleration time calculation Simulink® model
According to the simulation results, 0-100 km/h
acceleration time of single reduction based EV is:
The output power curve during acceleration is shown in
figure 6, based on torque and rotation speed:
FIGURE 6: Output torque and acceleration time curves based on
assumed motor size
This result is not qualified and 3.5s longer than expected.
Increasing gear ratio do shorter the acceleration time,
however, the top speed drops as well. Therefore, the top
speed and acceleration time cannot reach the target value
simultaneously in single reduction based EV.
Another approach to improve acceleration time is
upgrading the assumed motor characteristics, including
power and torque. The acceleration time is shorten to
11.7s, as shown in figure 6, after iterative motor size
testing in figure 5 model. The maximum torque of new
selected motor is:
The required power to accelerate vehicle from standstill
to 100 km/h in 12s is shown in figure 7:
FIGURE 7: Output torque and acceleration time curves based on re-
designed motor size
Motor specification design based on single reduction
Required specifications of motor for single reduction
based BEVs are presented in table 5, based on equations
(6), (7), (8), (11), (12), (13):
TABLE 5: Motor and vehicle specifications based on single reduction
Specification Value Unit
Grade based Maximum Motor Torque 242 Nm
Acc-time Based Maximum Motor Torque 390 Nm
Grade Based Maximum Motor Power 24.2 Kw
Top Speed Based Maximum Motor Power 25.8 Kw
Acc-Time Based Maximum Motor Power 165 Kw
As shown in table 5, the requirement of motor capacity
and torque for a good launching performance is much
higher than that for other requirements. In other words,
most of the motor capacity is wasted in the daily-use.
Therefore, a capacity trade-off design has to be taken
between acceleration time and motor cost. Two potential
scenarios for single reduction based BEVs powertrain
are selected in this paper, scenario 1 meets all the design
requirements to attain an excellent dynamic performance;
Scenario 2 reduces the motor cost at the cost of a relative
poor launching and overtaking ability.
TABLE 6: Motors Specifications of
Specification Motor Scenario 1 Motor Scenario 2
Peak Power 180 kw 125 kw
Rate Power 60 kw 45 kw
Peak Torque 400 Nm 300 Nm
Rate Torque 200 Nm 150 Nm
Rated Speed 2600 rpm 2600 rpm
Max Speed 8000 rpm 8000 rpm
CVT optimization for BEV powertrain
Replacing fixed ratio single reduction with CVT will
provide a feasible way to reduce the requirement of
battery capacity and optimize motor operation efficiency
area by a wide and continuously ratio range. Table 7
shows a typical CVT specification on market:
TABLE 7: CVT Specifications
Parameter Description Value
Main reduction ratio 4
CVT ratio varying range 0.5~2.5
Torque converter ratio 1~2.2
CVT pulley-belt efficiency 0.9~0.95
Torque converter efficiency 0~1
As an important part of CVT based powertrain for ICE
vehicle, the working stages of torque converter can be
roughly divided into three:
Stall: The prime mover is applying power to the impeller,
but the turbine cannot rotate. At stall, the torque
converter can produce maximum torque multiplication
and lasts for a brief period. The efficiency is zero.
Acceleration: The load is accelerating but there still is a
relatively large difference between impeller and turbine
speed and it will declines accounting to the difference.
The efficiency increases quickly from zero and the
torque multiplication ratio drops from maximum value,
e.g. 2.2 in this model.
Coupling (Lock-up): The speed of impeller and turbine
are almost equivalent. The efficiency is almost 100%
due to the mechanical lock between input and output
shafts. There is no torque multiplication function in this
period.
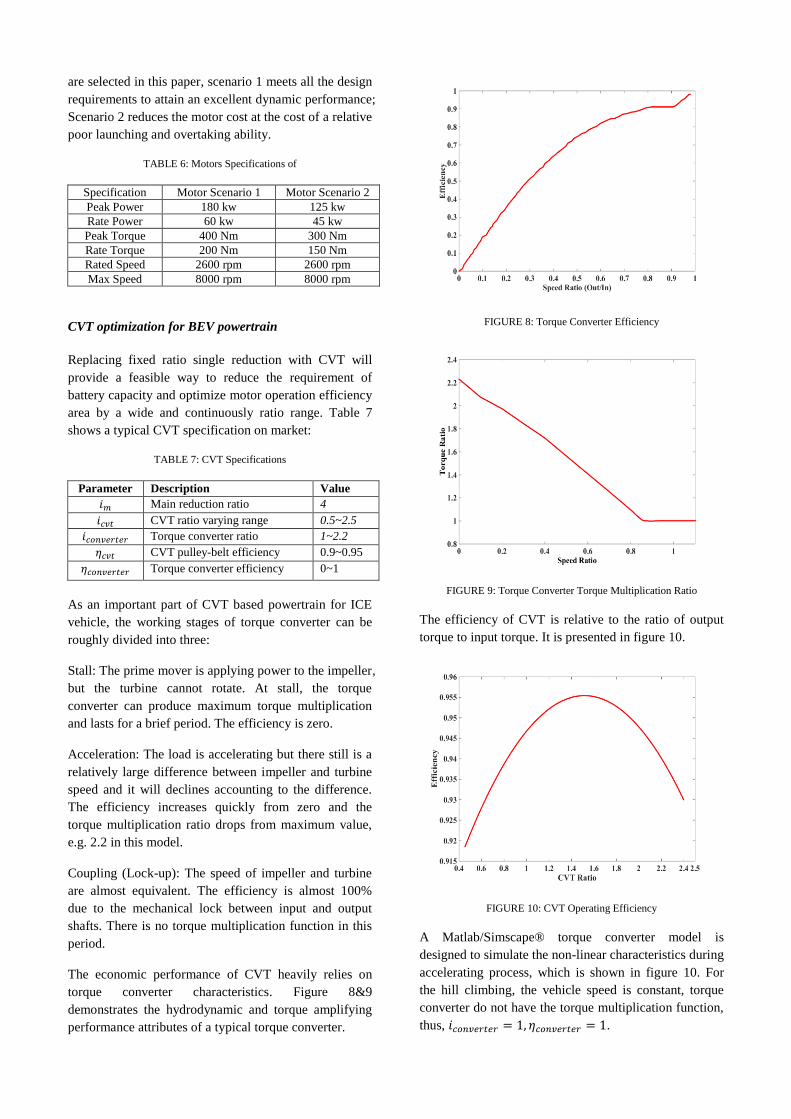
The economic performance of CVT heavily relies on
torque converter characteristics. Figure 8&9
demonstrates the hydrodynamic and torque amplifying
performance attributes of a typical torque converter.
FIGURE 8: Torque Converter Efficiency
FIGURE 9: Torque Converter Torque Multiplication Ratio
The efficiency of CVT is relative to the ratio of output
torque to input torque. It is presented in figure 10.
FIGURE 10: CVT Operating Efficiency
A Matlab/Simscape® torque converter model is
designed to simulate the non-linear characteristics during
accelerating process, which is shown in figure 10. For
the hill climbing, the vehicle speed is constant, torque
converter do not have the torque multiplication function,
thus, .
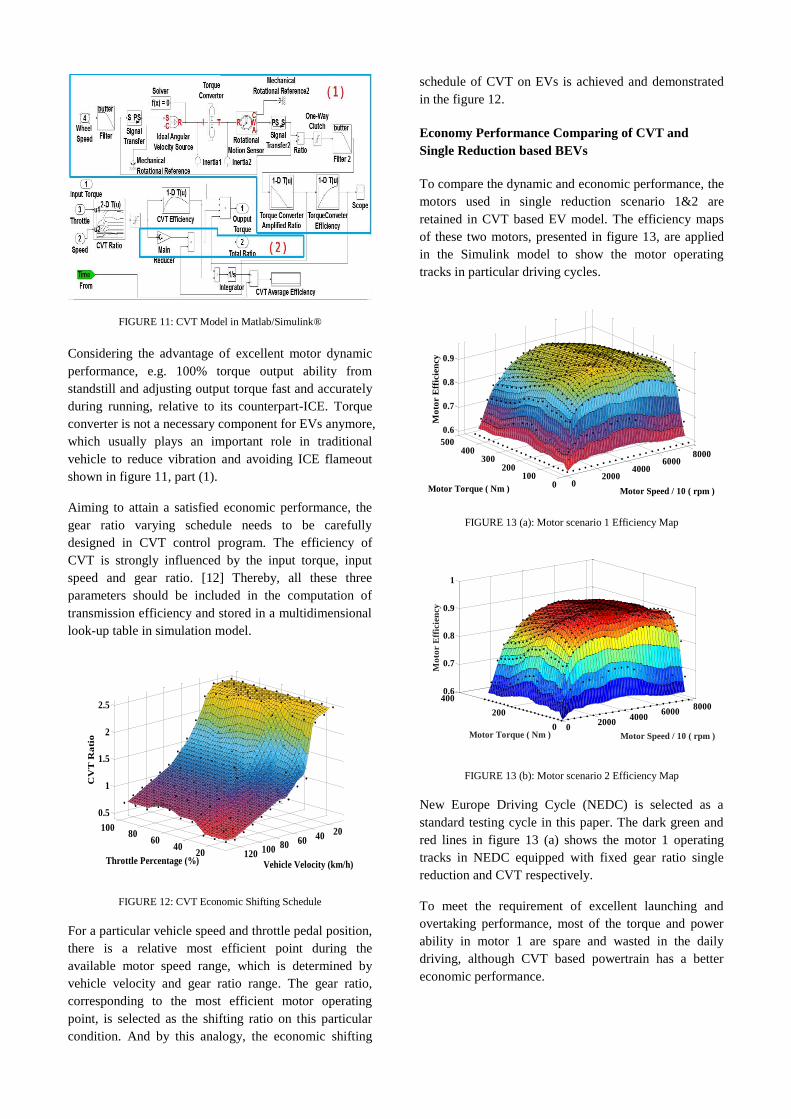
FIGURE 11: CVT Model in Matlab/Simulink®
Considering the advantage of excellent motor dynamic
performance, e.g. 100% torque output ability from
standstill and adjusting output torque fast and accurately
during running, relative to its counterpart-ICE. Torque
converter is not a necessary component for EVs anymore,
which usually plays an important role in traditional
vehicle to reduce vibration and avoiding ICE flameout
shown in figure 11, part (1).
Aiming to attain a satisfied economic performance, the
gear ratio varying schedule needs to be carefully
designed in CVT control program. The efficiency of
CVT is strongly influenced by the input torque, input
speed and gear ratio. [12] Thereby, all these three
parameters should be included in the computation of
transmission efficiency and stored in a multidimensional
look-up table in simulation model.
FIGURE 12: CVT Economic Shifting Schedule
For a particular vehicle speed and throttle pedal position,
there is a relative most efficient point during the
available motor speed range, which is determined by
vehicle velocity and gear ratio range. The gear ratio,
corresponding to the most efficient motor operating
point, is selected as the shifting ratio on this particular
condition. And by this analogy, the economic shifting
schedule of CVT on EVs is achieved and demonstrated
in the figure 12.
Economy Performance Comparing of CVT and
Single Reduction based BEVs
To compare the dynamic and economic performance, the
motors used in single reduction scenario 1&2 are
retained in CVT based EV model. The efficiency maps
of these two motors, presented in figure 13, are applied
in the Simulink model to show the motor operating
tracks in particular driving cycles.
FIGURE 13 (a): Motor scenario 1 Efficiency Map
FIGURE 13 (b): Motor scenario 2 Efficiency Map
New Europe Driving Cycle (NEDC) is selected as a
standard testing cycle in this paper. The dark green and
red lines in figure 13 (a) shows the motor 1 operating
tracks in NEDC equipped with fixed gear ratio single
reduction and CVT respectively.
To meet the requirement of excellent launching and
overtaking performance, most of the torque and power
ability in motor 1 are spare and wasted in the daily
driving, although CVT based powertrain has a better
economic performance.
2040
6080
100 20406080100120
0.5
1
1.5
2
2.5
Vehicle Velocity (km/h)Throttle Percentage (%)
CV
T R
ati
o
02000
40006000
8000
0100
200300
400500
0.6
0.7
0.8
0.9
Motor Speed / 10 ( rpm )Motor Torque ( Nm )
Mo
tor E
ffic
ien
cy
02000
40006000
8000
0
200
4000.6
0.7
0.8
0.9
1
Motor Speed / 10 ( rpm )Motor Torque ( Nm )
Mo
tor E
ffic
ien
cy
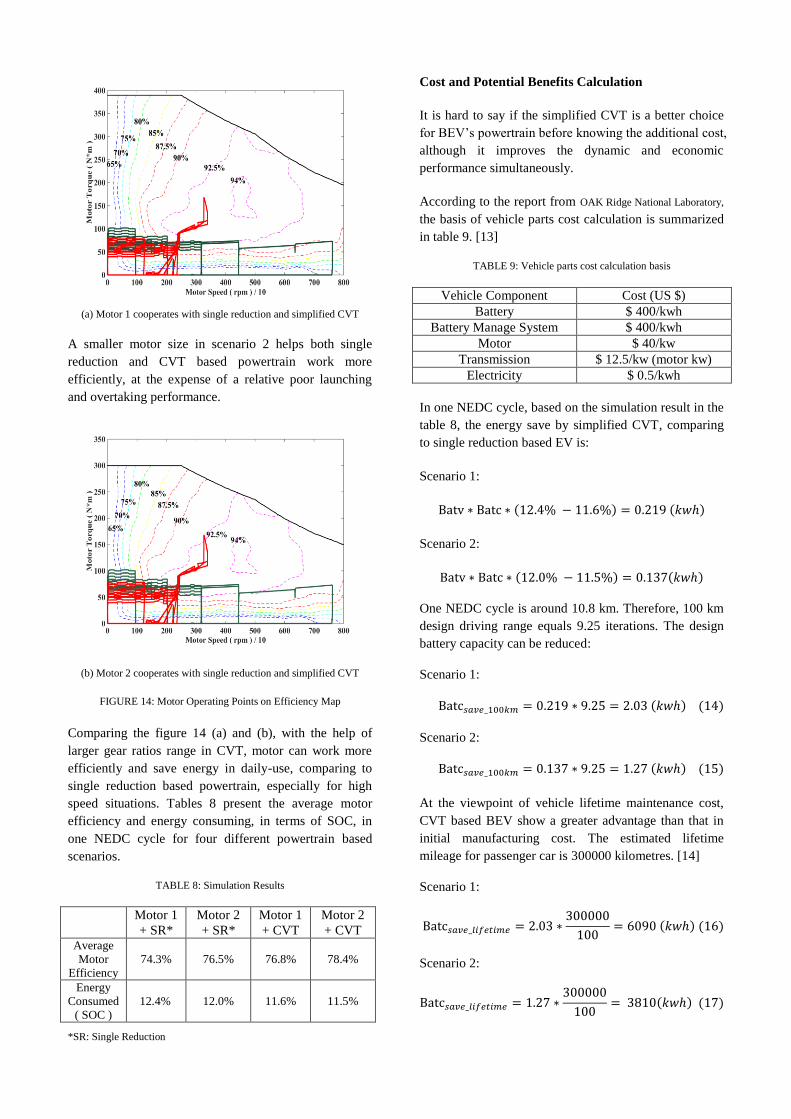
(a) Motor 1 cooperates with single reduction and simplified CVT
A smaller motor size in scenario 2 helps both single
reduction and CVT based powertrain work more
efficiently, at the expense of a relative poor launching
and overtaking performance.
(b) Motor 2 cooperates with single reduction and simplified CVT
FIGURE 14: Motor Operating Points on Efficiency Map
Comparing the figure 14 (a) and (b), with the help of
larger gear ratios range in CVT, motor can work more
efficiently and save energy in daily-use, comparing to
single reduction based powertrain, especially for high
speed situations. Tables 8 present the average motor
efficiency and energy consuming, in terms of SOC, in
one NEDC cycle for four different powertrain based
scenarios.
TABLE 8: Simulation Results
Motor 1
+ SR*
Motor 2
+ SR*
Motor 1
+ CVT
Motor 2
+ CVT
Average
Motor
Efficiency
74.3%
76.5%
76.8%
78.4%
Energy
Consumed
( SOC )
12.4%
12.0%
11.6%
11.5%
*SR: Single Reduction
Cost and Potential Benefits Calculation
It is hard to say if the simplified CVT is a better choice
for BEV’s powertrain before knowing the additional cost,
although it improves the dynamic and economic
performance simultaneously.
According to the report from OAK Ridge National Laboratory,
the basis of vehicle parts cost calculation is summarized
in table 9. [13]
TABLE 9: Vehicle parts cost calculation basis
Vehicle Component Cost (US $)
Battery $ 400/kwh
Battery Manage System $ 400/kwh
Motor $ 40/kw
Transmission $ 12.5/kw (motor kw)
Electricity $ 0.5/kwh
In one NEDC cycle, based on the simulation result in the
table 8, the energy save by simplified CVT, comparing
to single reduction based EV is:
Scenario 1:
Scenario 2:
One NEDC cycle is around 10.8 km. Therefore, 100 km
design driving range equals 9.25 iterations. The design
battery capacity can be reduced:
Scenario 1:
Scenario 2:
At the viewpoint of vehicle lifetime maintenance cost,
CVT based BEV show a greater advantage than that in
initial manufacturing cost. The estimated lifetime
mileage for passenger car is 300000 kilometres. [14]
Scenario 1:
Scenario 2:
The single reduction is not really a transmission system,
referring to the definition on traditional vehicle. If the
data in table 11 is used to estimate the price of single
reduction, the price will be same to that of CVT based
on same motor size. Obviously, it is not reasonable and
the cost of single reduction should be much cheaper.
Therefore, a relative sales price (RSP) evaluating
method of transmission system is selected in this paper.
The cost of a gearbox is proportional to its weight at the
first approximation.[21] The mass of transmission
can be related to the input torque , the maximum ratio
, and the number of gears , shown in equation
(15).
The reference is a 5-speed automatic transmission, the
maximum input torque and gear ratio are 200 Nm and
3.85 respectively. In this paper, ,
and for single
reduction and CVT respectively. Thus, the estimated
relative gearbox selling prices are presented in table 10.
TABLE 10: Estimated relative gearboxes selling price
Motor Motor 1 Motor 2
Transmission SR CVT SR CVT
RSP 1.27 2.16 1.13 1.92
*The selling price of CVT is estimated to be similar with
a 6-Speed Automatic Transmission
Considering the cost of single reduction is much cheaper
than that of CVT, the manufacturing cost of single
reduction is assumed to the estimated price above to
insure the price difference is big enough to testify if the
simplified CVT has the ability to make up the cost
disadvantage through saving battery energy.
Scenario 1:
Scenario 2:
Table 11 presents the manufacturing cost and daily-use
energy cost save by CVT, comparing to single reduction
based powertrain, with two different motor size.
TABLE 11: Manufacturing cost saved by CVT
Vehicle Component Cost Saved with
Motor 1
Cost Saved
with Motor 2
Battery (100km
NEDC)
$ 812 $ 508
Battery Manage
System
$ 812 $ 508
Transmission (125/45
kw)
-$ 1589 -$ 1104
Life Time Fuel
Energy Save
$ 3045 $ 1905
Total Save $ 3080 $ 1817
Due to the cost saved in battery and increased cost for a
more complex transmission system are almost same,
there is no significant initial manufacturing cost different,
after replacing the single reduction with CVT in two
different motor based powertrain. Simplified CVT
boosts the economic performance in both powertrain
systems at the viewpoint of life-long using. CVT based
powertrain has a better performance when it cooperate
with a bigger size motor, though much more power is
wasted in most driving conditions. However, it doesn’t
mean a bigger and more expensive motor is a better
choice when customer cares more about cost rather than
performance.
Scenario 1:
Scenario 2:
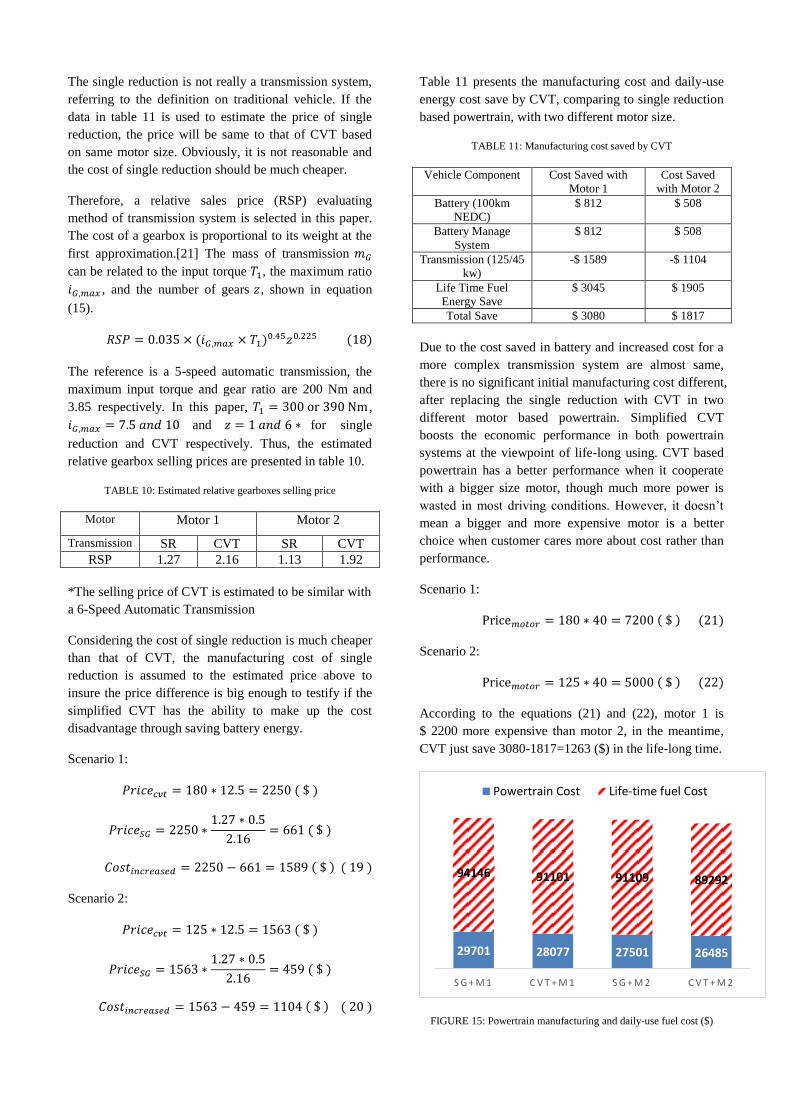
According to the equations (21) and (22), motor 1 is
$ 2200 more expensive than motor 2, in the meantime,
CVT just save 3080-1817=1263 ($) in the life-long time.
FIGURE 15: Powertrain manufacturing and daily-use fuel cost ($)
29701 28077 27501 26485
94146 91101 91109 89292
S G + M 1 C V T + M 1 S G + M 2 C V T + M 2
Powertrain Cost Life-time fuel Cost

Conclusion
In this paper, a simplified CVT based powertrain system
for EVs in has been validated that it not only improves
vehicle dynamic performance, but also significantly
reduces manufacturing and daily use cost, thanks to the
wider available gear ratios range and effective CVT
shifting schedule. Two propelling motors are selected to
attain excellent dynamic and economic performance
separately. The simulation results show that CVT help is
more efficient, comparing with single reduction based
powertrain, when cooperating with a more powerful
motor. However, at the viewpoint of total cost in the life-
time using including initial purchasing and daily
maintenance fees, the cost saved in stronger motor based
powertrain will not make up the initial price difference,
comparing to a smaller and eco motor. In other words,
the combination of eco motor and simplified CVT is the
best choice to save more money, in the meanwhile, at the
expense of a pooler launching and overtaking ability.
In future work, the analysis of regenerative brake via
CVT should be added to model, which will result in a
more precise energy consuming and cost saving
prediction.
Reference
[1] Ren, Q., Crolla, D., & Morris, A. (2009). Effect of transmission design on electric vehicle (EV) performance. Vehicle Power and
Propulsion …, 1260–1265. [2] Zhu, B., Zhang, N., Walker, P., Zhan, W., Zhou, X., & Ruan, J.
(2013). Two-speed DCT electric powertrain shifting control and
rig testing. Advances in Mechanical Engineering, 2013. doi:10.1155/2013/323917
[3] Patel, D., Ely, J., & Overson, M. (2005). CVT Drive Research
Study. SAE International. doi:10.4271/2005-01-1459 [4] Srivastava, N., & Haque, I. (2009). A review on belt and chain
continuously variable transmissions (CVT): Dynamics and
control. Mechanism and Machine Theory, 44(1), 19–41. doi:10.1016/j.mechmachtheory.2008.06.007
[5] Mäder, K. M. (2005). Continuously Variable Transmission :
Benchmark , Status & Potentials (pp. 1–30). [6] Lee, H; Kim, H. (2014). Improvement of fuel economy by shift
speed control for a metal belt continuously variable. Proceedings of the Institution of Mechanical Engineers, 216(9), 741.
[7] Bonsen, B., Steinbuch, M., & Veenhuizen, P. a. (2005). CVT
ratio control strategy optimization. 2005 IEEE Vehicle Power and Propulsion Conference,227–231.
doi:10.1109/VPPC.2005.1554561
[8] Sorniotti, A., Subramanyan, S., Turner, A., Cavallino, C., Viotto, F., & Bertolotto, S. (2011). Selection of the Optimal Gearbox
Layout for an Electric Vehicle, 4(1), 1267–1280.
doi:10.4271/2011-01-0946 [9] Mäder, K. M. (2005). Continuously Variable Transmission :
Benchmark , Status & Potentials (pp. 1–30).
[10] Galvagno, E., Velardocchia, M., & Vigliani, a. (2011). Analysis and simulation of a torque assist automated manual transmission.
Mechanical Systems and Signal Processing, 25(6), 1877–1886.
doi:10.1016/j.ymssp.2010.12.014 [11] Dr . Gerhar d Wagner and Her iber t S cherer. (2006). ZF 6-
Speed Automatic Transmissions : Fuel Efficiency And
Contribution To Environmental Protection. Drive System Technic, 8244, 2–3.
[12] Hofman, T., Steinbuch, M., van Druten, R., & Serrarens, a.
(2009). Design of CVT-Based Hybrid Passenger Cars. IEEE Transactions on Vehicular Technology, 58(2), 572–587.
doi:10.1109/TVT.2008.926217
[13] OAK RIDGE NATIONAL LABORATORY. (2010). PHEV
Value Proposition Study Final Report (p. 218).
[14] Lu, S. (2006). Vehicle Survivability and Travel Mileage
Schedules. Security, (January), 40.
[15] Naunheimer, Harald; Bertsche, Bernd; Ryborz, Joachim; Novak,
Wolfgang; Kuchle, A. (2010). Automotive Transmissions : Fundamentals, Selection, Design and Application (2nd ed.).
Springer Berlin Heidelberg.