Comparative Report On Diet Study in Vietnam Indonesia and Thailand in 2016
94
Comparative Report on Diet Study in Vietnam, Indonesia, and Thailand in 2016 Date: February, 2016
-
Upload
ws-vietnam-market-research -
Category
Lifestyle
-
view
607 -
download
0
Transcript of Comparative Report On Diet Study in Vietnam Indonesia and Thailand in 2016

Comparative Report on Diet Study
in Vietnam, Indonesia, and Thailand
in 2016
Date: February, 2016
©2016 W&S GROUP
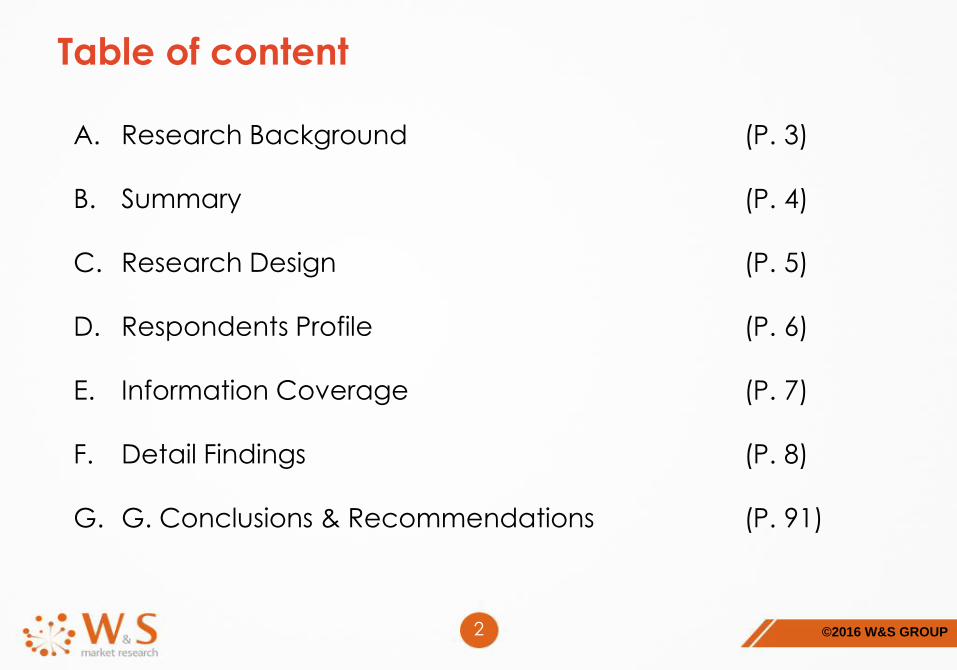
Table of content
A. Research Background (P. 3)
B. Summary (P. 4)
C. Research Design (P. 5)
D. Respondents Profile (P. 6)
E. Information Coverage (P. 7)
F. Detail Findings (P. 8)
G. G. Conclusions & Recommendations (P. 91)
2

©2016 W&S GROUP
“Health is more important than money” is today prioritized by people from all around the world.
Today, they realize that consuming unhealthy food excessively as well as keeping an inactive
lifestyle is costly and could lead to the deterioration of physical health such as obesity, heart disease
and cancer, as well as social and mental health. Moreover, it cause them to miss out exciting
opportunities in life, and might end up paying for expensive healthcare services.
The growth of the economy has help change an individual’s behavior, especially in Asian countries
like Vietnam, Indonesia and Thailand where diet is a common method used to take care of
themselves.
From our report, although diet methods such as fasting or consuming only fruits and vegetables on
a daily basis is still used by some, there is an increasing willingness to balance between health and
keeping a lean body as they do not only consume fruits and vegetables but also proteins such as
meat, fish, poultry, eggs and cheese. Moreover, exercising on a weekly basis is also incorporated to
our respondents’ lifestyle.
There is an increasing willingness to spend more money on diet programs. For instance, in Thailand
and Indonesia, women are willing to spend up to $30 on diet programs.
The results of our report has reflected that there are high demands for diet, however, there is only a
small number of public and private companies that supply these groups of people with the
appropriate goods and services.
We hope that the results of this report could generate great benefits for companies looking forward
to invest in the health and wellness sector, hospitals and government.
3
A. Research Background
©2016 W&S GROUP
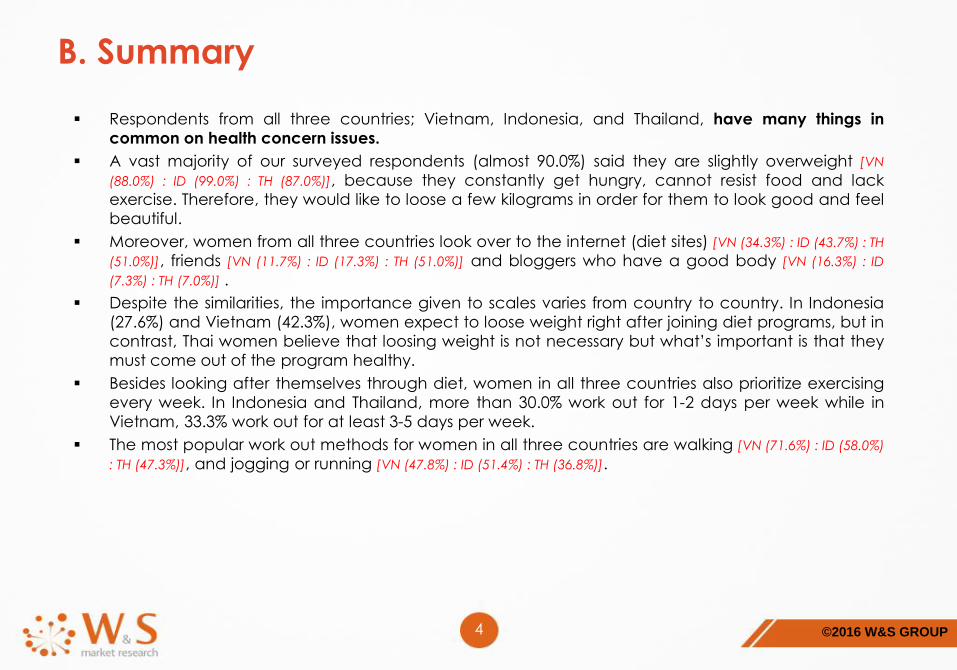
Respondents from all three countries; Vietnam, Indonesia, and Thailand, have many things in
common on health concern issues.
A vast majority of our surveyed respondents (almost 90.0%) said they are slightly overweight [VN
(88.0%) : ID (99.0%) : TH (87.0%)], because they constantly get hungry, cannot resist food and lack
exercise. Therefore, they would like to loose a few kilograms in order for them to look good and feel
beautiful.
Moreover, women from all three countries look over to the internet (diet sites) [VN (34.3%) : ID (43.7%) : TH
(51.0%)], friends [VN (11.7%) : ID (17.3%) : TH (51.0%)] and bloggers who have a good body [VN (16.3%) : ID
(7.3%) : TH (7.0%)] .
Despite the similarities, the importance given to scales varies from country to country. In Indonesia
(27.6%) and Vietnam (42.3%), women expect to loose weight right after joining diet programs, but in
contrast, Thai women believe that loosing weight is not necessary but what’s important is that they
must come out of the program healthy.
Besides looking after themselves through diet, women in all three countries also prioritize exercising
every week. In Indonesia and Thailand, more than 30.0% work out for 1-2 days per week while in
Vietnam, 33.3% work out for at least 3-5 days per week.
The most popular work out methods for women in all three countries are walking [VN (71.6%) : ID (58.0%)
: TH (47.3%)], and jogging or running [VN (47.8%) : ID (51.4%) : TH (36.8%)].
4
B. Summary
©2016 W&S GROUP
C. Research design
5
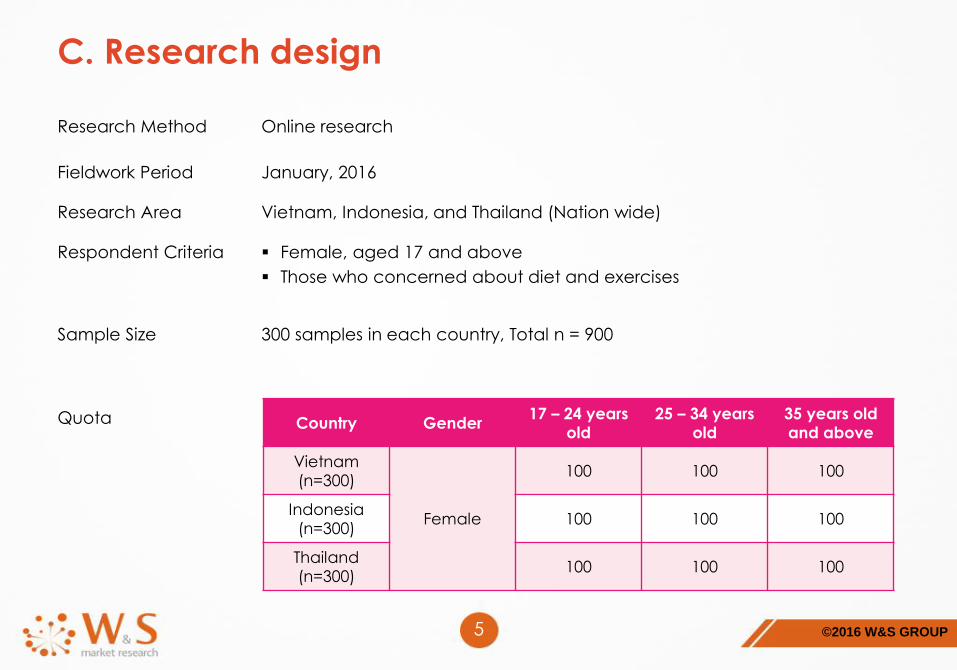
Research Method Online research
Fieldwork Period January, 2016
Research Area Vietnam, Indonesia, and Thailand (Nation wide)
Respondent Criteria Female, aged 17 and above
Those who concerned about diet and exercises
Sample Size 300 samples in each country, Total n = 900
Quota Country Gender17 – 24 years
old25 – 34 years
old35 years old and above
Vietnam (n=300)
Female
100 100 100
Indonesia (n=300)
100 100 100
Thailand (n=300)
100 100 100
©2016 W&S GROUP
D. Respondents Profile
6
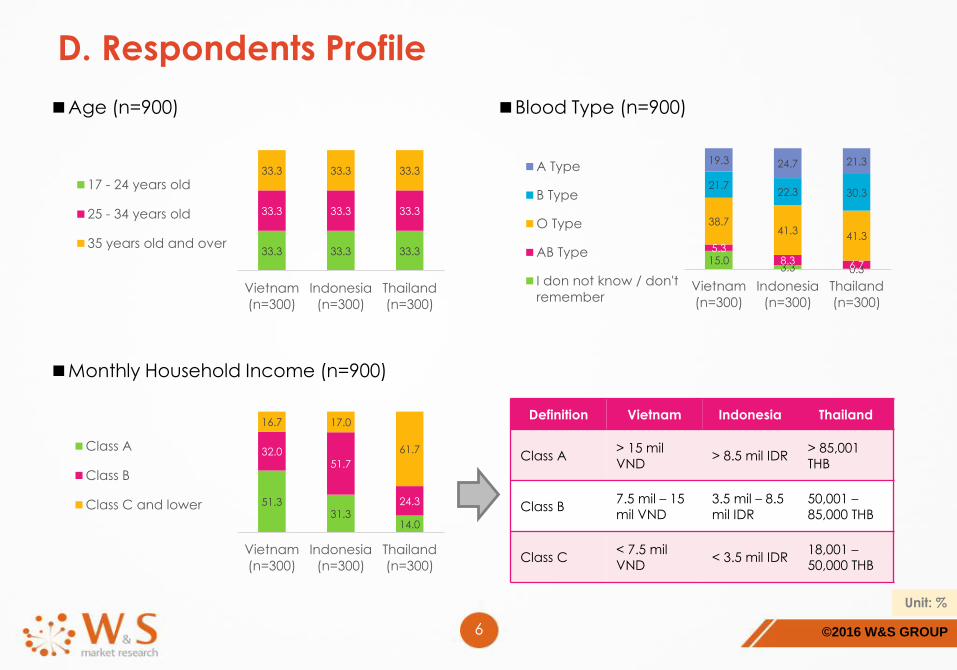
■Age (n=900)
33.3 33.3 33.3
33.3 33.3 33.3
33.3 33.3 33.3
Vietnam
(n=300)
Indonesia
(n=300)
Thailand
(n=300)
17 - 24 years old
25 - 34 years old
35 years old and over
■Monthly Household Income (n=900)
51.331.3
14.0
32.051.7
24.3
16.7 17.0
61.7
Vietnam
(n=300)
Indonesia
(n=300)
Thailand
(n=300)
Class A
Class B
Class C and lower
Definition Vietnam Indonesia Thailand
Class A> 15 milVND
> 8.5 mil IDR> 85,001 THB
Class B7.5 mil – 15 mil VND
3.5 mil – 8.5 mil IDR
50,001 –85,000 THB
Class C < 7.5 mil VND
< 3.5 mil IDR18,001 –50,000 THB
■Blood Type (n=900)
15.03.3 0.3
5.38.3 6.7
38.741.3
41.3
21.722.3 30.3
19.3 24.7 21.3
Vietnam
(n=300)
Indonesia
(n=300)
Thailand
(n=300)
A Type
B Type
O Type
AB Type
I don not know / don't
remember
Unit: %
©2016 W&S GROUP
E. Information coverage
7
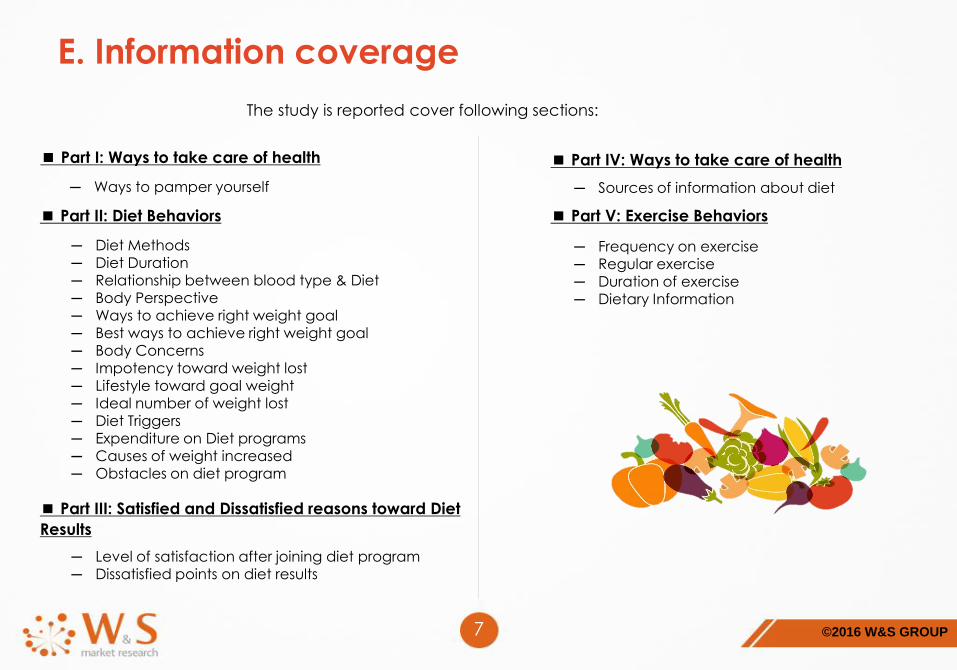
The study is reported cover following sections:
■ Part I: Ways to take care of health
─ Ways to pamper yourself
■ Part II: Diet Behaviors
─ Diet Methods─ Diet Duration─ Relationship between blood type & Diet─ Body Perspective─ Ways to achieve right weight goal─ Best ways to achieve right weight goal─ Body Concerns─ Impotency toward weight lost─ Lifestyle toward goal weight─ Ideal number of weight lost─ Diet Triggers─ Expenditure on Diet programs─ Causes of weight increased─ Obstacles on diet program
■ Part III: Satisfied and Dissatisfied reasons toward Diet
Results
─ Level of satisfaction after joining diet program─ Dissatisfied points on diet results
■ Part IV: Ways to take care of health
─ Sources of information about diet
■ Part V: Exercise Behaviors
─ Frequency on exercise─ Regular exercise─ Duration of exercise─ Dietary Information
©2016 W&S GROUP8
F. Detail findings
1. Ways to take care of Health
2. Diet Behaviors
3. Satisfied and Dissatisfied reasons toward Diet Results
4. Sources of Information about Diet
5. Exercise Behaviors
©2016 W&S GROUP9
100.0
35.3
38.7
58.0
31.0
43.3
48.7
46.0
50.7
60.0
13.3
10.7
0.3
Diet
Body spa
Massage
Scrubs
Waxing / Hair removal
Manicure / pedicure
Skin rejuvenation
Body lightening
Body contouring
Acne cure
Liposuction
Body peeling
Others
100.0
63.3
76.0
39.7
51.7
70.3
49.7
63.3
9.7
72.7
8.0
41.7
2.0
100.0
31.3
48.7
64.7
21.3
34.3
36.7
32.3
8.3
43.7
7.0
36.3
0.3
VIETNAM (n=300) INDONESIA (n=300) THAILAND (n=300)
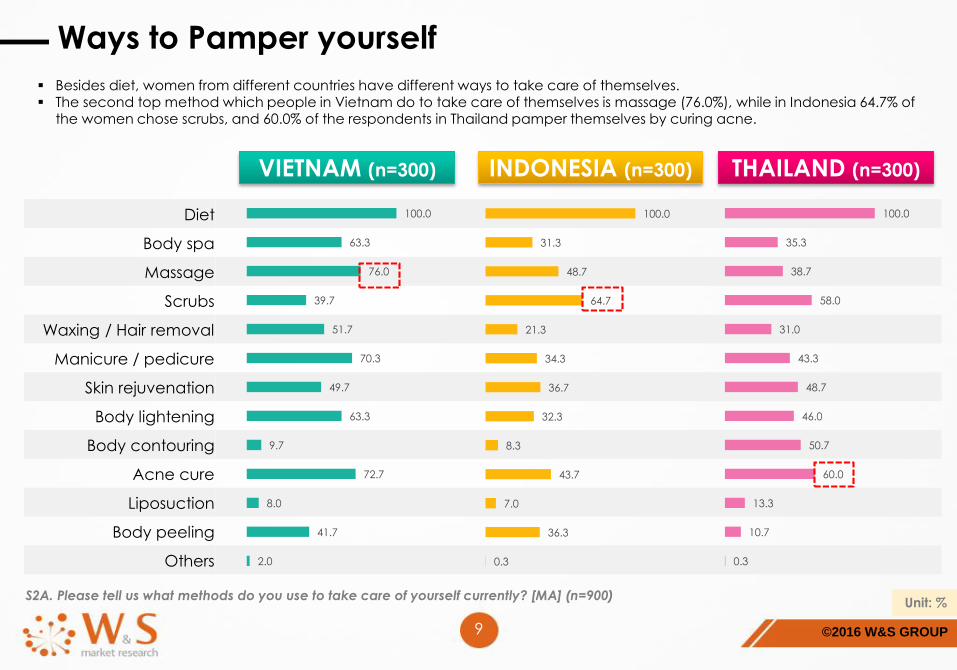
Ways to Pamper yourself
S2A. Please tell us what methods do you use to take care of yourself currently? [MA] (n=900) Unit: %
Besides diet, women from different countries have different ways to take care of themselves. The second top method which people in Vietnam do to take care of themselves is massage (76.0%), while in Indonesia 64.7% of
the women chose scrubs, and 60.0% of the respondents in Thailand pamper themselves by curing acne.
©2016 W&S GROUP10
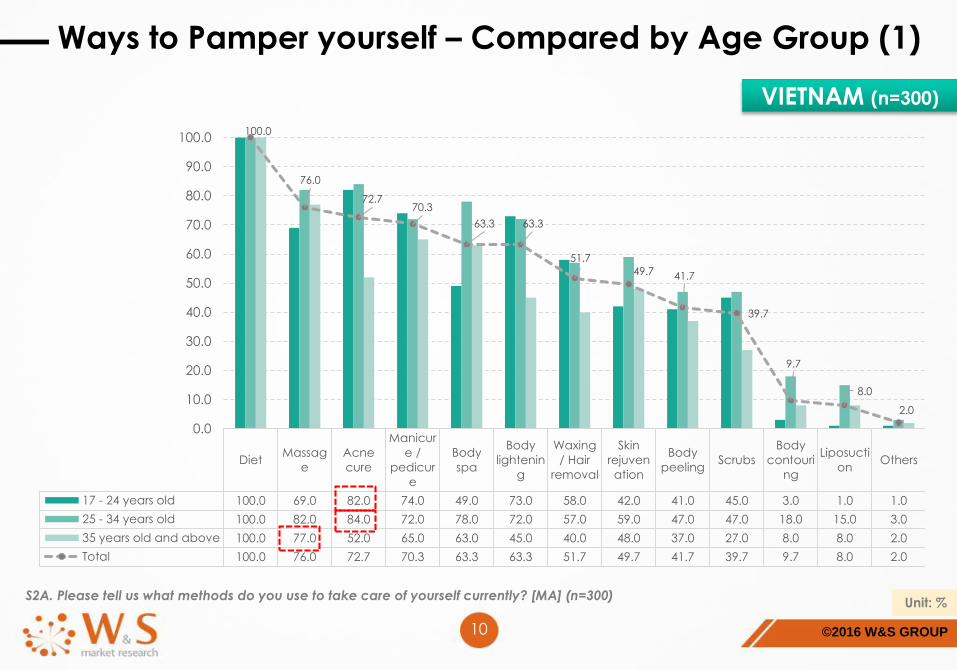
Ways to Pamper yourself – Compared by Age Group (1)
S2A. Please tell us what methods do you use to take care of yourself currently? [MA] (n=300) Unit: %
DietMassag
e
Acne
cure
Manicur
e /
pedicur
e
Body
spa
Body
lightenin
g
Waxing
/ Hair
removal
Skin
rejuven
ation
Body
peelingScrubs
Body
contouri
ng
Liposucti
onOthers
17 - 24 years old 100.0 69.0 82.0 74.0 49.0 73.0 58.0 42.0 41.0 45.0 3.0 1.0 1.0
25 - 34 years old 100.0 82.0 84.0 72.0 78.0 72.0 57.0 59.0 47.0 47.0 18.0 15.0 3.0
35 years old and above 100.0 77.0 52.0 65.0 63.0 45.0 40.0 48.0 37.0 27.0 8.0 8.0 2.0
Total 100.0 76.0 72.7 70.3 63.3 63.3 51.7 49.7 41.7 39.7 9.7 8.0 2.0
100.0
76.0
72.770.3
63.3 63.3
51.7
49.7 41.7
39.7
9.7
8.0
2.0
0.0
10.0
20.0
30.0
40.0
50.0
60.0
70.0
80.0
90.0
100.0
VIETNAM (n=300)

©2016 W&S GROUP11
Ways to Pamper yourself – Compared by Age Group (2)
S2A. Please tell us what methods do you use to take care of yourself currently? [MA] (n=300) Unit: %
Diet ScrubsMassag
e
Acne
cure
Skin
rejuven
ation
Body
peeling
Manicur
e /
pedicur
e
Body
lightenin
g
Body
spa
Waxing
/ Hair
removal
Body
contouri
ng
Liposucti
onOthers
17 - 24 years old 100.0 66.0 41.0 52.0 35.0 30.0 23.0 32.0 26.0 24.0 7.0 5.0 1.0
25 - 34 years old 100.0 66.0 52.0 51.0 36.0 39.0 37.0 34.0 35.0 22.0 9.0 5.0 0.0
35 years old and above 100.0 62.0 53.0 28.0 39.0 40.0 43.0 31.0 33.0 18.0 9.0 11.0 0.0
Total 100.0 64.7 48.7 43.7 36.7 36.3 34.3 32.3 31.3 21.3 8.3 7.0 0.3
100.0
64.7
48.7
43.7
36.7 36.334.3 32.3
31.3
21.38.3
7.0
0.3
0.0
10.0
20.0
30.0
40.0
50.0
60.0
70.0
80.0
90.0
100.0
INDONESIA (n=300)
©2016 W&S GROUP12
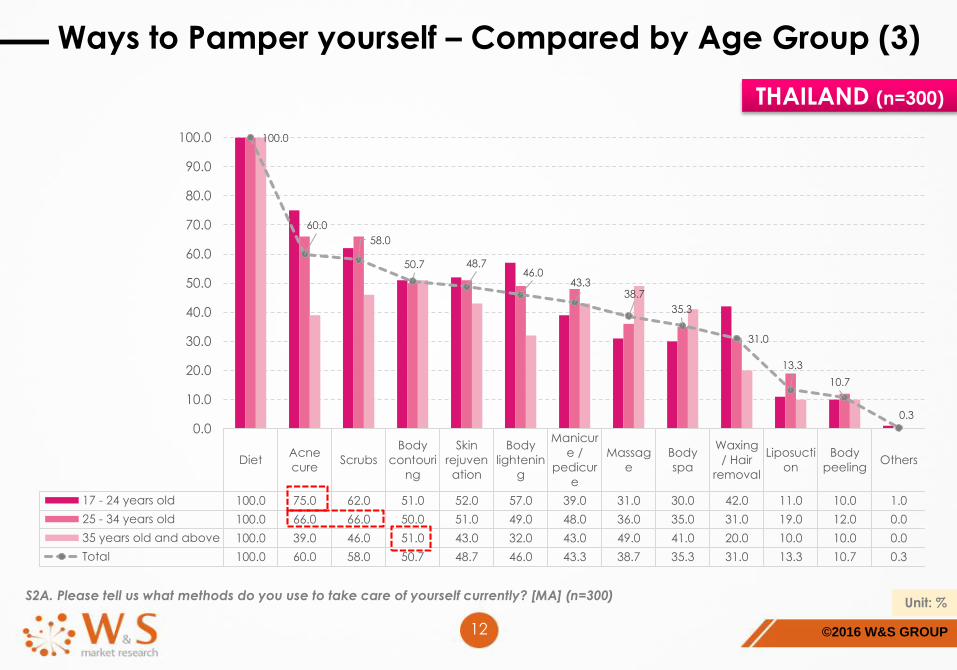
Ways to Pamper yourself – Compared by Age Group (3)
S2A. Please tell us what methods do you use to take care of yourself currently? [MA] (n=300) Unit: %
DietAcne
cureScrubs
Body
contouri
ng
Skin
rejuven
ation
Body
lightenin
g
Manicur
e /
pedicur
e
Massag
e
Body
spa
Waxing
/ Hair
removal
Liposucti
on
Body
peelingOthers
17 - 24 years old 100.0 75.0 62.0 51.0 52.0 57.0 39.0 31.0 30.0 42.0 11.0 10.0 1.0
25 - 34 years old 100.0 66.0 66.0 50.0 51.0 49.0 48.0 36.0 35.0 31.0 19.0 12.0 0.0
35 years old and above 100.0 39.0 46.0 51.0 43.0 32.0 43.0 49.0 41.0 20.0 10.0 10.0 0.0
Total 100.0 60.0 58.0 50.7 48.7 46.0 43.3 38.7 35.3 31.0 13.3 10.7 0.3
100.0
60.0
58.0
50.7 48.746.0
43.338.7
35.3
31.0
13.3
10.7
0.3
0.0
10.0
20.0
30.0
40.0
50.0
60.0
70.0
80.0
90.0
100.0
THAILAND (n=300)
©2016 W&S GROUP13
F. Detail findings
1. Ways to take care of Health
2. Diet Behaviors
3. Satisfied and Dissatisfied reasons toward Diet Results
4. Sources of Information about Diet
5. Exercise Behaviors
©2016 W&S GROUP14
S2B. Please tell us what kind of diet do you follow? [MA] (n=900) Unit: %
Diet Methods
Weight
reduction
(low calorie)
Low
cholesterolLow sodium Diabetic Low fat
Low
triglycerideUlcer
High
PotassiumOthers
VIETNAM 100.0 49.0 9.0 6.0 67.7 57.0 4.0 8.0 0.7
INDONESIA 100.0 33.7 5.7 15.3 45.0 8.0 16.0 2.3 1.0
THAILAND 100.0 53.7 16.7 19.3 55.7 8.3 11.7 6.7 0.0
100.0
49.0
9.06.0
67.7
57.0
4.08.0
0.7
100.0
33.7
5.7
15.3
45.0
8.0
16.0
2.3 1.0
100.0
53.7
16.719.3
55.7
8.311.7
6.7
0.00.0
10.0
20.0
30.0
40.0
50.0
60.0
70.0
80.0
90.0
100.0
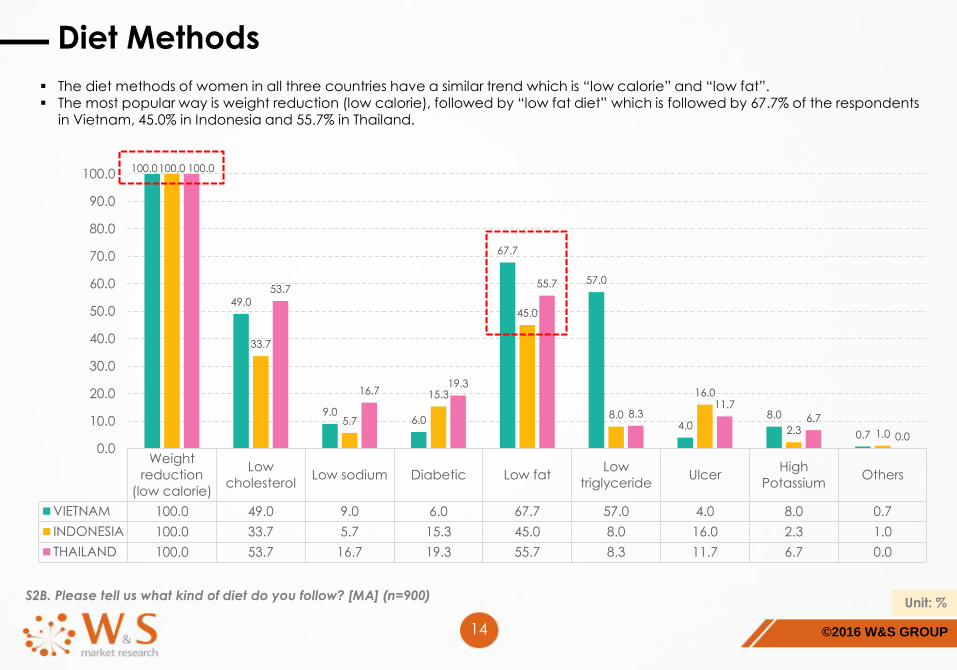
The diet methods of women in all three countries have a similar trend which is “low calorie” and “low fat”. The most popular way is weight reduction (low calorie), followed by “low fat diet” which is followed by 67.7% of the respondents
in Vietnam, 45.0% in Indonesia and 55.7% in Thailand.

©2016 W&S GROUP
Weight reduction (low
calorie)
Low cholesterol
Low sodium
Diabetic
Low fat
Low triglyceride
Ulcer
High Potassium
Others
15
Unit: %
Diet Methods – Age Group
100.0
39.0
5.0
4.0
57.0
52.0
2.0
5.0
1.0
100.0
56.0
8.0
4.0
70.0
61.0
2.0
7.0
0.0
100.0
52.0
14.0
10.0
76.0
58.0
8.0
12.0
1.0
VIETNAM (n=300) INDONESIA (n=300) THAILAND (n=300)
100.0
18.0
1.0
11.0
32.0
2.0
14.0
0.0
2.0
100.0
36.0
2.0
18.0
50.0
6.0
15.0
0.0
1.0
100.0
47.0
14.0
17.0
53.0
16.0
19.0
7.0
0.0
S2B. Please tell us what kind of diet do you follow? [MA] (n=900)
100.0
48.0
20.0
18.0
47.0
10.0
11.0
5.0
0.0
100.0
63.0
18.0
15.0
62.0
6.0
18.0
8.0
0.0
100.0
50.0
12.0
25.0
58.0
9.0
6.0
7.0
0.0
17 – 24 y/o 25 – 34 y/o 35 y/o and above
©2016 W&S GROUP16
S3. Please tell us for how long have you been on diet / weight loss programs? [MA] (n=900) Unit: %
Diet Duration
Less than a
week
1 ~ 2
weeks
3 ~ 4
weeks
1 ~ 2
months
3 ~ 4
months
5 ~ 6
months
7 months ~
1 year1 ~ 2 years
Over 3
years
I am not
sure / don't
remember
VIETNAM 4.3 5.7 15.3 21.7 15.3 11.0 11.3 10.0 3.7 1.7
INDONESIA 8.7 19.3 17.0 27.7 10.3 3.7 8.0 2.7 1.7 1.0
THAILAND 3.0 9.7 13.7 21.7 22.7 11.7 10.3 3.3 1.3 2.7
4.3
5.7
15.3
21.7
15.3
11.0 11.310.0
3.7
1.7
8.7
19.3
17.0
27.7
10.3
3.7
8.0
2.71.7
1.0
3.0
9.7
13.7
21.722.7
11.7
10.3
3.3
1.32.7
0.0
5.0
10.0
15.0
20.0
25.0
30.0
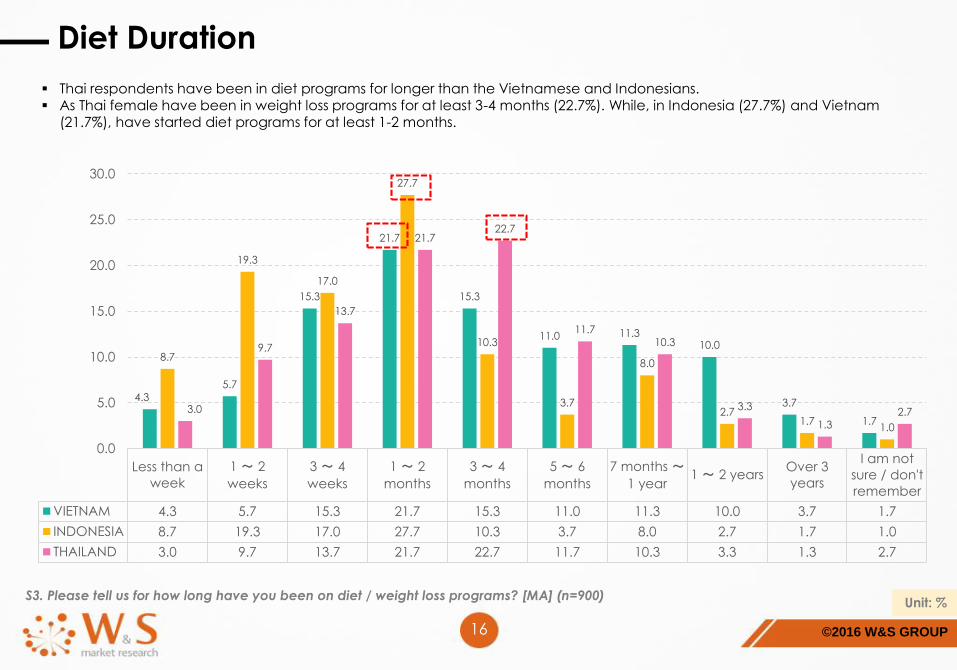
Thai respondents have been in diet programs for longer than the Vietnamese and Indonesians. As Thai female have been in weight loss programs for at least 3-4 months (22.7%). While, in Indonesia (27.7%) and Vietnam
(21.7%), have started diet programs for at least 1-2 months.
©2016 W&S GROUP17
S3. Please tell us for how long have you been on diet / weight loss programs? [MA] (n=900) Unit: %
Diet Duration – Age Group
VIETNAM (n=300) INDONESIA (n=300) THAILAND (n=300)
Less than a week
1 ~ 2 weeks
3 ~ 4 weeks
1 ~ 2 months
3 ~ 4 months
5 ~ 6 months
7 months – 1 year
1 ~ 2 years
Over 3 years
I am not sure / don't
remember
7.0
9.0
23.0
18.0
20.0
12.0
4.0
3.0
3.0
1.0
5.0
5.0
15.0
32.0
13.0
8.0
8.0
10.0
3.0
1.0
1.0
3.0
8.0
15.0
13.0
13.0
22.0
17.0
5.0
3.0
13.0
21.0
27.0
25.0
4.0
0.0
4.0
3.0
1.0
2.0
10.0
19.0
11.0
27.0
18.0
4.0
8.0
1.0
1.0
1.0
3.0
18.0
13.0
31.0
9.0
7.0
12.0
4.0
3.0
0.0
5.0
14.0
11.0
22.0
22.0
15.0
4.0
5.0
2.0
0.0
2.0
12.0
17.0
20.0
22.0
10.0
7.0
4.0
2.0
4.0
2.0
3.0
13.0
23.0
24.0
10.0
20.0
1.0
0.0
4.0
17 – 24 y/o 25 – 34 y/o 35 y/o and above
©2016 W&S GROUP18
Q0. Please tell us how do you think about the relation between blood type and diet method? [SA] (n=900) Unit: %
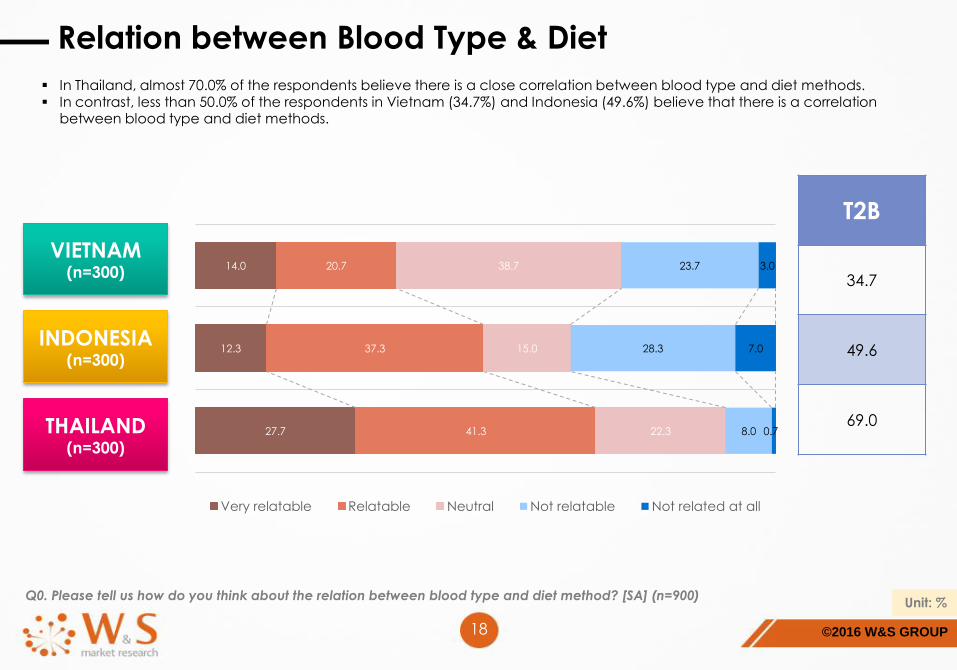
Relation between Blood Type & Diet
14.0
12.3
27.7
20.7
37.3
41.3
38.7
15.0
22.3
23.7
28.3
8.0
3.0
7.0
0.7
Very relatable Relatable Neutral Not relatable Not related at all
T2B
34.7
49.6
69.0
VIETNAM (n=300)
INDONESIA (n=300)
THAILAND (n=300)
In Thailand, almost 70.0% of the respondents believe there is a close correlation between blood type and diet methods. In contrast, less than 50.0% of the respondents in Vietnam (34.7%) and Indonesia (49.6%) believe that there is a correlation
between blood type and diet methods.

©2016 W&S GROUP19
Q0. Please tell us how do you think about the relation between blood type and diet method? [SA] (n=900) Unit: %
Relation between Blood Type & Diet – Age Group
16.0
15.0
11.0
17.0
21.0
24.0
43.0
39.0
34.0
20.0
22.0
29.0
4.0
3.0
2.0
8.0
14.0
15.0
40.0
39.0
33.0
18.0
9.0
18.0
29.0
27.0
29.0
5.0
11.0
5.0
27.0
28.0
28.0
34.0
45.0
45.0
32.0
18.0
17.0
7.0
7.0
10.0
0.0
2.0
0.0
48.0
53.0
48.0
33.0
36.0
35.0
61.0
73.0
73.0
T2B
VIETNAM (n=300)
INDONESIA (n=300)
THAILAND (n=300)
17 – 24 y/o
25 – 34 y/o
35 y/o and above
17 – 24 y/o
25 – 34 y/o
35 y/o and above
17 – 24 y/o
25 – 34 y/o
35 y/o and above
Very relatable Relatable Neutral Not relatable Not related at all
©2016 W&S GROUP20
Q1. Please tell us how do you think about your body type? [SA] (n=900) Unit: %
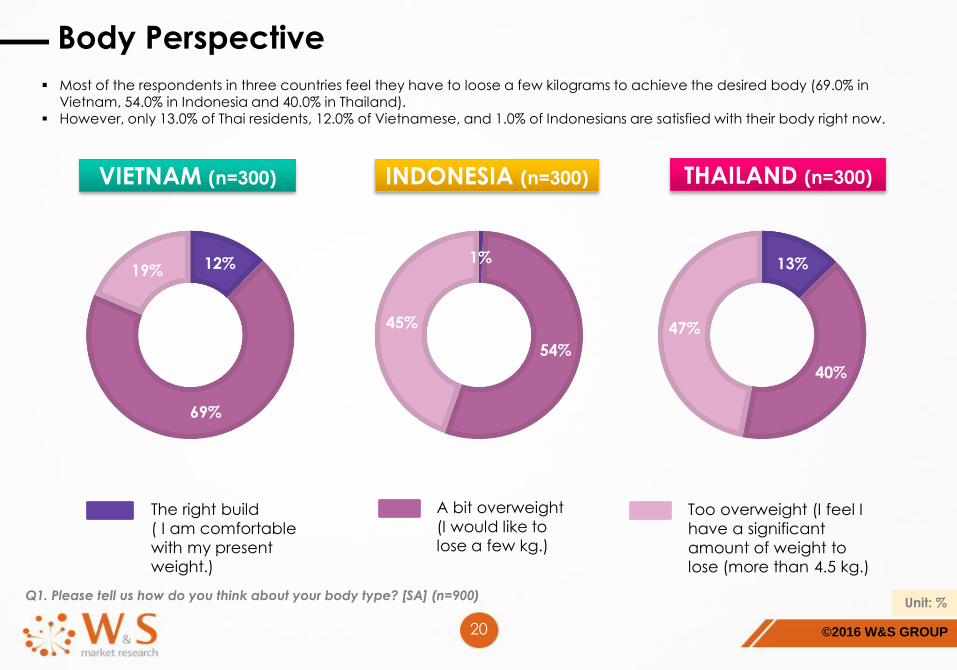
Body Perspective
12%
69%
19%
VIETNAM (n=300) INDONESIA (n=300) THAILAND (n=300)
1%
54%
45%
13%
40%
47%
The right build
( I am comfortable
with my present weight.)
A bit overweight
(I would like to lose a few kg.)
Too overweight (I feel I
have a significant
amount of weight to lose (more than 4.5 kg.)
Most of the respondents in three countries feel they have to loose a few kilograms to achieve the desired body (69.0% in Vietnam, 54.0% in Indonesia and 40.0% in Thailand).
However, only 13.0% of Thai residents, 12.0% of Vietnamese, and 1.0% of Indonesians are satisfied with their body right now.
©2016 W&S GROUP21
Q1. Please tell us how do you think about your body type? [SA] (n=900) Unit: %
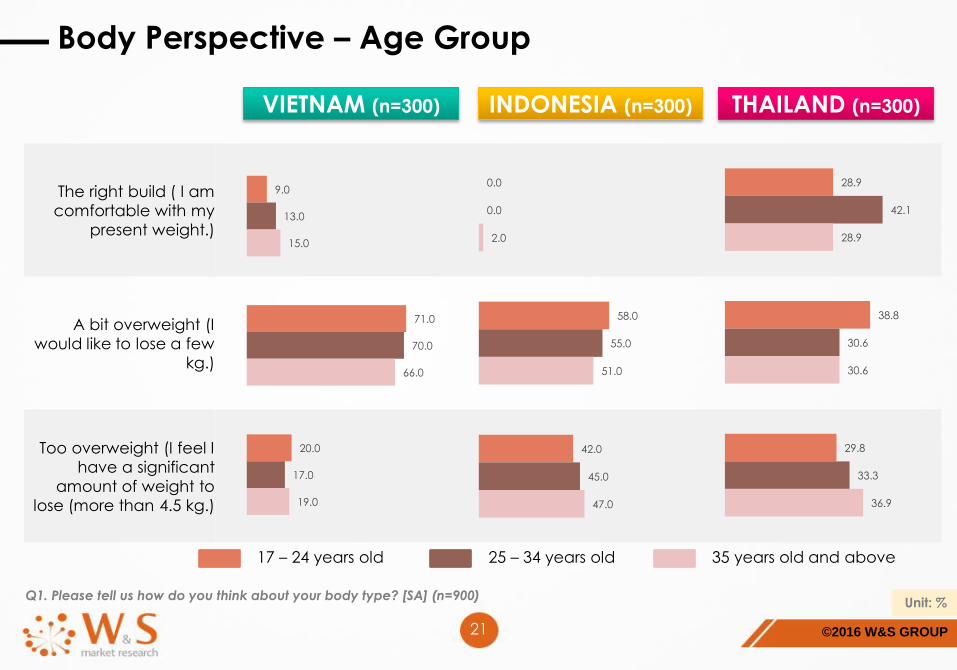
Body Perspective – Age Group
The right build ( I am
comfortable with my
present weight.)
A bit overweight (I
would like to lose a few
kg.)
Too overweight (I feel I
have a significant
amount of weight to
lose (more than 4.5 kg.)
28.9
38.8
29.8
42.1
30.6
33.3
28.9
30.6
36.9
9.0
71.0
20.0
13.0
70.0
17.0
15.0
66.0
19.0
VIETNAM (n=300) INDONESIA (n=300) THAILAND (n=300)
0.0
58.0
42.0
0.0
55.0
45.0
2.0
51.0
47.0
17 – 24 years old 25 – 34 years old 35 years old and above

©2016 W&S GROUP22
Q2. Please tell us what types of methods are being used to help achieve your goals (diet / weight loss program)? [MA] (n=900) Unit: %
Ways to achieve right weight goal (Top 10)
Calorie
controlled
I eat fruit more
frequently
Reduce the
number of
meals
It will be the
muscle training
It will be the
aerobic
exercise
(biking,
elliptical,
classes, etc.)
Take
advantage of
diet food
I do not eat
excessive
carbohydrates
Eat mainly
vegetables
and fish
Stress
reduction
techniques
(yoga, t’ai chi,
etc.)
Nutritional
supplements
VIETNAM 64.7 82.3 45.0 27.7 51.0 31.3 46.0 69.3 43.7 18.0
INDONESIA 58.7 56.0 71.3 23.0 50.7 20.3 46.3 47.3 19.3 15.0
THAILAND 74.0 67.7 42.7 14.0 69.3 31.3 47.7 53.0 11.0 22.3
64.7
82.3
45.0
27.7
51.0
31.3
46.0
69.3
43.7
18.0
58.756.0
71.3
23.0
50.7
20.3
46.3 47.3
19.315.0
74.0
67.7
42.7
14.0
69.3
31.3
47.7
53.0
11.0
22.3
0.0
10.0
20.0
30.0
40.0
50.0
60.0
70.0
80.0
90.0
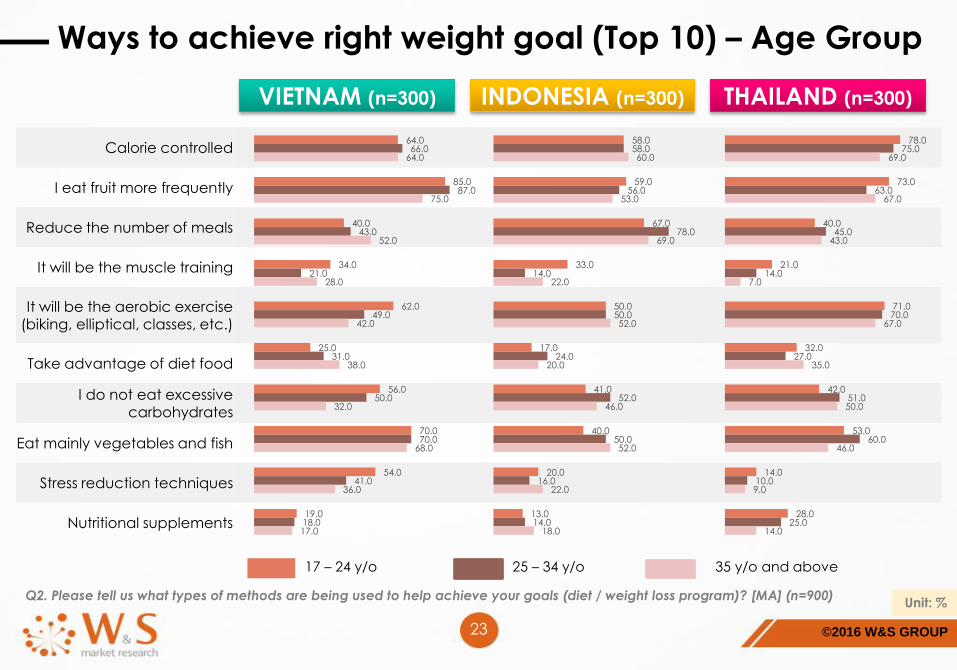
Each country use different methods to achieve the right body. The top method used by Vietnam is eating fruits more frequently (82.3%), reducing the number of meals in Indonesia (71.3%) and
calorie control in Thailand (74.0%).
©2016 W&S GROUP23
Q2. Please tell us what types of methods are being used to help achieve your goals (diet / weight loss program)? [MA] (n=900) Unit: %
Ways to achieve right weight goal (Top 10) – Age Group
VIETNAM (n=300) INDONESIA (n=300) THAILAND (n=300)
Calorie controlled
I eat fruit more frequently
Reduce the number of meals
It will be the muscle training
It will be the aerobic exercise (biking, elliptical, classes, etc.)
Take advantage of diet food
I do not eat excessive carbohydrates
Eat mainly vegetables and fish
Stress reduction techniques
Nutritional supplements
64.0
85.0
40.0
34.0
62.0
25.0
56.0
70.0
54.0
19.0
66.0
87.0
43.0
21.0
49.0
31.0
50.0
70.0
41.0
18.0
64.0
75.0
52.0
28.0
42.0
38.0
32.0
68.0
36.0
17.0
58.0
59.0
67.0
33.0
50.0
17.0
41.0
40.0
20.0
13.0
58.0
56.0
78.0
14.0
50.0
24.0
52.0
50.0
16.0
14.0
60.0
53.0
69.0
22.0
52.0
20.0
46.0
52.0
22.0
18.0
78.0
73.0
40.0
21.0
71.0
32.0
42.0
53.0
14.0
28.0
75.0
63.0
45.0
14.0
70.0
27.0
51.0
60.0
10.0
25.0
69.0
67.0
43.0
7.0
67.0
35.0
50.0
46.0
9.0
14.0
17 – 24 y/o 25 – 34 y/o 35 y/o and above
©2016 W&S GROUP24
Q3. Please tell us what method is best for you to diet (weight loss program)? [SA] (n=900) Unit: %
Best Ways to achieve right weight goal (Top 10)
Calorie
controlled
I eat fruit more
frequently
Reduce the
number of
meals
It will be the
muscle training
It will be the
aerobic
exercise
(biking,
elliptical,
classes, etc.)
Take
advantage of
diet food
I do not eat
excessive
carbohydrates
Eat mainly
vegetables
and fish
Stress
reduction
techniques
(yoga, t’ai chi,
etc.)
Nutritional
supplements
VIETNAM 27.7 13.3 7.7 4.3 8.7 1.3 12.7 11.0 7.0 1.3
INDONESIA 17.3 8.7 23.7 1.7 18.3 3.3 12.7 6.0 2.0 1.3
THAILAND 21.0 7.7 8.3 1.7 34.0 1.7 14.7 6.0 1.0 2.3
27.7
13.3
7.7
4.3
8.7
1.3
12.711.0
7.0
1.3
17.3
8.7
23.7
1.7
18.3
3.3
12.7
6.0
2.0 1.3
21.0
7.7 8.3
1.7
34.0
1.7
14.7
6.0
1.02.3
0.0
5.0
10.0
15.0
20.0
25.0
30.0
35.0
40.0
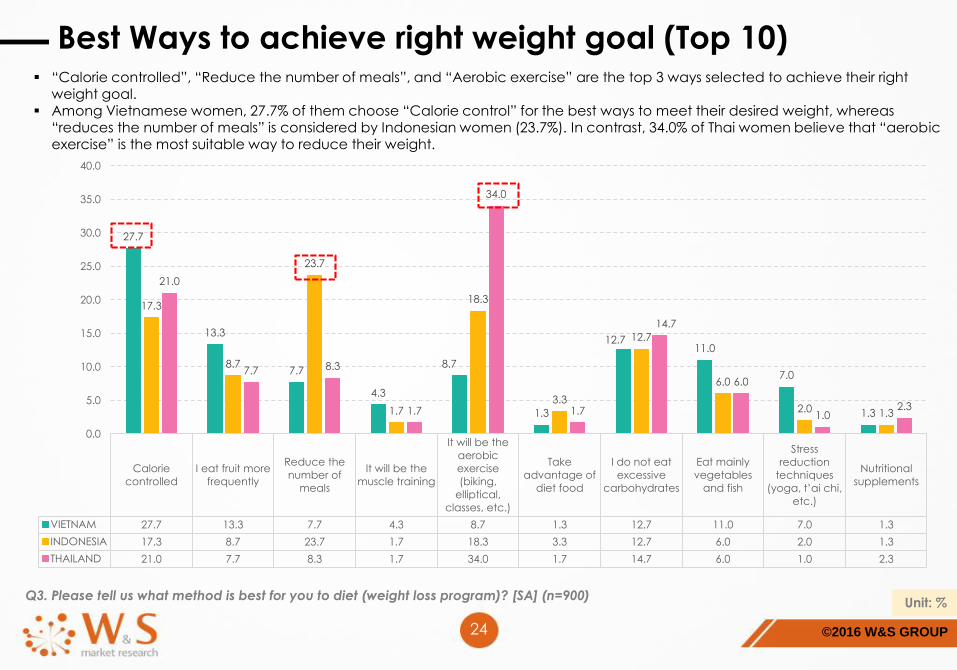
“Calorie controlled”, “Reduce the number of meals”, and “Aerobic exercise” are the top 3 ways selected to achieve their rightweight goal.
Among Vietnamese women, 27.7% of them choose “Calorie control” for the best ways to meet their desired weight, whereas “reduces the number of meals” is considered by Indonesian women (23.7%). In contrast, 34.0% of Thai women believe that “aerobic exercise” is the most suitable way to reduce their weight.
©2016 W&S GROUP25
Q3. Please tell us what method is best for you to diet (weight loss program)? [SA] (n=900) Unit: %
Best Ways to achieve right weight goal (Top 10) – Age Group
VIETNAM (n=300) INDONESIA (n=300) THAILAND (n=300)
Calorie controlled
I eat fruit more frequently
Reduce the number of meals
It will be the muscle training
It will be the aerobic exercise (biking, elliptical, classes, etc.)
Take advantage of diet food
I do not eat excessive carbohydrates
Eat mainly vegetables and fish
Stress reduction techniques
Nutritional supplements
17 – 24 y/o 25 – 34 y/o 35 y/o and above
20.0
18.0
3.0
6.0
13.0
0.0
18.0
8.0
7.0
1.0
33.0
13.0
8.0
5.0
6.0
1.0
11.0
14.0
4.0
0.0
30.0
9.0
12.0
2.0
7.0
3.0
9.0
11.0
10.0
3.0
19.0
5.0
23.0
3.0
21.0
3.0
8.0
8.0
2.0
1.0
13.0
11.0
30.0
0.0
18.0
3.0
14.0
5.0
2.0
1.0
20.0
10.0
18.0
2.0
16.0
4.0
16.0
5.0
2.0
2.0
19.0
12.0
9.0
2.0
33.0
1.0
12.0
5.0
1.0
3.0
26.0
5.0
8.0
2.0
31.0
0.0
11.0
9.0
2.0
4.0
18.0
6.0
8.0
1.0
38.0
4.0
21.0
4.0
0.0
0.0
©2016 W&S GROUP26
Q4. Please tell us which parts of your body did(do) you want to decrease? [MA] (n=900) Unit: %
Body Concerns
Upper Arm
VN:39.0%
ID:52.7%
TH:52.3%
Belly
VN:94.7%
ID:92.3%
TH:88.0%
Thighs
VN:59.0%
ID:65.0%
TH:72.3%
Calf
VN:41.7%
ID:31.0%
TH:44.7%
Cheeks
VN:20.7%
ID:29.3%
TH:23.0%
Wattle (saggy skin between chin and neck)
VN:26.0%
ID:19.3%
TH:30.3%
Hip
VN:39.3%
ID:36.7%
TH:52.3%
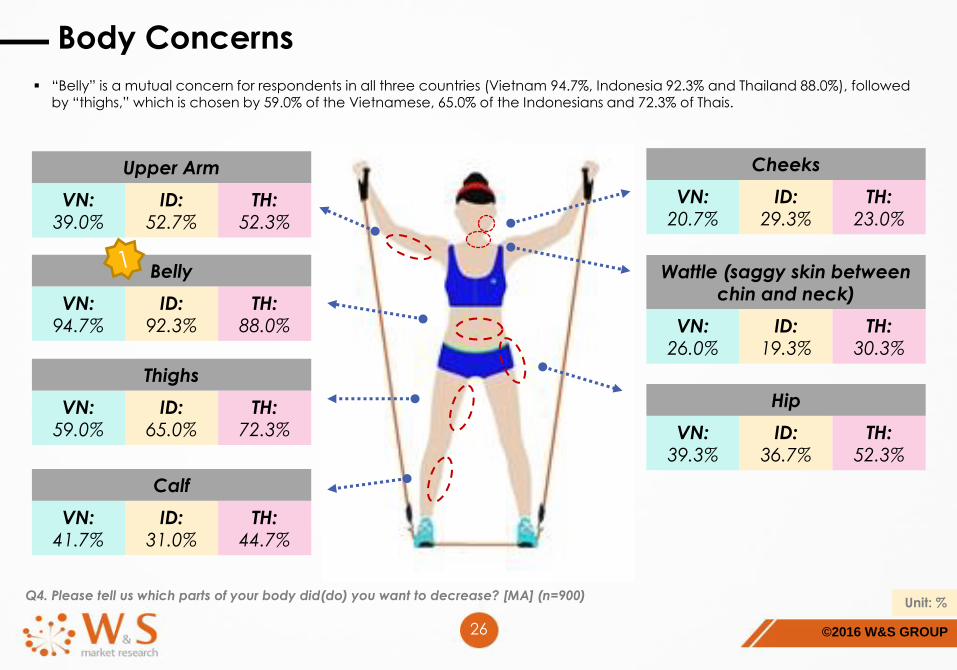
“Belly” is a mutual concern for respondents in all three countries (Vietnam 94.7%, Indonesia 92.3% and Thailand 88.0%), followed by “thighs,” which is chosen by 59.0% of the Vietnamese, 65.0% of the Indonesians and 72.3% of Thais.
©2016 W&S GROUP27
Q4. Please tell us which parts of your body did(do) you want to decrease? [MA] (n=900) Unit: %
Body Concerns – Age Group
Upper arm
Thighs
Calf
Belly
Hip
Cheeks
Wattle (saggy skin
between chin and neck)
Others (please specify)
50.0
70.0
52.0
90.0
41.0
26.0
19.0
1.0
33.0
57.0
35.0
97.0
35.0
18.0
22.0
0.0
34.0
50.0
38.0
97.0
42.0
18.0
37.0
2.0
VIETNAM (n=300) INDONESIA (n=300) THAILAND (n=300)
49.0
71.0
41.0
92.0
32.0
34.0
21.0
2.0
57.0
63.0
24.0
94.0
31.0
30.0
14.0
0.0
52.0
61.0
28.0
91.0
47.0
24.0
23.0
2.0
60.0
83.0
59.0
87.0
56.0
28.0
41.0
0.0
58.0
69.0
36.0
85.0
46.0
25.0
30.0
0.0
39.0
65.0
39.0
92.0
55.0
16.0
20.0
0.0
17 – 24 y/o 25 – 34 y/o 35 y/o and above
©2016 W&S GROUP28
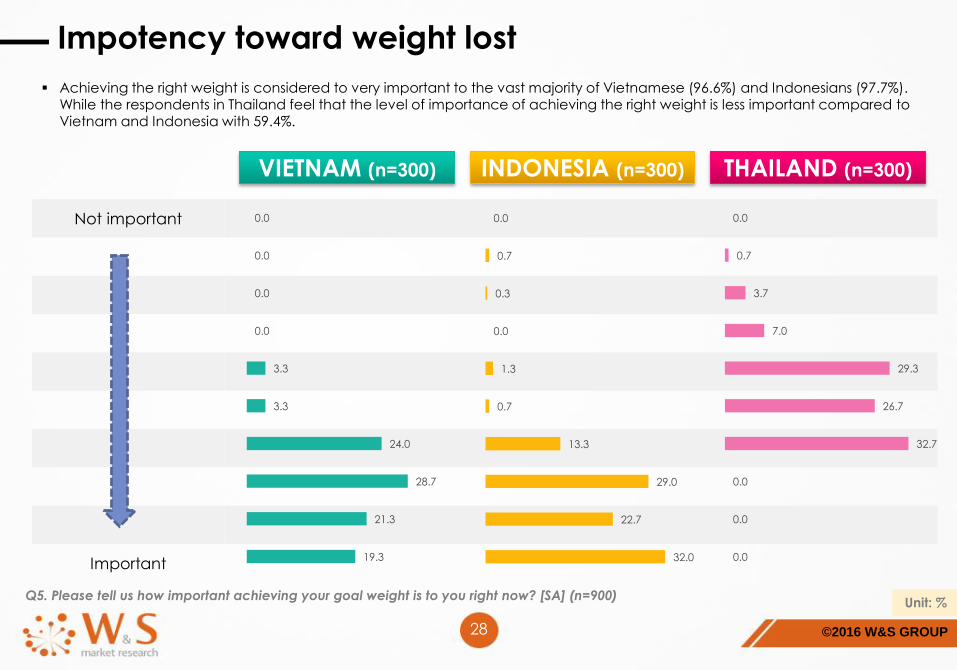
Q5. Please tell us how important achieving your goal weight is to you right now? [SA] (n=900) Unit: %
Impotency toward weight lost
VIETNAM (n=300) INDONESIA (n=300) THAILAND (n=300)
Not important
Important
0.0
0.7
3.7
7.0
29.3
26.7
32.7
0.0
0.0
0.0
0.0
0.0
0.0
0.0
3.3
3.3
24.0
28.7
21.3
19.3
0.0
0.7
0.3
0.0
1.3
0.7
13.3
29.0
22.7
32.0
Achieving the right weight is considered to very important to the vast majority of Vietnamese (96.6%) and Indonesians (97.7%). While the respondents in Thailand feel that the level of importance of achieving the right weight is less important compared to Vietnam and Indonesia with 59.4%.
©2016 W&S GROUP29
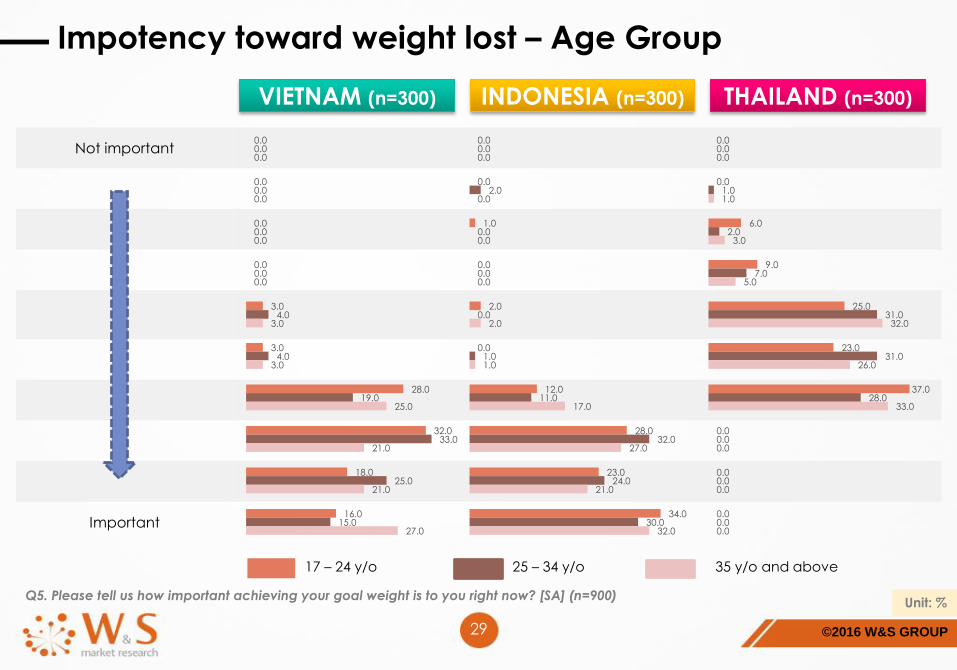
Q5. Please tell us how important achieving your goal weight is to you right now? [SA] (n=900) Unit: %
Impotency toward weight lost – Age Group
VIETNAM (n=300) INDONESIA (n=300) THAILAND (n=300)
Not important
Important
17 – 24 y/o 25 – 34 y/o 35 y/o and above
0.0
0.0
0.0
0.0
3.0
3.0
28.0
32.0
18.0
16.0
0.0
0.0
0.0
0.0
4.0
4.0
19.0
33.0
25.0
15.0
0.0
0.0
0.0
0.0
3.0
3.0
25.0
21.0
21.0
27.0
0.0
0.0
1.0
0.0
2.0
0.0
12.0
28.0
23.0
34.0
0.0
2.0
0.0
0.0
0.0
1.0
11.0
32.0
24.0
30.0
0.0
0.0
0.0
0.0
2.0
1.0
17.0
27.0
21.0
32.0
0.0
0.0
6.0
9.0
25.0
23.0
37.0
0.0
0.0
0.0
0.0
1.0
2.0
7.0
31.0
31.0
28.0
0.0
0.0
0.0
0.0
1.0
3.0
5.0
32.0
26.0
33.0
0.0
0.0
0.0
©2016 W&S GROUP30
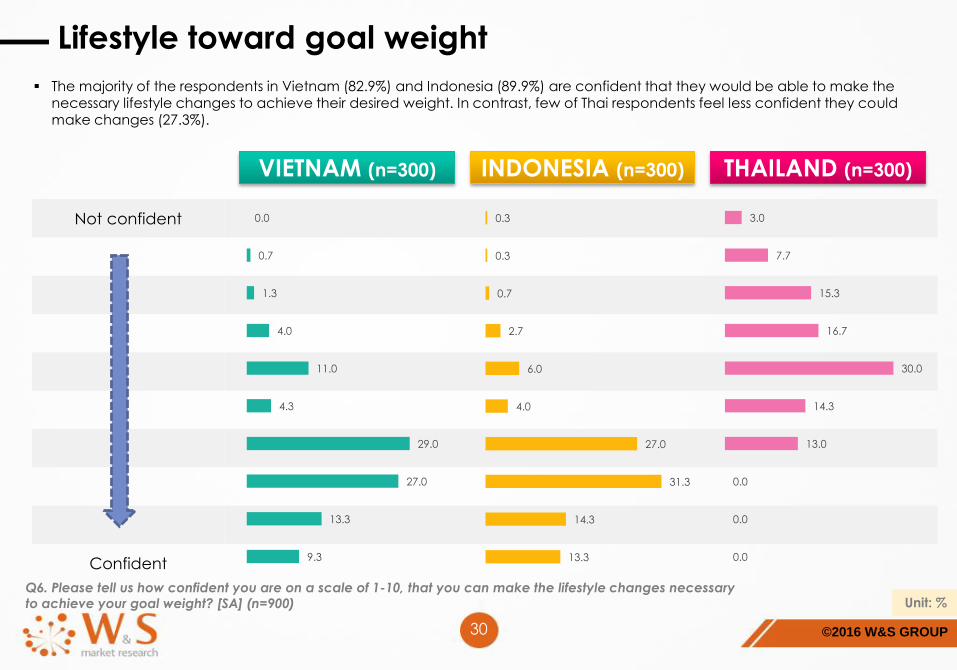
Q6. Please tell us how confident you are on a scale of 1-10, that you can make the lifestyle changes necessary to achieve your goal weight? [SA] (n=900) Unit: %
Lifestyle toward goal weight
VIETNAM (n=300) INDONESIA (n=300) THAILAND (n=300)
Not confident
Confident
3.0
7.7
15.3
16.7
30.0
14.3
13.0
0.0
0.0
0.0
0.0
0.7
1.3
4.0
11.0
4.3
29.0
27.0
13.3
9.3
0.3
0.3
0.7
2.7
6.0
4.0
27.0
31.3
14.3
13.3
The majority of the respondents in Vietnam (82.9%) and Indonesia (89.9%) are confident that they would be able to make the necessary lifestyle changes to achieve their desired weight. In contrast, few of Thai respondents feel less confident they couldmake changes (27.3%).
©2016 W&S GROUP31
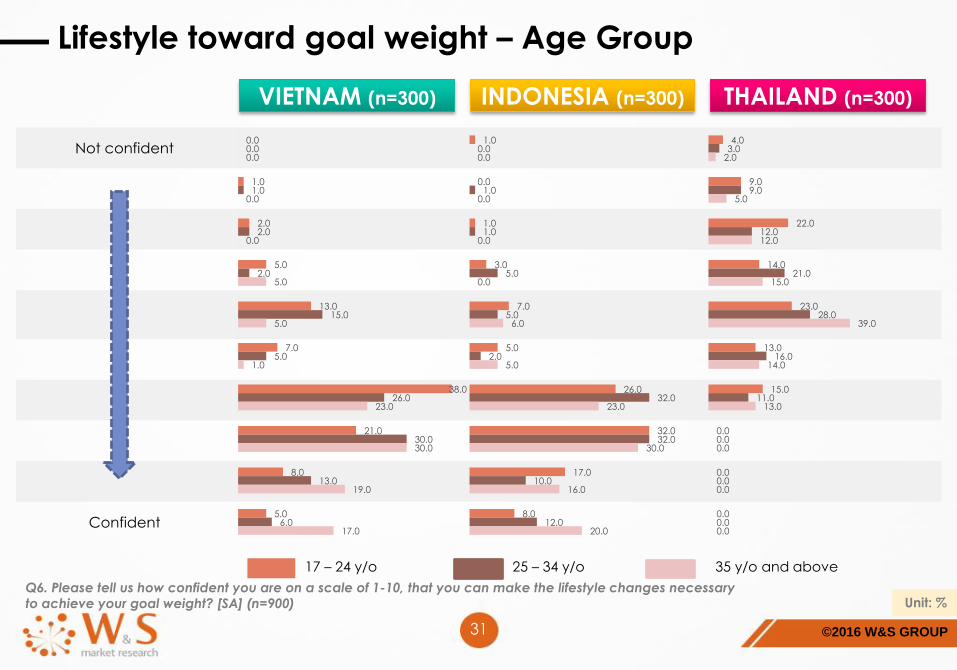
Q6. Please tell us how confident you are on a scale of 1-10, that you can make the lifestyle changes necessary to achieve your goal weight? [SA] (n=900) Unit: %
Lifestyle toward goal weight – Age Group
VIETNAM (n=300) INDONESIA (n=300) THAILAND (n=300)
Not confident
Confident
17 – 24 y/o 25 – 34 y/o 35 y/o and above
0.0
1.0
2.0
5.0
13.0
7.0
38.0
21.0
8.0
5.0
0.0
1.0
2.0
2.0
15.0
5.0
26.0
30.0
13.0
6.0
0.0
0.0
0.0
5.0
5.0
1.0
23.0
30.0
19.0
17.0
1.0
0.0
1.0
3.0
7.0
5.0
26.0
32.0
17.0
8.0
0.0
1.0
1.0
5.0
5.0
2.0
32.0
32.0
10.0
12.0
0.0
0.0
0.0
0.0
6.0
5.0
23.0
30.0
16.0
20.0
4.0
9.0
22.0
14.0
23.0
13.0
15.0
0.0
0.0
0.0
3.0
9.0
12.0
21.0
28.0
16.0
11.0
0.0
0.0
0.0
2.0
5.0
12.0
15.0
39.0
14.0
13.0
0.0
0.0
0.0
©2016 W&S GROUP32
Q7. How many kg loss would you like to achieve? [SA] (n=900) Unit: %
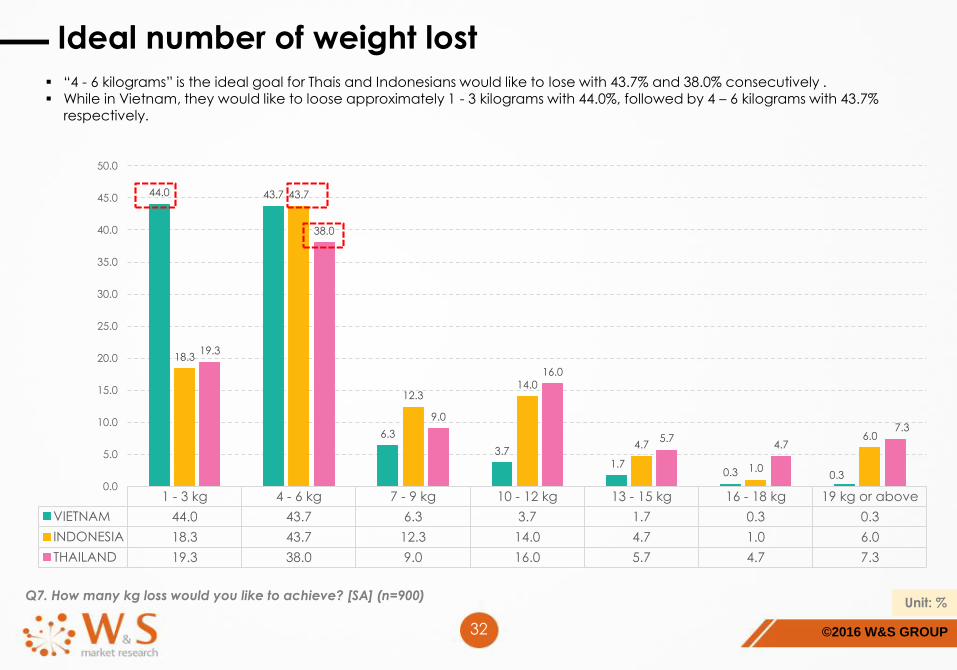
Ideal number of weight lost
1 - 3 kg 4 - 6 kg 7 - 9 kg 10 - 12 kg 13 - 15 kg 16 - 18 kg 19 kg or above
VIETNAM 44.0 43.7 6.3 3.7 1.7 0.3 0.3
INDONESIA 18.3 43.7 12.3 14.0 4.7 1.0 6.0
THAILAND 19.3 38.0 9.0 16.0 5.7 4.7 7.3
44.0 43.7
6.3
3.7
1.70.3 0.3
18.3
43.7
12.314.0
4.7
1.0
6.0
19.3
38.0
9.0
16.0
5.74.7
7.3
0.0
5.0
10.0
15.0
20.0
25.0
30.0
35.0
40.0
45.0
50.0
“4 - 6 kilograms” is the ideal goal for Thais and Indonesians would like to lose with 43.7% and 38.0% consecutively . While in Vietnam, they would like to loose approximately 1 - 3 kilograms with 44.0%, followed by 4 – 6 kilograms with 43.7%
respectively.
©2016 W&S GROUP33
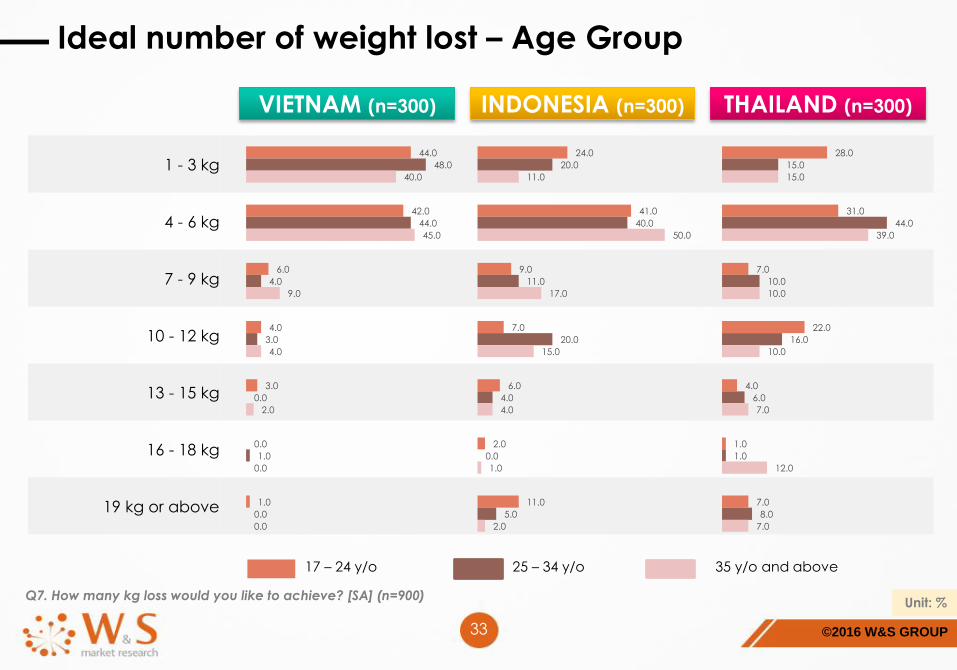
Q7. How many kg loss would you like to achieve? [SA] (n=900) Unit: %
Ideal number of weight lost – Age Group
VIETNAM (n=300) INDONESIA (n=300) THAILAND (n=300)
1 - 3 kg
4 - 6 kg
7 - 9 kg
10 - 12 kg
13 - 15 kg
16 - 18 kg
19 kg or above
44.0
42.0
6.0
4.0
3.0
0.0
1.0
48.0
44.0
4.0
3.0
0.0
1.0
0.0
40.0
45.0
9.0
4.0
2.0
0.0
0.0
24.0
41.0
9.0
7.0
6.0
2.0
11.0
20.0
40.0
11.0
20.0
4.0
0.0
5.0
11.0
50.0
17.0
15.0
4.0
1.0
2.0
28.0
31.0
7.0
22.0
4.0
1.0
7.0
15.0
44.0
10.0
16.0
6.0
1.0
8.0
15.0
39.0
10.0
10.0
7.0
12.0
7.0
17 – 24 y/o 25 – 34 y/o 35 y/o and above
©2016 W&S GROUP34
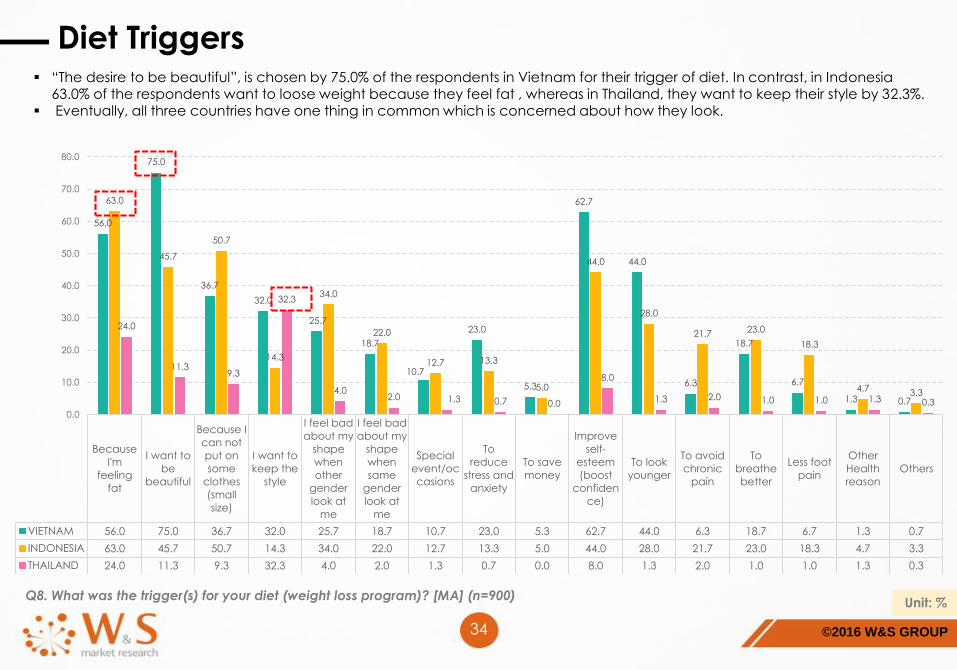
Q8. What was the trigger(s) for your diet (weight loss program)? [MA] (n=900)Unit: %
Diet Triggers
Because
I'm
feeling
fat
I want to
be
beautiful
Because I
can not
put on
some
clothes
(small
size)
I want to
keep the
style
I feel bad
about my
shape
when
other
gender
look at
me
I feel bad
about my
shape
when
same
gender
look at
me
Special
event/oc
casions
To
reduce
stress and
anxiety
To save
money
Improve
self-
esteem
(boost
confiden
ce)
To look
younger
To avoid
chronic
pain
To
breathe
better
Less foot
pain
Other
Health
reason
Others
VIETNAM 56.0 75.0 36.7 32.0 25.7 18.7 10.7 23.0 5.3 62.7 44.0 6.3 18.7 6.7 1.3 0.7
INDONESIA 63.0 45.7 50.7 14.3 34.0 22.0 12.7 13.3 5.0 44.0 28.0 21.7 23.0 18.3 4.7 3.3
THAILAND 24.0 11.3 9.3 32.3 4.0 2.0 1.3 0.7 0.0 8.0 1.3 2.0 1.0 1.0 1.3 0.3
56.0
75.0
36.7
32.0
25.7
18.7
10.7
23.0
5.3
62.7
44.0
6.3
18.7
6.7
1.3 0.7
63.0
45.7
50.7
14.3
34.0
22.0
12.7 13.3
5.0
44.0
28.0
21.7 23.0
18.3
4.7 3.3
24.0
11.39.3
32.3
4.02.0 1.3 0.7 0.0
8.0
1.3 2.0 1.0 1.0 1.3 0.3
0.0
10.0
20.0
30.0
40.0
50.0
60.0
70.0
80.0
“The desire to be beautiful”, is chosen by 75.0% of the respondents in Vietnam for their trigger of diet. In contrast, in Indonesia 63.0% of the respondents want to loose weight because they feel fat , whereas in Thailand, they want to keep their style by 32.3%.
Eventually, all three countries have one thing in common which is concerned about how they look.
©2016 W&S GROUP35
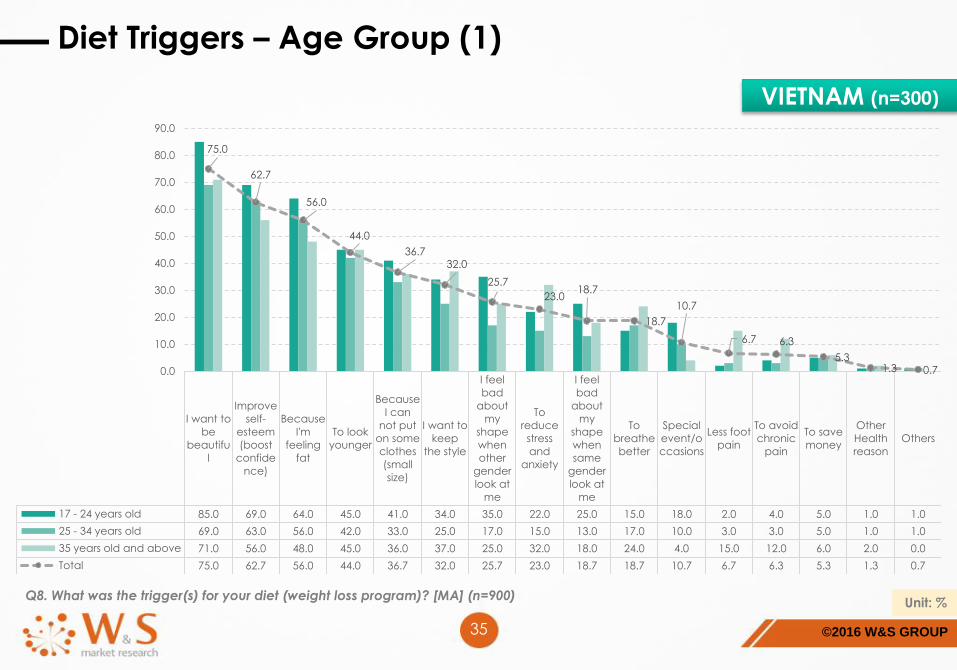
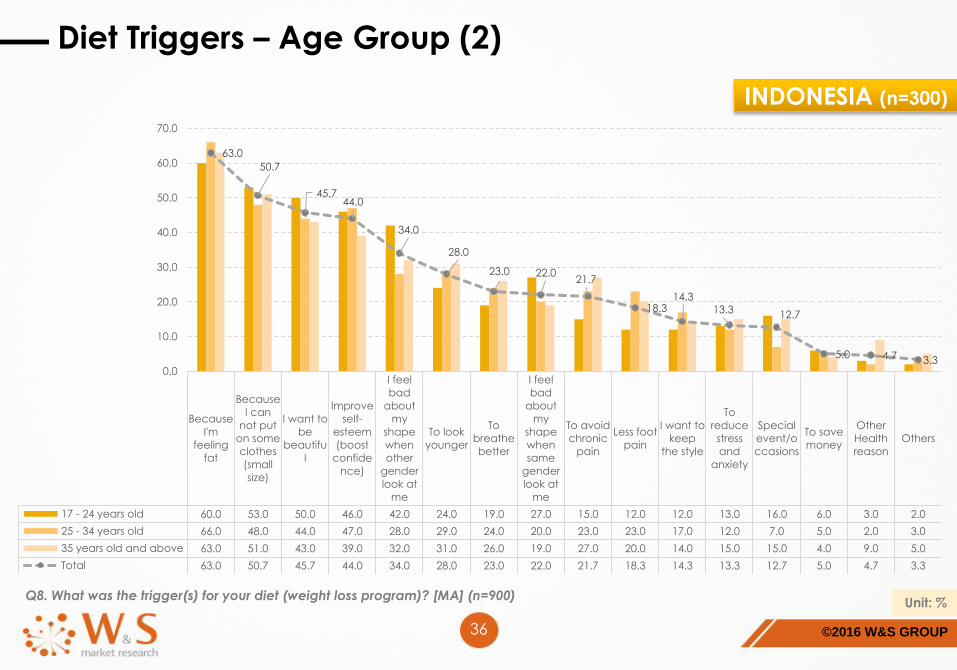
Q8. What was the trigger(s) for your diet (weight loss program)? [MA] (n=900) Unit: %
Diet Triggers – Age Group (1)
I want to
be
beautifu
l
Improve
self-
esteem
(boost
confide
nce)
Because
I'm
feeling
fat
To look
younger
Because
I can
not put
on some
clothes
(small
size)
I want to
keep
the style
I feel
bad
about
my
shape
when
other
gender
look at
me
To
reduce
stress
and
anxiety
I feel
bad
about
my
shape
when
same
gender
look at
me
To
breathe
better
Special
event/o
ccasions
Less foot
pain
To avoid
chronic
pain
To save
money
Other
Health
reason
Others
17 - 24 years old 85.0 69.0 64.0 45.0 41.0 34.0 35.0 22.0 25.0 15.0 18.0 2.0 4.0 5.0 1.0 1.0
25 - 34 years old 69.0 63.0 56.0 42.0 33.0 25.0 17.0 15.0 13.0 17.0 10.0 3.0 3.0 5.0 1.0 1.0
35 years old and above 71.0 56.0 48.0 45.0 36.0 37.0 25.0 32.0 18.0 24.0 4.0 15.0 12.0 6.0 2.0 0.0
Total 75.0 62.7 56.0 44.0 36.7 32.0 25.7 23.0 18.7 18.7 10.7 6.7 6.3 5.3 1.3 0.7
75.0
62.7
56.0
44.0
36.732.0
25.7
23.018.7
18.7
10.7
6.7 6.3
5.31.3 0.70.0
10.0
20.0
30.0
40.0
50.0
60.0
70.0
80.0
90.0
VIETNAM (n=300)
©2016 W&S GROUP36
Q8. What was the trigger(s) for your diet (weight loss program)? [MA] (n=900) Unit: %
Diet Triggers – Age Group (2)
Because
I'm
feeling
fat
Because
I can
not put
on some
clothes
(small
size)
I want to
be
beautifu
l
Improve
self-
esteem
(boost
confide
nce)
I feel
bad
about
my
shape
when
other
gender
look at
me
To look
younger
To
breathe
better
I feel
bad
about
my
shape
when
same
gender
look at
me
To avoid
chronic
pain
Less foot
pain
I want to
keep
the style
To
reduce
stress
and
anxiety
Special
event/o
ccasions
To save
money
Other
Health
reason
Others
17 - 24 years old 60.0 53.0 50.0 46.0 42.0 24.0 19.0 27.0 15.0 12.0 12.0 13.0 16.0 6.0 3.0 2.0
25 - 34 years old 66.0 48.0 44.0 47.0 28.0 29.0 24.0 20.0 23.0 23.0 17.0 12.0 7.0 5.0 2.0 3.0
35 years old and above 63.0 51.0 43.0 39.0 32.0 31.0 26.0 19.0 27.0 20.0 14.0 15.0 15.0 4.0 9.0 5.0
Total 63.0 50.7 45.7 44.0 34.0 28.0 23.0 22.0 21.7 18.3 14.3 13.3 12.7 5.0 4.7 3.3
63.0
50.7
45.744.0
34.0
28.0
23.0 22.021.7
18.314.3
13.3 12.7
5.0 4.7 3.30.0
10.0
20.0
30.0
40.0
50.0
60.0
70.0
INDONESIA (n=300)

©2016 W&S GROUP37
Q8. What was the trigger(s) for your diet (weight loss program)? [MA] (n=900) Unit: %
Diet Triggers – Age Group (3)
I want to
keep
the style
Because
I'm
feeling
fat
I want to
be
beautifu
l
Because
I can
not put
on some
clothes
(small
size)
Improve
self-
esteem
(boost
confide
nce)
I feel
bad
about
my
shape
when
other
gender
look at
me
I feel
bad
about
my
shape
when
same
gender
look at
me
To avoid
chronic
pain
Special
event/o
ccasions
To look
younger
Other
Health
reason
To
breathe
better
Less foot
pain
To
reduce
stress
and
anxiety
OthersTo save
money
17 - 24 years old 24.0 24.0 15.0 12.0 8.0 5.0 3.0 1.0 3.0 1.0 1.0 1.0 1.0 0.0 1.0 0.0
25 - 34 years old 27.0 25.0 11.0 9.0 11.0 3.0 2.0 4.0 1.0 2.0 1.0 1.0 1.0 2.0 0.0 0.0
35 years old and above 46.0 23.0 8.0 7.0 5.0 4.0 1.0 1.0 0.0 1.0 2.0 1.0 1.0 0.0 0.0 0.0
Total 32.3 24.0 11.3 9.3 8.0 4.0 2.0 2.0 1.3 1.3 1.3 1.0 1.0 0.7 0.3 0.0
32.324.0
11.39.3 8.0
4.02.0 2.0
1.3
1.3
1.31.0 1.0
0.7 0.3
0.00.0
5.0
10.0
15.0
20.0
25.0
30.0
35.0
40.0
45.0
50.0
THAILAND (n=300)
©2016 W&S GROUP38
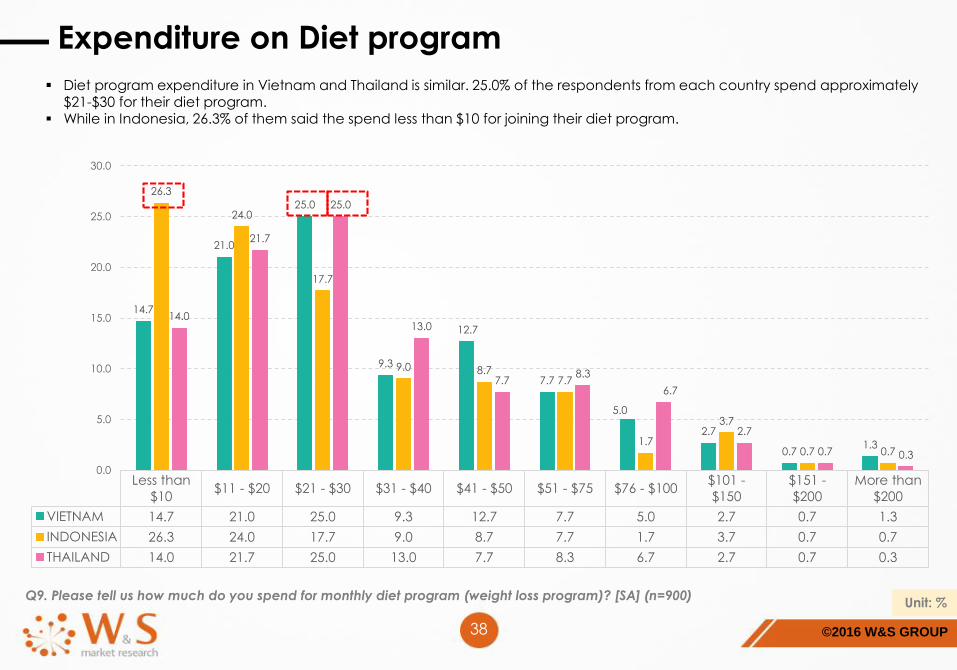
Q9. Please tell us how much do you spend for monthly diet program (weight loss program)? [SA] (n=900) Unit: %
Expenditure on Diet program
Less than
$10$11 - $20 $21 - $30 $31 - $40 $41 - $50 $51 - $75 $76 - $100
$101 -
$150
$151 -
$200
More than
$200
VIETNAM 14.7 21.0 25.0 9.3 12.7 7.7 5.0 2.7 0.7 1.3
INDONESIA 26.3 24.0 17.7 9.0 8.7 7.7 1.7 3.7 0.7 0.7
THAILAND 14.0 21.7 25.0 13.0 7.7 8.3 6.7 2.7 0.7 0.3
14.7
21.0
25.0
9.3
12.7
7.7
5.0
2.7
0.71.3
26.3
24.0
17.7
9.0 8.77.7
1.7
3.7
0.7 0.7
14.0
21.7
25.0
13.0
7.78.3
6.7
2.7
0.7 0.3
0.0
5.0
10.0
15.0
20.0
25.0
30.0
Diet program expenditure in Vietnam and Thailand is similar. 25.0% of the respondents from each country spend approximately $21-$30 for their diet program.
While in Indonesia, 26.3% of them said the spend less than $10 for joining their diet program.
©2016 W&S GROUP
Less than $10
$11 - $20
$21 - $30
$31 - $40
$41 - $50
$51 - $75
$76 - $100
$101 - $150
$151 - $200
More than $200
39
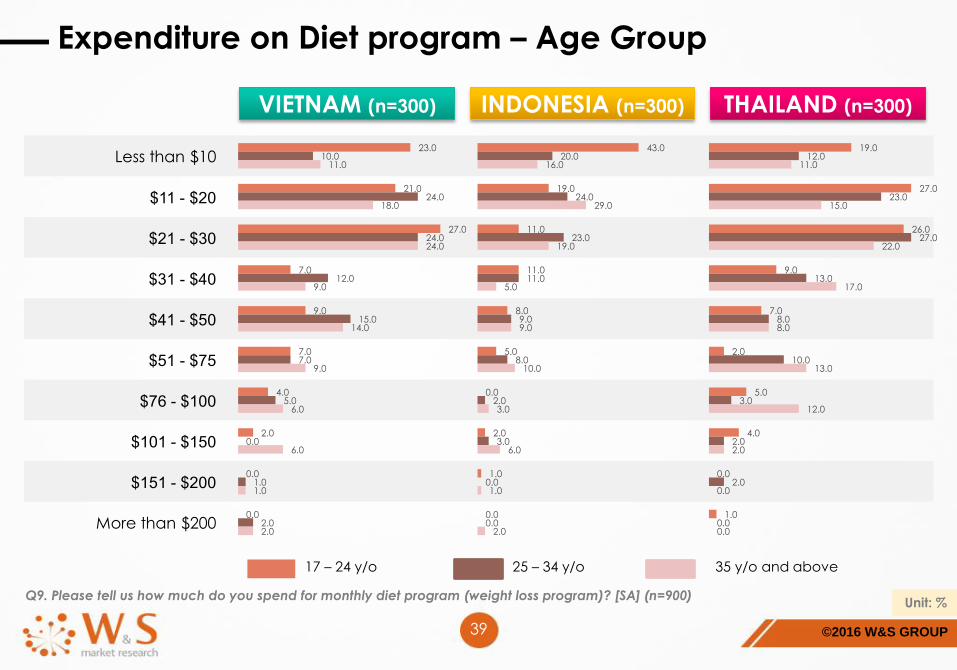
Q9. Please tell us how much do you spend for monthly diet program (weight loss program)? [SA] (n=900) Unit: %
Expenditure on Diet program – Age Group
VIETNAM (n=300) INDONESIA (n=300) THAILAND (n=300)
17 – 24 y/o 25 – 34 y/o 35 y/o and above
23.0
21.0
27.0
7.0
9.0
7.0
4.0
2.0
0.0
0.0
10.0
24.0
24.0
12.0
15.0
7.0
5.0
0.0
1.0
2.0
11.0
18.0
24.0
9.0
14.0
9.0
6.0
6.0
1.0
2.0
43.0
19.0
11.0
11.0
8.0
5.0
0.0
2.0
1.0
0.0
20.0
24.0
23.0
11.0
9.0
8.0
2.0
3.0
0.0
0.0
16.0
29.0
19.0
5.0
9.0
10.0
3.0
6.0
1.0
2.0
19.0
27.0
26.0
9.0
7.0
2.0
5.0
4.0
0.0
1.0
12.0
23.0
27.0
13.0
8.0
10.0
3.0
2.0
2.0
0.0
11.0
15.0
22.0
17.0
8.0
13.0
12.0
2.0
0.0
0.0
©2016 W&S GROUP40
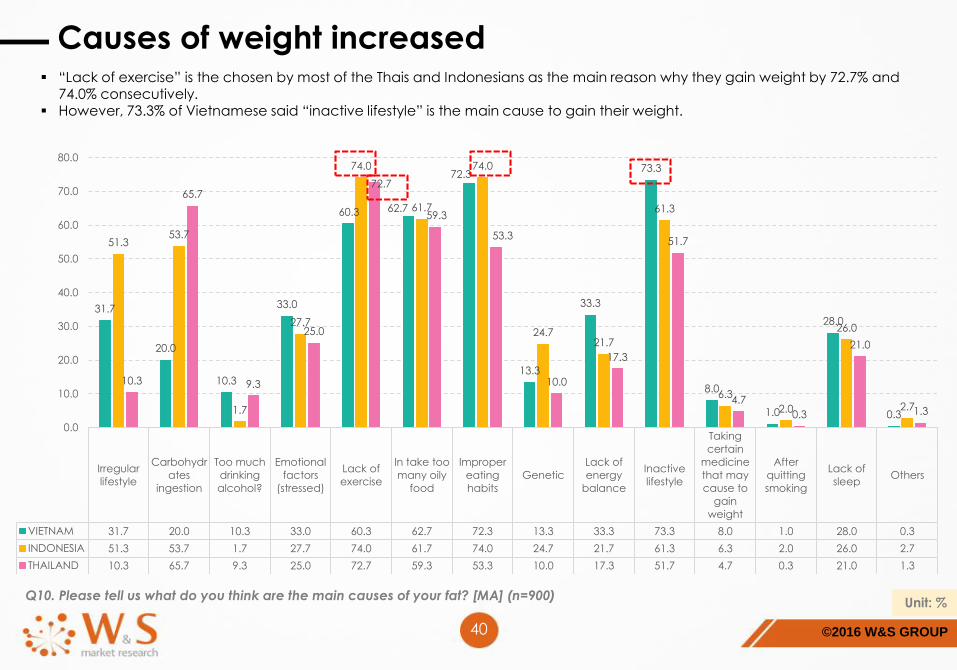
Q10. Please tell us what do you think are the main causes of your fat? [MA] (n=900)Unit: %
Causes of weight increased
Irregular
lifestyle
Carbohydr
ates
ingestion
Too much
drinking
alcohol?
Emotional
factors
(stressed)
Lack of
exercise
In take too
many oily
food
Improper
eating
habits
Genetic
Lack of
energy
balance
Inactive
lifestyle
Taking
certain
medicine
that may
cause to
gain
weight
After
quitting
smoking
Lack of
sleepOthers
VIETNAM 31.7 20.0 10.3 33.0 60.3 62.7 72.3 13.3 33.3 73.3 8.0 1.0 28.0 0.3
INDONESIA 51.3 53.7 1.7 27.7 74.0 61.7 74.0 24.7 21.7 61.3 6.3 2.0 26.0 2.7
THAILAND 10.3 65.7 9.3 25.0 72.7 59.3 53.3 10.0 17.3 51.7 4.7 0.3 21.0 1.3
31.7
20.0
10.3
33.0
60.3 62.7
72.3
13.3
33.3
73.3
8.0
1.0
28.0
0.3
51.353.7
1.7
27.7
74.0
61.7
74.0
24.721.7
61.3
6.3
2.0
26.0
2.7
10.3
65.7
9.3
25.0
72.7
59.3
53.3
10.0
17.3
51.7
4.7
0.3
21.0
1.3
0.0
10.0
20.0
30.0
40.0
50.0
60.0
70.0
80.0
“Lack of exercise” is the chosen by most of the Thais and Indonesians as the main reason why they gain weight by 72.7% and 74.0% consecutively.
However, 73.3% of Vietnamese said “inactive lifestyle” is the main cause to gain their weight.
©2016 W&S GROUP41
Q10. Please tell us what do you think are the main causes of your fat? [MA] (n=900) Unit: %
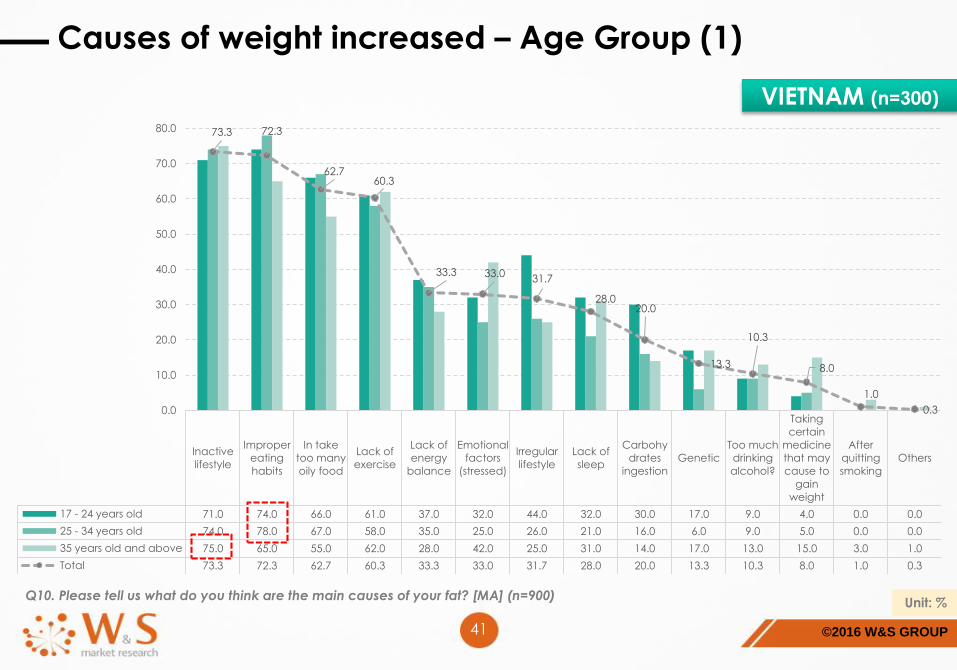
Causes of weight increased – Age Group (1)
Inactive
lifestyle
Improper
eating
habits
In take
too many
oily food
Lack of
exercise
Lack of
energy
balance
Emotional
factors
(stressed)
Irregular
lifestyle
Lack of
sleep
Carbohy
drates
ingestion
Genetic
Too much
drinking
alcohol?
Taking
certain
medicine
that may
cause to
gain
weight
After
quitting
smoking
Others
17 - 24 years old 71.0 74.0 66.0 61.0 37.0 32.0 44.0 32.0 30.0 17.0 9.0 4.0 0.0 0.0
25 - 34 years old 74.0 78.0 67.0 58.0 35.0 25.0 26.0 21.0 16.0 6.0 9.0 5.0 0.0 0.0
35 years old and above 75.0 65.0 55.0 62.0 28.0 42.0 25.0 31.0 14.0 17.0 13.0 15.0 3.0 1.0
Total 73.3 72.3 62.7 60.3 33.3 33.0 31.7 28.0 20.0 13.3 10.3 8.0 1.0 0.3
73.3 72.3
62.760.3
33.3 33.031.7
28.020.0
13.3
10.3
8.0
1.0
0.30.0
10.0
20.0
30.0
40.0
50.0
60.0
70.0
80.0
VIETNAM (n=300)
©2016 W&S GROUP42
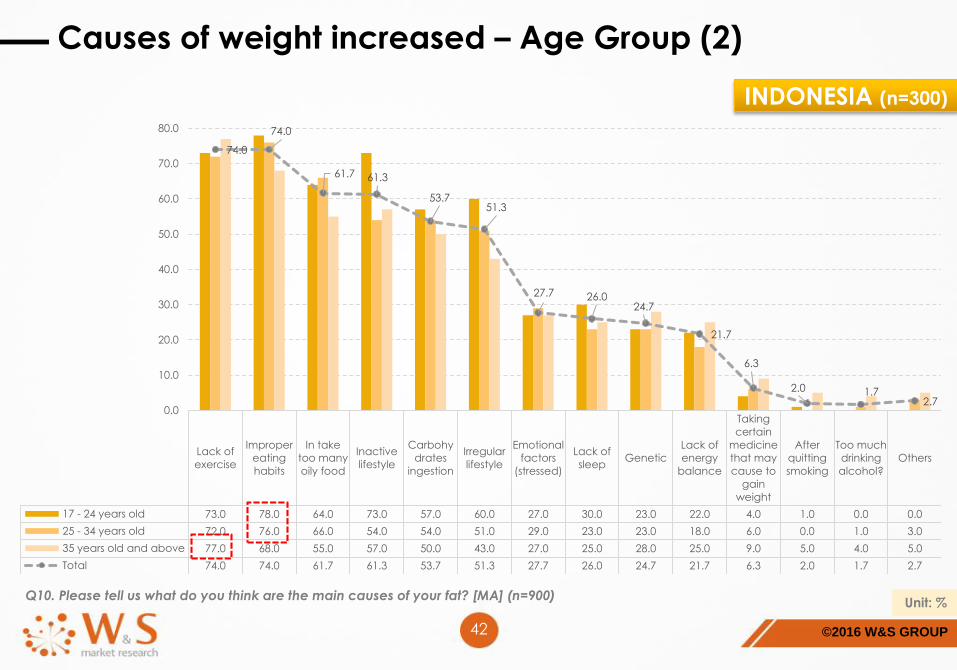
Q10. Please tell us what do you think are the main causes of your fat? [MA] (n=900) Unit: %
Causes of weight increased – Age Group (2)
Lack of
exercise
Improper
eating
habits
In take
too many
oily food
Inactive
lifestyle
Carbohy
drates
ingestion
Irregular
lifestyle
Emotional
factors
(stressed)
Lack of
sleepGenetic
Lack of
energy
balance
Taking
certain
medicine
that may
cause to
gain
weight
After
quitting
smoking
Too much
drinking
alcohol?
Others
17 - 24 years old 73.0 78.0 64.0 73.0 57.0 60.0 27.0 30.0 23.0 22.0 4.0 1.0 0.0 0.0
25 - 34 years old 72.0 76.0 66.0 54.0 54.0 51.0 29.0 23.0 23.0 18.0 6.0 0.0 1.0 3.0
35 years old and above 77.0 68.0 55.0 57.0 50.0 43.0 27.0 25.0 28.0 25.0 9.0 5.0 4.0 5.0
Total 74.0 74.0 61.7 61.3 53.7 51.3 27.7 26.0 24.7 21.7 6.3 2.0 1.7 2.7
74.0
74.0
61.7 61.3
53.751.3
27.7 26.024.7
21.7
6.3
2.0 1.72.7
0.0
10.0
20.0
30.0
40.0
50.0
60.0
70.0
80.0
INDONESIA (n=300)
©2016 W&S GROUP43
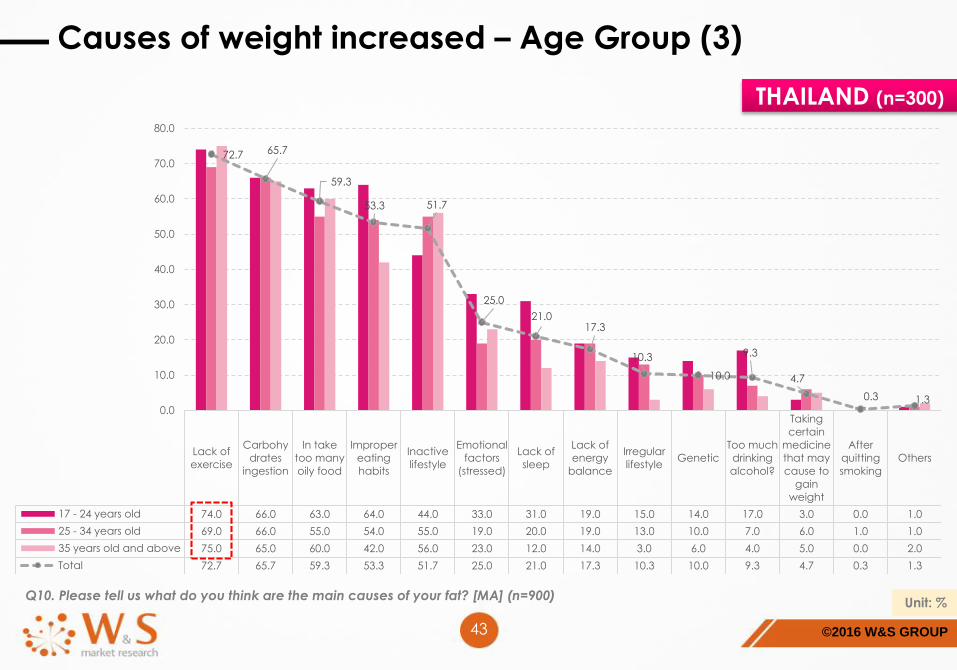
Q10. Please tell us what do you think are the main causes of your fat? [MA] (n=900) Unit: %
Causes of weight increased – Age Group (3)
Lack of
exercise
Carbohy
drates
ingestion
In take
too many
oily food
Improper
eating
habits
Inactive
lifestyle
Emotional
factors
(stressed)
Lack of
sleep
Lack of
energy
balance
Irregular
lifestyleGenetic
Too much
drinking
alcohol?
Taking
certain
medicine
that may
cause to
gain
weight
After
quitting
smoking
Others
17 - 24 years old 74.0 66.0 63.0 64.0 44.0 33.0 31.0 19.0 15.0 14.0 17.0 3.0 0.0 1.0
25 - 34 years old 69.0 66.0 55.0 54.0 55.0 19.0 20.0 19.0 13.0 10.0 7.0 6.0 1.0 1.0
35 years old and above 75.0 65.0 60.0 42.0 56.0 23.0 12.0 14.0 3.0 6.0 4.0 5.0 0.0 2.0
Total 72.7 65.7 59.3 53.3 51.7 25.0 21.0 17.3 10.3 10.0 9.3 4.7 0.3 1.3
72.7 65.7
59.3
53.3 51.7
25.0
21.017.3
10.3
10.0
9.3
4.7
0.3 1.30.0
10.0
20.0
30.0
40.0
50.0
60.0
70.0
80.0
THAILAND (n=300)
©2016 W&S GROUP44
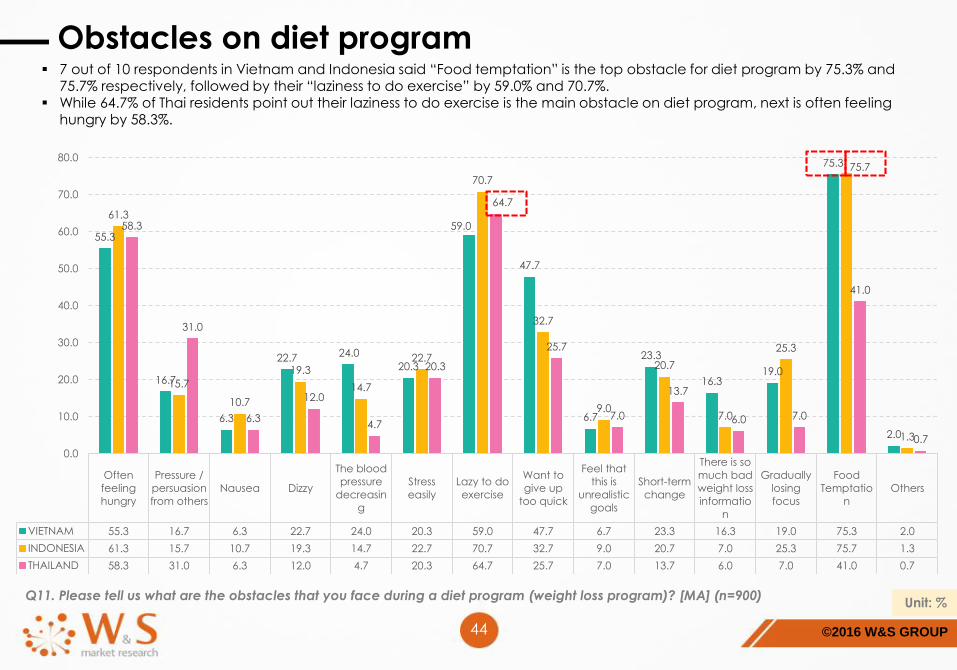
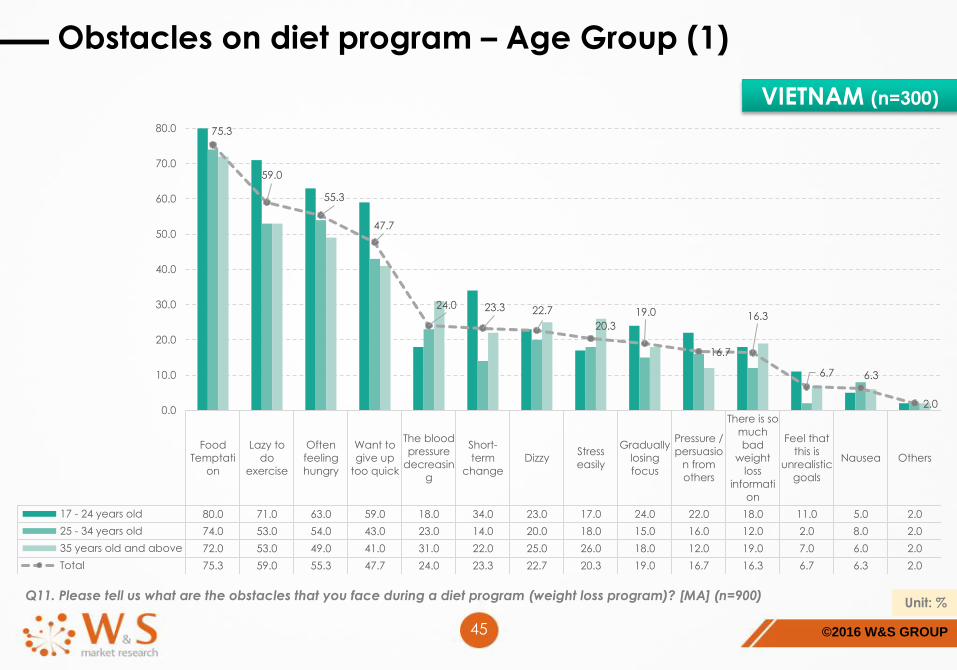
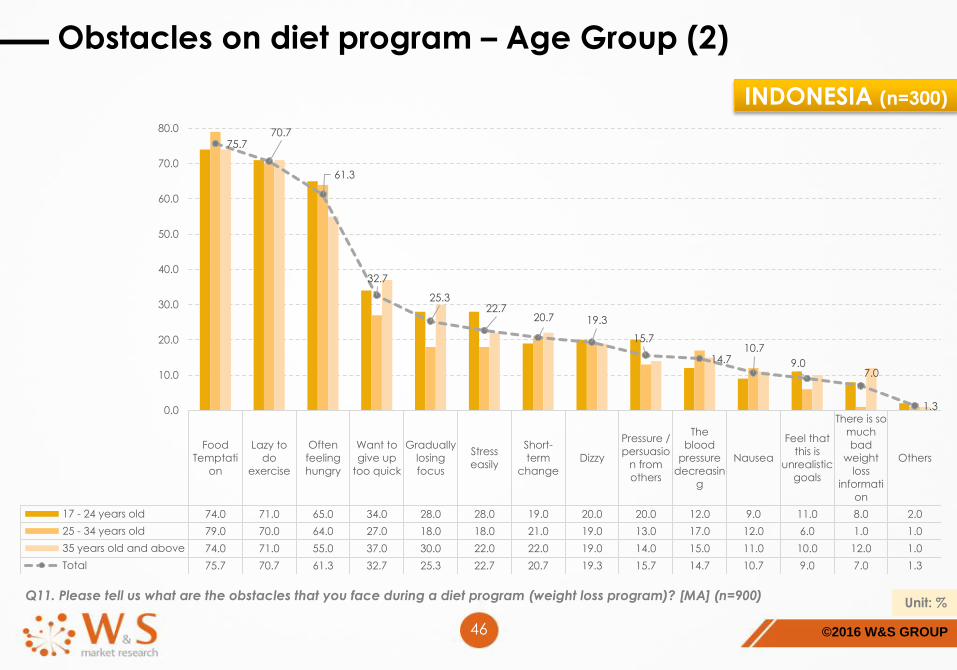
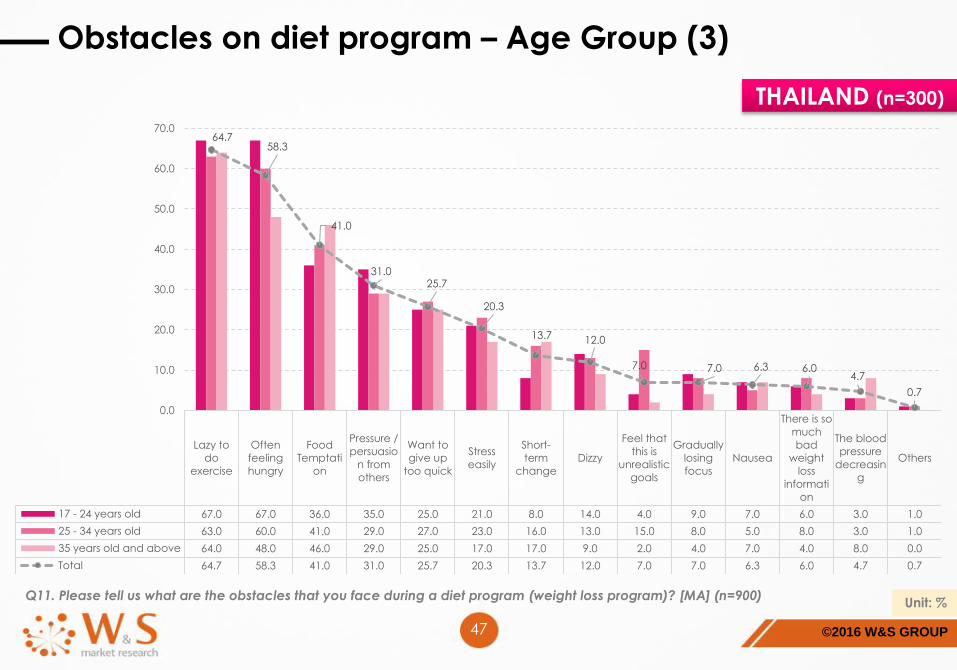
Q11. Please tell us what are the obstacles that you face during a diet program (weight loss program)? [MA] (n=900) Unit: %
Obstacles on diet program
Often
feeling
hungry
Pressure /
persuasion
from others
Nausea Dizzy
The blood
pressure
decreasin
g
Stress
easily
Lazy to do
exercise
Want to
give up
too quick
Feel that
this is
unrealistic
goals
Short-term
change
There is so
much bad
weight loss
informatio
n
Gradually
losing
focus
Food
Temptatio
n
Others
VIETNAM 55.3 16.7 6.3 22.7 24.0 20.3 59.0 47.7 6.7 23.3 16.3 19.0 75.3 2.0
INDONESIA 61.3 15.7 10.7 19.3 14.7 22.7 70.7 32.7 9.0 20.7 7.0 25.3 75.7 1.3
THAILAND 58.3 31.0 6.3 12.0 4.7 20.3 64.7 25.7 7.0 13.7 6.0 7.0 41.0 0.7
55.3
16.7
6.3
22.7 24.0
20.3
59.0
47.7
6.7
23.3
16.319.0
75.3
2.0
61.3
15.7
10.7
19.3
14.7
22.7
70.7
32.7
9.0
20.7
7.0
25.3
75.7
1.3
58.3
31.0
6.3
12.0
4.7
20.3
64.7
25.7
7.0
13.7
6.0 7.0
41.0
0.7
0.0
10.0
20.0
30.0
40.0
50.0
60.0
70.0
80.0
7 out of 10 respondents in Vietnam and Indonesia said “Food temptation” is the top obstacle for diet program by 75.3% and 75.7% respectively, followed by their “laziness to do exercise” by 59.0% and 70.7%.
While 64.7% of Thai residents point out their laziness to do exercise is the main obstacle on diet program, next is often feeling hungry by 58.3%.
©2016 W&S GROUP45
Q11. Please tell us what are the obstacles that you face during a diet program (weight loss program)? [MA] (n=900) Unit: %
Obstacles on diet program – Age Group (1)
Food
Temptati
on
Lazy to
do
exercise
Often
feeling
hungry
Want to
give up
too quick
The blood
pressure
decreasin
g
Short-
term
change
DizzyStress
easily
Gradually
losing
focus
Pressure /
persuasio
n from
others
There is so
much
bad
weight
loss
informati
on
Feel that
this is
unrealistic
goals
Nausea Others
17 - 24 years old 80.0 71.0 63.0 59.0 18.0 34.0 23.0 17.0 24.0 22.0 18.0 11.0 5.0 2.0
25 - 34 years old 74.0 53.0 54.0 43.0 23.0 14.0 20.0 18.0 15.0 16.0 12.0 2.0 8.0 2.0
35 years old and above 72.0 53.0 49.0 41.0 31.0 22.0 25.0 26.0 18.0 12.0 19.0 7.0 6.0 2.0
Total 75.3 59.0 55.3 47.7 24.0 23.3 22.7 20.3 19.0 16.7 16.3 6.7 6.3 2.0
75.3
59.0
55.3
47.7
24.0 23.3 22.7
20.3
19.0
16.7
16.3
6.7 6.3
2.00.0
10.0
20.0
30.0
40.0
50.0
60.0
70.0
80.0
VIETNAM (n=300)
©2016 W&S GROUP46
Q11. Please tell us what are the obstacles that you face during a diet program (weight loss program)? [MA] (n=900) Unit: %
Obstacles on diet program – Age Group (2)
Food
Temptati
on
Lazy to
do
exercise
Often
feeling
hungry
Want to
give up
too quick
Gradually
losing
focus
Stress
easily
Short-
term
change
Dizzy
Pressure /
persuasio
n from
others
The
blood
pressure
decreasin
g
Nausea
Feel that
this is
unrealistic
goals
There is so
much
bad
weight
loss
informati
on
Others
17 - 24 years old 74.0 71.0 65.0 34.0 28.0 28.0 19.0 20.0 20.0 12.0 9.0 11.0 8.0 2.0
25 - 34 years old 79.0 70.0 64.0 27.0 18.0 18.0 21.0 19.0 13.0 17.0 12.0 6.0 1.0 1.0
35 years old and above 74.0 71.0 55.0 37.0 30.0 22.0 22.0 19.0 14.0 15.0 11.0 10.0 12.0 1.0
Total 75.7 70.7 61.3 32.7 25.3 22.7 20.7 19.3 15.7 14.7 10.7 9.0 7.0 1.3
75.770.7
61.3
32.7
25.322.7
20.7 19.3
15.7
14.710.7
9.07.0
1.30.0
10.0
20.0
30.0
40.0
50.0
60.0
70.0
80.0
INDONESIA (n=300)
©2016 W&S GROUP47
Q11. Please tell us what are the obstacles that you face during a diet program (weight loss program)? [MA] (n=900) Unit: %
Obstacles on diet program – Age Group (3)
Lazy to
do
exercise
Often
feeling
hungry
Food
Temptati
on
Pressure /
persuasio
n from
others
Want to
give up
too quick
Stress
easily
Short-
term
change
Dizzy
Feel that
this is
unrealistic
goals
Gradually
losing
focus
Nausea
There is so
much
bad
weight
loss
informati
on
The blood
pressure
decreasin
g
Others
17 - 24 years old 67.0 67.0 36.0 35.0 25.0 21.0 8.0 14.0 4.0 9.0 7.0 6.0 3.0 1.0
25 - 34 years old 63.0 60.0 41.0 29.0 27.0 23.0 16.0 13.0 15.0 8.0 5.0 8.0 3.0 1.0
35 years old and above 64.0 48.0 46.0 29.0 25.0 17.0 17.0 9.0 2.0 4.0 7.0 4.0 8.0 0.0
Total 64.7 58.3 41.0 31.0 25.7 20.3 13.7 12.0 7.0 7.0 6.3 6.0 4.7 0.7
64.758.3
41.0
31.025.7
20.3
13.7 12.0
7.0 7.0 6.3 6.04.7
0.7
0.0
10.0
20.0
30.0
40.0
50.0
60.0
70.0
THAILAND (n=300)

©2016 W&S GROUP48
F. Detail findings
1. Ways to take care of Health
2. Diet Behaviors
3. Satisfied and Dissatisfied reasons toward Diet Results
4. Sources of Information about Diet
5. Exercise Behaviors
©2016 W&S GROUP49
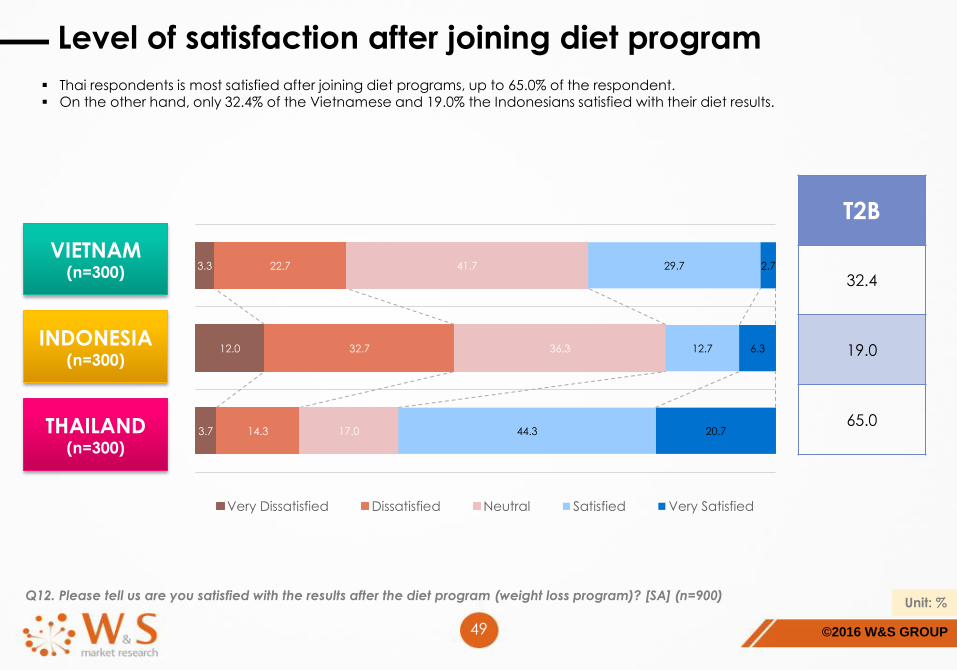
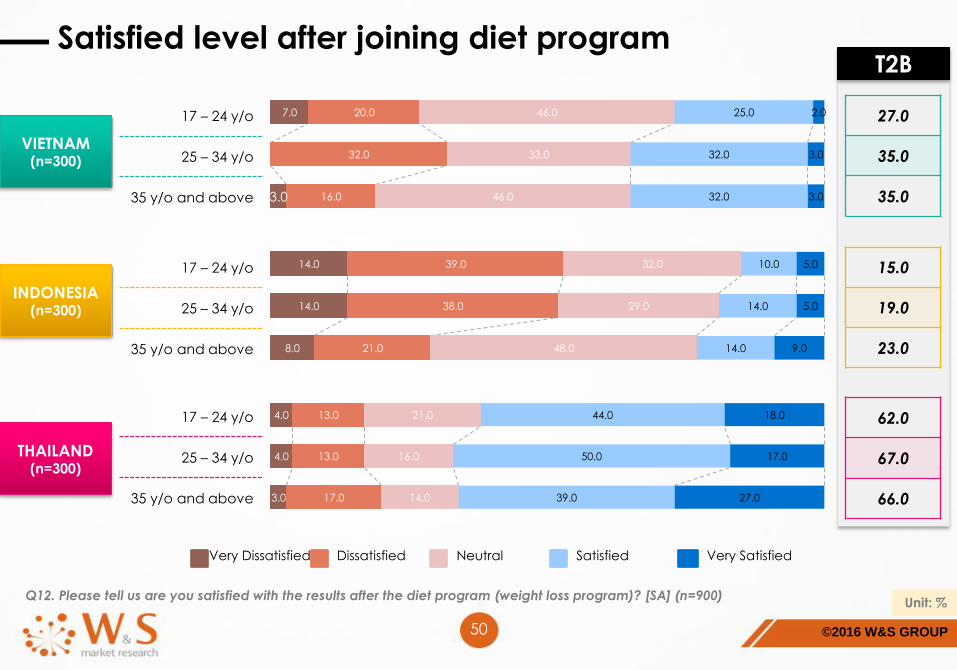
Q12. Please tell us are you satisfied with the results after the diet program (weight loss program)? [SA] (n=900) Unit: %
Level of satisfaction after joining diet program
3.3
12.0
3.7
22.7
32.7
14.3
41.7
36.3
17.0
29.7
12.7
44.3
2.7
6.3
20.7
Very Dissatisfied Dissatisfied Neutral Satisfied Very Satisfied
T2B
32.4
19.0
65.0
VIETNAM (n=300)
INDONESIA (n=300)
THAILAND (n=300)
Thai respondents is most satisfied after joining diet programs, up to 65.0% of the respondent. On the other hand, only 32.4% of the Vietnamese and 19.0% the Indonesians satisfied with their diet results.
©2016 W&S GROUP50
Q12. Please tell us are you satisfied with the results after the diet program (weight loss program)? [SA] (n=900) Unit: %
Satisfied level after joining diet program
7.0
3.0
20.0
32.0
16.0
46.0
33.0
46.0
25.0
32.0
32.0
2.0
3.0
3.0
14.0
14.0
8.0
39.0
38.0
21.0
32.0
29.0
48.0
10.0
14.0
14.0
5.0
5.0
9.0
4.0
4.0
3.0
13.0
13.0
17.0
21.0
16.0
14.0
44.0
50.0
39.0
18.0
17.0
27.0
15.0
19.0
23.0
27.0
35.0
35.0
62.0
67.0
66.0
VIETNAM (n=300)
INDONESIA (n=300)
THAILAND (n=300)
17 – 24 y/o
25 – 34 y/o
35 y/o and above
17 – 24 y/o
25 – 34 y/o
35 y/o and above
17 – 24 y/o
25 – 34 y/o
35 y/o and above
Very Dissatisfied Dissatisfied Neutral Satisfied Very Satisfied
T2B
©2016 W&S GROUP51
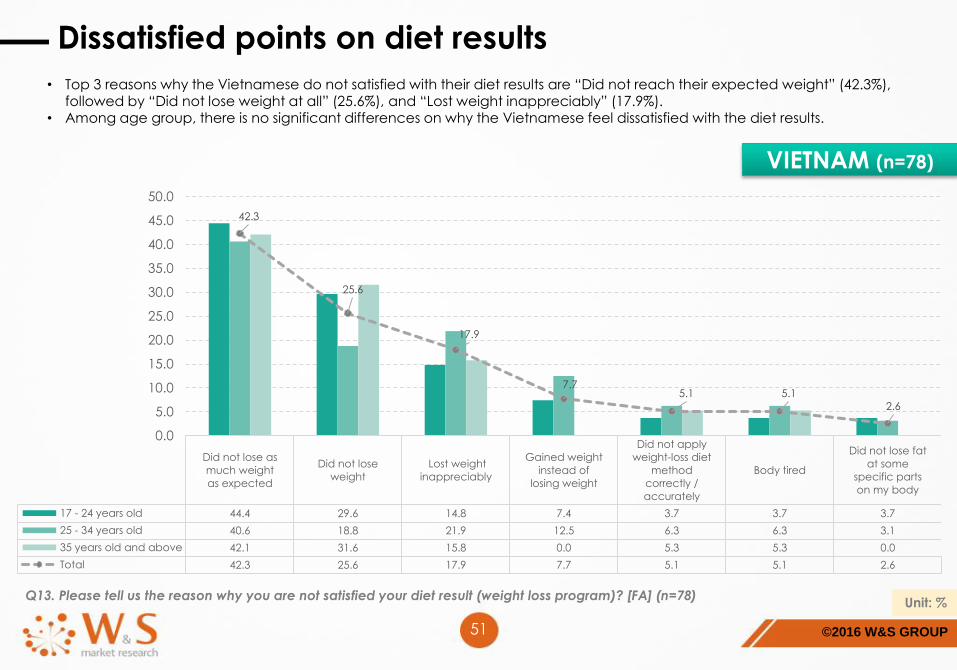
Q13. Please tell us the reason why you are not satisfied your diet result (weight loss program)? [FA] (n=78) Unit: %
Dissatisfied points on diet results
Did not lose as
much weight
as expected
Did not lose
weight
Lost weight
inappreciably
Gained weight
instead of
losing weight
Did not apply
weight-loss diet
method
correctly /
accurately
Body tired
Did not lose fat
at some
specific parts
on my body
17 - 24 years old 44.4 29.6 14.8 7.4 3.7 3.7 3.7
25 - 34 years old 40.6 18.8 21.9 12.5 6.3 6.3 3.1
35 years old and above 42.1 31.6 15.8 0.0 5.3 5.3 0.0
Total 42.3 25.6 17.9 7.7 5.1 5.1 2.6
42.3
25.6
17.9
7.75.1 5.1
2.6
0.0
5.0
10.0
15.0
20.0
25.0
30.0
35.0
40.0
45.0
50.0
VIETNAM (n=78)
• Top 3 reasons why the Vietnamese do not satisfied with their diet results are “Did not reach their expected weight” (42.3%), followed by “Did not lose weight at all” (25.6%), and “Lost weight inappreciably” (17.9%).
• Among age group, there is no significant differences on why the Vietnamese feel dissatisfied with the diet results.
©2016 W&S GROUP52
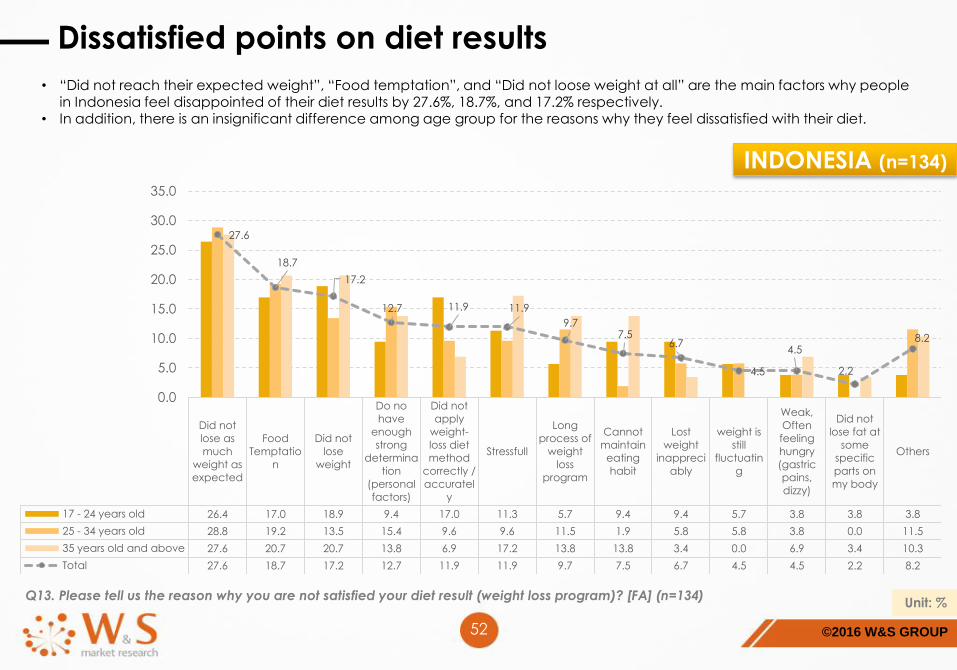
Q13. Please tell us the reason why you are not satisfied your diet result (weight loss program)? [FA] (n=134) Unit: %
Dissatisfied points on diet results
Did not
lose as
much
weight as
expected
Food
Temptatio
n
Did not
lose
weight
Do no
have
enough
strong
determina
tion
(personal
factors)
Did not
apply
weight-
loss diet
method
correctly /
accuratel
y
Stressfull
Long
process of
weight
loss
program
Cannot
maintain
eating
habit
Lost
weight
inappreci
ably
weight is
still
fluctuatin
g
Weak,
Often
feeling
hungry
(gastric
pains,
dizzy)
Did not
lose fat at
some
specific
parts on
my body
Others
17 - 24 years old 26.4 17.0 18.9 9.4 17.0 11.3 5.7 9.4 9.4 5.7 3.8 3.8 3.8
25 - 34 years old 28.8 19.2 13.5 15.4 9.6 9.6 11.5 1.9 5.8 5.8 3.8 0.0 11.5
35 years old and above 27.6 20.7 20.7 13.8 6.9 17.2 13.8 13.8 3.4 0.0 6.9 3.4 10.3
Total 27.6 18.7 17.2 12.7 11.9 11.9 9.7 7.5 6.7 4.5 4.5 2.2 8.2
27.6
18.7
17.2
12.7 11.9 11.9
9.77.5
6.7
4.5
4.5
2.2
8.2
0.0
5.0
10.0
15.0
20.0
25.0
30.0
35.0
INDONESIA (n=134)
• “Did not reach their expected weight”, “Food temptation”, and “Did not loose weight at all” are the main factors why people in Indonesia feel disappointed of their diet results by 27.6%, 18.7%, and 17.2% respectively.
• In addition, there is an insignificant difference among age group for the reasons why they feel dissatisfied with their diet.
©2016 W&S GROUP53
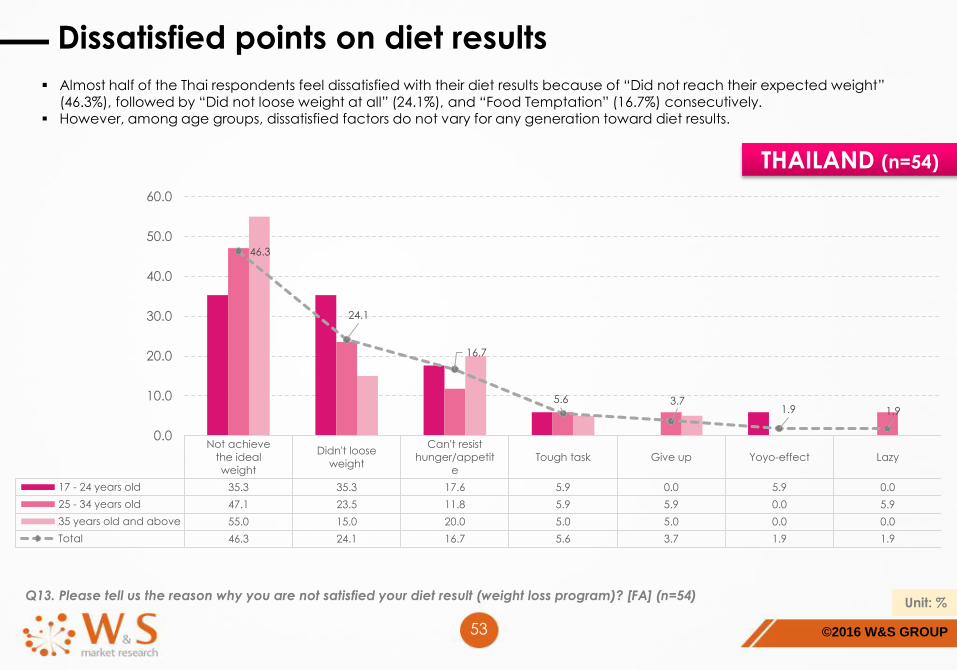
Q13. Please tell us the reason why you are not satisfied your diet result (weight loss program)? [FA] (n=54) Unit: %
Dissatisfied points on diet results
Not achieve
the ideal
weight
Didn't loose
weight
Can't resist
hunger/appetit
e
Tough task Give up Yoyo-effect Lazy
17 - 24 years old 35.3 35.3 17.6 5.9 0.0 5.9 0.0
25 - 34 years old 47.1 23.5 11.8 5.9 5.9 0.0 5.9
35 years old and above 55.0 15.0 20.0 5.0 5.0 0.0 0.0
Total 46.3 24.1 16.7 5.6 3.7 1.9 1.9
46.3
24.1
16.7
5.6 3.71.9 1.9
0.0
10.0
20.0
30.0
40.0
50.0
60.0
THAILAND (n=54)
Almost half of the Thai respondents feel dissatisfied with their diet results because of “Did not reach their expected weight” (46.3%), followed by “Did not loose weight at all” (24.1%), and “Food Temptation” (16.7%) consecutively.
However, among age groups, dissatisfied factors do not vary for any generation toward diet results.

©2016 W&S GROUP54
F. Detail findings
1. Ways to take care of Health
2. Diet Behaviors
3. Satisfied and Dissatisfied reasons toward Diet Results
4. Sources of Information about Diet
5. Exercise Behaviors
©2016 W&S GROUP55
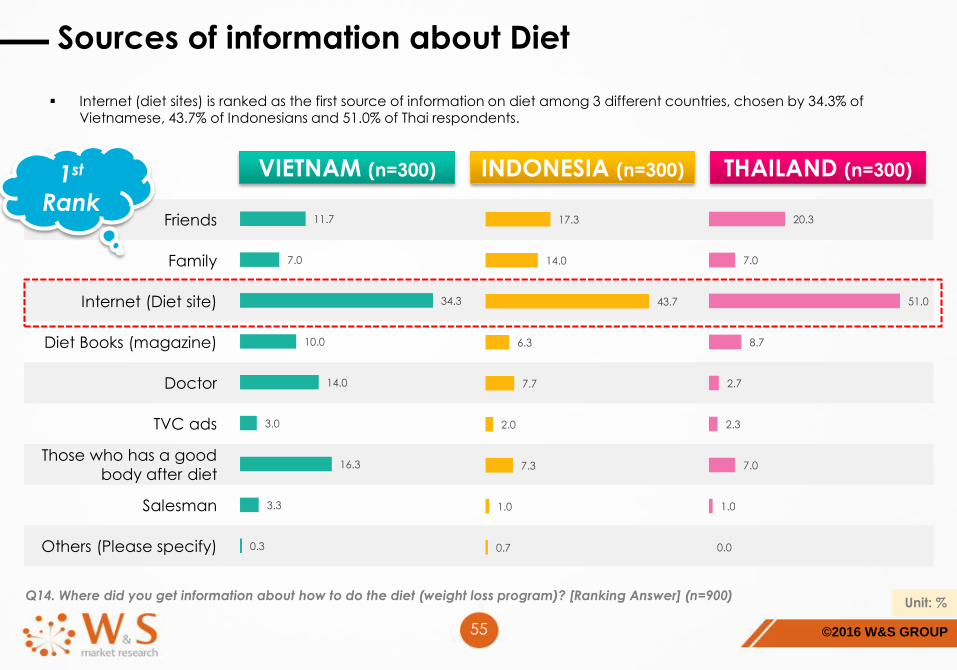
Q14. Where did you get information about how to do the diet (weight loss program)? [Ranking Answer] (n=900) Unit: %
Sources of information about Diet
Friends
Family
Internet (Diet site)
Diet Books (magazine)
Doctor
TVC ads
Those who has a good
body after diet
Salesman
Others (Please specify)
VIETNAM (n=300) INDONESIA (n=300) THAILAND (n=300)
20.3
7.0
51.0
8.7
2.7
2.3
7.0
1.0
0.0
11.7
7.0
34.3
10.0
14.0
3.0
16.3
3.3
0.3
17.3
14.0
43.7
6.3
7.7
2.0
7.3
1.0
0.7
1st
Rank
Internet (diet sites) is ranked as the first source of information on diet among 3 different countries, chosen by 34.3% of Vietnamese, 43.7% of Indonesians and 51.0% of Thai respondents.
©2016 W&S GROUP56
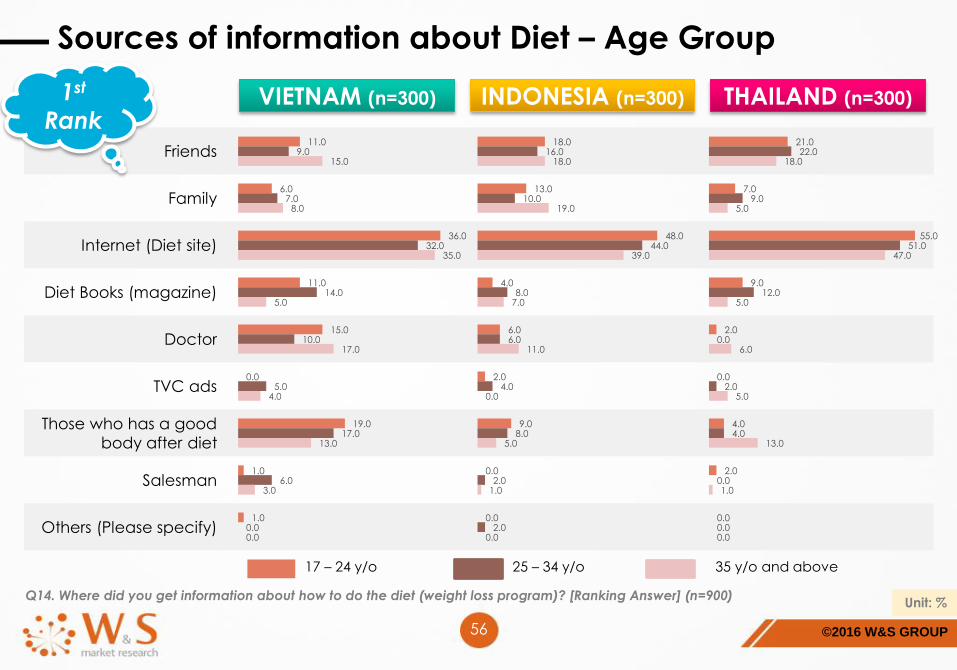
Q14. Where did you get information about how to do the diet (weight loss program)? [Ranking Answer] (n=900) Unit: %
Sources of information about Diet – Age Group
Friends
Family
Internet (Diet site)
Diet Books (magazine)
Doctor
TVC ads
Those who has a good
body after diet
Salesman
Others (Please specify)
VIETNAM (n=300) INDONESIA (n=300) THAILAND (n=300)1st
Rank
17 – 24 y/o 25 – 34 y/o 35 y/o and above
11.0
6.0
36.0
11.0
15.0
0.0
19.0
1.0
1.0
9.0
7.0
32.0
14.0
10.0
5.0
17.0
6.0
0.0
15.0
8.0
35.0
5.0
17.0
4.0
13.0
3.0
0.0
18.0
13.0
48.0
4.0
6.0
2.0
9.0
0.0
0.0
16.0
10.0
44.0
8.0
6.0
4.0
8.0
2.0
2.0
18.0
19.0
39.0
7.0
11.0
0.0
5.0
1.0
0.0
21.0
7.0
55.0
9.0
2.0
0.0
4.0
2.0
0.0
22.0
9.0
51.0
12.0
0.0
2.0
4.0
0.0
0.0
18.0
5.0
47.0
5.0
6.0
5.0
13.0
1.0
0.0
©2016 W&S GROUP57
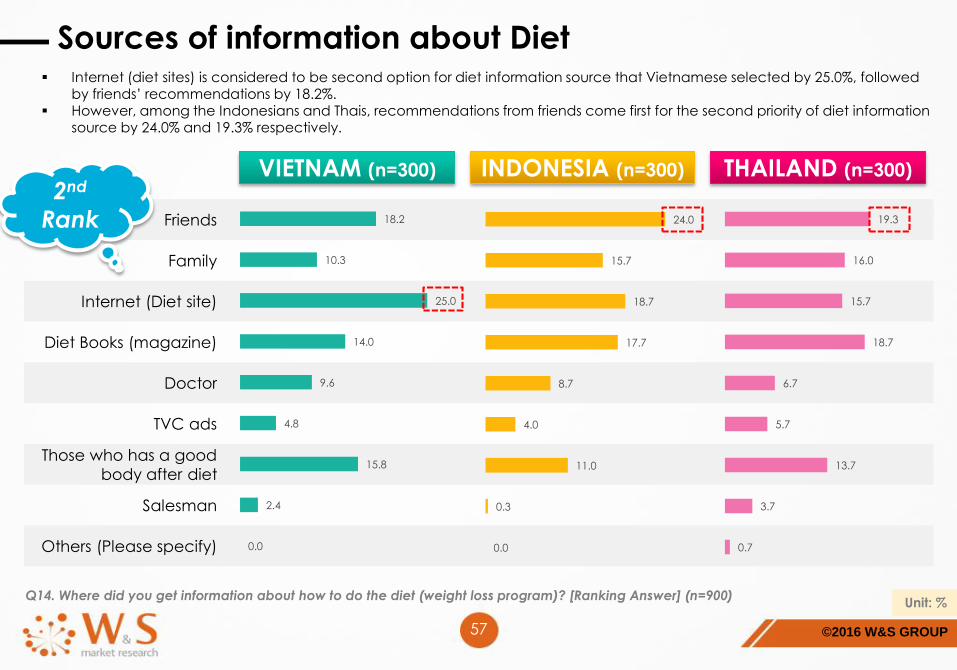
Q14. Where did you get information about how to do the diet (weight loss program)? [Ranking Answer] (n=900) Unit: %
Sources of information about Diet
Friends
Family
Internet (Diet site)
Diet Books (magazine)
Doctor
TVC ads
Those who has a good
body after diet
Salesman
Others (Please specify)
VIETNAM (n=300) INDONESIA (n=300) THAILAND (n=300)
2nd
Rank 19.3
16.0
15.7
18.7
6.7
5.7
13.7
3.7
0.7
18.2
10.3
25.0
14.0
9.6
4.8
15.8
2.4
0.0
24.0
15.7
18.7
17.7
8.7
4.0
11.0
0.3
0.0
Internet (diet sites) is considered to be second option for diet information source that Vietnamese selected by 25.0%, followed by friends’ recommendations by 18.2%.
However, among the Indonesians and Thais, recommendations from friends come first for the second priority of diet informationsource by 24.0% and 19.3% respectively.
©2016 W&S GROUP58
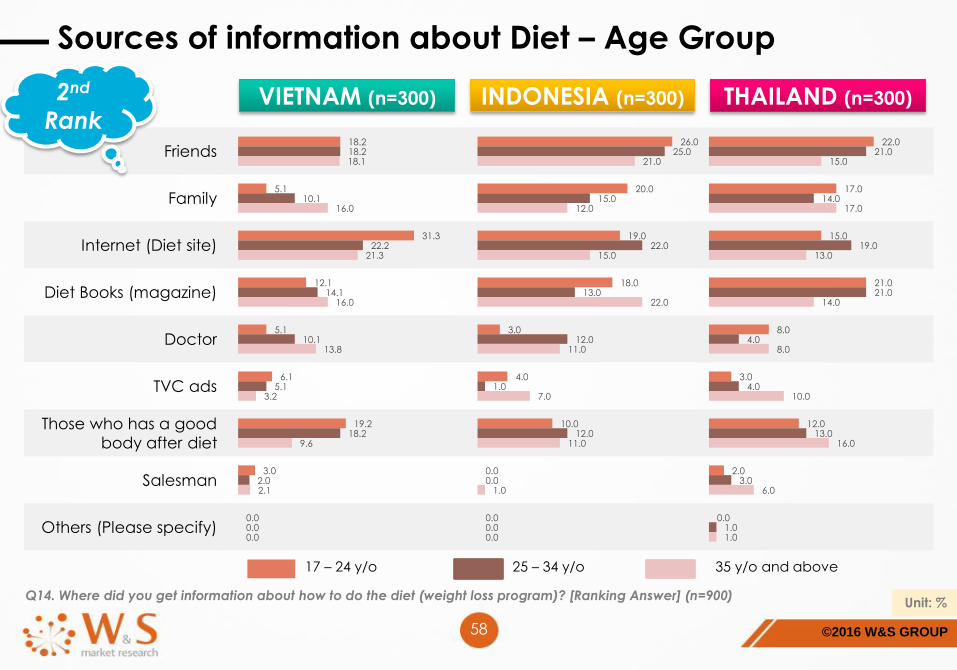
Q14. Where did you get information about how to do the diet (weight loss program)? [Ranking Answer] (n=900) Unit: %
Sources of information about Diet – Age Group
Friends
Family
Internet (Diet site)
Diet Books (magazine)
Doctor
TVC ads
Those who has a good
body after diet
Salesman
Others (Please specify)
VIETNAM (n=300) INDONESIA (n=300) THAILAND (n=300)2nd
Rank
17 – 24 y/o 25 – 34 y/o 35 y/o and above
18.2
5.1
31.3
12.1
5.1
6.1
19.2
3.0
0.0
18.2
10.1
22.2
14.1
10.1
5.1
18.2
2.0
0.0
18.1
16.0
21.3
16.0
13.8
3.2
9.6
2.1
0.0
26.0
20.0
19.0
18.0
3.0
4.0
10.0
0.0
0.0
25.0
15.0
22.0
13.0
12.0
1.0
12.0
0.0
0.0
21.0
12.0
15.0
22.0
11.0
7.0
11.0
1.0
0.0
22.0
17.0
15.0
21.0
8.0
3.0
12.0
2.0
0.0
21.0
14.0
19.0
21.0
4.0
4.0
13.0
3.0
1.0
15.0
17.0
13.0
14.0
8.0
10.0
16.0
6.0
1.0
©2016 W&S GROUP59
Q14. Where did you get information about how to do the diet (weight loss program)? [Ranking Answer] (n=900) Unit: %
Sources of information about Diet
Friends
Family
Internet (Diet site)
Diet Books (magazine)
Doctor
TVC ads
Those who has a good
body after diet
Salesman
Others (Please specify)
VIETNAM (n=300) INDONESIA (n=300) THAILAND (n=300)
17.3
13.7
17.3
10.7
6.0
11.7
14.7
5.0
3.7
19.6
10.7
17.5
12.5
12.9
7.5
16.1
2.5
0.7
15.0
11.3
14.7
16.3
6.7
10.3
22.0
2.7
1.0
3rd
Rank
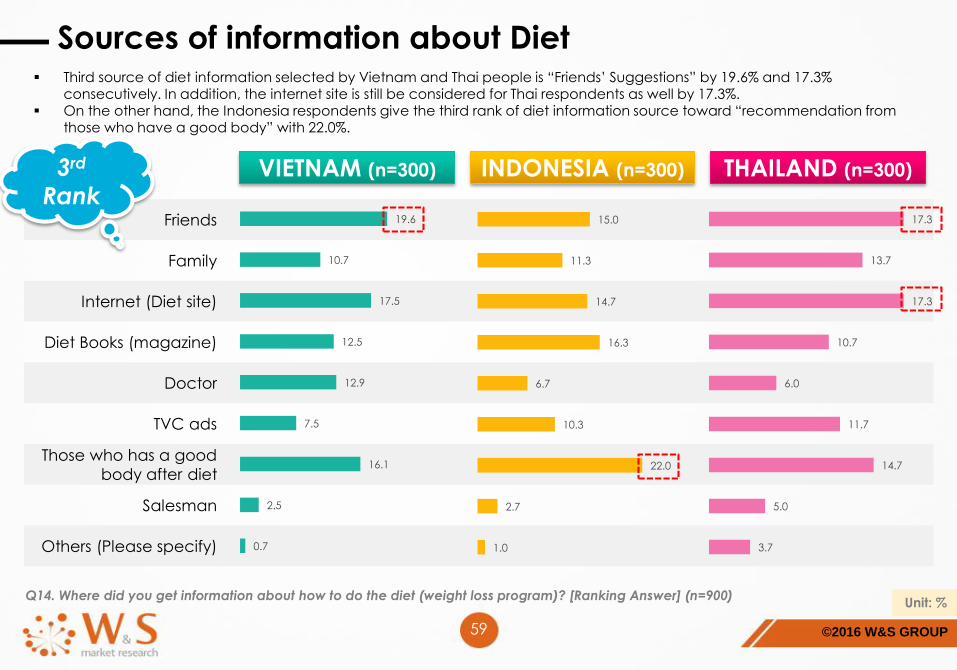
Third source of diet information selected by Vietnam and Thai people is “Friends’ Suggestions” by 19.6% and 17.3% consecutively. In addition, the internet site is still be considered for Thai respondents as well by 17.3%.
On the other hand, the Indonesia respondents give the third rank of diet information source toward “recommendation from those who have a good body” with 22.0%.

©2016 W&S GROUP60
Q14. Where did you get information about how to do the diet (weight loss program)? [Ranking Answer] (n=900) Unit: %
Sources of information about Diet – Age Group
Friends
Family
Internet (Diet site)
Diet Books (magazine)
Doctor
TVC ads
Those who has a good
body after diet
Salesman
Others (Please specify)
VIETNAM (n=300) INDONESIA (n=300) THAILAND (n=300)3rd
Rank
17 – 24 y/o 25 – 34 y/o 35 y/o and above
19.1
12.8
13.8
13.8
10.6
8.5
18.1
1.1
2.1
14.9
8.5
19.1
12.8
13.8
6.4
20.2
4.3
0.0
25.0
10.9
19.6
10.9
14.1
7.6
9.8
2.2
0.0
21.0
7.0
16.0
15.0
7.0
10.0
20.0
1.0
3.0
13.0
16.0
19.0
16.0
6.0
6.0
20.0
4.0
0.0
11.0
11.0
9.0
18.0
7.0
15.0
26.0
3.0
0.0
17.0
17.0
15.0
10.0
8.0
11.0
14.0
5.0
3.0
17.0
9.0
16.0
14.0
5.0
14.0
17.0
3.0
5.0
18.0
15.0
21.0
8.0
5.0
10.0
13.0
7.0
3.0
©2016 W&S GROUP61
F. Detail findings
1. Ways to take care of Health
2. Diet Behaviors
3. Satisfied and Dissatisfied reasons toward Diet Results
4. Sources of Information about Diet
5. Exercise Behaviors
©2016 W&S GROUP62
Q15. Please tell us how often do you exercise in one month? [SA] (n=900) Unit: %
Frequency on Exercise
Never Rarely 1-2 days per month 1-2 days per week 3-5 days per week 6-7 days per week
VIETNAM 0.3 12.0 8.3 27.0 33.3 19.0
INDONESIA 4.0 24.7 20.3 36.3 13.0 1.7
THAILAND 1.3 18.3 22.7 33.0 22.0 2.7
0.3
12.0
8.3
27.0
33.3
19.0
4.0
24.7
20.3
36.3
13.0
1.71.3
18.3
22.7
33.0
22.0
2.7
0.0
5.0
10.0
15.0
20.0
25.0
30.0
35.0
40.0
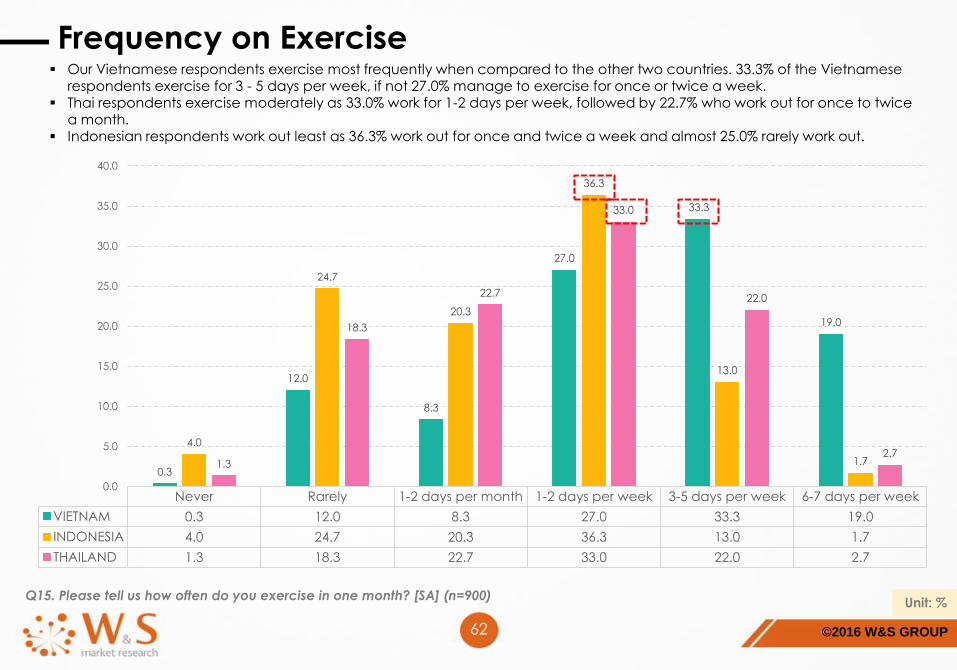
Our Vietnamese respondents exercise most frequently when compared to the other two countries. 33.3% of the Vietnamese respondents exercise for 3 - 5 days per week, if not 27.0% manage to exercise for once or twice a week.
Thai respondents exercise moderately as 33.0% work for 1-2 days per week, followed by 22.7% who work out for once to twice a month.
Indonesian respondents work out least as 36.3% work out for once and twice a week and almost 25.0% rarely work out.
©2016 W&S GROUP63
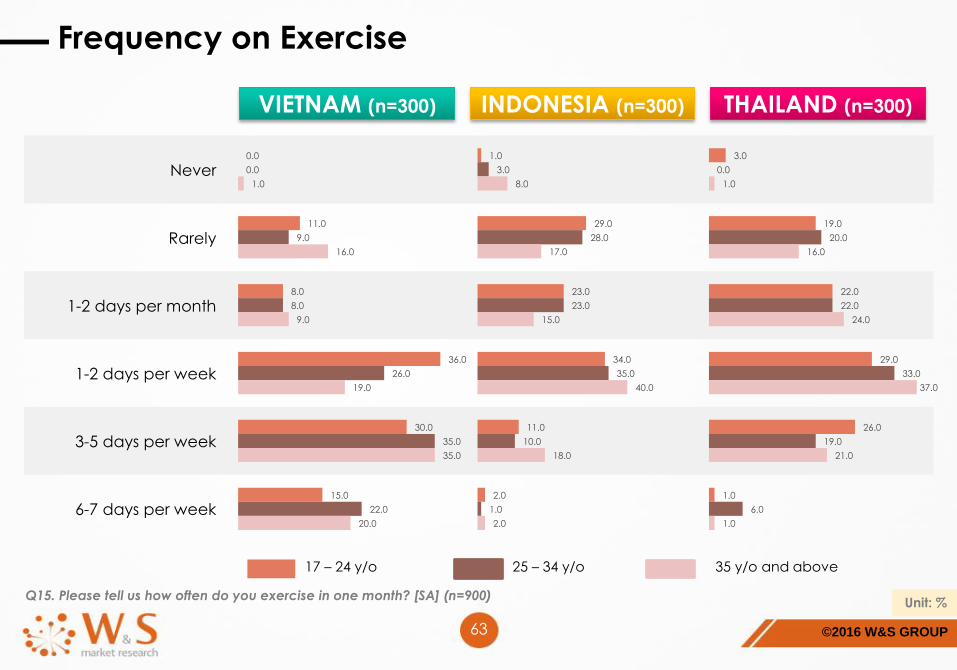
Q15. Please tell us how often do you exercise in one month? [SA] (n=900) Unit: %
Frequency on Exercise
Never
Rarely
1-2 days per month
1-2 days per week
3-5 days per week
6-7 days per week
VIETNAM (n=300) INDONESIA (n=300) THAILAND (n=300)
17 – 24 y/o 25 – 34 y/o 35 y/o and above
0.0
11.0
8.0
36.0
30.0
15.0
0.0
9.0
8.0
26.0
35.0
22.0
1.0
16.0
9.0
19.0
35.0
20.0
1.0
29.0
23.0
34.0
11.0
2.0
3.0
28.0
23.0
35.0
10.0
1.0
8.0
17.0
15.0
40.0
18.0
2.0
3.0
19.0
22.0
29.0
26.0
1.0
0.0
20.0
22.0
33.0
19.0
6.0
1.0
16.0
24.0
37.0
21.0
1.0

©2016 W&S GROUP64
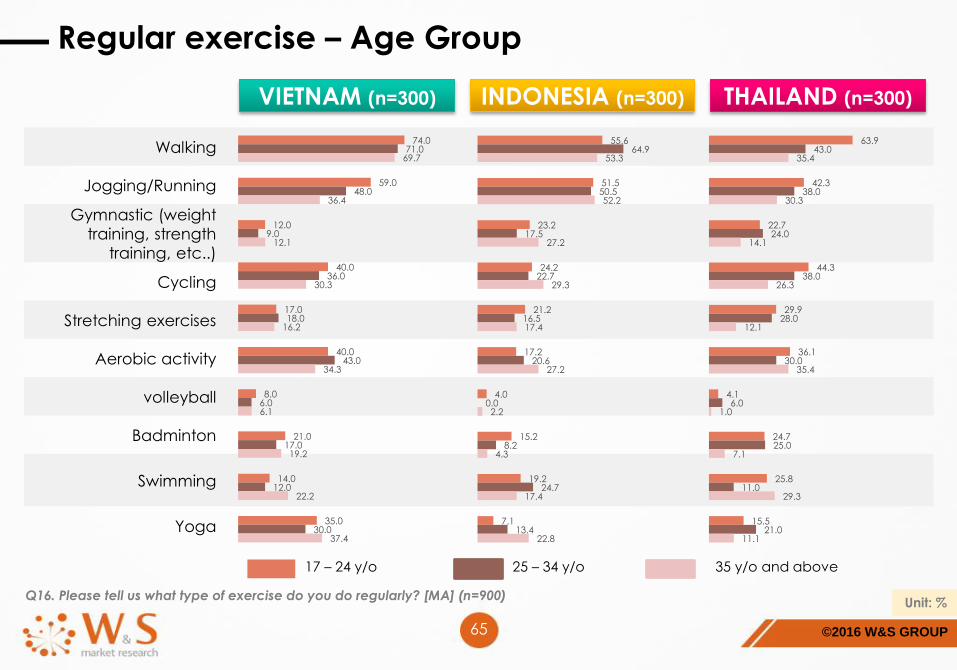
Q16. Please tell us what type of exercise do you do regularly? [MA] (n=900) Unit: %
Regular exercises
WalkingJogging/R
unning
Gymnasti
c (weight
training,
strength
training,
etc..)
CyclingStretching
exercises
Aerobic
activitygolf Tennis volleyball
Badminto
nSwimming Yoga Boxing Others
VIETNAM 71.6 47.8 11.0 35.5 17.1 39.1 1.0 4.0 6.7 19.1 16.1 34.1 1.0 5.0
INDONESIA 58.0 51.4 22.6 25.3 18.4 21.5 1.0 1.7 2.1 9.4 20.5 14.2 0.0 1.4
THAILAND 47.3 36.8 20.3 36.1 23.3 33.8 0.3 2.0 3.7 18.9 22.0 15.9 1.4 2.7
71.6
47.8
11.0
35.5
17.1
39.1
1.04.0
6.7
19.116.1
34.1
1.0
5.0
58.0
51.4
22.625.3
18.421.5
1.0 1.7 2.1
9.4
20.5
14.2
0.0 1.4
47.3
36.8
20.3
36.1
23.3
33.8
0.32.0
3.7
18.922.0
15.9
1.4 2.7
0.0
10.0
20.0
30.0
40.0
50.0
60.0
70.0
80.0
“Walking” is the most regular physical exercise among the surveyed respondents in Vietnam, Indonesia and Thailand, with 71.6%, 58.0% and 47.3% respectively. Meanwhile, “Jogging/Running” ranks second in those countries.
Moreover, sports such as “Volleyball”, “Tennis”, “Golf”, and “Boxing” have lower levels of popularity.
©2016 W&S GROUP65
Q16. Please tell us what type of exercise do you do regularly? [MA] (n=900) Unit: %
Regular exercise – Age Group
Walking
Jogging/Running
Gymnastic (weight
training, strength
training, etc..)
Cycling
Stretching exercises
Aerobic activity
volleyball
Badminton
Swimming
Yoga
VIETNAM (n=300) INDONESIA (n=300) THAILAND (n=300)
17 – 24 y/o 25 – 34 y/o 35 y/o and above
74.0
59.0
12.0
40.0
17.0
40.0
8.0
21.0
14.0
35.0
71.0
48.0
9.0
36.0
18.0
43.0
6.0
17.0
12.0
30.0
69.7
36.4
12.1
30.3
16.2
34.3
6.1
19.2
22.2
37.4
55.6
51.5
23.2
24.2
21.2
17.2
4.0
15.2
19.2
7.1
64.9
50.5
17.5
22.7
16.5
20.6
0.0
8.2
24.7
13.4
53.3
52.2
27.2
29.3
17.4
27.2
2.2
4.3
17.4
22.8
63.9
42.3
22.7
44.3
29.9
36.1
4.1
24.7
25.8
15.5
43.0
38.0
24.0
38.0
28.0
30.0
6.0
25.0
11.0
21.0
35.4
30.3
14.1
26.3
12.1
35.4
1.0
7.1
29.3
11.1
©2016 W&S GROUP66
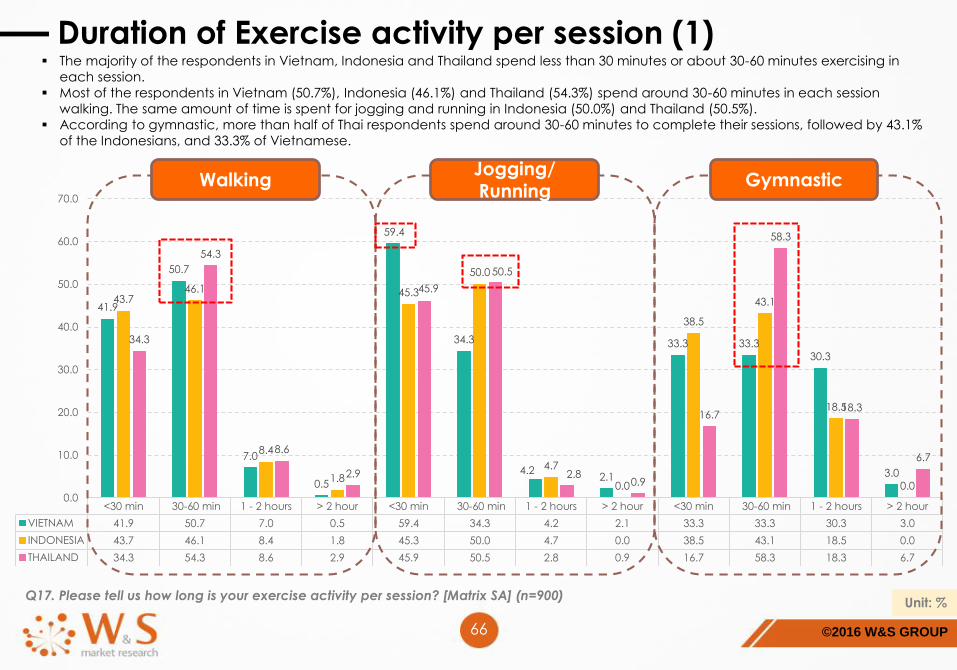
Q17. Please tell us how long is your exercise activity per session? [Matrix SA] (n=900) Unit: %
Duration of Exercise activity per session (1)
<30 min 30-60 min 1 - 2 hours > 2 hour <30 min 30-60 min 1 - 2 hours > 2 hour <30 min 30-60 min 1 - 2 hours > 2 hour
VIETNAM 41.9 50.7 7.0 0.5 59.4 34.3 4.2 2.1 33.3 33.3 30.3 3.0
INDONESIA 43.7 46.1 8.4 1.8 45.3 50.0 4.7 0.0 38.5 43.1 18.5 0.0
THAILAND 34.3 54.3 8.6 2.9 45.9 50.5 2.8 0.9 16.7 58.3 18.3 6.7
41.9
50.7
7.0
0.5
59.4
34.3
4.22.1
33.3 33.3
30.3
3.0
43.746.1
8.4
1.8
45.3
50.0
4.7
0.0
38.5
43.1
18.5
0.0
34.3
54.3
8.6
2.9
45.9
50.5
2.80.9
16.7
58.3
18.3
6.7
0.0
10.0
20.0
30.0
40.0
50.0
60.0
70.0
The majority of the respondents in Vietnam, Indonesia and Thailand spend less than 30 minutes or about 30-60 minutes exercising in
each session.
Most of the respondents in Vietnam (50.7%), Indonesia (46.1%) and Thailand (54.3%) spend around 30-60 minutes in each session
walking. The same amount of time is spent for jogging and running in Indonesia (50.0%) and Thailand (50.5%).
According to gymnastic, more than half of Thai respondents spend around 30-60 minutes to complete their sessions, followed by 43.1%
of the Indonesians, and 33.3% of Vietnamese.
WalkingJogging/Running
Gymnastic
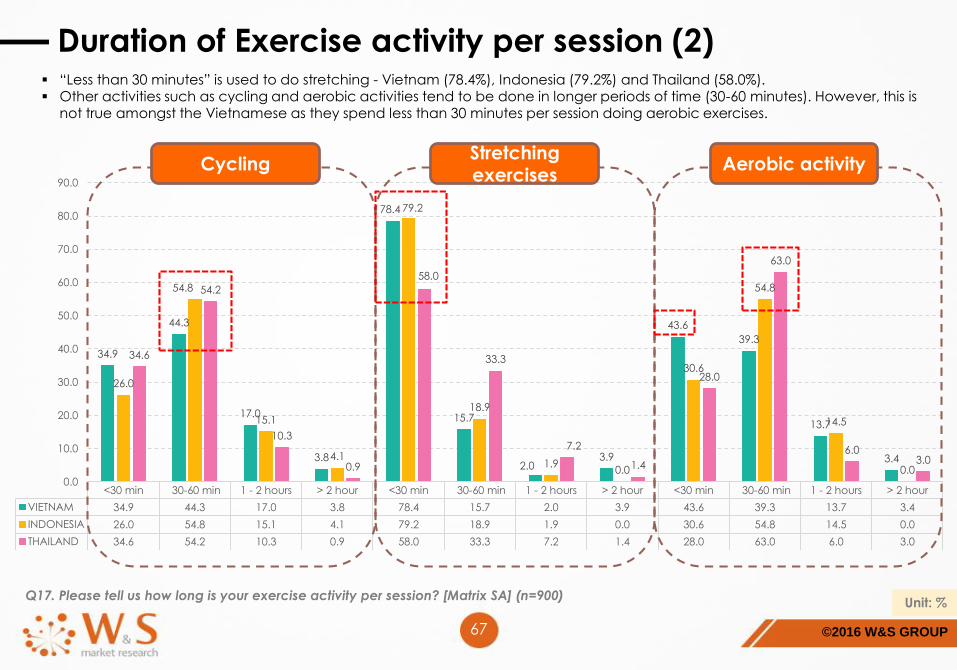
©2016 W&S GROUP67
Q17. Please tell us how long is your exercise activity per session? [Matrix SA] (n=900) Unit: %
Duration of Exercise activity per session (2)
<30 min 30-60 min 1 - 2 hours > 2 hour <30 min 30-60 min 1 - 2 hours > 2 hour <30 min 30-60 min 1 - 2 hours > 2 hour
VIETNAM 34.9 44.3 17.0 3.8 78.4 15.7 2.0 3.9 43.6 39.3 13.7 3.4
INDONESIA 26.0 54.8 15.1 4.1 79.2 18.9 1.9 0.0 30.6 54.8 14.5 0.0
THAILAND 34.6 54.2 10.3 0.9 58.0 33.3 7.2 1.4 28.0 63.0 6.0 3.0
34.9
44.3
17.0
3.8
78.4
15.7
2.03.9
43.6
39.3
13.7
3.4
26.0
54.8
15.1
4.1
79.2
18.9
1.90.0
30.6
54.8
14.5
0.0
34.6
54.2
10.3
0.9
58.0
33.3
7.2
1.4
28.0
63.0
6.03.0
0.0
10.0
20.0
30.0
40.0
50.0
60.0
70.0
80.0
90.0
“Less than 30 minutes” is used to do stretching - Vietnam (78.4%), Indonesia (79.2%) and Thailand (58.0%). Other activities such as cycling and aerobic activities tend to be done in longer periods of time (30-60 minutes). However, this is
not true amongst the Vietnamese as they spend less than 30 minutes per session doing aerobic exercises.
CyclingStretching exercises
Aerobic activity
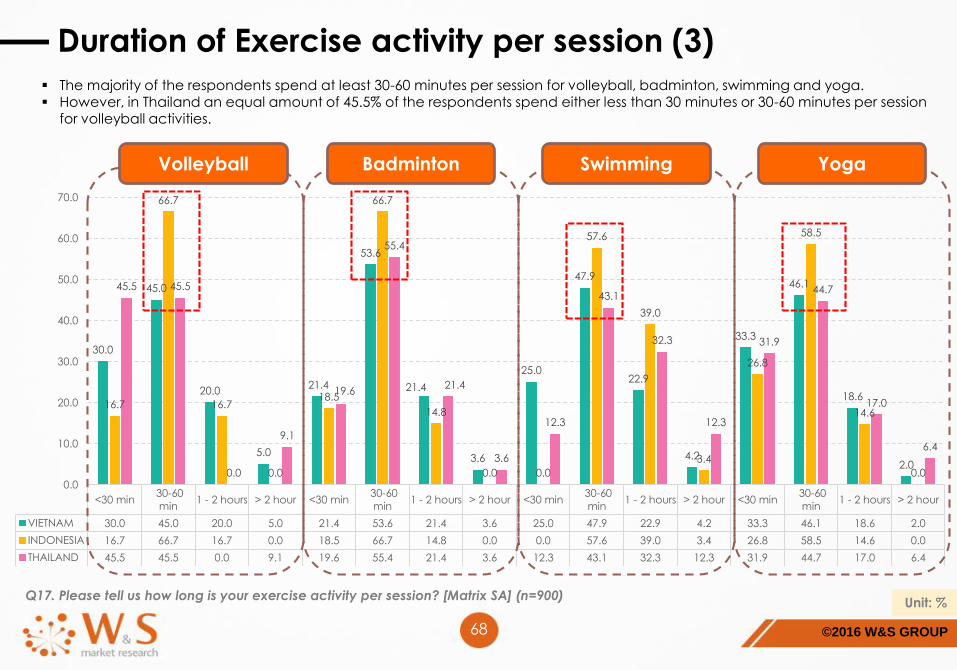
©2016 W&S GROUP68
Q17. Please tell us how long is your exercise activity per session? [Matrix SA] (n=900) Unit: %
Duration of Exercise activity per session (3)
<30 min 30-60
min1 - 2 hours > 2 hour <30 min
30-60
min1 - 2 hours > 2 hour <30 min
30-60
min1 - 2 hours > 2 hour <30 min
30-60
min1 - 2 hours > 2 hour
VIETNAM 30.0 45.0 20.0 5.0 21.4 53.6 21.4 3.6 25.0 47.9 22.9 4.2 33.3 46.1 18.6 2.0
INDONESIA 16.7 66.7 16.7 0.0 18.5 66.7 14.8 0.0 0.0 57.6 39.0 3.4 26.8 58.5 14.6 0.0
THAILAND 45.5 45.5 0.0 9.1 19.6 55.4 21.4 3.6 12.3 43.1 32.3 12.3 31.9 44.7 17.0 6.4
30.0
45.0
20.0
5.0
21.4
53.6
21.4
3.6
25.0
47.9
22.9
4.2
33.3
46.1
18.6
2.0
16.7
66.7
16.7
0.0
18.5
66.7
14.8
0.0 0.0
57.6
39.0
3.4
26.8
58.5
14.6
0.0
45.5 45.5
0.0
9.1
19.6
55.4
21.4
3.6
12.3
43.1
32.3
12.3
31.9
44.7
17.0
6.4
0.0
10.0
20.0
30.0
40.0
50.0
60.0
70.0
The majority of the respondents spend at least 30-60 minutes per session for volleyball, badminton, swimming and yoga. However, in Thailand an equal amount of 45.5% of the respondents spend either less than 30 minutes or 30-60 minutes per session
for volleyball activities.
Volleyball Badminton Swimming Yoga
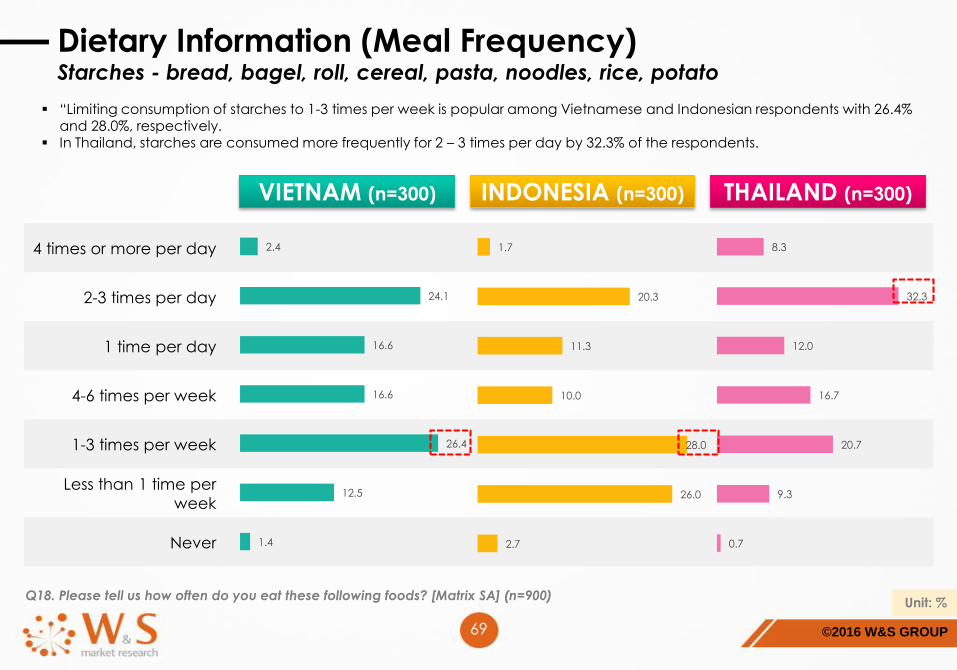
©2016 W&S GROUP69
Q18. Please tell us how often do you eat these following foods? [Matrix SA] (n=900) Unit: %
Dietary Information (Meal Frequency)Starches - bread, bagel, roll, cereal, pasta, noodles, rice, potato
“Limiting consumption of starches to 1-3 times per week is popular among Vietnamese and Indonesian respondents with 26.4% and 28.0%, respectively.
In Thailand, starches are consumed more frequently for 2 – 3 times per day by 32.3% of the respondents.
4 times or more per day
2-3 times per day
1 time per day
4-6 times per week
1-3 times per week
Less than 1 time per
week
Never
VIETNAM (n=300) INDONESIA (n=300) THAILAND (n=300)
0.7
9.3
20.7
16.7
12.0
32.3
8.3
1.4
12.5
26.4
16.6
16.6
24.1
2.4
2.7
26.0
28.0
10.0
11.3
20.3
1.7
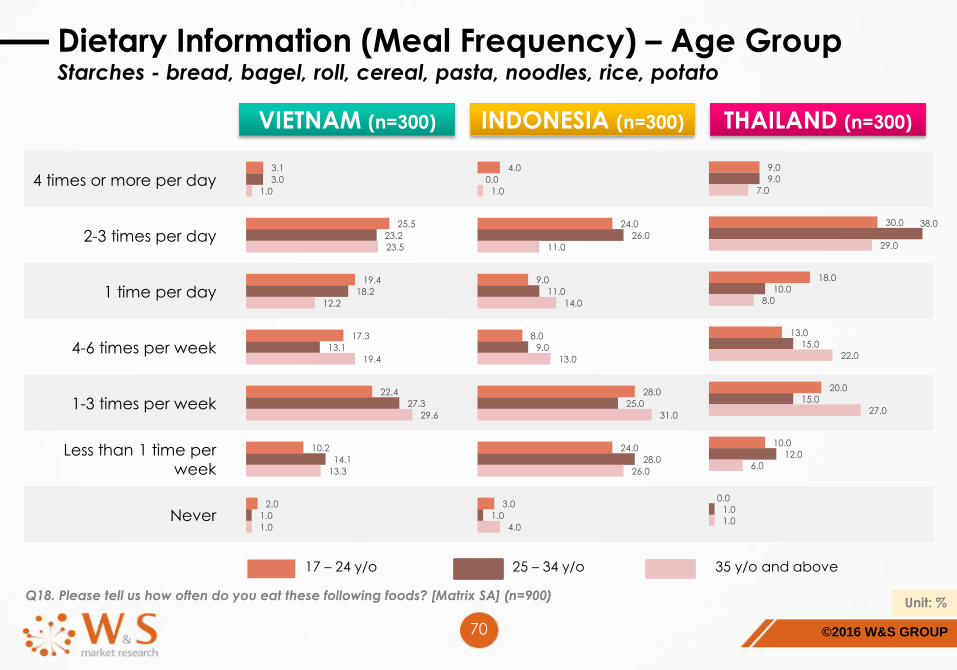
©2016 W&S GROUP70
Q18. Please tell us how often do you eat these following foods? [Matrix SA] (n=900) Unit: %
Dietary Information (Meal Frequency) – Age GroupStarches - bread, bagel, roll, cereal, pasta, noodles, rice, potato
4 times or more per day
2-3 times per day
1 time per day
4-6 times per week
1-3 times per week
Less than 1 time per
week
Never
VIETNAM (n=300) INDONESIA (n=300) THAILAND (n=300)
17 – 24 y/o 25 – 34 y/o 35 y/o and above
3.1
25.5
19.4
17.3
22.4
10.2
2.0
3.0
23.2
18.2
13.1
27.3
14.1
1.0
1.0
23.5
12.2
19.4
29.6
13.3
1.0
4.0
24.0
9.0
8.0
28.0
24.0
3.0
0.0
26.0
11.0
9.0
25.0
28.0
1.0
1.0
11.0
14.0
13.0
31.0
26.0
4.0
9.0
30.0
18.0
13.0
20.0
10.0
0.0
9.0
38.0
10.0
15.0
15.0
12.0
1.0
7.0
29.0
8.0
22.0
27.0
6.0
1.0
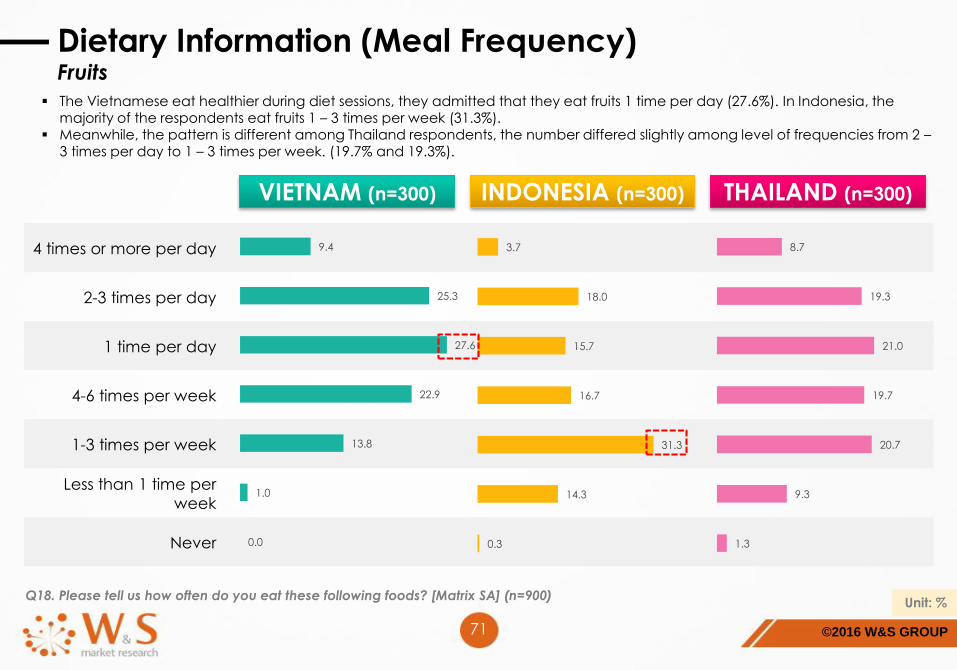
©2016 W&S GROUP71
Q18. Please tell us how often do you eat these following foods? [Matrix SA] (n=900) Unit: %
Dietary Information (Meal Frequency)Fruits
The Vietnamese eat healthier during diet sessions, they admitted that they eat fruits 1 time per day (27.6%). In Indonesia, the majority of the respondents eat fruits 1 – 3 times per week (31.3%).
Meanwhile, the pattern is different among Thailand respondents, the number differed slightly among level of frequencies from 2 –3 times per day to 1 – 3 times per week. (19.7% and 19.3%).
4 times or more per day
2-3 times per day
1 time per day
4-6 times per week
1-3 times per week
Less than 1 time per
week
Never
VIETNAM (n=300) INDONESIA (n=300) THAILAND (n=300)
1.3
9.3
20.7
19.7
21.0
19.3
8.7
0.0
1.0
13.8
22.9
27.6
25.3
9.4
0.3
14.3
31.3
16.7
15.7
18.0
3.7

©2016 W&S GROUP72
Q18. Please tell us how often do you eat these following foods? [Matrix SA] (n=900) Unit: %
Dietary Information (Meal Frequency) – Age GroupFruits
4 times or more per day
2-3 times per day
1 time per day
4-6 times per week
1-3 times per week
Less than 1 time per
week
Never
VIETNAM (n=300) INDONESIA (n=300) THAILAND (n=300)
17 – 24 y/o 25 – 34 y/o 35 y/o and above
6.1
21.4
19.4
34.7
16.3
2.0
0.0
14.1
21.2
39.4
16.2
9.1
0.0
0.0
8.0
33.0
24.0
18.0
16.0
1.0
0.0
3.0
14.0
11.0
15.0
36.0
21.0
0.0
1.0
18.0
15.0
17.0
35.0
13.0
1.0
7.0
22.0
21.0
18.0
23.0
9.0
0.0
12.0
10.0
21.0
22.0
23.0
10.0
2.0
10.0
13.0
21.0
20.0
24.0
11.0
1.0
4.0
35.0
21.0
17.0
15.0
7.0
1.0
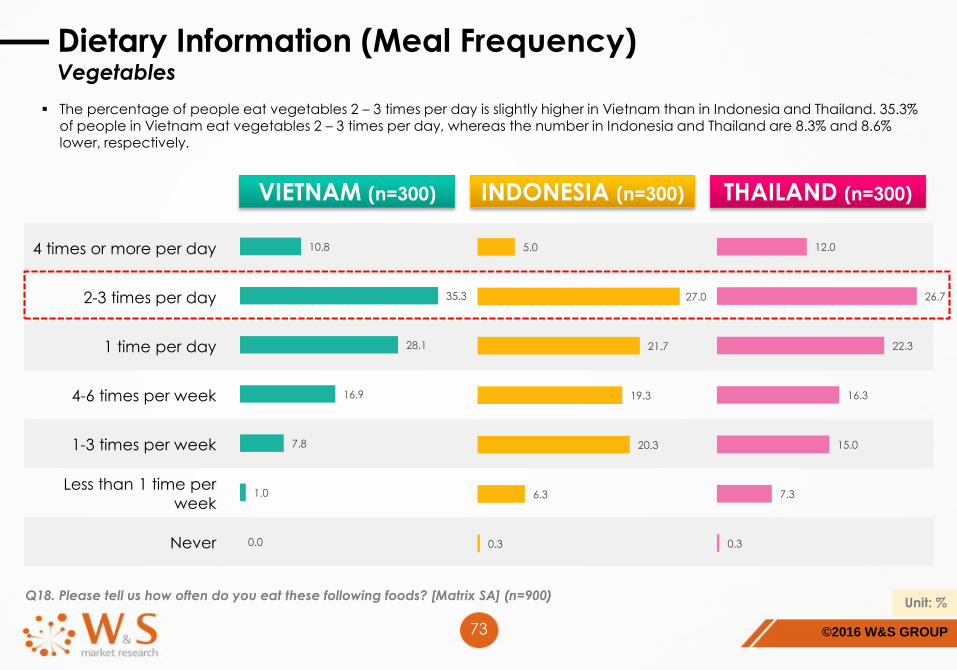
©2016 W&S GROUP73
Q18. Please tell us how often do you eat these following foods? [Matrix SA] (n=900) Unit: %
Dietary Information (Meal Frequency)Vegetables
The percentage of people eat vegetables 2 – 3 times per day is slightly higher in Vietnam than in Indonesia and Thailand. 35.3% of people in Vietnam eat vegetables 2 – 3 times per day, whereas the number in Indonesia and Thailand are 8.3% and 8.6% lower, respectively.
4 times or more per day
2-3 times per day
1 time per day
4-6 times per week
1-3 times per week
Less than 1 time per
week
Never
VIETNAM (n=300) INDONESIA (n=300) THAILAND (n=300)
0.3
7.3
15.0
16.3
22.3
26.7
12.0
0.0
1.0
7.8
16.9
28.1
35.3
10.8
0.3
6.3
20.3
19.3
21.7
27.0
5.0
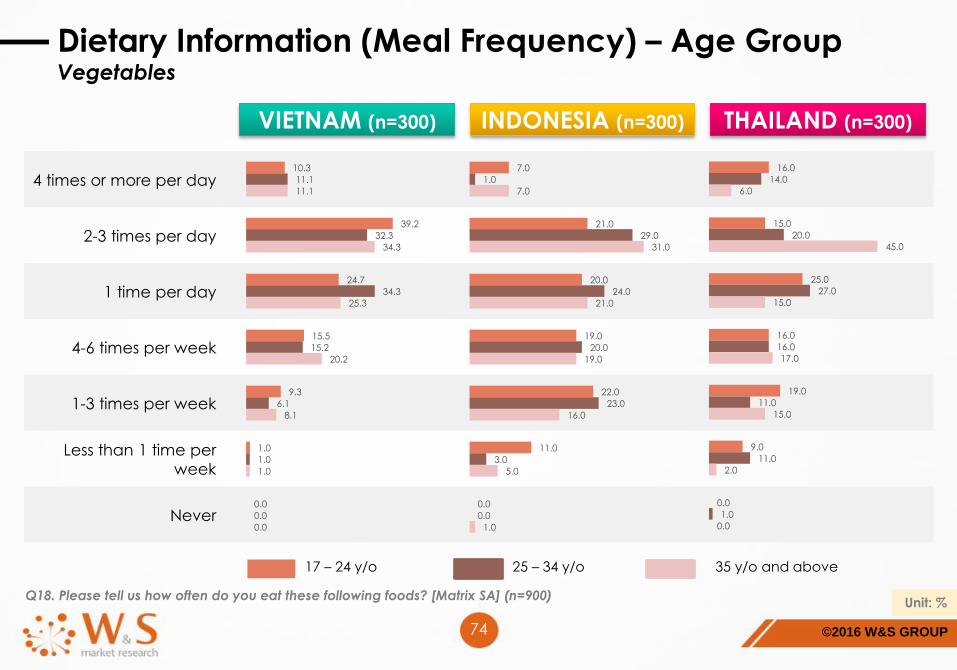
©2016 W&S GROUP74
Q18. Please tell us how often do you eat these following foods? [Matrix SA] (n=900) Unit: %
Dietary Information (Meal Frequency) – Age GroupVegetables
4 times or more per day
2-3 times per day
1 time per day
4-6 times per week
1-3 times per week
Less than 1 time per
week
Never
VIETNAM (n=300) INDONESIA (n=300) THAILAND (n=300)
17 – 24 y/o 25 – 34 y/o 35 y/o and above
10.3
39.2
24.7
15.5
9.3
1.0
0.0
11.1
32.3
34.3
15.2
6.1
1.0
0.0
11.1
34.3
25.3
20.2
8.1
1.0
0.0
7.0
21.0
20.0
19.0
22.0
11.0
0.0
1.0
29.0
24.0
20.0
23.0
3.0
0.0
7.0
31.0
21.0
19.0
16.0
5.0
1.0
16.0
15.0
25.0
16.0
19.0
9.0
0.0
14.0
20.0
27.0
16.0
11.0
11.0
1.0
6.0
45.0
15.0
17.0
15.0
2.0
0.0
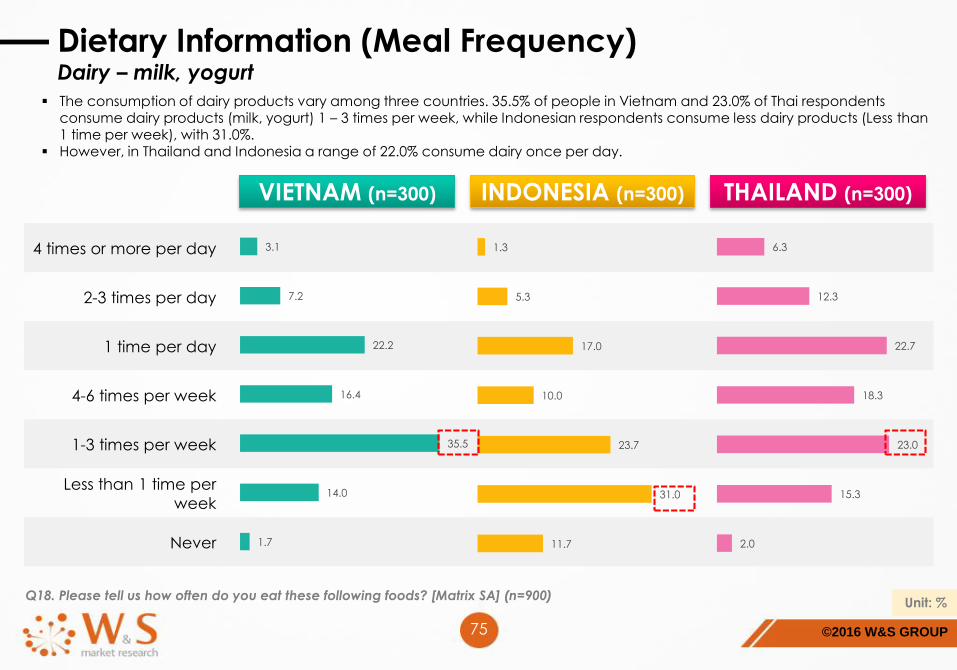
©2016 W&S GROUP75
Q18. Please tell us how often do you eat these following foods? [Matrix SA] (n=900) Unit: %
Dietary Information (Meal Frequency)Dairy – milk, yogurt
The consumption of dairy products vary among three countries. 35.5% of people in Vietnam and 23.0% of Thai respondents consume dairy products (milk, yogurt) 1 – 3 times per week, while Indonesian respondents consume less dairy products (Less than 1 time per week), with 31.0%.
However, in Thailand and Indonesia a range of 22.0% consume dairy once per day.
4 times or more per day
2-3 times per day
1 time per day
4-6 times per week
1-3 times per week
Less than 1 time per
week
Never
VIETNAM (n=300) INDONESIA (n=300) THAILAND (n=300)
2.0
15.3
23.0
18.3
22.7
12.3
6.3
1.7
14.0
35.5
16.4
22.2
7.2
3.1
11.7
31.0
23.7
10.0
17.0
5.3
1.3
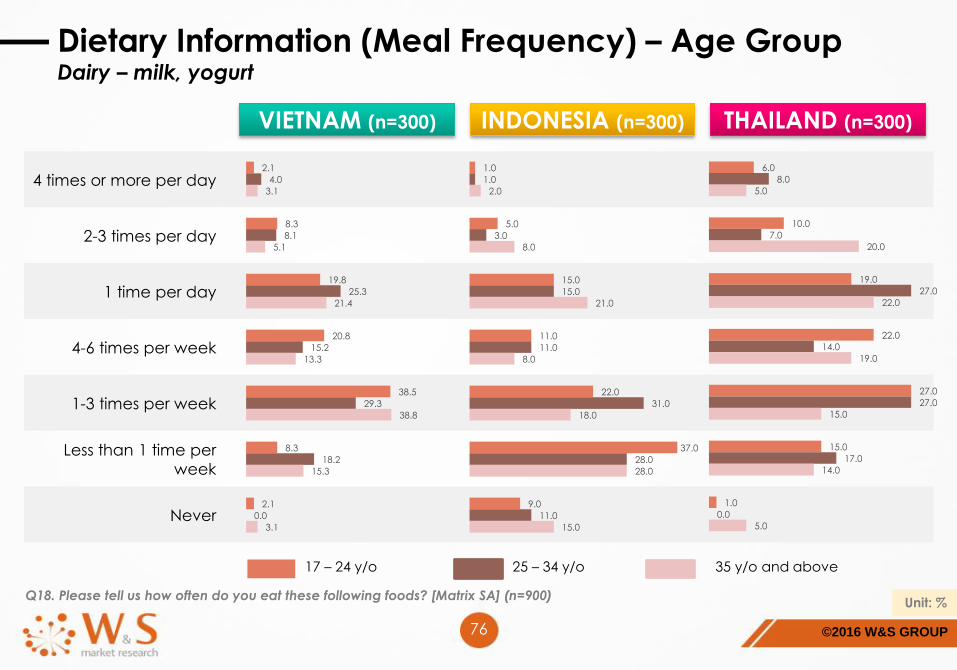
©2016 W&S GROUP76
Q18. Please tell us how often do you eat these following foods? [Matrix SA] (n=900) Unit: %
Dietary Information (Meal Frequency) – Age GroupDairy – milk, yogurt
4 times or more per day
2-3 times per day
1 time per day
4-6 times per week
1-3 times per week
Less than 1 time per
week
Never
VIETNAM (n=300) INDONESIA (n=300) THAILAND (n=300)
17 – 24 y/o 25 – 34 y/o 35 y/o and above
2.1
8.3
19.8
20.8
38.5
8.3
2.1
4.0
8.1
25.3
15.2
29.3
18.2
0.0
3.1
5.1
21.4
13.3
38.8
15.3
3.1
1.0
5.0
15.0
11.0
22.0
37.0
9.0
1.0
3.0
15.0
11.0
31.0
28.0
11.0
2.0
8.0
21.0
8.0
18.0
28.0
15.0
6.0
10.0
19.0
22.0
27.0
15.0
1.0
8.0
7.0
27.0
14.0
27.0
17.0
0.0
5.0
20.0
22.0
19.0
15.0
14.0
5.0
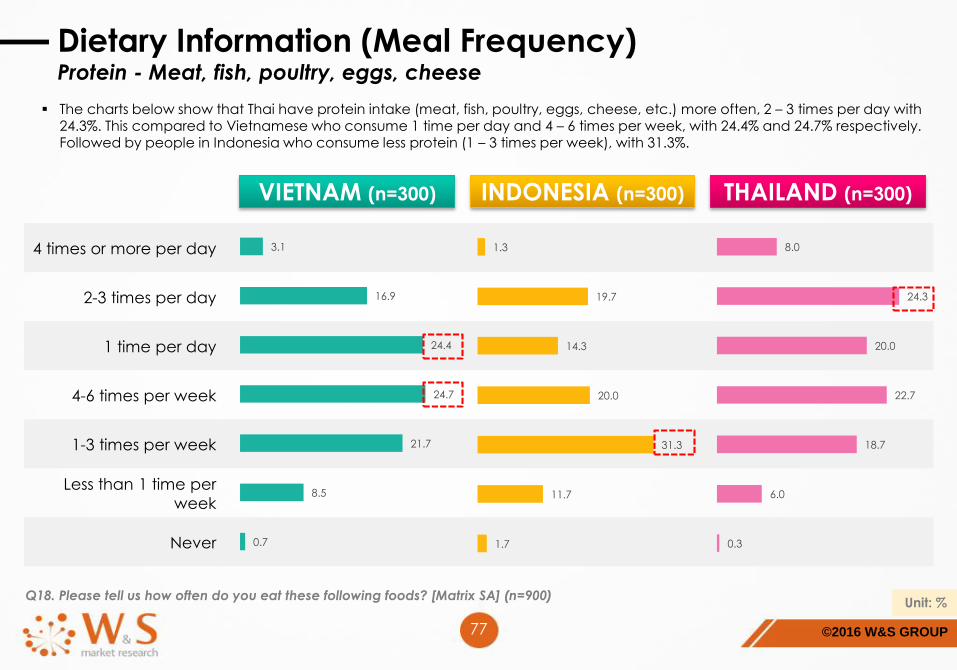
©2016 W&S GROUP77
Q18. Please tell us how often do you eat these following foods? [Matrix SA] (n=900) Unit: %
Dietary Information (Meal Frequency)Protein - Meat, fish, poultry, eggs, cheese
The charts below show that Thai have protein intake (meat, fish, poultry, eggs, cheese, etc.) more often, 2 – 3 times per day with 24.3%. This compared to Vietnamese who consume 1 time per day and 4 – 6 times per week, with 24.4% and 24.7% respectively. Followed by people in Indonesia who consume less protein (1 – 3 times per week), with 31.3%.
4 times or more per day
2-3 times per day
1 time per day
4-6 times per week
1-3 times per week
Less than 1 time per
week
Never
VIETNAM (n=300) INDONESIA (n=300) THAILAND (n=300)
0.3
6.0
18.7
22.7
20.0
24.3
8.0
0.7
8.5
21.7
24.7
24.4
16.9
3.1
1.7
11.7
31.3
20.0
14.3
19.7
1.3
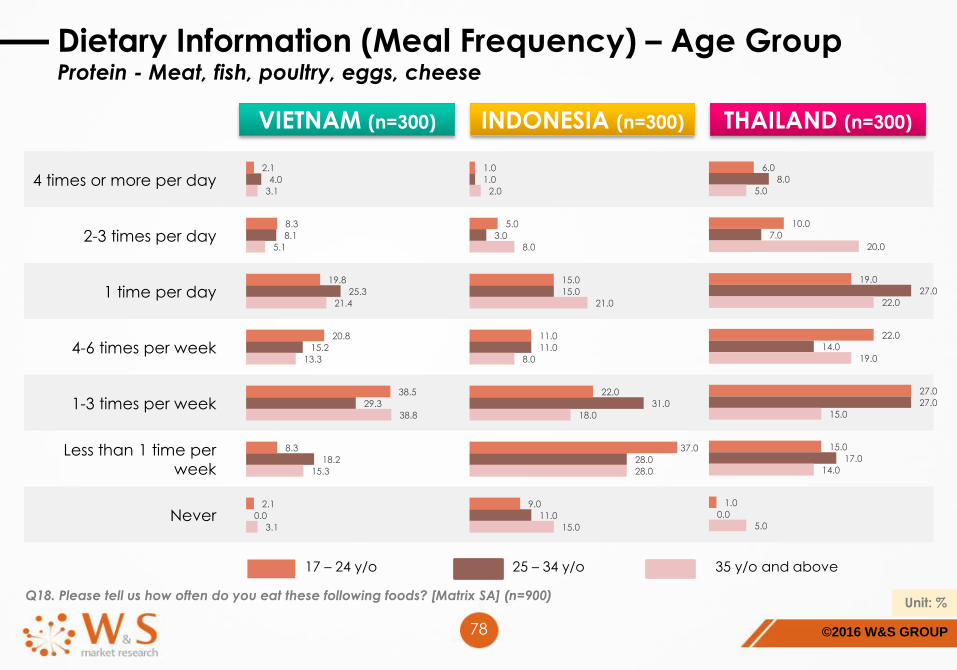
©2016 W&S GROUP78
Q18. Please tell us how often do you eat these following foods? [Matrix SA] (n=900) Unit: %
Dietary Information (Meal Frequency) – Age GroupProtein - Meat, fish, poultry, eggs, cheese
4 times or more per day
2-3 times per day
1 time per day
4-6 times per week
1-3 times per week
Less than 1 time per
week
Never
VIETNAM (n=300) INDONESIA (n=300) THAILAND (n=300)
17 – 24 y/o 25 – 34 y/o 35 y/o and above
2.1
8.3
19.8
20.8
38.5
8.3
2.1
4.0
8.1
25.3
15.2
29.3
18.2
0.0
3.1
5.1
21.4
13.3
38.8
15.3
3.1
1.0
5.0
15.0
11.0
22.0
37.0
9.0
1.0
3.0
15.0
11.0
31.0
28.0
11.0
2.0
8.0
21.0
8.0
18.0
28.0
15.0
6.0
10.0
19.0
22.0
27.0
15.0
1.0
8.0
7.0
27.0
14.0
27.0
17.0
0.0
5.0
20.0
22.0
19.0
15.0
14.0
5.0
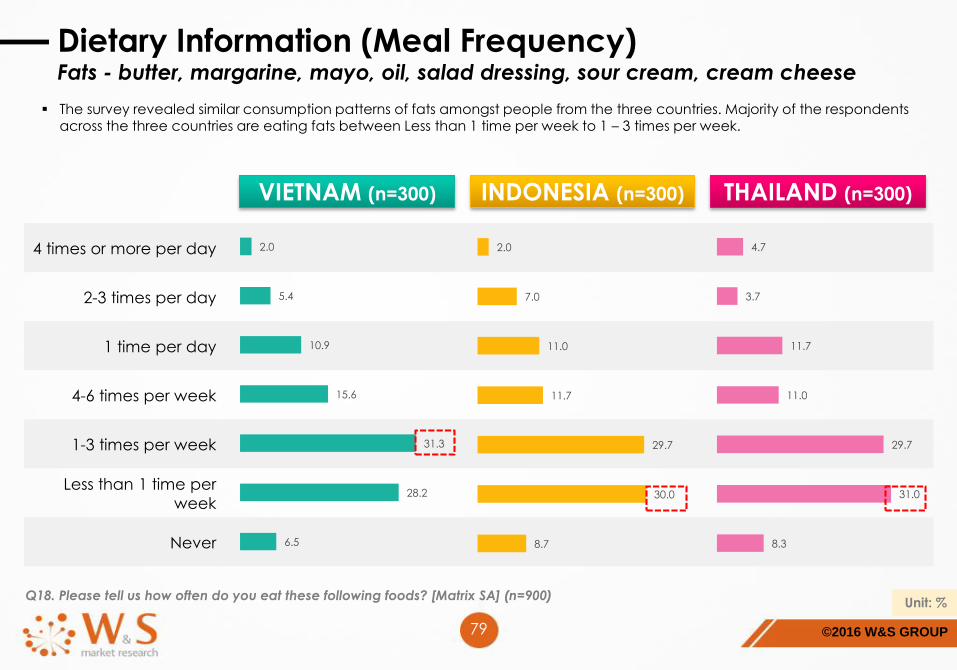
©2016 W&S GROUP79
Q18. Please tell us how often do you eat these following foods? [Matrix SA] (n=900) Unit: %
Dietary Information (Meal Frequency)Fats - butter, margarine, mayo, oil, salad dressing, sour cream, cream cheese
The survey revealed similar consumption patterns of fats amongst people from the three countries. Majority of the respondentsacross the three countries are eating fats between Less than 1 time per week to 1 – 3 times per week.
4 times or more per day
2-3 times per day
1 time per day
4-6 times per week
1-3 times per week
Less than 1 time per
week
Never
VIETNAM (n=300) INDONESIA (n=300) THAILAND (n=300)
8.3
31.0
29.7
11.0
11.7
3.7
4.7
6.5
28.2
31.3
15.6
10.9
5.4
2.0
8.7
30.0
29.7
11.7
11.0
7.0
2.0
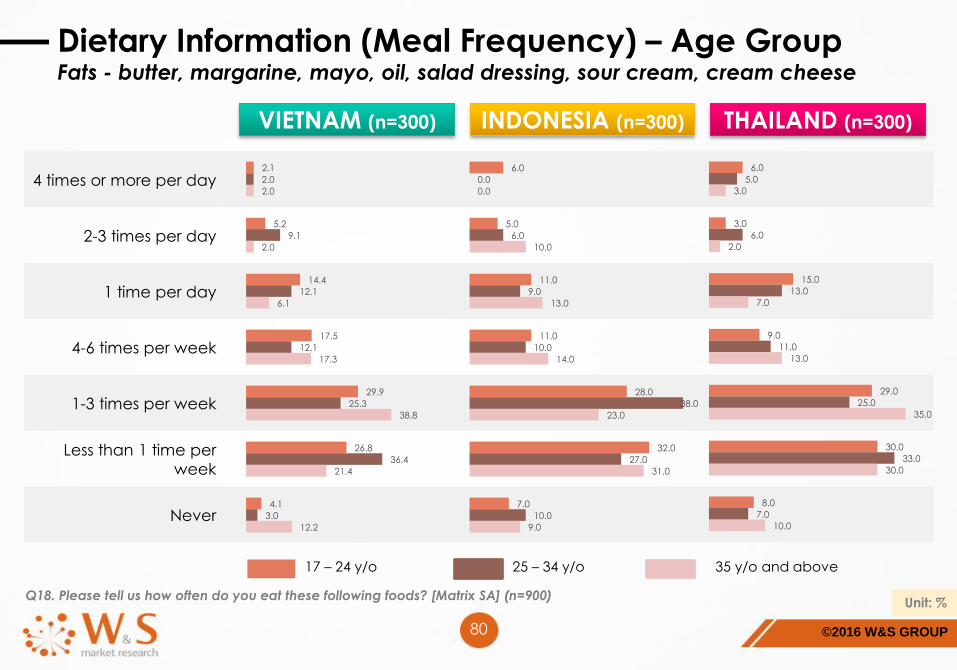
©2016 W&S GROUP80
Q18. Please tell us how often do you eat these following foods? [Matrix SA] (n=900) Unit: %
Dietary Information (Meal Frequency) – Age GroupFats - butter, margarine, mayo, oil, salad dressing, sour cream, cream cheese
4 times or more per day
2-3 times per day
1 time per day
4-6 times per week
1-3 times per week
Less than 1 time per
week
Never
VIETNAM (n=300) INDONESIA (n=300) THAILAND (n=300)
17 – 24 y/o 25 – 34 y/o 35 y/o and above
2.1
5.2
14.4
17.5
29.9
26.8
4.1
2.0
9.1
12.1
12.1
25.3
36.4
3.0
2.0
2.0
6.1
17.3
38.8
21.4
12.2
6.0
5.0
11.0
11.0
28.0
32.0
7.0
0.0
6.0
9.0
10.0
38.0
27.0
10.0
0.0
10.0
13.0
14.0
23.0
31.0
9.0
6.0
3.0
15.0
9.0
29.0
30.0
8.0
5.0
6.0
13.0
11.0
25.0
33.0
7.0
3.0
2.0
7.0
13.0
35.0
30.0
10.0
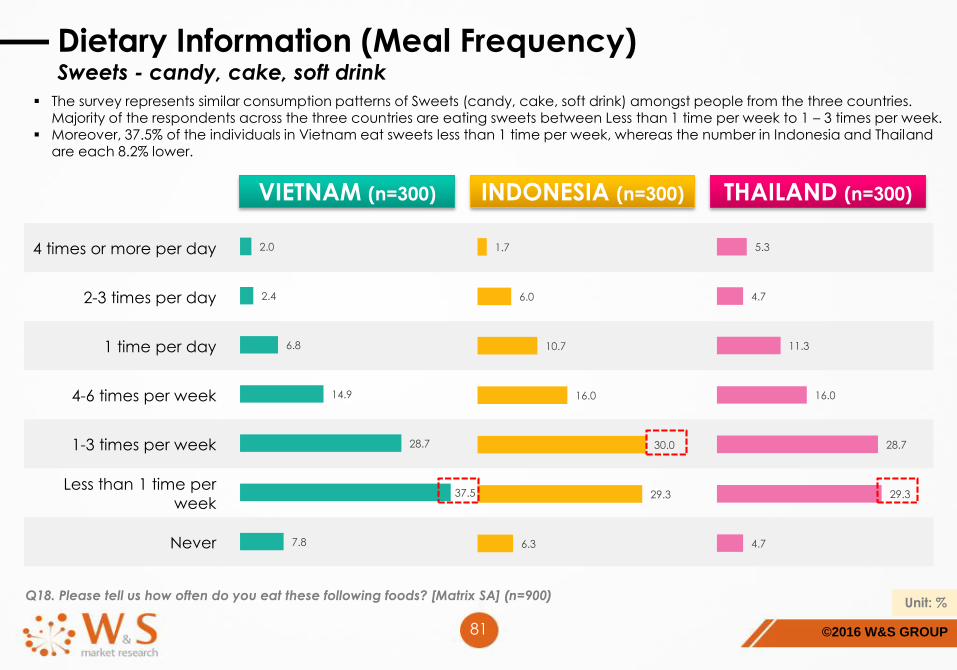
©2016 W&S GROUP81
Q18. Please tell us how often do you eat these following foods? [Matrix SA] (n=900) Unit: %
Dietary Information (Meal Frequency)Sweets - candy, cake, soft drink
The survey represents similar consumption patterns of Sweets (candy, cake, soft drink) amongst people from the three countries. Majority of the respondents across the three countries are eating sweets between Less than 1 time per week to 1 – 3 times per week.
Moreover, 37.5% of the individuals in Vietnam eat sweets less than 1 time per week, whereas the number in Indonesia and Thailandare each 8.2% lower.
4 times or more per day
2-3 times per day
1 time per day
4-6 times per week
1-3 times per week
Less than 1 time per
week
Never
VIETNAM (n=300) INDONESIA (n=300) THAILAND (n=300)
4.7
29.3
28.7
16.0
11.3
4.7
5.3
7.8
37.5
28.7
14.9
6.8
2.4
2.0
6.3
29.3
30.0
16.0
10.7
6.0
1.7
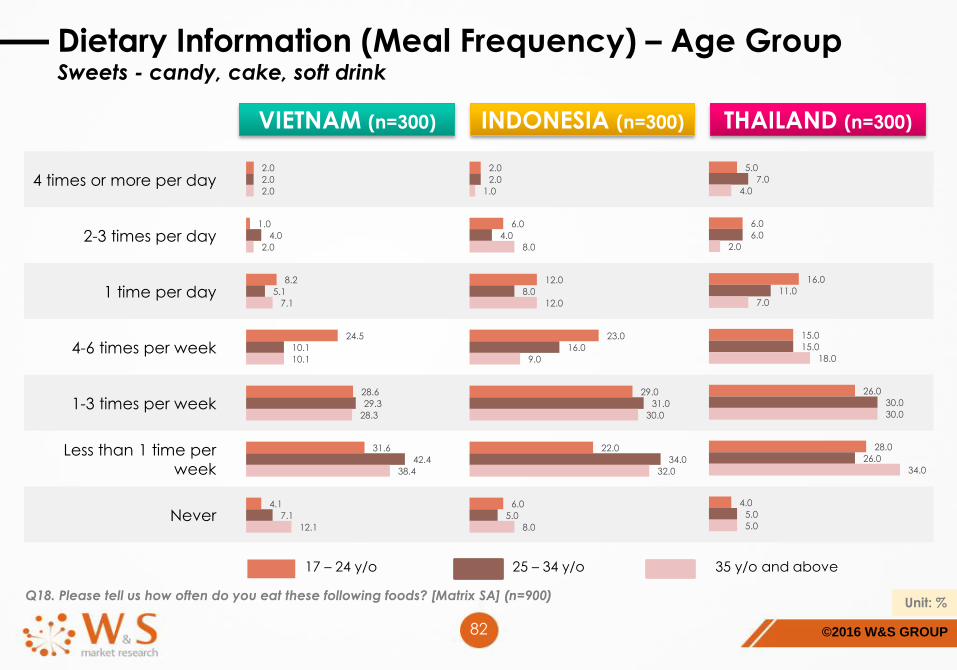
©2016 W&S GROUP82
Q18. Please tell us how often do you eat these following foods? [Matrix SA] (n=900) Unit: %
Dietary Information (Meal Frequency) – Age GroupSweets - candy, cake, soft drink
4 times or more per day
2-3 times per day
1 time per day
4-6 times per week
1-3 times per week
Less than 1 time per
week
Never
VIETNAM (n=300) INDONESIA (n=300) THAILAND (n=300)
17 – 24 y/o 25 – 34 y/o 35 y/o and above
2.0
1.0
8.2
24.5
28.6
31.6
4.1
2.0
4.0
5.1
10.1
29.3
42.4
7.1
2.0
2.0
7.1
10.1
28.3
38.4
12.1
2.0
6.0
12.0
23.0
29.0
22.0
6.0
2.0
4.0
8.0
16.0
31.0
34.0
5.0
1.0
8.0
12.0
9.0
30.0
32.0
8.0
5.0
6.0
16.0
15.0
26.0
28.0
4.0
7.0
6.0
11.0
15.0
30.0
26.0
5.0
4.0
2.0
7.0
18.0
30.0
34.0
5.0
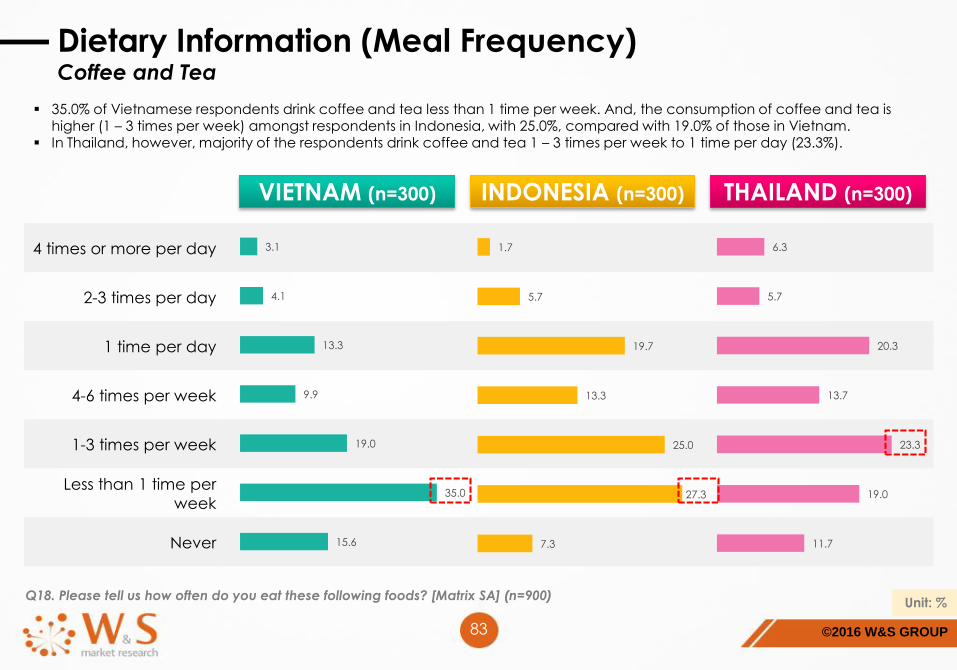
©2016 W&S GROUP83
Q18. Please tell us how often do you eat these following foods? [Matrix SA] (n=900) Unit: %
Dietary Information (Meal Frequency)Coffee and Tea
35.0% of Vietnamese respondents drink coffee and tea less than 1 time per week. And, the consumption of coffee and tea is higher (1 – 3 times per week) amongst respondents in Indonesia, with 25.0%, compared with 19.0% of those in Vietnam.
In Thailand, however, majority of the respondents drink coffee and tea 1 – 3 times per week to 1 time per day (23.3%).
4 times or more per day
2-3 times per day
1 time per day
4-6 times per week
1-3 times per week
Less than 1 time per
week
Never
VIETNAM (n=300) INDONESIA (n=300) THAILAND (n=300)
11.7
19.0
23.3
13.7
20.3
5.7
6.3
15.6
35.0
19.0
9.9
13.3
4.1
3.1
7.3
27.3
25.0
13.3
19.7
5.7
1.7
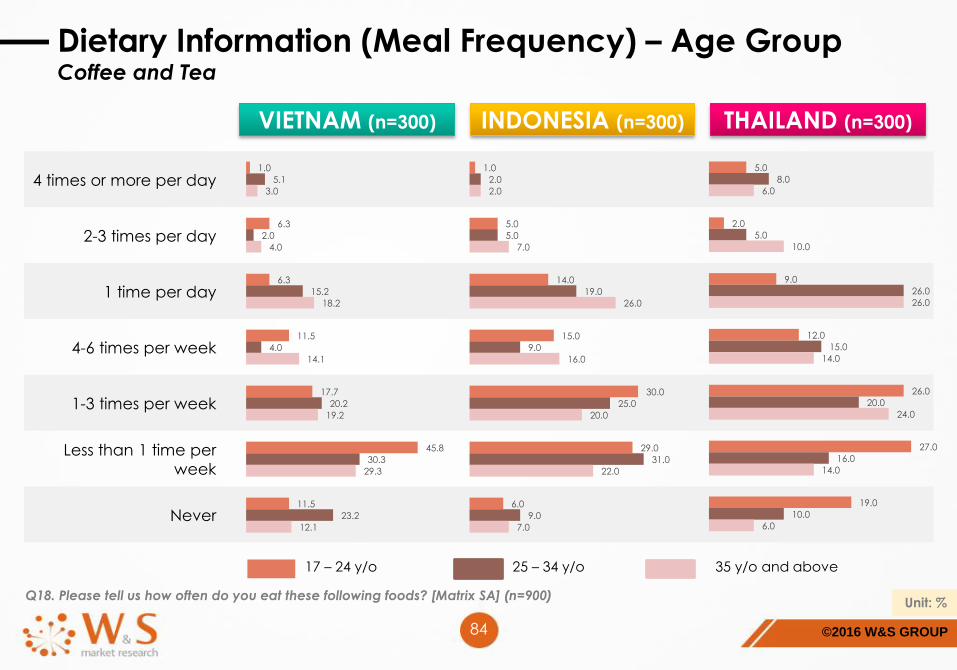
©2016 W&S GROUP84
Q18. Please tell us how often do you eat these following foods? [Matrix SA] (n=900) Unit: %
Dietary Information (Meal Frequency) – Age GroupCoffee and Tea
4 times or more per day
2-3 times per day
1 time per day
4-6 times per week
1-3 times per week
Less than 1 time per
week
Never
VIETNAM (n=300) INDONESIA (n=300) THAILAND (n=300)
17 – 24 y/o 25 – 34 y/o 35 y/o and above
1.0
6.3
6.3
11.5
17.7
45.8
11.5
5.1
2.0
15.2
4.0
20.2
30.3
23.2
3.0
4.0
18.2
14.1
19.2
29.3
12.1
1.0
5.0
14.0
15.0
30.0
29.0
6.0
2.0
5.0
19.0
9.0
25.0
31.0
9.0
2.0
7.0
26.0
16.0
20.0
22.0
7.0
5.0
2.0
9.0
12.0
26.0
27.0
19.0
8.0
5.0
26.0
15.0
20.0
16.0
10.0
6.0
10.0
26.0
14.0
24.0
14.0
6.0
©2016 W&S GROUP85
G. Conclusions & Recommendations
1. Conclusions
2. Recommendations
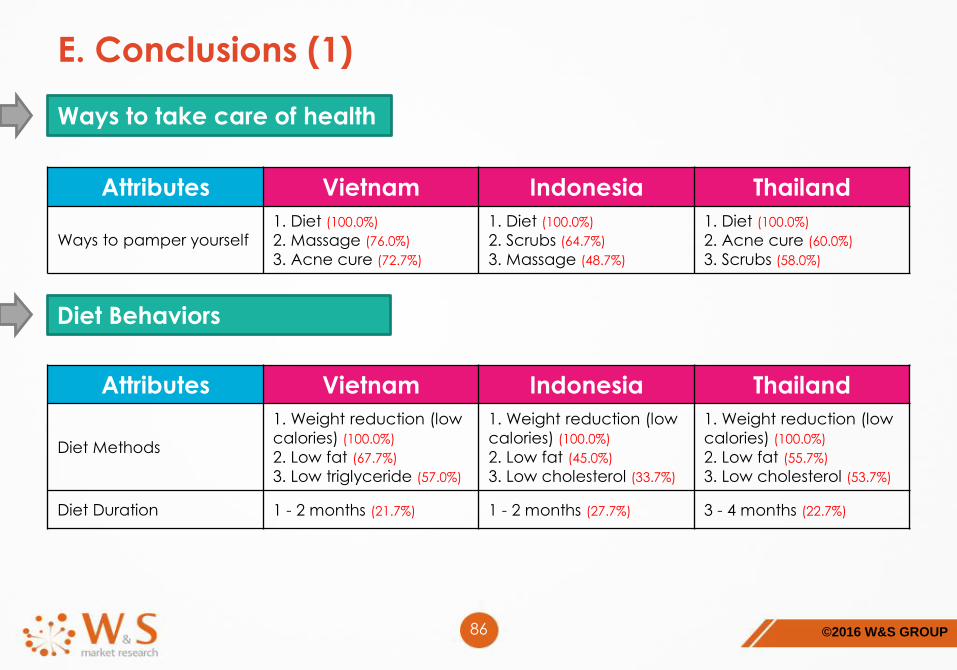
©2016 W&S GROUP86
E. Conclusions (1)
Attributes Vietnam Indonesia Thailand
Ways to pamper yourself1. Diet (100.0%)
2. Massage (76.0%)
3. Acne cure (72.7%)
1. Diet (100.0%)
2. Scrubs (64.7%)
3. Massage (48.7%)
1. Diet (100.0%)
2. Acne cure (60.0%)
3. Scrubs (58.0%)
Ways to take care of health
Diet Behaviors
Attributes Vietnam Indonesia Thailand
Diet Methods
1. Weight reduction (low
calories) (100.0%)
2. Low fat (67.7%)
3. Low triglyceride (57.0%)
1. Weight reduction (low
calories) (100.0%)
2. Low fat (45.0%)
3. Low cholesterol (33.7%)
1. Weight reduction (low
calories) (100.0%)
2. Low fat (55.7%)
3. Low cholesterol (53.7%)
Diet Duration 1 - 2 months (21.7%) 1 - 2 months (27.7%) 3 - 4 months (22.7%)
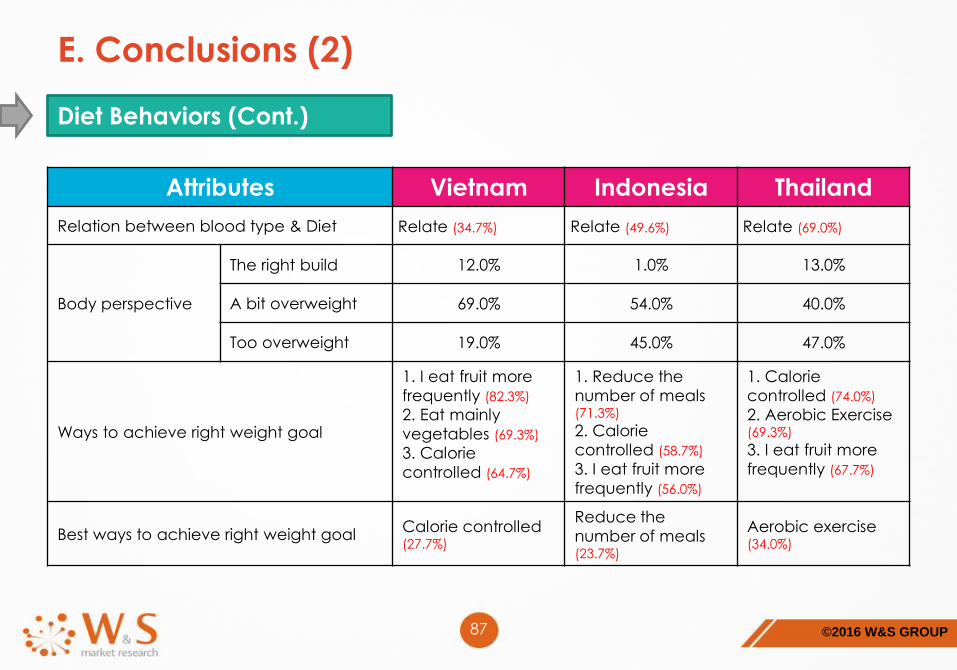
©2016 W&S GROUP87
E. Conclusions (2)
Attributes Vietnam Indonesia Thailand
Relation between blood type & Diet Relate (34.7%) Relate (49.6%) Relate (69.0%)
Body perspective
The right build 12.0% 1.0% 13.0%
A bit overweight 69.0% 54.0% 40.0%
Too overweight 19.0% 45.0% 47.0%
Ways to achieve right weight goal
1. I eat fruit more
frequently (82.3%)
2. Eat mainly
vegetables (69.3%)
3. Calorie
controlled (64.7%)
1. Reduce the
number of meals (71.3%)
2. Calorie
controlled (58.7%)
3. I eat fruit more
frequently (56.0%)
1. Calorie
controlled (74.0%)
2. Aerobic Exercise (69.3%)
3. I eat fruit more
frequently (67.7%)
Best ways to achieve right weight goalCalorie controlled(27.7%)
Reduce the
number of meals (23.7%)
Aerobic exercise(34.0%)
Diet Behaviors (Cont.)
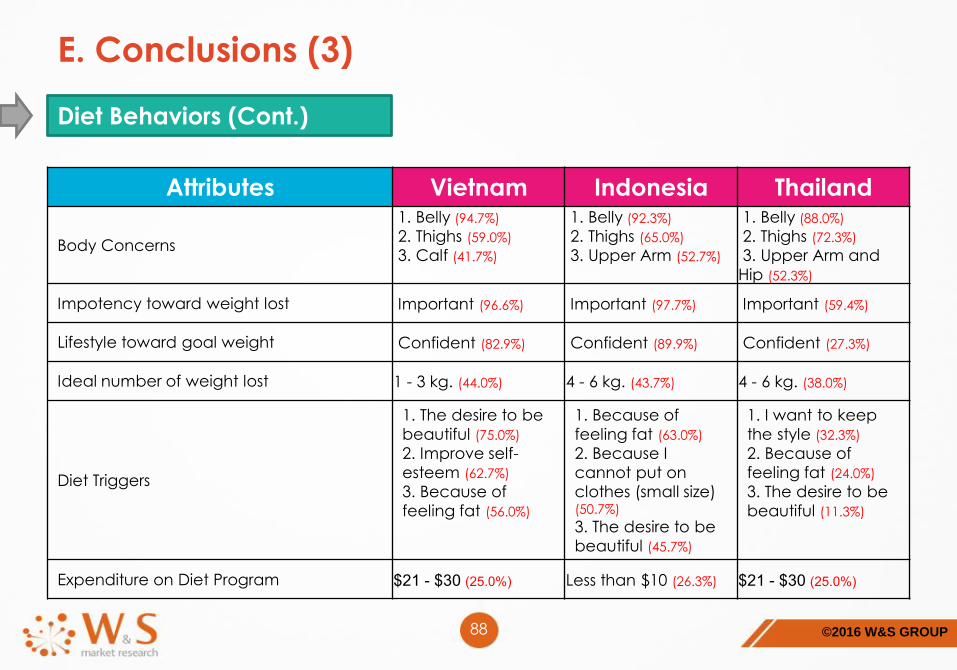
©2016 W&S GROUP88
E. Conclusions (3)
Attributes Vietnam Indonesia Thailand
Body Concerns
1. Belly (94.7%)
2. Thighs (59.0%)
3. Calf (41.7%)
1. Belly (92.3%)
2. Thighs (65.0%)
3. Upper Arm (52.7%)
1. Belly (88.0%)
2. Thighs (72.3%)
3. Upper Arm and
Hip (52.3%)
Impotency toward weight lost Important (96.6%) Important (97.7%) Important (59.4%)
Lifestyle toward goal weight Confident (82.9%) Confident (89.9%) Confident (27.3%)
Ideal number of weight lost 1 - 3 kg. (44.0%) 4 - 6 kg. (43.7%) 4 - 6 kg. (38.0%)
Diet Triggers
1. The desire to be
beautiful (75.0%)
2. Improve self-
esteem (62.7%)
3. Because of
feeling fat (56.0%)
1. Because of
feeling fat (63.0%)
2. Because I
cannot put on
clothes (small size) (50.7%)
3. The desire to be
beautiful (45.7%)
1. I want to keep
the style (32.3%)
2. Because of
feeling fat (24.0%)
3. The desire to be
beautiful (11.3%)
Expenditure on Diet Program $21 - $30 (25.0%) Less than $10 (26.3%) $21 - $30 (25.0%)
Diet Behaviors (Cont.)
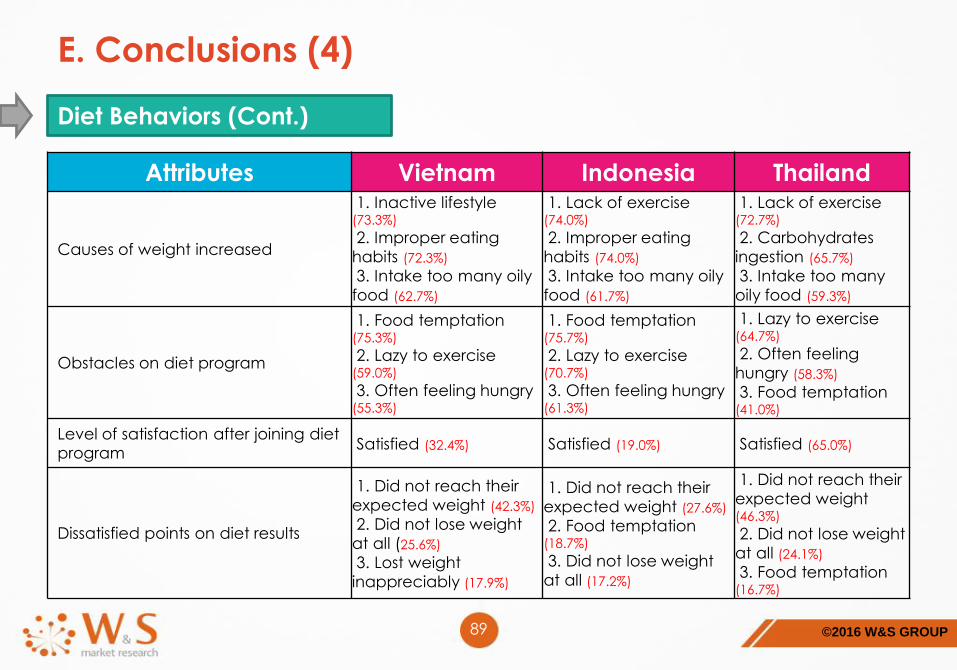
©2016 W&S GROUP89
E. Conclusions (4)
Attributes Vietnam Indonesia Thailand
Causes of weight increased
1. Inactive lifestyle (73.3%)
2. Improper eating
habits (72.3%)
3. Intake too many oily
food (62.7%)
1. Lack of exercise (74.0%)
2. Improper eating
habits (74.0%)
3. Intake too many oily
food (61.7%)
1. Lack of exercise (72.7%)
2. Carbohydrates
ingestion (65.7%)
3. Intake too many
oily food (59.3%)
Obstacles on diet program
1. Food temptation (75.3%)
2. Lazy to exercise (59.0%)
3. Often feeling hungry (55.3%)
1. Food temptation (75.7%)
2. Lazy to exercise (70.7%)
3. Often feeling hungry (61.3%)
1. Lazy to exercise (64.7%)
2. Often feeling
hungry (58.3%)
3. Food temptation (41.0%)
Level of satisfaction after joining diet program
Satisfied (32.4%) Satisfied (19.0%) Satisfied (65.0%)
Dissatisfied points on diet results
1. Did not reach their
expected weight (42.3%)
2. Did not lose weight
at all (25.6%)
3. Lost weight
inappreciably (17.9%)
1. Did not reach their
expected weight (27.6%)
2. Food temptation (18.7%)
3. Did not lose weight
at all (17.2%)
1. Did not reach their
expected weight (46.3%)
2. Did not lose weight
at all (24.1%)
3. Food temptation (16.7%)
Diet Behaviors (Cont.)
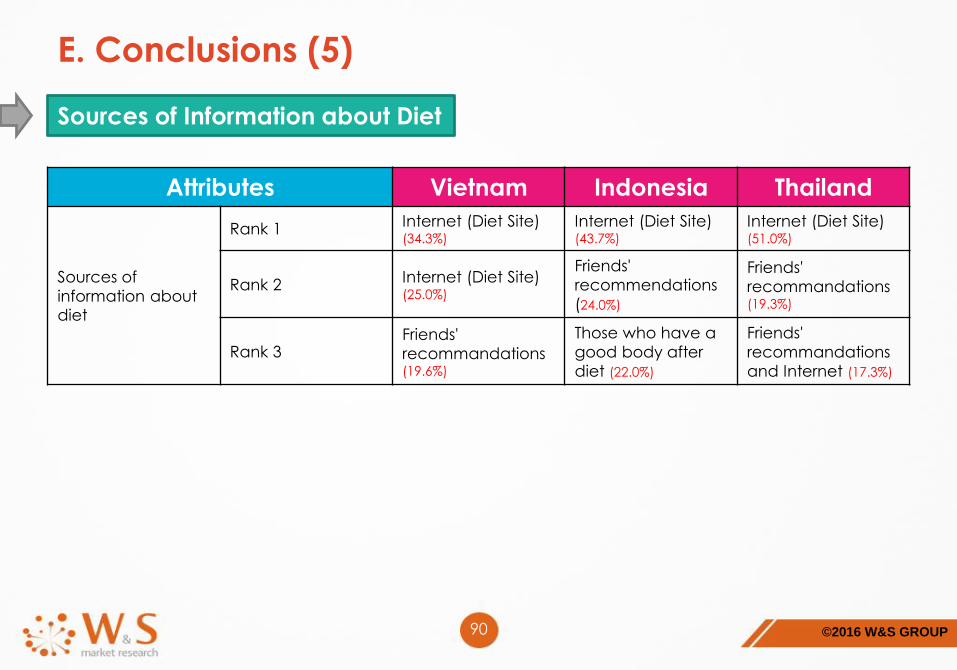
©2016 W&S GROUP90
E. Conclusions (5)
Attributes Vietnam Indonesia Thailand
Sources of
information about diet
Rank 1Internet (Diet Site) (34.3%)
Internet (Diet Site) (43.7%)
Internet (Diet Site) (51.0%)
Rank 2Internet (Diet Site) (25.0%)
Friends'
recommendations
(24.0%)
Friends'
recommandations (19.3%)
Rank 3Friends'
recommandations (19.6%)
Those who have a
good body after
diet (22.0%)
Friends'
recommandations
and Internet (17.3%)
Sources of Information about Diet
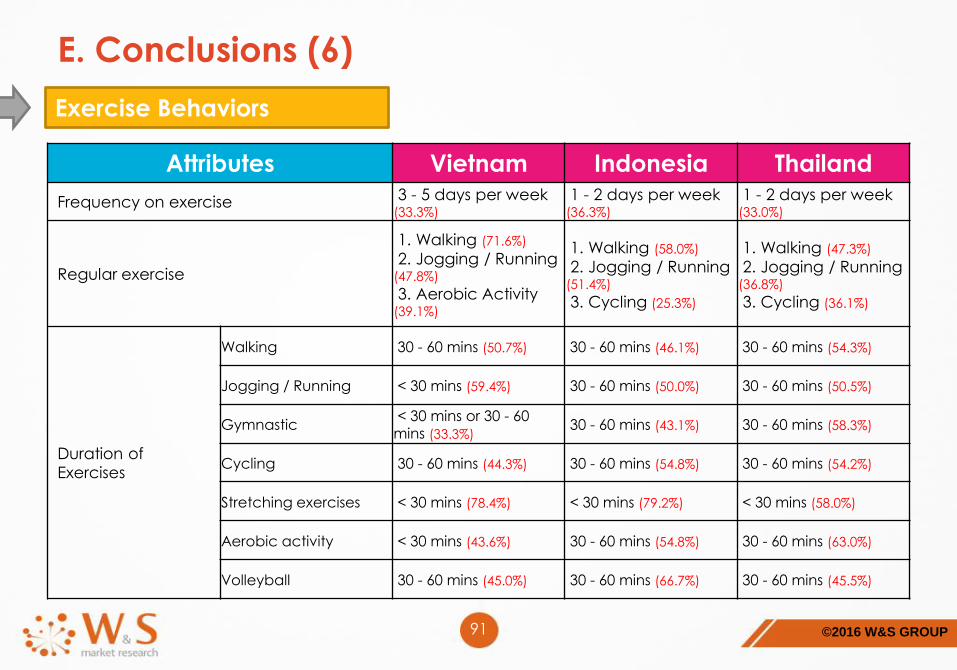
©2016 W&S GROUP91
E. Conclusions (6)
Attributes Vietnam Indonesia Thailand
Frequency on exercise 3 - 5 days per week (33.3%)
1 - 2 days per week (36.3%)
1 - 2 days per week (33.0%)
Regular exercise
1. Walking (71.6%)
2. Jogging / Running (47.8%)
3. Aerobic Activity (39.1%)
1. Walking (58.0%)
2. Jogging / Running (51.4%)
3. Cycling (25.3%)
1. Walking (47.3%)
2. Jogging / Running (36.8%)
3. Cycling (36.1%)
Duration of Exercises
Walking 30 - 60 mins (50.7%) 30 - 60 mins (46.1%) 30 - 60 mins (54.3%)
Jogging / Running < 30 mins (59.4%) 30 - 60 mins (50.0%) 30 - 60 mins (50.5%)
Gymnastic< 30 mins or 30 - 60 mins (33.3%)
30 - 60 mins (43.1%) 30 - 60 mins (58.3%)
Cycling 30 - 60 mins (44.3%) 30 - 60 mins (54.8%) 30 - 60 mins (54.2%)
Stretching exercises < 30 mins (78.4%) < 30 mins (79.2%) < 30 mins (58.0%)
Aerobic activity < 30 mins (43.6%) 30 - 60 mins (54.8%) 30 - 60 mins (63.0%)
Volleyball 30 - 60 mins (45.0%) 30 - 60 mins (66.7%) 30 - 60 mins (45.5%)
Exercise Behaviors
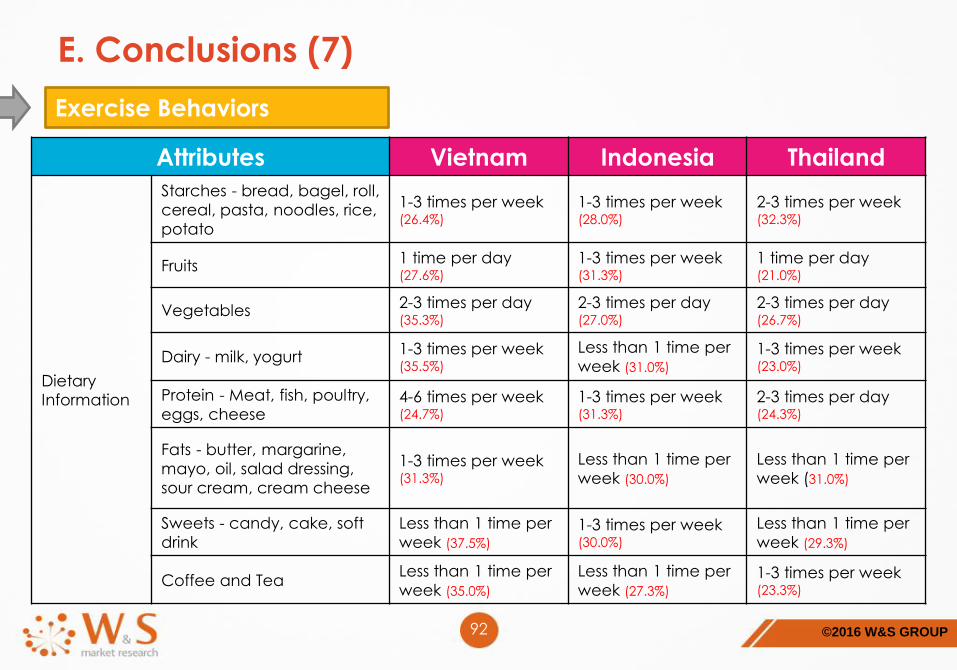
©2016 W&S GROUP92
E. Conclusions (7)
Exercise Behaviors
Attributes Vietnam Indonesia Thailand
Dietary Information
Starches - bread, bagel, roll,
cereal, pasta, noodles, rice,
potato
1-3 times per week (26.4%)
1-3 times per week (28.0%)
2-3 times per week (32.3%)
Fruits1 time per day (27.6%)
1-3 times per week (31.3%)
1 time per day (21.0%)
Vegetables2-3 times per day (35.3%)
2-3 times per day (27.0%)
2-3 times per day (26.7%)
Dairy - milk, yogurt1-3 times per week (35.5%)
Less than 1 time per
week (31.0%)
1-3 times per week (23.0%)
Protein - Meat, fish, poultry,
eggs, cheese4-6 times per week (24.7%)
1-3 times per week (31.3%)
2-3 times per day (24.3%)
Fats - butter, margarine,
mayo, oil, salad dressing,
sour cream, cream cheese
1-3 times per week (31.3%)
Less than 1 time per
week (30.0%)
Less than 1 time per
week (31.0%)
Sweets - candy, cake, soft
drink
Less than 1 time per
week (37.5%)
1-3 times per week (30.0%)
Less than 1 time per
week (29.3%)
Coffee and TeaLess than 1 time per
week (35.0%)
Less than 1 time per
week (27.3%)
1-3 times per week (23.3%)
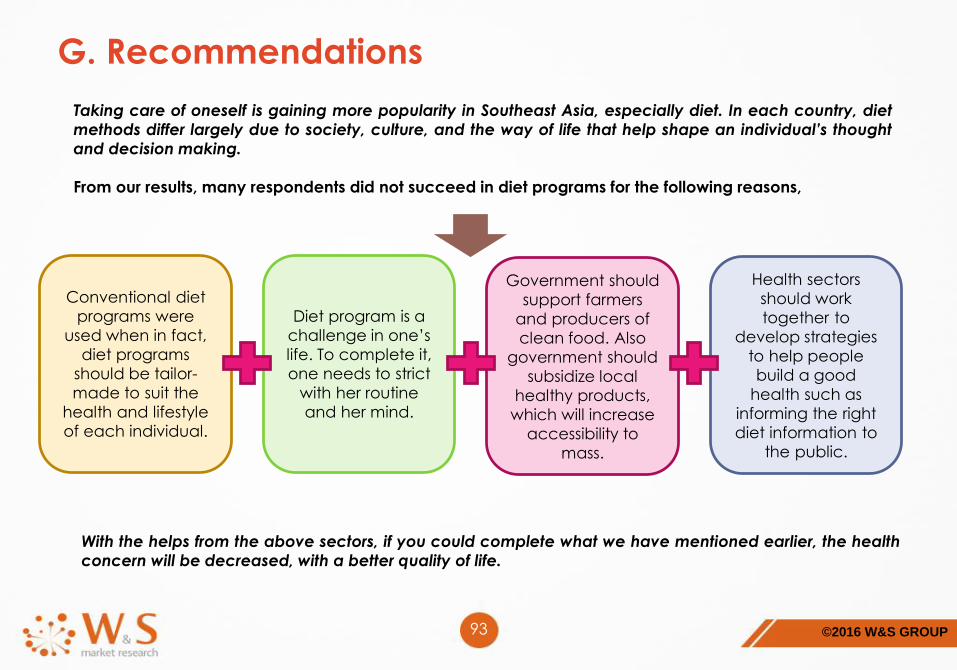
©2016 W&S GROUP
Government should
support farmers
and producers of
clean food. Also
government should
subsidize local
healthy products,
which will increase
accessibility to
mass.
Diet program is a
challenge in one’s
life. To complete it,
one needs to strict
with her routine
and her mind.
93
G. Recommendations
Taking care of oneself is gaining more popularity in Southeast Asia, especially diet. In each country, diet
methods differ largely due to society, culture, and the way of life that help shape an individual’s thought
and decision making.
From our results, many respondents did not succeed in diet programs for the following reasons,
Conventional diet
programs were
used when in fact,
diet programs
should be tailor-
made to suit the
health and lifestyle
of each individual.
Health sectors
should work
together to
develop strategies
to help people
build a good
health such as
informing the right
diet information to
the public.
With the helps from the above sectors, if you could complete what we have mentioned earlier, the health
concern will be decreased, with a better quality of life.
FOR FURTHER INQUIRIES, PLEASE CONTACT:
5F Honey Gotanda Dai2-bdg Gotanda 1-4-1 Higashi-Gotanda Shinagawa-ku
Tokyo city, Japan
Tel: +81 (0) 3-5421-7925
URL : http://wsgroup-asia.com/
Email : [email protected]
The copyright of this report belongs to World Wide System Corporation
*** Our report is officially free for those who are interested, and open for using this report as references.
For any usages regarding to our results, please refer W&S as your sources of information.