COMPARATIVE PERFORMANCE DATA FROM FRENCH TRAMWAYS … · FINAL REPORT SOUTH YORKSHIRE PASSENGER...
51
. SOUTH YORKSHIRE PASSENGER TRANSPORT EXECUTIVE COMPARATIVE PERFORMANCE DATA FROM FRENCH TRAMWAYS SYSTEMS FINAL REPORT Version Name Comments Date 3 Final report (revised) Includes comments from client 18 December 2003 2 Final report Includes comments from client 30 October 2003 1 Draft report For client review 28 July 2003 TQ_28
Transcript of COMPARATIVE PERFORMANCE DATA FROM FRENCH TRAMWAYS … · FINAL REPORT SOUTH YORKSHIRE PASSENGER...

.
SOUTH YORKSHIRE PASSENGER TRANSPORT EXECUTIVE
COMPARATIVE PERFORMANCE DATA FROM FRENCH TRAMWAYS SYSTEMS
FINAL REPORT
Version Name Comments Date
3 Final report (revised) Includes comments from client 18 December 2003
2 Final report Includes comments from client 30 October 2003
1 Draft report For client review 28 July 2003 TQ_28


FINAL REPORT SOUTH YORKSHIRE PASSENGER TRANSPORT EXE
COMPARATIVE PERFORMANCE DATA FROM FRENCH TRAMWAYS SYSTEMS
SEMALY & FaberMaunsell 2/41 December 2003
CONTENTS
0. EXECUTIVE SUMMARY ................................................................................................................3
1. INTRODUCTION.............................................................................................................................4
1.1. STUDY OBJECTIVES.............................................................................................................4
1.2. HISTORY OF FRENCH TRAMS.............................................................................................5
1.3. TRAMWAYS STUDIED...........................................................................................................6
1.4. BACKGROUND DOCUMENTS & RESEARCH......................................................................7
2. PROCESSES OF A FRENCH TRAMWAY PROJECT ................................................................11
2.1. POLITICS OF TRAMS ..........................................................................................................11
2.2. LEGAL ISSUES ....................................................................................................................12
2.3. PLANNING PROCESS .........................................................................................................14
2.4. FINANCIAL SITUATION .......................................................................................................16
2.4.1. Versement transport......................................................................................................17
3. TRAMWAY CHARACTERISTICS................................................................................................20
3.1. FARES POLICY ....................................................................................................................20
3.2. CORRIDOR CHARACTERISTICS........................................................................................21
3.3. OPERATIONS CHARACTERISTICS....................................................................................23
3.4. STATISTICAL COMPARISONS ...........................................................................................27
3.5. ACCIDENT HISTORY...........................................................................................................28
3.6. SOCIO-ECONOMIC IMPACTS.............................................................................................30
4. SUCCESSFUL CHARACTERISTICS OF FRENCH TRAMWAYS..............................................32
5. FRENCH TRAITS IN THE UK ......................................................................................................34

FINAL REPORT SOUTH YORKSHIRE PASSENGER TRANSPORT EXECUTIVE
COMPARATIVE PERFORMANCE DATA FROM FRENCH TRAMWAYS SYSTEMS
SEMALY & FaberMaunsell 3/41 December 2003
0. EXECUTIVE SUMMARY
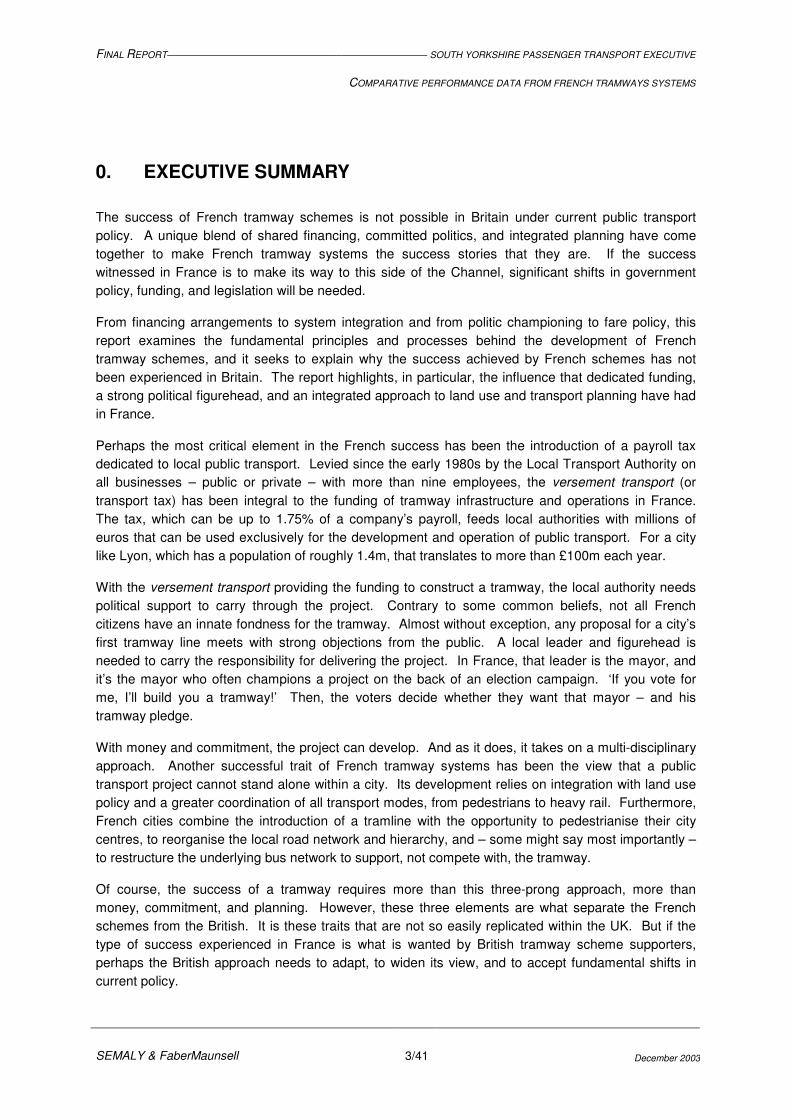
The success of French tramway schemes is not possible in Britain under current public transport policy. A unique blend of shared financing, committed politics, and integrated planning have come together to make French tramway systems the success stories that they are. If the success witnessed in France is to make its way to this side of the Channel, significant shifts in government policy, funding, and legislation will be needed.
From financing arrangements to system integration and from politic championing to fare policy, this report examines the fundamental principles and processes behind the development of French tramway schemes, and it seeks to explain why the success achieved by French schemes has not been experienced in Britain. The report highlights, in particular, the influence that dedicated funding, a strong political figurehead, and an integrated approach to land use and transport planning have had in France.
Perhaps the most critical element in the French success has been the introduction of a payroll tax dedicated to local public transport. Levied since the early 1980s by the Local Transport Authority on all businesses – public or private – with more than nine employees, the versement transport (or transport tax) has been integral to the funding of tramway infrastructure and operations in France. The tax, which can be up to 1.75% of a company’s payroll, feeds local authorities with millions of euros that can be used exclusively for the development and operation of public transport. For a city like Lyon, which has a population of roughly 1.4m, that translates to more than £100m each year.
With the versement transport providing the funding to construct a tramway, the local authority needs political support to carry through the project. Contrary to some common beliefs, not all French citizens have an innate fondness for the tramway. Almost without exception, any proposal for a city’s first tramway line meets with strong objections from the public. A local leader and figurehead is needed to carry the responsibility for delivering the project. In France, that leader is the mayor, and it’s the mayor who often champions a project on the back of an election campaign. ‘If you vote for me, I’ll build you a tramway!’ Then, the voters decide whether they want that mayor – and his tramway pledge.
With money and commitment, the project can develop. And as it does, it takes on a multi-disciplinary approach. Another successful trait of French tramway systems has been the view that a public transport project cannot stand alone within a city. Its development relies on integration with land use policy and a greater coordination of all transport modes, from pedestrians to heavy rail. Furthermore, French cities combine the introduction of a tramline with the opportunity to pedestrianise their city centres, to reorganise the local road network and hierarchy, and – some might say most importantly – to restructure the underlying bus network to support, not compete with, the tramway.
Of course, the success of a tramway requires more than this three-prong approach, more than money, commitment, and planning. However, these three elements are what separate the French schemes from the British. It is these traits that are not so easily replicated within the UK. But if the type of success experienced in France is what is wanted by British tramway scheme supporters, perhaps the British approach needs to adapt, to widen its view, and to accept fundamental shifts in current policy.

FINAL REPORT SOUTH YORKSHIRE PASSENGER TRANSPORT EXECUTIVE
COMPARATIVE PERFORMANCE DATA FROM FRENCH TRAMWAYS SYSTEMS
SEMALY & FaberMaunsell 4/41 December 2003
1. INTRODUCTION
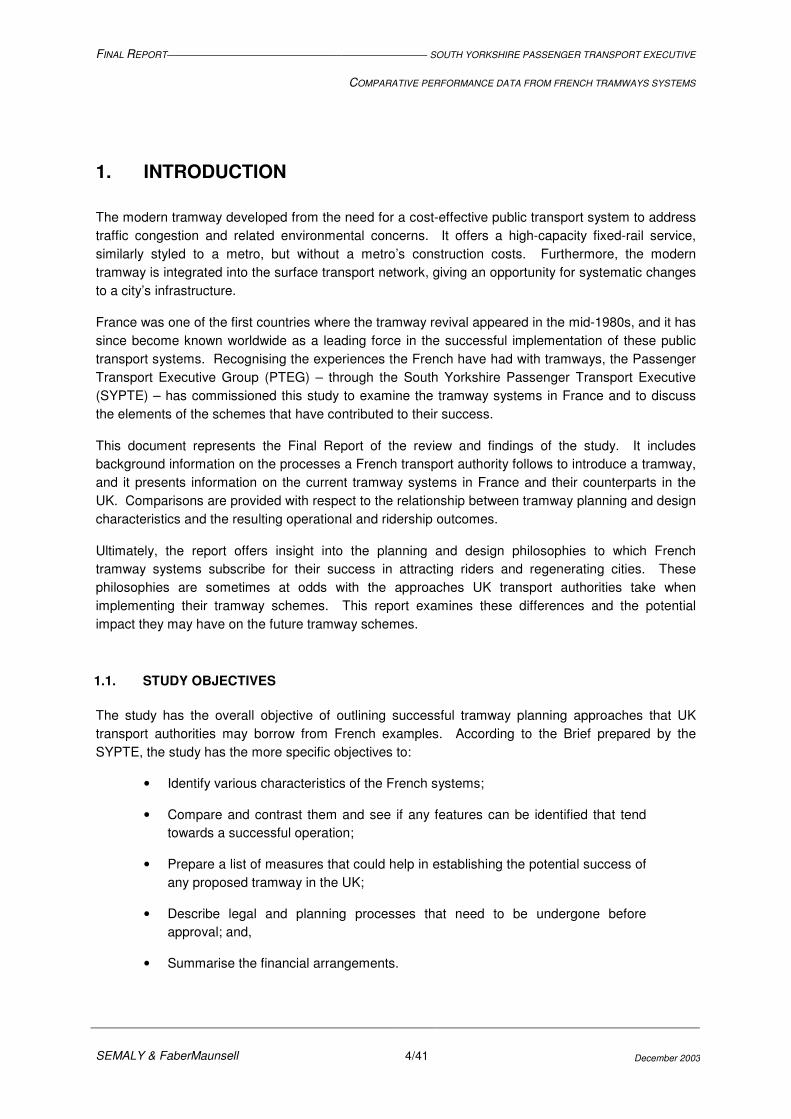
The modern tramway developed from the need for a cost-effective public transport system to address traffic congestion and related environmental concerns. It offers a high-capacity fixed-rail service, similarly styled to a metro, but without a metro’s construction costs. Furthermore, the modern tramway is integrated into the surface transport network, giving an opportunity for systematic changes to a city’s infrastructure.
France was one of the first countries where the tramway revival appeared in the mid-1980s, and it has since become known worldwide as a leading force in the successful implementation of these public transport systems. Recognising the experiences the French have had with tramways, the Passenger Transport Executive Group (PTEG) – through the South Yorkshire Passenger Transport Executive (SYPTE) – has commissioned this study to examine the tramway systems in France and to discuss the elements of the schemes that have contributed to their success.
This document represents the Final Report of the review and findings of the study. It includes background information on the processes a French transport authority follows to introduce a tramway, and it presents information on the current tramway systems in France and their counterparts in the UK. Comparisons are provided with respect to the relationship between tramway planning and design characteristics and the resulting operational and ridership outcomes.
Ultimately, the report offers insight into the planning and design philosophies to which French tramway systems subscribe for their success in attracting riders and regenerating cities. These philosophies are sometimes at odds with the approaches UK transport authorities take when implementing their tramway schemes. This report examines these differences and the potential impact they may have on the future tramway schemes.
1.1. STUDY OBJECTIVES
The study has the overall objective of outlining successful tramway planning approaches that UK transport authorities may borrow from French examples. According to the Brief prepared by the SYPTE, the study has the more specific objectives to:
• Identify various characteristics of the French systems;
• Compare and contrast them and see if any features can be identified that tend towards a successful operation;
• Prepare a list of measures that could help in establishing the potential success of any proposed tramway in the UK;
• Describe legal and planning processes that need to be undergone before approval; and,
• Summarise the financial arrangements.
FINAL REPORT SOUTH YORKSHIRE PASSENGER TRANSPORT EXECUTIVE
COMPARATIVE PERFORMANCE DATA FROM FRENCH TRAMWAYS SYSTEMS
SEMALY & FaberMaunsell 5/41 December 2003
1.2. HISTORY OF FRENCH TRAMS
Tramways – in their modern incarnation – made their appearance in the 1970s. Cities in North America and Europe were examining alternatives to support a better-balanced transport system to combat the ever-growing impacts of automobile congestion. One solution was the modern tramway – the successor of the traditional streetcar-type tramway prevalent throughout Europe in the early 20th century.
In France, the tramway was a departure from the trend through the 1970s, where heavy-rail metros were constructed to augment public transport systems in cities like Lyon, Lille, Marseille, and Toulouse. Transport authorities found that metro development applied severe financial implications – new metro construction costs in the range of �100 million per kilometre (2003 figure). A tramway was a more affordable fixed-rail transit service alternative.
Additionally, most cities in France did not have the population and transit patronage rates that would justify the introduction or expansion of a metro, which can carry up to 20,000 passengers per hour per direction (pphpd). However, these cities would be suitable candidates for an intermediate capacity tramway, where passenger demand could be below 4,000 pphpd.
Furthermore, the development of a surface-level fixed rail transit service offered the chance to reassign the streetscape. Roadspace that had been dedicated to private automobiles could be recaptured and converted to tramway, while the adjacent footpaths could be redesigned to fall in line more with the new transit-oriented, pedestrian-friendly theme of the corridor. In essence, the streets would be reverted to the streets of early in the century where tramway travel and walking were the preferred ways of getting about.
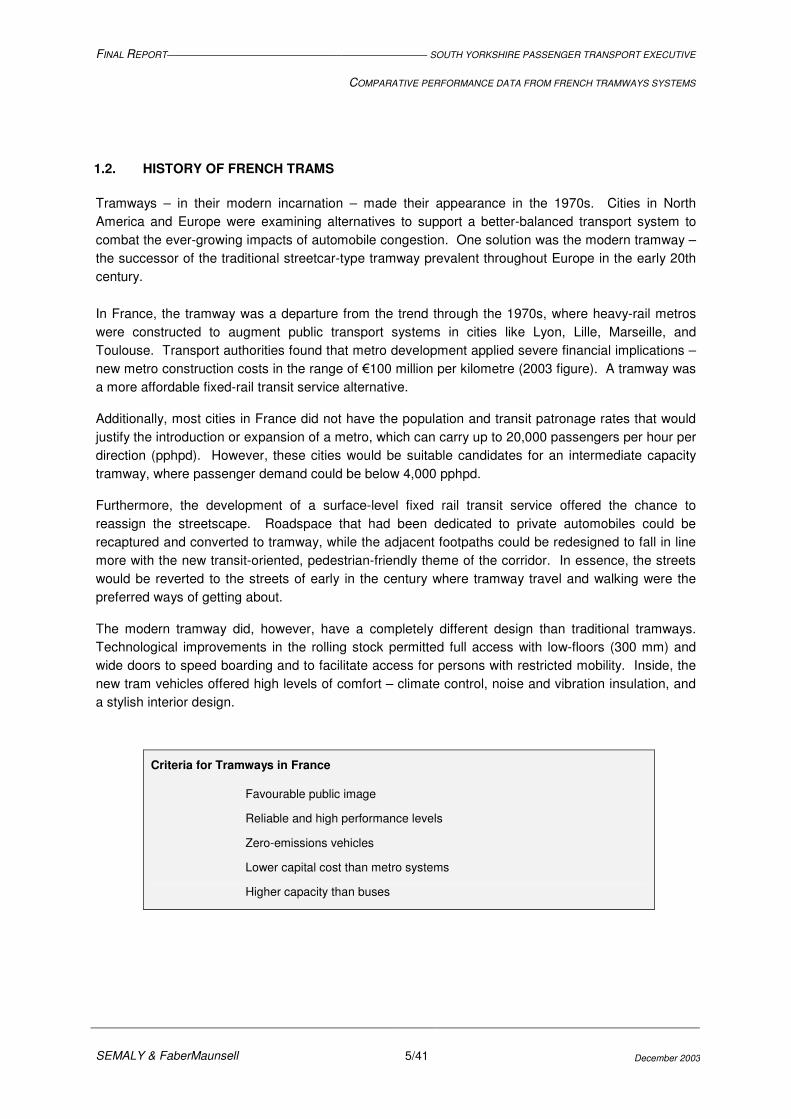
The modern tramway did, however, have a completely different design than traditional tramways. Technological improvements in the rolling stock permitted full access with low-floors (300 mm) and wide doors to speed boarding and to facilitate access for persons with restricted mobility. Inside, the new tram vehicles offered high levels of comfort – climate control, noise and vibration insulation, and a stylish interior design.
Criteria for Tramways in France
Favourable public image
Reliable and high performance levels
Zero-emissions vehicles
Lower capital cost than metro systems
Higher capacity than buses
FINAL REPORT SOUTH YORKSHIRE PASSENGER TRANSPORT EXECUTIVE
COMPARATIVE PERFORMANCE DATA FROM FRENCH TRAMWAYS SYSTEMS
SEMALY & FaberMaunsell 6/41 December 2003
The integration of the modern tramway into the cityscape was also different than traditional tramways. Dedicated lanes allowed tram vehicles the advantage of operating independent of automobile traffic, which provided reliable operations and high commercial speeds. At junctions, a progressive traffic regulation strategy provides priority to tram vehicles. A potential compatibility with suburban railway networks could permit future links between systems and offer an enlarged passenger catchment area.
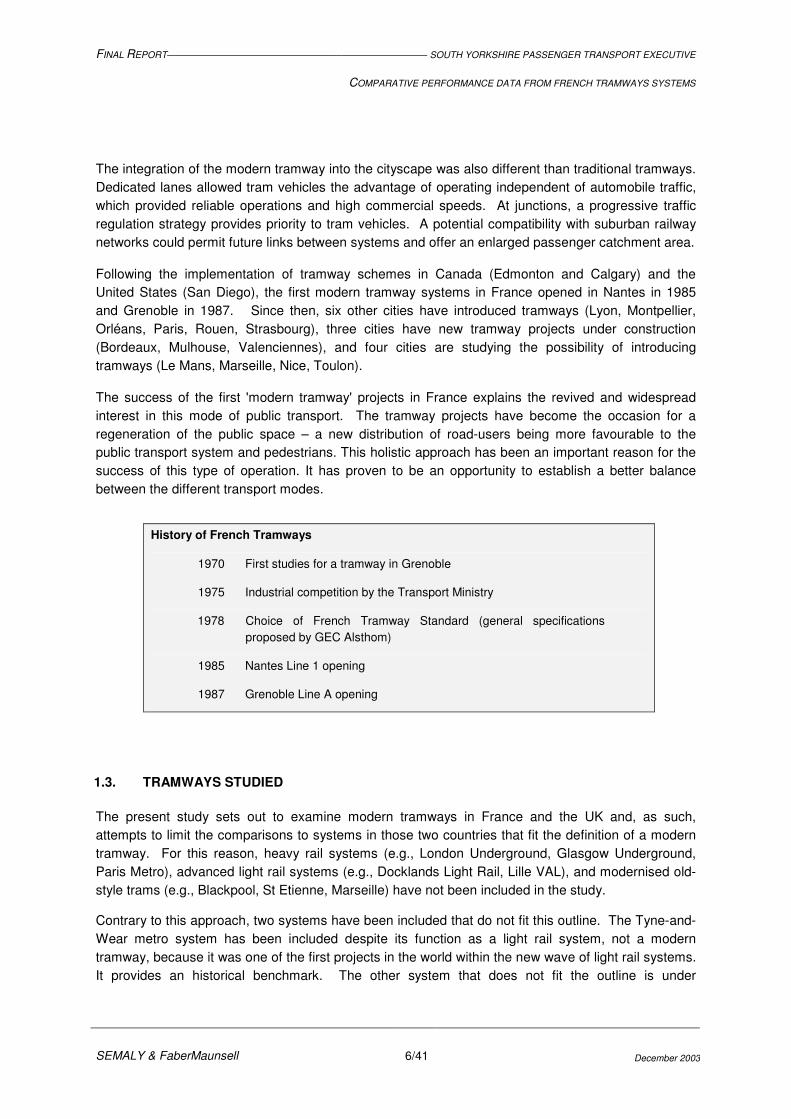
Following the implementation of tramway schemes in Canada (Edmonton and Calgary) and the United States (San Diego), the first modern tramway systems in France opened in Nantes in 1985 and Grenoble in 1987. Since then, six other cities have introduced tramways (Lyon, Montpellier, Orléans, Paris, Rouen, Strasbourg), three cities have new tramway projects under construction (Bordeaux, Mulhouse, Valenciennes), and four cities are studying the possibility of introducing tramways (Le Mans, Marseille, Nice, Toulon).
The success of the first 'modern tramway' projects in France explains the revived and widespread interest in this mode of public transport. The tramway projects have become the occasion for a regeneration of the public space – a new distribution of road-users being more favourable to the public transport system and pedestrians. This holistic approach has been an important reason for the success of this type of operation. It has proven to be an opportunity to establish a better balance between the different transport modes.
History of French Tramways
1970 First studies for a tramway in Grenoble
1975 Industrial competition by the Transport Ministry
1978 Choice of French Tramway Standard (general specifications proposed by GEC Alsthom)
1985 Nantes Line 1 opening
1987 Grenoble Line A opening
1.3. TRAMWAYS STUDIED
The present study sets out to examine modern tramways in France and the UK and, as such, attempts to limit the comparisons to systems in those two countries that fit the definition of a modern tramway. For this reason, heavy rail systems (e.g., London Underground, Glasgow Underground, Paris Metro), advanced light rail systems (e.g., Docklands Light Rail, Lille VAL), and modernised old-style trams (e.g., Blackpool, St Etienne, Marseille) have not been included in the study.
Contrary to this approach, two systems have been included that do not fit this outline. The Tyne-and-Wear metro system has been included despite its function as a light rail system, not a modern tramway, because it was one of the first projects in the world within the new wave of light rail systems. It provides an historical benchmark. The other system that does not fit the outline is under

FINAL REPORT SOUTH YORKSHIRE PASSENGER TRANSPORT EXECUTIVE
COMPARATIVE PERFORMANCE DATA FROM FRENCH TRAMWAYS SYSTEMS
SEMALY & FaberMaunsell 7/41 December 2003
construction in Dublin, which lies outside the geographic area of the study. However, because it is considered a modern tramway, limited information for the system has been included in this study.
In total, eight systems in France, one in Ireland, and six systems in the United Kingdom have been examined (see table below). The Appendix includes datasheets for each of the systems in the present study. The datasheets include details of the systems, as well as photos and maps of the networks.
Modern Tramway Systems Studied
France
Grenoble Ile de France (Paris) Lyon Montpellier Nantes Orléans Rouen Strasbourg
Ireland
Dublin
United Kingdom
Croydon Manchester Nottingham Sheffield Tyne-and-Wear * West Midlands
* Tyne-and-Wear is a light metro system but has been included for comparative purposes.
1.4. BACKGROUND DOCUMENTS & RESEARCH
Through the early stages of the study, stakeholders and participants suggested previous reports that could relate to the current study. The thought was that these reports were similar in nature to either offer insight for our study or they would be good reference material as to the development of tramways in Europe. A brief summary of the documents is provided below. For more information, readers are encouraged to access the full document.
Babalik-Sutcliffe, Ela. Urban Rail Systems: Analysis of the Factors Behind Success. Transport Reviews, Vol. 22, No. 4, p. 415-447: 2002.
This study investigated planning background and operational policies that contribute to the successful introduction of light rail transit systems in North American and UK cities. It was aimed at UK and Turkish transport authorities and, thus, selected case studies that could be appropriate for comparisons: Miami, Sacramento, St Louis, and San Diego in the US; Vancouver in Canada; and Manchester, Sheffield, and Tyne-and-Wear in the UK.
The study concluded that the urban form of the city and integrated transit and land-use planning were two critical factors of light rail success. Dense urban corridors with strong attractors were considered to be sound bases for fixed-rail implementation, benefiting in the long-term from land-use policies linked to the transit corridors. However, these policies may have “very limited effects in urban areas that are extremely car-oriented and very hostile to public transport.”
FINAL REPORT SOUTH YORKSHIRE PASSENGER TRANSPORT EXECUTIVE
COMPARATIVE PERFORMANCE DATA FROM FRENCH TRAMWAYS SYSTEMS
SEMALY & FaberMaunsell 8/41 December 2003
Additionally, the paper establishes that integrated operations policies are key factors for attracting riders to the new systems. These policies – including bus network support and integrated fare structures – are much more prevalent in North America (where transit services are operated by the local transport authority) than in the UK (which has deregulated and privatised transit).
Hylén, Bertil and Tim Pharoah. Making Tracks – Light Rail in England and France. Swedish National Road and Transport Research Institute, Linkoping, Sweden: March 2002.
This research report, written by the Swedish National Road and Transport Research Institute (Statens väg- och transportforskningsinstitut, VTI), is a follow-up to a report that outlined the reintroduction of tramways into French cities. The more recent report summarises the main points concerning the policies and background of light rail developments and discusses case studies in England (Birmingham, Croydon, Manchester, Sheffield) and France (Lyon, Marseille, Montpellier).
The authors extract the short-comings of the English systems – namely, the impacts of bus deregulation and a limited outlook on integrating land use and transport – but cannot provide substantial discussion of the French systems because the examples they chose for the report are not long-established. For both countries, the emphasis of the report is on planning and political issues rather than detailed information on the alignments and operations.
Mackett, R L and Babalik Sutcliffe, E (2003) New urban rail systems: a policy-based technique to make them more successful, Journal of Transport Geography, 11, 151-164.
This paper studies eight urban rail systems to create a series of objectives for systems to meet in order to make them more successful. Three of the systems studied are in the UK, namely Manchester, Tyne and Wear and Sheffield, with the remaining five systems from the US and Canada. It is acknowledged that there has been a growth in the number of systems around the world but that there is criticism that these new systems are not meeting the objectives set for them nor are they meeting the expected levels of patronage.
The paper identifies that there are some key similarities in the main objectives for constructing such systems, namely to:
• Reduce traffic congestion; • Improve public transport; • Stimulate development; • Improve access to city centre; and, • Improve the environment.
In analysing the degrees of achievements of success of the eight systems, the following criteria were applied:
• Have high patronage;

FINAL REPORT SOUTH YORKSHIRE PASSENGER TRANSPORT EXECUTIVE
COMPARATIVE PERFORMANCE DATA FROM FRENCH TRAMWAYS SYSTEMS
SEMALY & FaberMaunsell 9/41 December 2003
• Build and operate the system cost-effectively; • Increase public transport usage; • Reduce traffic congestion and environmental problems; and, • Improve the land use and urban growth patterns.
In the assessment, Manchester was shown to come out the highest of the UK systems.
It is shown that the factors and policies that most influence the success of a system are the:
• Physical characteristics of the urban areas; • Socio economic characteristics of the urban areas; • Route location; • Cost; • Operating policies; • Transport planning policies; and • Urban planning policies.
The paper concludes by suggesting it is possible to enhance the success of schemes by the careful use of suitable policies. The schemes shown to be most successful are those that have used policies successfully to enhance the success of the systems and those that have come out the worse appear to have done so because the supporting policy infrastructure has been poor.
(Note: This report is based on work done by Ela Babalik Sutcliffe in her 2002 paper Urban Rail Systems: Analysis of the Factors Behind Success outlined above.)
Mackett, R L and Edwards M (1996) Guidelines for planning a new urban public transport system. Proceedings of the Institution of Civil Engineering: Transport , 117, 193-201 (1996).
This paper examines the decision-making process surrounding the development of new urban public transport systems in the UK. The main objectives for most systems are summarised as:
• Obtain funding; • Keep the costs down; and • Maximise patronage.
The main conclusions, as drawn from the relationship between the factors and objectives, are as follows:
• It is necessary to have a political consensus and local support for the system; strong leadership may aid this.
• Early decisions should be made as to whether to use government funding.

FINAL REPORT SOUTH YORKSHIRE PASSENGER TRANSPORT EXECUTIVE
COMPARATIVE PERFORMANCE DATA FROM FRENCH TRAMWAYS SYSTEMS
SEMALY & FaberMaunsell 10/41 December 2003
• Large-scale systems will almost inevitably require funding, but small systems may be developed more easily without it.
• Traffic restraint and development incentives increase the chances that the system will be built and will have a positive impact.
• Rail alignments should only used if they form part of a viable transport corridor.
• A positive image for the system is crucial to its success.
• Innovative technology should only be used if it helps fulfil a particular transport need or satisfies a constraint / need of the system.
Study of European Best Practice in the Delivery of Integrated Transport – Summary Report. Prepared by WS Atkins, Surrey, UK: November 2001.
The Centre for Integrated Transport commissioned this report to compare the British and European approaches to integrated transport and the reasons for European success. The ultimate objectives included an assessment of how success on the Continent could be transferred to the UK, similar to the objectives of the current SYPTE Tramway Study.
The report uses case studies to extract its points – Achterhoek, Netherlands; Barcelona, Spain; Graz, Austria; Munich, Germany; Stuttgart, Germany. It includes factors for the success in Europe, but it does not specifically include discussions of light rail or tramways. Tramways are mentioned only in the context of providing an integrated transport system. (The full report may address tramways in more detail.)
Taplin, Michael. The History of Tramways and Evolution of Light Rail. Light Rail Transit Association, Coventry, UK: 1998. (Source: www.lrta.org/mrthistory.html)
This article from the LRTA recounts the historical development of light rail transit systems around the world, from the first systems in the 1800s through the decline of public transport systems in the mid-1900s to the renaissance of light rail schemes of the 1980s to today. It includes discussions of systems in Europe, North America, Australasia and Asia, and Africa. The article does not include technical information on the systems, nor does it attempt to identify factors contributing to light rail success.
FINAL REPORT SOUTH YORKSHIRE PASSENGER TRANSPORT EXECUTIVE
COMPARATIVE PERFORMANCE DATA FROM FRENCH TRAMWAYS SYSTEMS
SEMALY & FaberMaunsell 11/41 December 2003
2. PROCESSES OF A FRENCH TRAMWAY PROJECT
With 20 years experience implementing modern tramway systems, the French transport authorities have a well-defined organisational structure when it comes to the processes surrounding tramways. This section outlines the principal characteristics of the main processes most often followed in France today 1, including political, legal, planning, financial, and procurement and commissioning processes.
2.1. POLITICS OF TRAMS
The Local Authority is the principal decision-making body involved in public transport projects, such as tramways, and it represents a pool of municipalities from within the metropolitan area. One important task, the Local Authority creates and modifies the urban transport area, for which the Authority establishes the Urban Local Transport Plan – called a Plan de déplacements urbains (PDU) in French – which was established by the LePage Act for air quality.
For individual transport projects, the Local Authority’s main powers lie in the selection of the choice of investments and the definition of the bid. As well, the Authority takes charge of selecting and securing the public transport operators of their network.
The Mayor’s Role
Mayors in France are selected by general elections every six years. Often in larger cities, the mayor makes a commitment to implement a tramway scheme, or an extension to an existing tramway, as part of his or her election campaign. Voters are then encouraged to consider the possible tramway project when voting for the candidates.
When elected, the mayors who promise tramways have strong powers to ensure the project goes forward. They have the ability to dedicate funds to the project and to support the project through the planning process – powers that are much stronger than in Britain.
The schedule can be tight on these projects, however, as the mayor usually mandates that the project be completed in time for the next round of elections – proof of the mayor’s commitment to holding election promises. So much is the schedule tied to election dates, that you can often guess the election year by looking at the completion dates of French tramway schemes!
The Local Authority is supported in its transport projects by three different levels of decision-makers, each selected through general elections:
• The state (national) government and its Transport Ministry define the regulations and control their application, especially regarding safety. If they approve the scheme, they subsidise the construction cost in the region of 20% of the overall
1 Except in Ile de France (Paris), Grenoble Line B, and Rouen, where unique processes have been followed.

FINAL REPORT SOUTH YORKSHIRE PASSENGER TRANSPORT EXECUTIVE
COMPARATIVE PERFORMANCE DATA FROM FRENCH TRAMWAYS SYSTEMS
SEMALY & FaberMaunsell 12/41 December 2003
capital cost. (Apart from the Paris region, the state government does not contribute money to cover operating costs of local public transport.)
• The regional government (22 regions in France) is responsible for inter-city rail transport in its area; and,
• The county (département) government (96 counties in France) is responsible for suburban transport, mainly the transport of school pupils and certain coach lines.
2.2. LEGAL ISSUES
Several legal requirements dictate the approval of a French tramway scheme. The regulations are instituted by the state government and are applied equally to prospective tramway projects around the country. The main legal procedures for the implementation of a tramway project are outlined below. All these procedures are the responsibility of the Transport Authority who must conduct the corresponding studies.
• Initial public consultation – The goal of this preliminary step is to collect thoughts and needs of the people and their communities, especially those directly affected by the project, such as people who live along the route and public transport users. At this stage, the project can be vague – the specific mode for the corridor could be undefined, as could the precise route and the stop locations – but the study area and proposed corridor will have been selected from planning studies and the experiences of leading participants.
• Urban Local Transport Plan (Plan de déplacements urbains) – The project must be integrated into an approved Urban Local Transport Plan in order to show the consistency of the project with the general organisation of the transport systems in the city. In the same way, the Transport Authority must demonstrate compatibility with the Urban Master Plan (Schéma directeur).
• Public inquiry – After the preliminary study, people can again give their advice and provide comments on the project. The Transport Authority must provide supporting information for members of the public to review. A Board of Inquiry, nominated by the Administrative Court and thus free of links from the Transport Authority, provides formal conclusions based on public feedback and the supporting information, and these conclusions are binding for the further decision of awarding the powers.
This Inquiry is an open process which lasts between one and two months, in which objectors can raise any concern they may have regarding the promoted scheme. If the conclusions of the Board of Inquiry are unfavourable, the Transport Authority must modify the project or seek an approval before the highest administrative jurisdiction, which is called the Conseil d’Etat, which would extend the duration the statutory process by at least one year.
FINAL REPORT SOUTH YORKSHIRE PASSENGER TRANSPORT EXECUTIVE
COMPARATIVE PERFORMANCE DATA FROM FRENCH TRAMWAYS SYSTEMS
SEMALY & FaberMaunsell 13/41 December 2003
In general, a public inquiry process in France is similar to one in the UK, although the interpretation through the enquiry is often different. The power of French citizens to block a tramway project through the inquiry is often weaker than in the UK. The Board of Inquiry will often grant a favourable decision for a French tramway project even if it disrupts some residents and frontages provided that the project is seen to be in the public interest.
• Ministry of Transport approval - This agreement is necessary to obtain a grant, according to the rules decreed by the government. The local Transport Authority must produce a document that addresses the criteria set out in ministry guidelines; in particular, the project must be seen to benefit public transport.
• Planning permission for the depot – Necessary in France for every new building project.
• Operating authorisation – The Ministry of Transport is responsible for safety issues related to public transport, as well as other users of the public space: pedestrians, cyclists, and motorists. Its approval is necessary prior to operations starting. According to a new decree, formal safety approvals are now needed at three stages: main approval decision (financial grant), before the beginning of the construction works, and before the commencement of revenue service.
The key process is the Public Inquiry and the grant of the subsequent Déclaration d’Utilité Publique. This gives to the Public Transport Authority the right to carry out the Works and to purchase the properties that have been individually referenced in the file submitted to the Inquiry.
Legal requirements also affect the manner in which the implementation of a tramway project is executed. A project may be organised in two legally acceptable ways: the Transport Authority may select an engineering company to manage the project; or the Authority may tender a design, build, operate, and transfer (DBOT) scheme.
The usual way a French tramway is implemented is via a Maîtrise d’ouvrage publique (roughly translated as a Public Masterworks Project), which comprises the choice of an engineering company by the Transport Authority. This company is in charge of the overall project management from the design stage to the commissioning of the system – including design and engineering, procurement and contract management, work supervision, testing, and commissioning – for all technical components, such as civil works, track, rolling stock, utilities, and systems.
An option for this project organisation is the Maîtrise d’ouvrage déléguée, where the Transport Authority delegates a company to do its task, usually the operator of the public transport network. The Authority generally chooses this arrangement when the operator is a company that has at least 60% of its capital held by the Transport Authority itself (a société d’économie mixte, in French).
For the implementation of a Maîtrise d’ouvrage – publique or déléguée – the different contractors involved in construction (from 10 to 100 first tier contractors) are under the responsibility of the Transport Authority for all legal aspects and the engineering company for the technical aspects. Thus, in this scenario, most of the risk remains with the Transport Authority, although each contract introduces its own set of liability and penalty schemes.

FINAL REPORT SOUTH YORKSHIRE PASSENGER TRANSPORT EXECUTIVE
COMPARATIVE PERFORMANCE DATA FROM FRENCH TRAMWAYS SYSTEMS
SEMALY & FaberMaunsell 14/41 December 2003
Another way of organising the implementation of the tramway scheme is through a design, build, operate, and transfer (DBOT) contract whereby some of the associated project risks are transferred to the consortium bidding for the work. After a tendering process, the Transport Authority selects a consortium that is, in general, composed of a bank, an engineering company, infrastructure contractor, suppliers for rolling stock and systems, and an operator. To date, this way has only been chosen by Rouen and by Grenoble for Line B.
2.3. PLANNING PROCESS
In 1982, the French government mandated – through its Internal Transport Planning Law (Loi d’orientation sur les transports intérieurs) – that the local authorities would be responsible for establishing their transport policy, running the urban public transport network, and implementing new schemes if any. Along with the transfer of this competency, the local authorities were given the financial tool to finance their public transport policy through the Versement transport (described later in this section). This plan was initiated to help deal with ecological problems, such as air pollution, noise, and traffic congestion, by forcing municipalities to think about and organise their transport policies, projects, and plans.
The importance of the PDU was amplified in 1996 when the Clean Air Act (Loi sur l’air) made PDUs mandatory for French cities with over 100,000 inhabitants and imposed a favourable policy towards public transport systems in order to obtain a reduction in car traffic. This policy supported cities and the measures they could take to develop public transport and limit the use of cars in the short and medium terms as a means to reducing the amount of car-generated emissions.
Cities have a host of options they could implement under this favourable policy: restrict traffic; transform spaces dedicated to cars into areas for public transport, bicycles, and pedestrians; or introduce elements through the Local Urbanism Plan – Plan local d’urbanisme (PLU) – that act to regulate land use and can, for example, fix the number of parking spaces to construct according to the number of residential units or office space constructed in a new building. The principal goal of each of these approaches is to reduce the amount of trips individuals make by private automobiles.
Tramway Planning – The French Approach
Tramway schemes in France strive to present the tramway as a high-level transport service that is attractive to transit riders. The tramway is not hidden in off-street segregated alignment; it is brought into the street where the roadspace can be reshaped to promote public transport and pedestrians over cars.
The French approach tramway planning from the perspective of offering a service that passengers will enjoy. A tramway is seen as the next natural step of transit service in a city, constructed in corridors with high existing public transport demand. In order to continue to serve this demand, a tramway offers a more comfortable, high capacity alternative to bus services, which is more cost-effective to operate.
To further advance the public transport network, bus services are reorganised to support the tramway line by providing feeder service between the tramway stops and the nearby
FINAL REPORT SOUTH YORKSHIRE PASSENGER TRANSPORT EXECUTIVE
COMPARATIVE PERFORMANCE DATA FROM FRENCH TRAMWAYS SYSTEMS
SEMALY & FaberMaunsell 15/41 December 2003
neighbourhoods. In this sense, the tramway is set up to form the backbone of the city’s transit network – a backbone from which the entire public transport network can be restructured.
Integration of the tramway into the existing streetscape – as opposed to off-street segregated running – means that the tramway not only receives a high profile within the city, but the reassignment of the roadspace necessary to accommodate the tramway resets the traffic hierarchy. Public transport and pedestrians displace automobile traffic from the city centres to the ring roads.
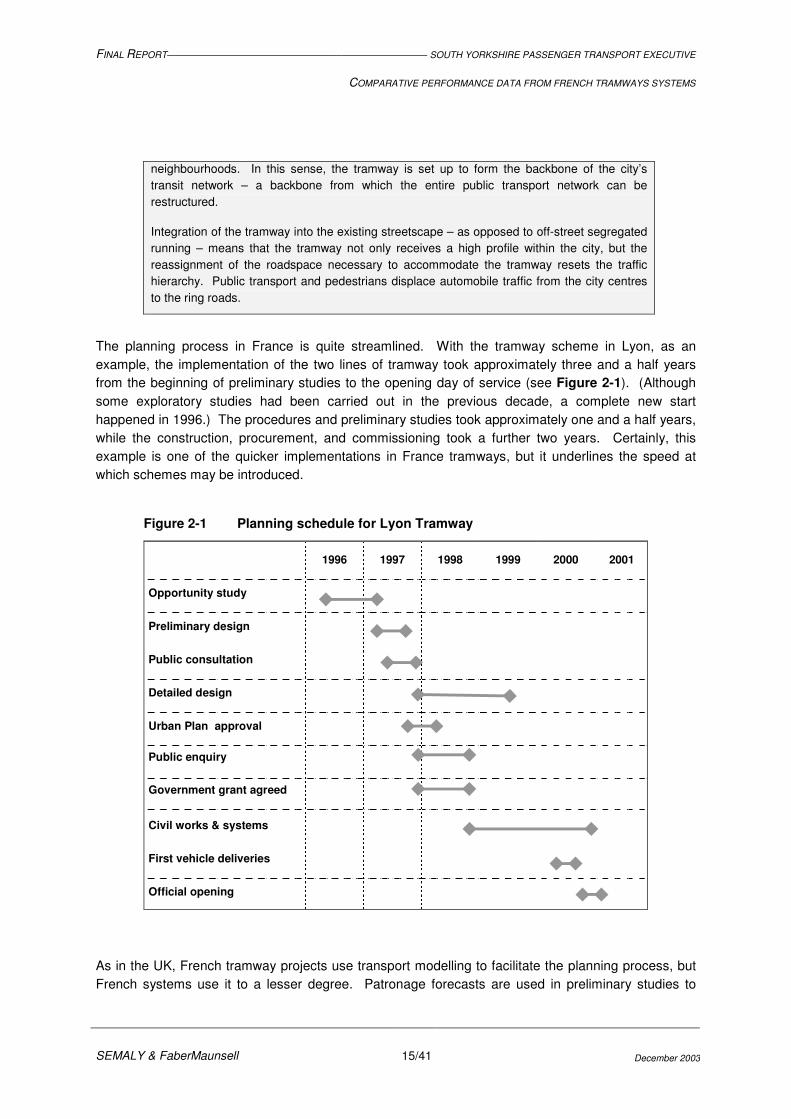
The planning process in France is quite streamlined. With the tramway scheme in Lyon, as an example, the implementation of the two lines of tramway took approximately three and a half years from the beginning of preliminary studies to the opening day of service (see Figure 2-1). (Although some exploratory studies had been carried out in the previous decade, a complete new start happened in 1996.) The procedures and preliminary studies took approximately one and a half years, while the construction, procurement, and commissioning took a further two years. Certainly, this example is one of the quicker implementations in France tramways, but it underlines the speed at which schemes may be introduced.
Figure 2-1 Planning schedule for Lyon Tramway
1996 1997 1998 1999 2000 2001
Opportunity study
Preliminary design
Public consultation
Detailed design
Urban Plan approval
Public enquiry
Government grant agreed
Civil works & systems
First vehicle deliveries
Official opening
As in the UK, French tramway projects use transport modelling to facilitate the planning process, but French systems use it to a lesser degree. Patronage forecasts are used in preliminary studies to
FINAL REPORT SOUTH YORKSHIRE PASSENGER TRANSPORT EXECUTIVE
COMPARATIVE PERFORMANCE DATA FROM FRENCH TRAMWAYS SYSTEMS
SEMALY & FaberMaunsell 16/41 December 2003
justify the selection of a tramway as the preferred mode for a public transport corridor – over, say, a trolleybus or guided bus. If the forecasted patronage is weak (below 30,000 passengers per day for a traditional tramway line of about a dozen kilometres), the project will find it difficult to defend why a tramway should be constructed in a corridor that could be adequately served by a bus line.
Furthermore, modelling is not used to estimate the impact that a tramway project might have on automobile traffic volumes and their routings. The implementation of a tramway project is an element of the Plan de déplacements urbains (PDU), which has the objective to reduce automobile traffic. It is, therefore, in theory, not necessary to re-accommodate all the automobile traffic within the post-tramway highway network. In reality, however, a review verifies that the highway network can provide alternative routes for cars displaced by the tramway project.
In Lyon, for example, tramway line T2 was constructed along Avenue Berthelot, which carried 4,000 vph in the peak hour and a daily volume of 45,000 before the tramway project. Since the tramway line was constructed, the cross-section of the street has been reduced from four lanes to two and the peak hour volume has declined to 2,000 vph.
This result was intentional. Everybody agreed that the heavy traffic had transformed the street into an autoroute with the problems of pollution, noise, and safety. The idea of the tramway project was to force road traffic to reroute to the city bypass, a detour that would likely increase journey times for road traffic and discourage automobile use. This concept supports the objective of the PDU to reduce car traffic.
2.4. FINANCIAL SITUATION
French tramways are financed from an assortment of resources. The money needed to build and operate a tramway scheme is balanced by contributions from the government, the local authorities, local companies, and the passengers themselves. Figure 2-2 below outlines the sources of nation-wide revenue and the breakdown of how the money is spent. In general, four sources of financing are available in France:
• The state government contributes only to the capital costs of tramway schemes, not to the operations of the systems (except in the greater Paris region). This contribution is presently calculated as up to 35% of the capital costs of the project (excluding design and project administration costs, utilities diversion, highway improvement, land acquisitions, and rolling stock purchase, which are paid for entirely by the Transport Authority). The government contribution is limited to a maximum of �4.5 million for every line-kilometre of tramway. (This contribution is likely to disappear from 2004, according to the announcements recently made by the government.)
• Utilities diversion costs are funded both through the project and by private companies. If the utility is owned by the municipality, then the tramway sponsor (as part of the municipality) will pay for the diversion of that utility. Water supply, sewage, and central heating are publicly owned utilities in France. For private utilities (electricity, gas, telephone...), the private owners of those utilities are

FINAL REPORT SOUTH YORKSHIRE PASSENGER TRANSPORT EXECUTIVE
COMPARATIVE PERFORMANCE DATA FROM FRENCH TRAMWAYS SYSTEMS
SEMALY & FaberMaunsell 17/41 December 2003
responsible for the diversion of the utility and its cost. A judicial precedent prescribes this responsibility.
• The Transport Authority is financed directly by the municipalities that are served by it.
• The versement transport (transport tax), a specific tax dedicated to financing public transport, is levied on companies based on the company payroll. The money generated goes directly to the Transport Authority. The UK does not have an equivalent system of dedicated taxation.
• Nationally in France, passengers themselves contribute almost one-quarter of the annual investment and operations financing through fare box revenues.
Figure 2-2 National Annual Public Transport Revenue & Expenses
�����
� � �
� � � ���
� � �
� � �� �� � ������
� � �
� � ��� ��
� � �
� � ��� � ��
� � �
� �� �� �� �� �� � � � ��� � � ��� � �
Revenues Expenses
4.3 billionEuros
(except Ile de France)
������������ ��� ����� ���� ���������������� ����� �����
! � �� � � � �
This is a global table, corresponding to the accounts of the PTA called the Compte transport. In essence, the PTA has to fund the operating losses of their network plus their investment program. They receive subsidies from the central government for their investment program, but not for their operations. To finance the global deficit, the PTA uses three different sources: money borrowed from the banks to cope with the investment program, the outcome of the versement transport, and the contributions by the local authorities that are member of the PTA. The recurrent money coming from the VT and the local authorities allows the PTA to reimburse their loans in the long term.
2.4.1. Versement transport
The most important source of funding for the implementation of tramway projects is the versement transport (transport tax, in English), or VT for short. The VT was introduced by the federal government in 1982 as a way of breathing new life into public transport in France through a dedicated
FINAL REPORT SOUTH YORKSHIRE PASSENGER TRANSPORT EXECUTIVE
COMPARATIVE PERFORMANCE DATA FROM FRENCH TRAMWAYS SYSTEMS
SEMALY & FaberMaunsell 18/41 December 2003
tax to increase the amount of revenue for public transport. Such a tax – one dedicated wholly and exclusively to public transport – has no equivalent in Britain.
The VT is only an option available to local municipalities interested in generating additional funds for public transport; it is not mandatory for the Transport Authority to charge this tax. However, when charged, it is calculated on employees’ wages (gross salary) – but paid only by the employer – at a rate chosen by the local authority that does not exceed the maximum stipulated by the VT legislation.
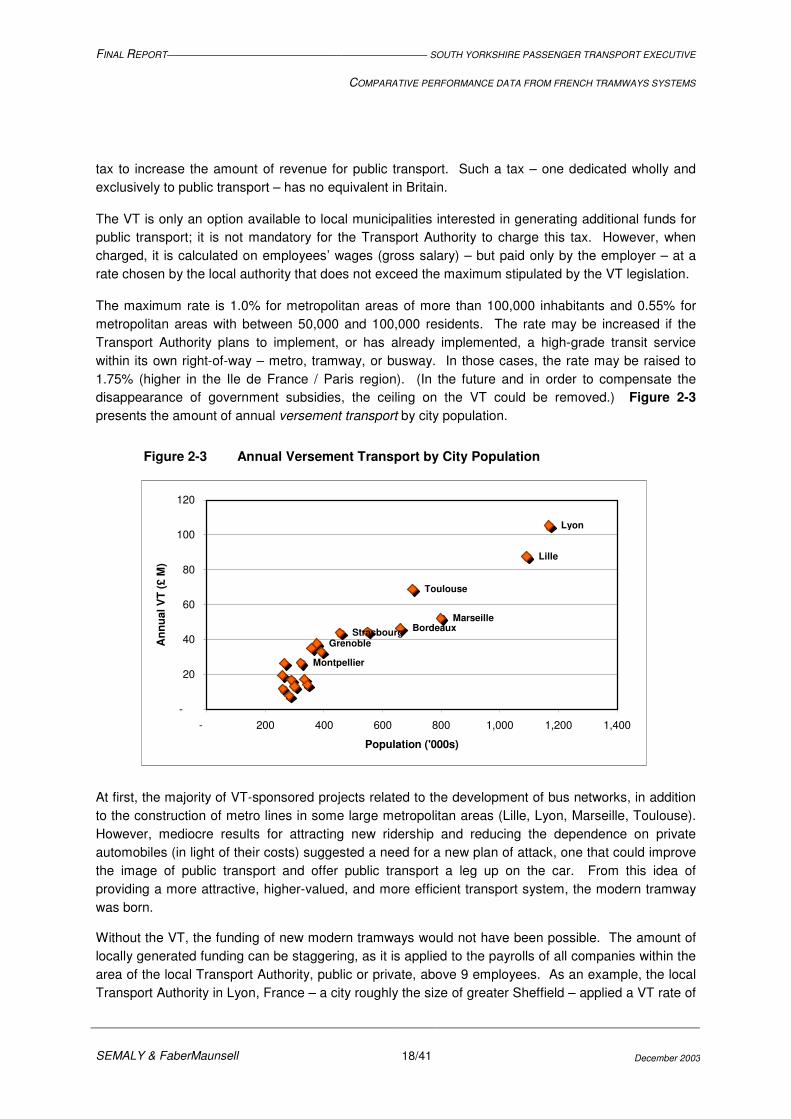
The maximum rate is 1.0% for metropolitan areas of more than 100,000 inhabitants and 0.55% for metropolitan areas with between 50,000 and 100,000 residents. The rate may be increased if the Transport Authority plans to implement, or has already implemented, a high-grade transit service within its own right-of-way – metro, tramway, or busway. In those cases, the rate may be raised to 1.75% (higher in the Ile de France / Paris region). (In the future and in order to compensate the disappearance of government subsidies, the ceiling on the VT could be removed.) Figure 2-3 presents the amount of annual versement transport by city population.
Figure 2-3 Annual Versement Transport by City Population
Montpellier
Grenoble Strasbourg Bordeaux
Marseille
Toulouse
Lille
Lyon
-
20
40
60
80
100
120
- 200 400 600 800 1,000 1,200 1,400
Population ('000s)
Ann
ual V
T (£
M)
At first, the majority of VT-sponsored projects related to the development of bus networks, in addition to the construction of metro lines in some large metropolitan areas (Lille, Lyon, Marseille, Toulouse). However, mediocre results for attracting new ridership and reducing the dependence on private automobiles (in light of their costs) suggested a need for a new plan of attack, one that could improve the image of public transport and offer public transport a leg up on the car. From this idea of providing a more attractive, higher-valued, and more efficient transport system, the modern tramway was born.
Without the VT, the funding of new modern tramways would not have been possible. The amount of locally generated funding can be staggering, as it is applied to the payrolls of all companies within the area of the local Transport Authority, public or private, above 9 employees. As an example, the local Transport Authority in Lyon, France – a city roughly the size of greater Sheffield – applied a VT rate of

FINAL REPORT SOUTH YORKSHIRE PASSENGER TRANSPORT EXECUTIVE
COMPARATIVE PERFORMANCE DATA FROM FRENCH TRAMWAYS SYSTEMS
SEMALY & FaberMaunsell 19/41 December 2003
1.63% in 1999, which generated over £105 million for investment and operations of public transport in that year alone (see Table 2-1). Applied over successive years, the amount of funding available to public transport can be impressive, and it explains how the schemes can be funded and operated with so little funding from the central government and with such low revenue from passengers.
Table 2-1 Versement Transport (VT) for Tramway Cities
City VT rate, 1999 (%)
Annual VT revenue, 1999 (£ M)
Cities with existing tramways
Grenoble 1.75 37.7
Lyon 1.63 105.5
Montpellier 1.75 26.6
Nantes 1.63 44.7
Orléans 1.75 26.5
Paris 0.80 – 2.20 * 1,524.3
Rouen 1.75 33.0
Strasbourg 1.75 43.9
Cities with tramways planned or under construction
Bordeaux 1.40 46.6
Marseille 1.75 52.3
Mulhouse 0.98 ** 9.4
Nice 1.20 14.2
Toulon 1.45 13.1
Toulouse 1.75 69.0
Valenciennes 1.75 17.3 * The VT rate fluctuates across regions of greater Paris. ** The VT rate in Mulhouse reflects conditions in 1999 before the city adopted its tramway scheme.
FINAL REPORT SOUTH YORKSHIRE PASSENGER TRANSPORT EXECUTIVE
COMPARATIVE PERFORMANCE DATA FROM FRENCH TRAMWAYS SYSTEMS
SEMALY & FaberMaunsell 20/41 December 2003
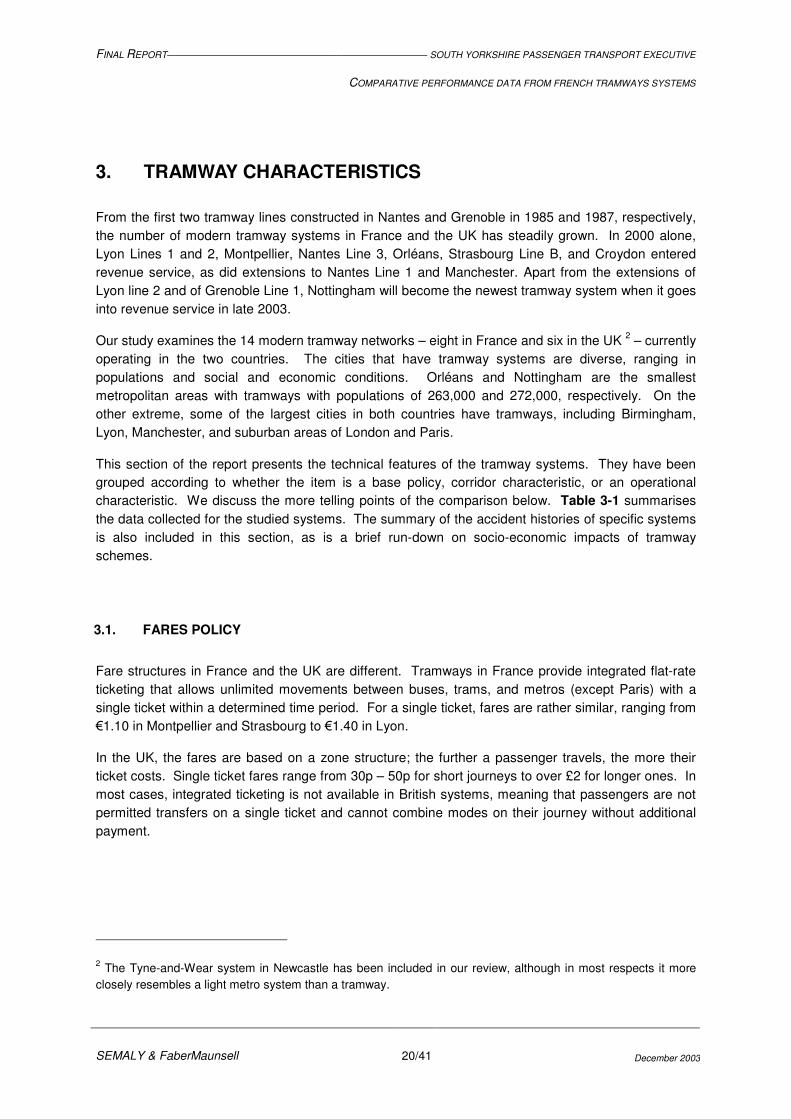
3. TRAMWAY CHARACTERISTICS
From the first two tramway lines constructed in Nantes and Grenoble in 1985 and 1987, respectively, the number of modern tramway systems in France and the UK has steadily grown. In 2000 alone, Lyon Lines 1 and 2, Montpellier, Nantes Line 3, Orléans, Strasbourg Line B, and Croydon entered revenue service, as did extensions to Nantes Line 1 and Manchester. Apart from the extensions of Lyon line 2 and of Grenoble Line 1, Nottingham will become the newest tramway system when it goes into revenue service in late 2003.
Our study examines the 14 modern tramway networks – eight in France and six in the UK 2 – currently operating in the two countries. The cities that have tramway systems are diverse, ranging in populations and social and economic conditions. Orléans and Nottingham are the smallest metropolitan areas with tramways with populations of 263,000 and 272,000, respectively. On the other extreme, some of the largest cities in both countries have tramways, including Birmingham, Lyon, Manchester, and suburban areas of London and Paris.
This section of the report presents the technical features of the tramway systems. They have been grouped according to whether the item is a base policy, corridor characteristic, or an operational characteristic. We discuss the more telling points of the comparison below. Table 3-1 summarises the data collected for the studied systems. The summary of the accident histories of specific systems is also included in this section, as is a brief run-down on socio-economic impacts of tramway schemes.
3.1. FARES POLICY
Fare structures in France and the UK are different. Tramways in France provide integrated flat-rate ticketing that allows unlimited movements between buses, trams, and metros (except Paris) with a single ticket within a determined time period. For a single ticket, fares are rather similar, ranging from �1.10 in Montpellier and Strasbourg to �1.40 in Lyon.
In the UK, the fares are based on a zone structure; the further a passenger travels, the more their ticket costs. Single ticket fares range from 30p – 50p for short journeys to over £2 for longer ones. In most cases, integrated ticketing is not available in British systems, meaning that passengers are not permitted transfers on a single ticket and cannot combine modes on their journey without additional payment.
2 The Tyne-and-Wear system in Newcastle has been included in our review, although in most respects it more closely resembles a light metro system than a tramway.
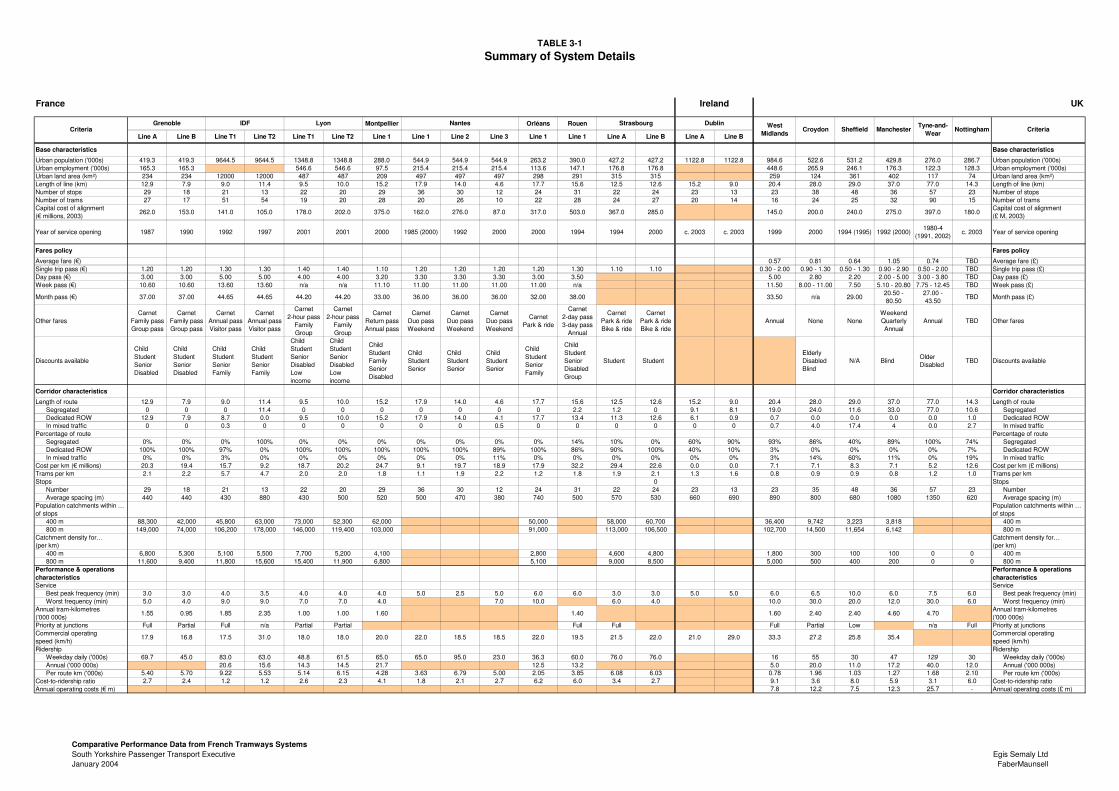
TABLE 3-1Summary of System Details
France 1 EUR = 0.71 GBP UKGrenoble A Grenoble B IDF 1 IDF 2 Lyon 1 Lyon 2 Montpellier Nantes 1 Nantes 2 Nantes 3 Orléans Rouen Strasbourg A Strasbourg B Dublin A Dublin B West Midlands Croydon Sheffield Manchester Tyne-and-WearNottingham
Montpellier Orléans Rouen
Line A Line B Line T1 Line T2 Line T1 Line T2 Line 1 Line 1 Line 2 Line 3 Line 1 Line 1 Line A Line B Line A Line B
Base characteristics Base characteristics
Urban population ('000s) 419.3 419.3 9644.5 9644.5 1348.8 1348.8 288.0 544.9 544.9 544.9 263.2 390.0 427.2 427.2 1122.8 1122.8 984.6 522.6 531.2 429.8 276.0 286.7 Urban population ('000s)Urban employment ('000s) 165.3 165.3 546.6 546.6 97.5 215.4 215.4 215.4 113.6 147.1 176.8 176.8 448.6 265.9 246.1 176.3 122.3 128.3 Urban employment ('000s)Urban land area (km²) 234 234 12000 12000 487 487 209 497 497 497 298 291 315 315 259 124 361 402 117 74 Urban land area (km²)Length of line (km) 12.9 7.9 9.0 11.4 9.5 10.0 15.2 17.9 14.0 4.6 17.7 15.6 12.5 12.6 15.2 9.0 20.4 28.0 29.0 37.0 77.0 14.3 Length of line (km)Number of stops 29 18 21 13 22 20 29 36 30 12 24 31 22 24 23 13 23 38 48 36 57 23 Number of stopsNumber of trams 27 17 51 54 19 20 28 20 26 10 22 28 24 27 20 14 16 24 25 32 90 15 Number of tramsCapital cost of alignment(� millions, 2003)
262.0 153.0 141.0 105.0 178.0 202.0 375.0 162.0 276.0 87.0 317.0 503.0 367.0 285.0 145.0 200.0 240.0 275.0 397.0 180.0Capital cost of alignment(£ M, 2003)
Year of service opening 1987 1990 1992 1997 2001 2001 2000 1985 (2000) 1992 2000 2000 1994 1994 2000 c. 2003 c. 2003 1999 2000 1994 (1995) 1992 (2000)1980-4
(1991, 2002)c. 2003 Year of service opening
Fares policy Fares policy
Average fare (�) 0.57 0.81 0.64 1.05 0.74 TBD Average fare (£)Single trip pass (�) 1.20 1.20 1.30 1.30 1.40 1.40 1.10 1.20 1.20 1.20 1.20 1.30 1.10 1.10 0.30 - 2.00 0.90 - 1.30 0.50 - 1.30 0.90 - 2.90 0.50 - 2.00 TBD Single trip pass (£)Day pass (�) 3.00 3.00 5.00 5.00 4.00 4.00 3.20 3.30 3.30 3.30 3.00 3.50 5.00 2.80 2.20 2.00 - 5.00 3.00 - 3.80 TBD Day pass (£)Week pass (�) 10.60 10.60 13.60 13.60 n/a n/a 11.10 11.00 11.00 11.00 11.00 n/a 11.50 8.00 - 11.00 7.50 5.10 - 20.80 7.75 - 12.45 TBD Week pass (£)
Month pass (�) 37.00 37.00 44.65 44.65 44.20 44.20 33.00 36.00 36.00 36.00 32.00 38.00 33.50 n/a 29.0020.50 - 80.50
27.00 - 43.50
TBD Month pass (£)
Other faresCarnet
Family passGroup pass
CarnetFamily passGroup pass
CarnetAnnual passVisitor pass
CarnetAnnual passVisitor pass
Carnet2-hour pass
FamilyGroup
Carnet2-hour pass
FamilyGroup
CarnetReturn passAnnual pass
CarnetDuo passWeekend
CarnetDuo passWeekend
CarnetDuo passWeekend
CarnetPark & ride
Carnet2-day pass3-day pass
Annual
CarnetPark & rideBike & ride
CarnetPark & rideBike & ride
Annual None NoneWeekendQuarterlyAnnual
Annual TBD Other fares
Discounts available
ChildStudentSeniorDisabled
ChildStudentSeniorDisabled
ChildStudentSeniorFamily
ChildStudentSeniorFamily
ChildStudentSeniorDisabledLow income
ChildStudentSeniorDisabledLow income
ChildStudentFamilySeniorDisabled
ChildStudentSenior
ChildStudentSenior
ChildStudentSenior
ChildStudentSeniorFamily
ChildStudentSeniorDisabledGroup
Student StudentElderlyDisabledBlind
N/A BlindOlder Disabled
TBD Discounts available
Corridor characteristics Corridor characteristics
Length of route 12.9 7.9 9.0 11.4 9.5 10.0 15.2 17.9 14.0 4.6 17.7 15.6 12.5 12.6 15.2 9.0 20.4 28.0 29.0 37.0 77.0 14.3 Length of route Segregated 0 0 0 11.4 0 0 0 0 0 0 0 2.2 1.2 0 9.1 8.1 19.0 24.0 11.6 33.0 77.0 10.6 SegregatedDedicated ROW 12.9 7.9 8.7 0.0 9.5 10.0 15.2 17.9 14.0 4.1 17.7 13.4 11.3 12.6 6.1 0.9 0.7 0.0 0.0 0.0 0.0 1.0 Dedicated ROWIn mixed traffic 0 0 0.3 0 0 0 0 0 0 0.5 0 0 0 0 0 0 0.7 4.0 17.4 4 0.0 2.7 In mixed traffic
Percentage of route Percentage of routeSegregated 0% 0% 0% 100% 0% 0% 0% 0% 0% 0% 0% 14% 10% 0% 60% 90% 93% 86% 40% 89% 100% 74% SegregatedDedicated ROW 100% 100% 97% 0% 100% 100% 100% 100% 100% 89% 100% 86% 90% 100% 40% 10% 3% 0% 0% 0% 0% 7% Dedicated ROWIn mixed traffic 0% 0% 3% 0% 0% 0% 0% 0% 0% 11% 0% 0% 0% 0% 0% 0% 3% 14% 60% 11% 0% 19% In mixed traffic
Cost per km (� millions) 20.3 19.4 15.7 9.2 18.7 20.2 24.7 9.1 19.7 18.9 17.9 32.2 29.4 22.6 0.0 0.0 7.1 7.1 8.3 7.1 5.2 12.6 Cost per km (£ millions)Trams per km 2.1 2.2 5.7 4.7 2.0 2.0 1.8 1.1 1.9 2.2 1.2 1.8 1.9 2.1 1.3 1.6 0.8 0.9 0.9 0.8 1.2 1.0 Trams per kmStops 0 Stops
Number 29 18 21 13 22 20 29 36 30 12 24 31 22 24 23 13 23 35 48 36 57 23 NumberAverage spacing (m) 440 440 430 880 430 500 520 500 470 380 740 500 570 530 660 690 890 800 680 1080 1350 620 Average spacing (m)
Population catchments within … of stops
Population catchments within … of stops
400 m 88,300 42,000 45,800 63,000 73,000 52,300 62,000 50,000 58,000 60,700 36,400 9,742 3,223 3,818 400 m800 m 149,000 74,000 106,200 178,000 146,000 119,400 103,000 91,000 113,000 106,500 102,700 14,500 11,654 6,142 800 m
Catchment density for…(per km)
Catchment density for…(per km)
400 m 6,800 5,300 5,100 5,500 7,700 5,200 4,100 2,800 4,600 4,800 1,800 300 100 100 0 0 400 m800 m 11,600 9,400 11,800 15,600 15,400 11,900 6,800 5,100 9,000 8,500 5,000 500 400 200 0 0 800 m
Performance & operations characteristics
Performance & operations characteristics
Service ServiceBest peak frequency (min) 3.0 3.0 4.0 3.5 4.0 4.0 4.0 5.0 2.5 5.0 6.0 6.0 3.0 3.0 5.0 5.0 6.0 6.5 10.0 6.0 7.5 6.0 Best peak frequency (min)Worst frequency (min) 5.0 4.0 9.0 9.0 7.0 7.0 4.0 7.0 10.0 6.0 4.0 10.0 30.0 20.0 12.0 30.0 6.0 Worst frequency (min)
Annual tram-kilometres('000 000s)
1.55 0.95 1.85 2.35 1.00 1.00 1.60 1.40 1.60 2.40 2.40 4.60 4.70Annual tram-kilometres ('000 000s)
Priority at junctions Full Partial Full n/a Partial Partial Full Full Full Partial Low n/a Full Priority at junctionsCommercial operating speed (km/h)
17.9 16.8 17.5 31.0 18.0 18.0 20.0 22.0 18.5 18.5 22.0 19.5 21.5 22.0 21.0 29.0 33.3 27.2 25.8 35.4Commercial operating speed (km/h)
Ridership RidershipWeekday daily ('000s) 69.7 45.0 83.0 63.0 48.8 61.5 65.0 65.0 95.0 23.0 36.3 60.0 76.0 76.0 16 55 30 47 129 30 Weekday daily ('000s)Annual ('000 000s) 20.6 15.6 14.3 14.5 21.7 12.5 13.2 5.0 20.0 11.0 17.2 40.0 12.0 Annual ('000 000s)Per route km ('000s) 5.40 5.70 9.22 5.53 5.14 6.15 4.28 3.63 6.79 5.00 2.05 3.85 6.08 6.03 0.78 1.96 1.03 1.27 1.68 2.10 Per route km ('000s)
Cost-to-ridership ratio 2.7 2.4 1.2 1.2 2.6 2.3 4.1 1.8 2.1 2.7 6.2 6.0 3.4 2.7 9.1 3.6 8.0 5.9 3.1 6.0 Cost-to-ridership ratioAnnual operating costs (� m) 7.8 12.2 7.5 12.3 25.7 - Annual operating costs (£ m)
Ireland
CriteriaSheffield Manchester Tyne-and-Wear
NottinghamNantes Strasbourg West
MidlandsCroydon
DublinCriteria
Grenoble IDF Lyon
Comparative Performance Data from French Tramways SystemsSouth Yorkshire Passenger Transport ExecutiveJanuary 2004
Egis Semaly LtdFaberMaunsell
FINAL REPORT SOUTH YORKSHIRE PASSENGER TRANSPORT EXECUTIVE
COMPARATIVE PERFORMANCE DATA FROM FRENCH TRAMWAYS SYSTEMS
SEMALY & FaberMaunsell 21/41 December 2003
3.2. CORRIDOR CHARACTERISTICS
The physical construction of the tramway lines – including tracks and stops – can vary. Almost the entire modern tramway infrastructure in France places tram vehicles in their own dedicated right-of-way within the street. Trams do not share their lanes with general-purpose vehicles and are generally given a high degree of priority at signalised junctions. This set-up ensures that tramways remain in the public roadspace – and the public eye – without being subject to the congestion delays that affect cars.
Only two lines in France do not fit this description. Nantes Line 3 operates for approximately 500 metres in shared right-of-way mixed with cars. The narrow cross-section of the roadway did not provide enough space to construct a dedicated right-of-way. In suburban Paris, Line T2 is the only French system to operate in a segregated alignment. It was constructed in a former railway right-of-way to the southwest of the city.
British systems have a high proportion of their alignments constructed in former railway right-of-ways, which offer significant amounts of segregated running operations. Most systems include more than 80% segregated running along their alignments. Portions of Croydon, Sheffield, and West Midlands operate in shared-running conditions, with sections of Croydon sharing a bus lane. When Nottingham comes into service, more than 2.5 km – or nearly one-fifth of the alignment – will share its lanes with cars.
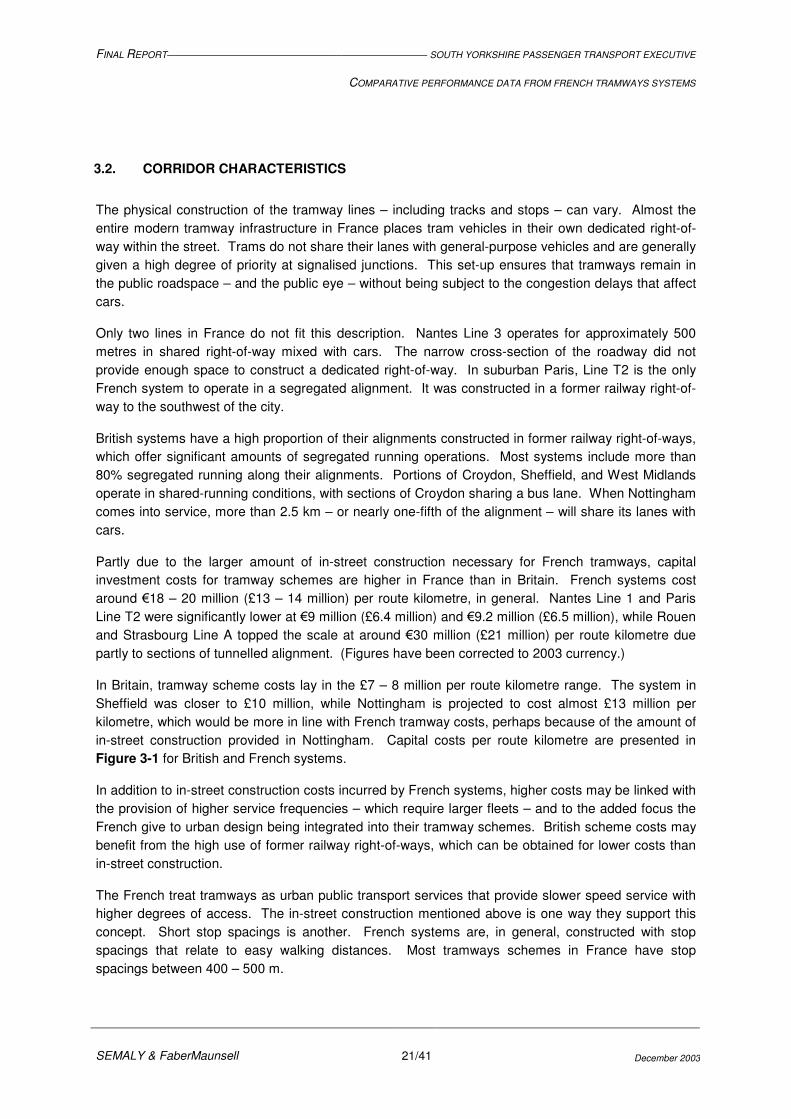
Partly due to the larger amount of in-street construction necessary for French tramways, capital investment costs for tramway schemes are higher in France than in Britain. French systems cost around �18 – 20 million (£13 – 14 million) per route kilometre, in general. Nantes Line 1 and Paris Line T2 were significantly lower at �9 million (£6.4 million) and �9.2 million (£6.5 million), while Rouen and Strasbourg Line A topped the scale at around �30 million (£21 million) per route kilometre due partly to sections of tunnelled alignment. (Figures have been corrected to 2003 currency.)
In Britain, tramway scheme costs lay in the £7 – 8 million per route kilometre range. The system in Sheffield was closer to £10 million, while Nottingham is projected to cost almost £13 million per kilometre, which would be more in line with French tramway costs, perhaps because of the amount of in-street construction provided in Nottingham. Capital costs per route kilometre are presented in Figure 3-1 for British and French systems.
In addition to in-street construction costs incurred by French systems, higher costs may be linked with the provision of higher service frequencies – which require larger fleets – and to the added focus the French give to urban design being integrated into their tramway schemes. British scheme costs may benefit from the high use of former railway right-of-ways, which can be obtained for lower costs than in-street construction.
The French treat tramways as urban public transport services that provide slower speed service with higher degrees of access. The in-street construction mentioned above is one way they support this concept. Short stop spacings is another. French systems are, in general, constructed with stop spacings that relate to easy walking distances. Most tramways schemes in France have stop spacings between 400 – 500 m.
FINAL REPORT SOUTH YORKSHIRE PASSENGER TRANSPORT EXECUTIVE
COMPARATIVE PERFORMANCE DATA FROM FRENCH TRAMWAYS SYSTEMS
SEMALY & FaberMaunsell 22/41 December 2003
Figure 3-1 Capital costs per route kilometre (in £ millions)
£0.0 £5.0 £10.0 £15.0 £20.0 £25.0
Grenoble A
Grenoble B
IDF 1
IDF 2
Lyon 1
Lyon 2
Montpellier
Nantes 1
Nantes 2
Nantes 3
Orléans
Rouen
Strasbourg A
Strasbourg B
West Midlands
Croydon
Sheffield
Manchester
Tyne-and-Wear
Nottingham
The average distance between stops in the UK is quite a bit higher, mostly between 800 – 1,350 m. Only Sheffield and Nottingham have spaced their stops at distances that resemble French systems, at 580 m and 620 m, respectively. The longer distances can be ascribed to the focus UK systems have on moving passengers over longer distances at higher speeds; stops are more-widely spaced to support this objective. Figure 3-2 presents the average stop spacings for the tramway systems studied (including Dublin).
The focus of integrating tramways into denser, more urbanised environments means that French tramways often cut through the most densely populated sections of a city. With this, the number of people living within the catchment of a tramway’s stops can be much higher than in the UK, where tramways are constructed in former railway corridors through areas of low residential development, such as suburbs, industrial areas, city centres, and new development zones.
In France, a 400-metre catchment from a tramway’s stops will generally contain 4,000 – 5,000 persons per route kilometre. Grenoble Line A and Lyon Line 1 have much higher densities of 6,800 and 7,700, respectively, while Orléans has the lowest density of the French schemes at 2,800 persons per route kilometre for the same 400 m catchment zone.
Catchment densities are very low with British tramway schemes. Of the four systems for which the catchment data were available, West Midlands has the highest density at 1,800 persons per route kilometre for a 400-m stop catchment, substantially lower than the lowest French density in Orléans.

FINAL REPORT SOUTH YORKSHIRE PASSENGER TRANSPORT EXECUTIVE
COMPARATIVE PERFORMANCE DATA FROM FRENCH TRAMWAYS SYSTEMS
SEMALY & FaberMaunsell 23/41 December 2003
The densities for Croydon, Sheffield, and Manchester do not exceed 500 persons per route kilometre. Figure 3-3 summarises the catchment population densities by city for a 400-m catchment zone around each stop.
Figure 3-2 Average stop spacing (in metres)
0 200 400 600 800 1000 1200 1400
Grenoble A
Grenoble B
IDF 1
IDF 2
Lyon 1
Lyon 2
M ontpellier
Nantes 1
Nantes 2
Nantes 3
Orléans
Rouen
Strasbourg A
Strasbourg B
Dublin A
Dublin B
West M idlands
Croydon
Sheffield
M anchester
Tyne-and-Wear
Nottingham
3.3. OPERATIONS CHARACTERISTICS
The operational characteristics of a tramway are invariably linked to the physical characteristics. For example, the design decision to set a tramline in the existing roadspace or to use a segregated alignment will have an impact on the commercial speeds attained by trams. Furthermore, this decision could impact the amount of ridership the line receives and the frequency of service provided.
Commercial speeds are often a product of the design philosophy behind a tramway scheme. French tramways are constructed – almost without fail – as in-street urban tramways in denser city-centre environments where tramway service is slower and stops are spaced every 400 – 500 m. French tramways tend to have commercial speeds of 17 – 20 km/h (including stop dwell times and junction delays). Nantes Line 1, Orléans, and Strasbourg Lines 1 and 2 have the highest commercial speeds at approximately 22 km/h. (Paris Line 2 operates at 31 km/h, but it runs segregated in a former railway corridor – similar to most British systems.)
FINAL REPORT SOUTH YORKSHIRE PASSENGER TRANSPORT EXECUTIVE
COMPARATIVE PERFORMANCE DATA FROM FRENCH TRAMWAYS SYSTEMS
SEMALY & FaberMaunsell 24/41 December 2003
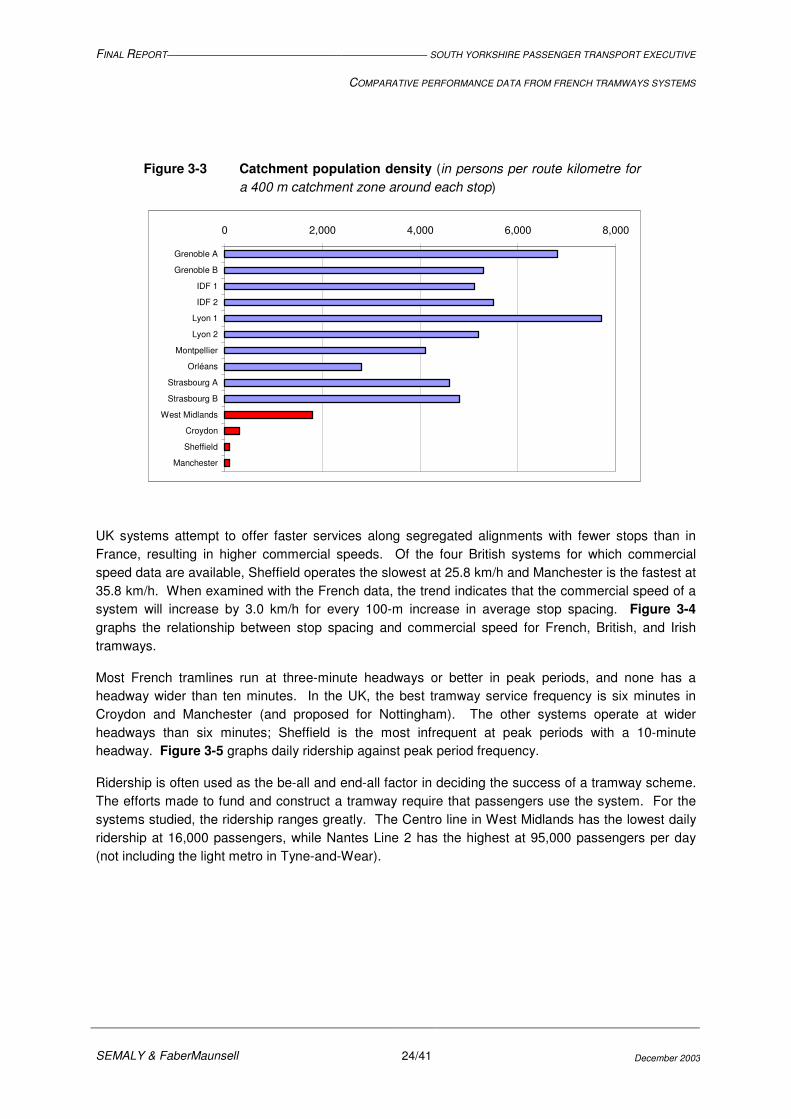
Figure 3-3 Catchment population density (in persons per route kilometre for a 400 m catchment zone around each stop)
0 2,000 4,000 6,000 8,000
Grenoble A
Grenoble B
IDF 1
IDF 2
Lyon 1
Lyon 2
Montpellier
Orléans
Strasbourg A
Strasbourg B
West Midlands
Croydon
Sheffield
Manchester
UK systems attempt to offer faster services along segregated alignments with fewer stops than in France, resulting in higher commercial speeds. Of the four British systems for which commercial speed data are available, Sheffield operates the slowest at 25.8 km/h and Manchester is the fastest at 35.8 km/h. When examined with the French data, the trend indicates that the commercial speed of a system will increase by 3.0 km/h for every 100-m increase in average stop spacing. Figure 3-4 graphs the relationship between stop spacing and commercial speed for French, British, and Irish tramways.
Most French tramlines run at three-minute headways or better in peak periods, and none has a headway wider than ten minutes. In the UK, the best tramway service frequency is six minutes in Croydon and Manchester (and proposed for Nottingham). The other systems operate at wider headways than six minutes; Sheffield is the most infrequent at peak periods with a 10-minute headway. Figure 3-5 graphs daily ridership against peak period frequency.
Ridership is often used as the be-all and end-all factor in deciding the success of a tramway scheme. The efforts made to fund and construct a tramway require that passengers use the system. For the systems studied, the ridership ranges greatly. The Centro line in West Midlands has the lowest daily ridership at 16,000 passengers, while Nantes Line 2 has the highest at 95,000 passengers per day (not including the light metro in Tyne-and-Wear).

FINAL REPORT SOUTH YORKSHIRE PASSENGER TRANSPORT EXECUTIVE
COMPARATIVE PERFORMANCE DATA FROM FRENCH TRAMWAYS SYSTEMS
SEMALY & FaberMaunsell 25/41 December 2003
Figure 3-4 Stop spacing (in metres) versus commercial speed (in km/h)
300
500
700
900
1100
15 20 25 30 35
Commercial speed (km/h)
Sta
tion
spac
ing
(m)
France UK Dublin
Figure 3-5 Daily ridership (‘000s per km) versus peak period frequency (min)
0.0
2.0
4.0
6.0
8.0
10.0
2 3 4 5 6 7 8 9 10
Peak period frequency (min)
Dai
ly r
ider
ship
per
km
('00
0s)
France UK
Naturally, the longer a tramway is, the higher the daily ridership tends to be. When ridership is examined against route length, however, the lowest ridership in France – Nantes Line 1 at 3,600 passengers per day per route kilometre – is 80% higher than the highest ridership in the UK – Croydon at 2,000 passengers per day per route kilometre 3. With the exception of only Nantes Line 1
3 The Nottingham tram scheme has a projected daily ridership of 2,100 per route kilometre.
FINAL REPORT SOUTH YORKSHIRE PASSENGER TRANSPORT EXECUTIVE
COMPARATIVE PERFORMANCE DATA FROM FRENCH TRAMWAYS SYSTEMS
SEMALY & FaberMaunsell 26/41 December 2003
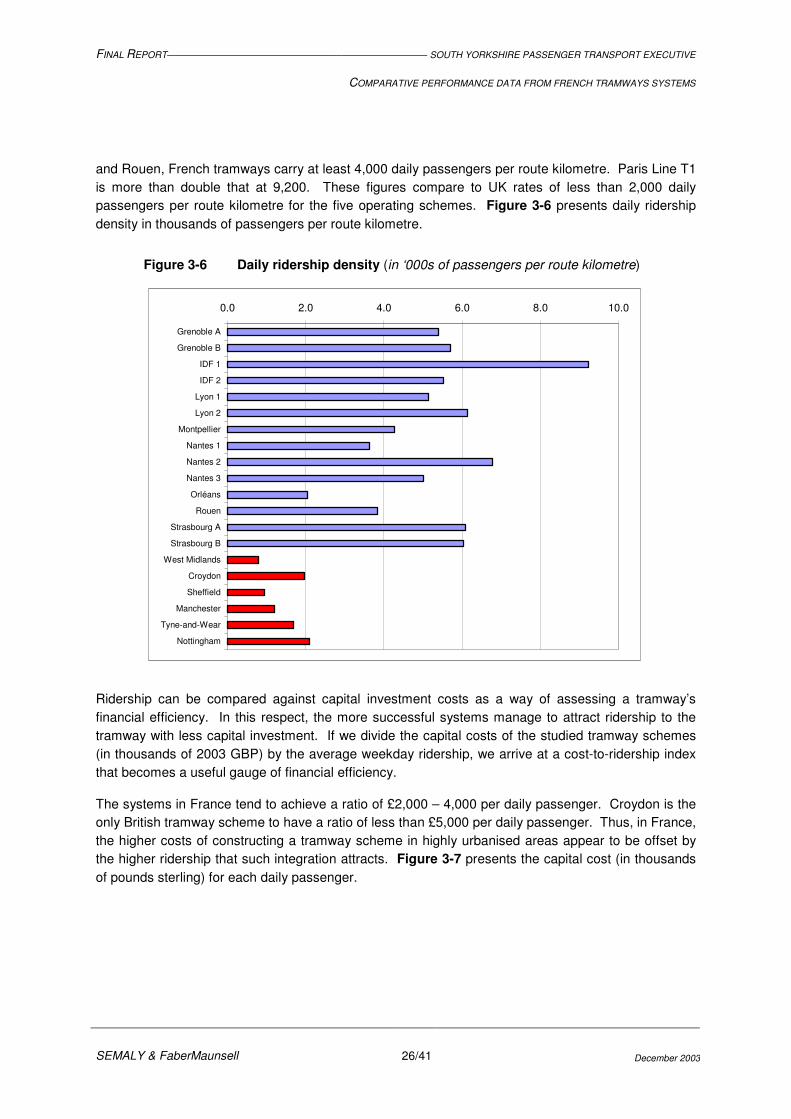
and Rouen, French tramways carry at least 4,000 daily passengers per route kilometre. Paris Line T1 is more than double that at 9,200. These figures compare to UK rates of less than 2,000 daily passengers per route kilometre for the five operating schemes. Figure 3-6 presents daily ridership density in thousands of passengers per route kilometre.
Figure 3-6 Daily ridership density (in ‘000s of passengers per route kilometre)
0.0 2.0 4.0 6.0 8.0 10.0
Grenoble A
Grenoble B
IDF 1
IDF 2
Lyon 1
Lyon 2
Montpellier
Nantes 1
Nantes 2
Nantes 3
Orléans
Rouen
Strasbourg A
Strasbourg B
West Midlands
Croydon
Sheffield
Manchester
Tyne-and-Wear
Nottingham
Ridership can be compared against capital investment costs as a way of assessing a tramway’s financial efficiency. In this respect, the more successful systems manage to attract ridership to the tramway with less capital investment. If we divide the capital costs of the studied tramway schemes (in thousands of 2003 GBP) by the average weekday ridership, we arrive at a cost-to-ridership index that becomes a useful gauge of financial efficiency.
The systems in France tend to achieve a ratio of £2,000 – 4,000 per daily passenger. Croydon is the only British tramway scheme to have a ratio of less than £5,000 per daily passenger. Thus, in France, the higher costs of constructing a tramway scheme in highly urbanised areas appear to be offset by the higher ridership that such integration attracts. Figure 3-7 presents the capital cost (in thousands of pounds sterling) for each daily passenger.

FINAL REPORT SOUTH YORKSHIRE PASSENGER TRANSPORT EXECUTIVE
COMPARATIVE PERFORMANCE DATA FROM FRENCH TRAMWAYS SYSTEMS
SEMALY & FaberMaunsell 27/41 December 2003
Figure 3-7 Cost-to-ridership index (in £’000s per daily passenger)
£0.0 £2.0 £4.0 £6.0 £8.0 £10.0
Grenoble A
Grenoble B
IDF 1
IDF 2
Lyon 1
Lyon 2
Montpellier
Nantes 1
Nantes 2
Nantes 3
Orléans
Rouen
Strasbourg A
Strasbourg B
West Midlands
Croydon
Sheffield
Manchester
Tyne-and-Wear
Nottingham
3.4. STATISTICAL COMPARISONS
In the earlier sections of this chapter, we outlined tramway characteristics and relationships from a strategic point of view, without reference to statistical analysis and comparisons. The intention was to present the data as a set of individual schemes that could be grouped by country but within which individual city variables could be highlighted and referenced, where need be.
Statistical analysis can neutralise data. Often that is why it is used – to account for the variability of data from individual sources and to present the amassed information as a common set. If we review our dataset from a statistical perspective, we can receive more ‘accurate’ information. However, with the limited size of our dataset, statistical analysis can be influenced by outlying data; that is, one really high or really low number can lead to misleading or illogical results.
Limited statistical assessment of the data for several tramway characteristics has been summarised in the table below (see Table 3-2). It includes the data mean and range for a 90% confidence interval. The size of the dataset and the influence of outlying data elements can be seen in certain characteristics; for example, the catchment populations for the UK systems have a wide range and negative values. Thus, the results should be viewed sceptically.

FINAL REPORT SOUTH YORKSHIRE PASSENGER TRANSPORT EXECUTIVE
COMPARATIVE PERFORMANCE DATA FROM FRENCH TRAMWAYS SYSTEMS
SEMALY & FaberMaunsell 28/41 December 2003
Table 3-2 Statistical Sample of Data
France UK Criteria
N Mean* Low High N Mean* Low High
Stop spacing (m)
14 524 465 582 6 903 720 1086
Cost per km (� or £ million)
14 19.9 17.1 22.7 6 7.8 6.1 9.5
Trains per km 14 2.3 1.8 2.9 6 0.9 0.8 1.0
Catchment popn (‘000s for 400 m)
10 59.5 52.4 66.6 4 13.2 0.4 26.2
Catchment density (‘000s per km)
10 5.2 4.5 5.9 4 0.6 -0.1 1.3
Commercial speed (km/h)
14 20.2 18.6 21.8 4 30.4 26.6 34.3
Weekday ridership (‘000s)
14 62.0 53.6 70.3 6 51.2 23.9 78.4
Weekday ridership per km (‘000s)
14 5.3 4.6 6.1 6 1.4 1.1 1.8
Cost-to-ridership 14 2.9 2.3 3.6 6 5.9 4.4 7.5
* The ‘mean’ has been calculated for a 90% confidence interval. The ‘low’ and ‘high’ are derived from this confidence interval.
3.5. ACCIDENT HISTORY
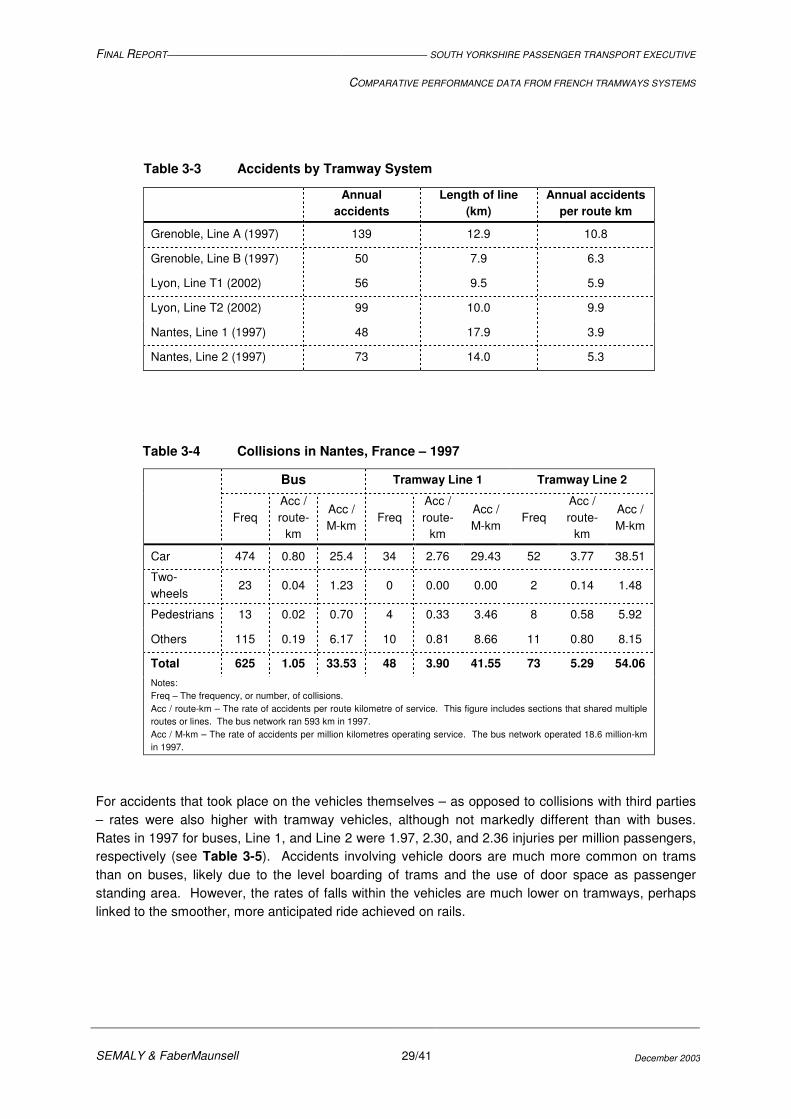
Several French tramway systems produce information on accidents involving their vehicles. Looking at the annual accident records for Grenoble, Lyon, and Nantes, we can see that the annual collision frequency ranges from 3.9 to 10.8 accidents per route kilometre (see Table 3-3). The variations within systems themselves suggest that accident causes cannot be wholly linked with operating policy or system design elements.
When we look at the detailed accident report generated by SEMITAN in Nantes, we can compare the accident rates between buses and tramways. In 1997, Lines 1 and 2 both had higher accident rates than the bus network, with much higher rates of accidents with pedestrians. Buses had total and pedestrian accident rates of 1.05 and 0.02 accidents per route-kilometre that year, respectively. For the tramway, the total accident rates were 3.90 accidents per route-km for Line 1 and 5.29 accidents per route-km for Line 2. Pedestrian accident rates were 0.33 and 0.58 for Lines 1 and 2, respectively. These data are summarised in Table 3-4.
FINAL REPORT SOUTH YORKSHIRE PASSENGER TRANSPORT EXECUTIVE
COMPARATIVE PERFORMANCE DATA FROM FRENCH TRAMWAYS SYSTEMS
SEMALY & FaberMaunsell 29/41 December 2003
Table 3-3 Accidents by Tramway System
Annual
accidents Length of line
(km) Annual accidents
per route km
Grenoble, Line A (1997) 139 12.9 10.8
Grenoble, Line B (1997) 50 7.9 6.3
Lyon, Line T1 (2002) 56 9.5 5.9
Lyon, Line T2 (2002) 99 10.0 9.9
Nantes, Line 1 (1997) 48 17.9 3.9
Nantes, Line 2 (1997) 73 14.0 5.3
Table 3-4 Collisions in Nantes, France – 1997
Bus Tramway Line 1 Tramway Line 2
Freq
Acc / route-
km
Acc / M-km
Freq Acc / route-
km
Acc / M-km
Freq Acc / route-
km
Acc / M-km
Car 474 0.80 25.4 34 2.76 29.43 52 3.77 38.51
Two-wheels
23 0.04 1.23 0 0.00 0.00 2 0.14 1.48
Pedestrians 13 0.02 0.70 4 0.33 3.46 8 0.58 5.92
Others 115 0.19 6.17 10 0.81 8.66 11 0.80 8.15
Total 625 1.05 33.53 48 3.90 41.55 73 5.29 54.06 Notes: Freq – The frequency, or number, of collisions. Acc / route-km – The rate of accidents per route kilometre of service. This figure includes sections that shared multiple routes or lines. The bus network ran 593 km in 1997. Acc / M-km – The rate of accidents per million kilometres operating service. The bus network operated 18.6 million-km in 1997.
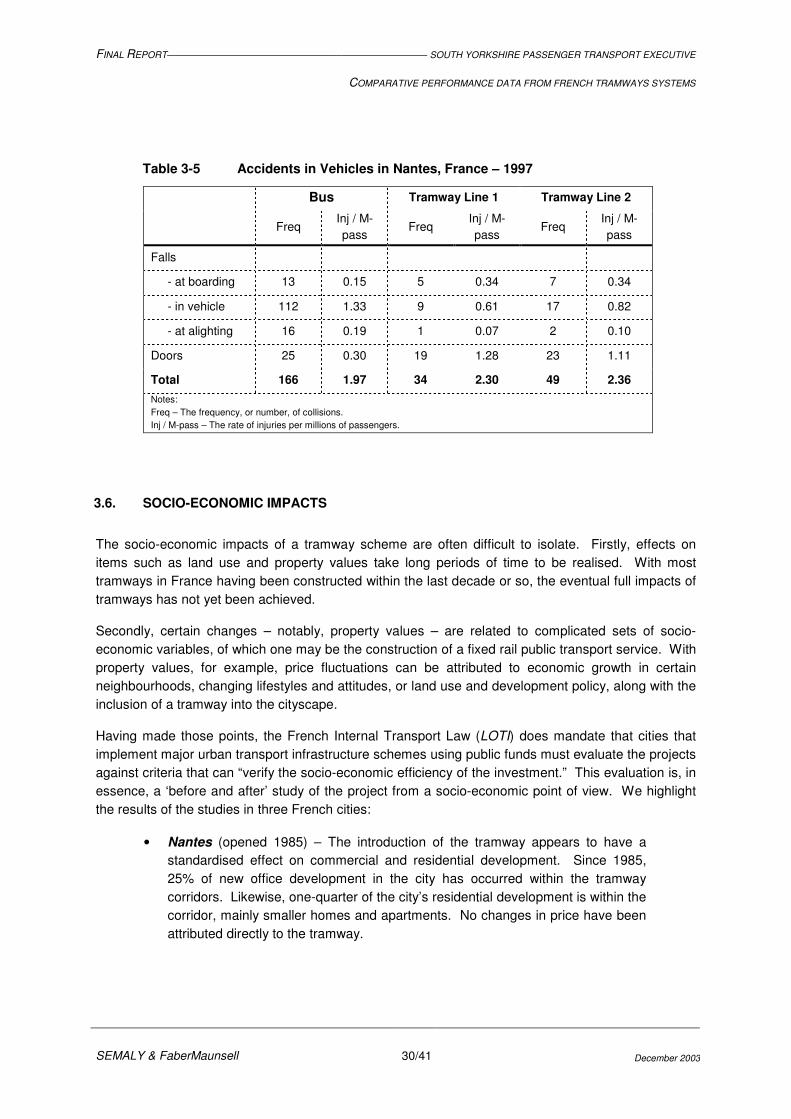
For accidents that took place on the vehicles themselves – as opposed to collisions with third parties – rates were also higher with tramway vehicles, although not markedly different than with buses. Rates in 1997 for buses, Line 1, and Line 2 were 1.97, 2.30, and 2.36 injuries per million passengers, respectively (see Table 3-5). Accidents involving vehicle doors are much more common on trams than on buses, likely due to the level boarding of trams and the use of door space as passenger standing area. However, the rates of falls within the vehicles are much lower on tramways, perhaps linked to the smoother, more anticipated ride achieved on rails.
FINAL REPORT SOUTH YORKSHIRE PASSENGER TRANSPORT EXECUTIVE
COMPARATIVE PERFORMANCE DATA FROM FRENCH TRAMWAYS SYSTEMS
SEMALY & FaberMaunsell 30/41 December 2003
Table 3-5 Accidents in Vehicles in Nantes, France – 1997
Bus Tramway Line 1 Tramway Line 2
Freq Inj / M-pass
Freq Inj / M-pass
Freq Inj / M-pass
Falls
- at boarding 13 0.15 5 0.34 7 0.34
- in vehicle 112 1.33 9 0.61 17 0.82
- at alighting 16 0.19 1 0.07 2 0.10
Doors 25 0.30 19 1.28 23 1.11
Total 166 1.97 34 2.30 49 2.36 Notes: Freq – The frequency, or number, of collisions. Inj / M-pass – The rate of injuries per millions of passengers.
3.6. SOCIO-ECONOMIC IMPACTS
The socio-economic impacts of a tramway scheme are often difficult to isolate. Firstly, effects on items such as land use and property values take long periods of time to be realised. With most tramways in France having been constructed within the last decade or so, the eventual full impacts of tramways has not yet been achieved.
Secondly, certain changes – notably, property values – are related to complicated sets of socio-economic variables, of which one may be the construction of a fixed rail public transport service. With property values, for example, price fluctuations can be attributed to economic growth in certain neighbourhoods, changing lifestyles and attitudes, or land use and development policy, along with the inclusion of a tramway into the cityscape.
Having made those points, the French Internal Transport Law (LOTI) does mandate that cities that implement major urban transport infrastructure schemes using public funds must evaluate the projects against criteria that can “verify the socio-economic efficiency of the investment.” This evaluation is, in essence, a ‘before and after’ study of the project from a socio-economic point of view. We highlight the results of the studies in three French cities:
• Nantes (opened 1985) – The introduction of the tramway appears to have a standardised effect on commercial and residential development. Since 1985, 25% of new office development in the city has occurred within the tramway corridors. Likewise, one-quarter of the city’s residential development is within the corridor, mainly smaller homes and apartments. No changes in price have been attributed directly to the tramway.
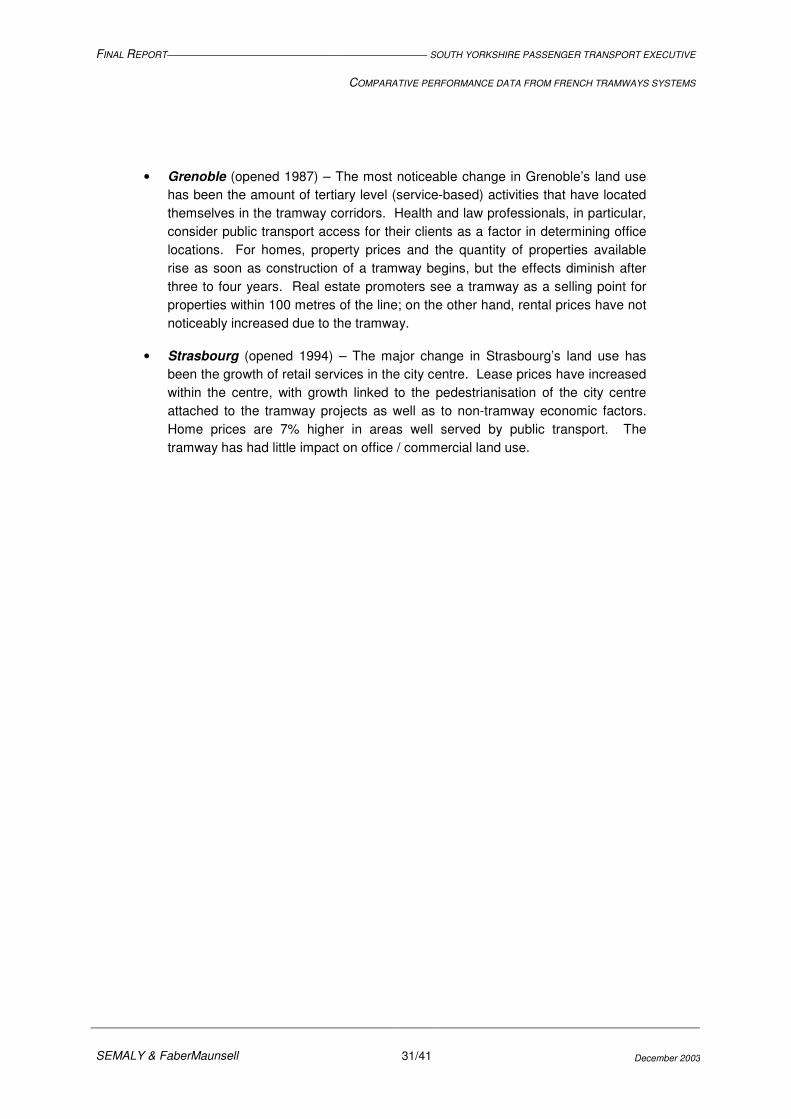
FINAL REPORT SOUTH YORKSHIRE PASSENGER TRANSPORT EXECUTIVE
COMPARATIVE PERFORMANCE DATA FROM FRENCH TRAMWAYS SYSTEMS
SEMALY & FaberMaunsell 31/41 December 2003
• Grenoble (opened 1987) – The most noticeable change in Grenoble’s land use has been the amount of tertiary level (service-based) activities that have located themselves in the tramway corridors. Health and law professionals, in particular, consider public transport access for their clients as a factor in determining office locations. For homes, property prices and the quantity of properties available rise as soon as construction of a tramway begins, but the effects diminish after three to four years. Real estate promoters see a tramway as a selling point for properties within 100 metres of the line; on the other hand, rental prices have not noticeably increased due to the tramway.
• Strasbourg (opened 1994) – The major change in Strasbourg’s land use has been the growth of retail services in the city centre. Lease prices have increased within the centre, with growth linked to the pedestrianisation of the city centre attached to the tramway projects as well as to non-tramway economic factors. Home prices are 7% higher in areas well served by public transport. The tramway has had little impact on office / commercial land use.
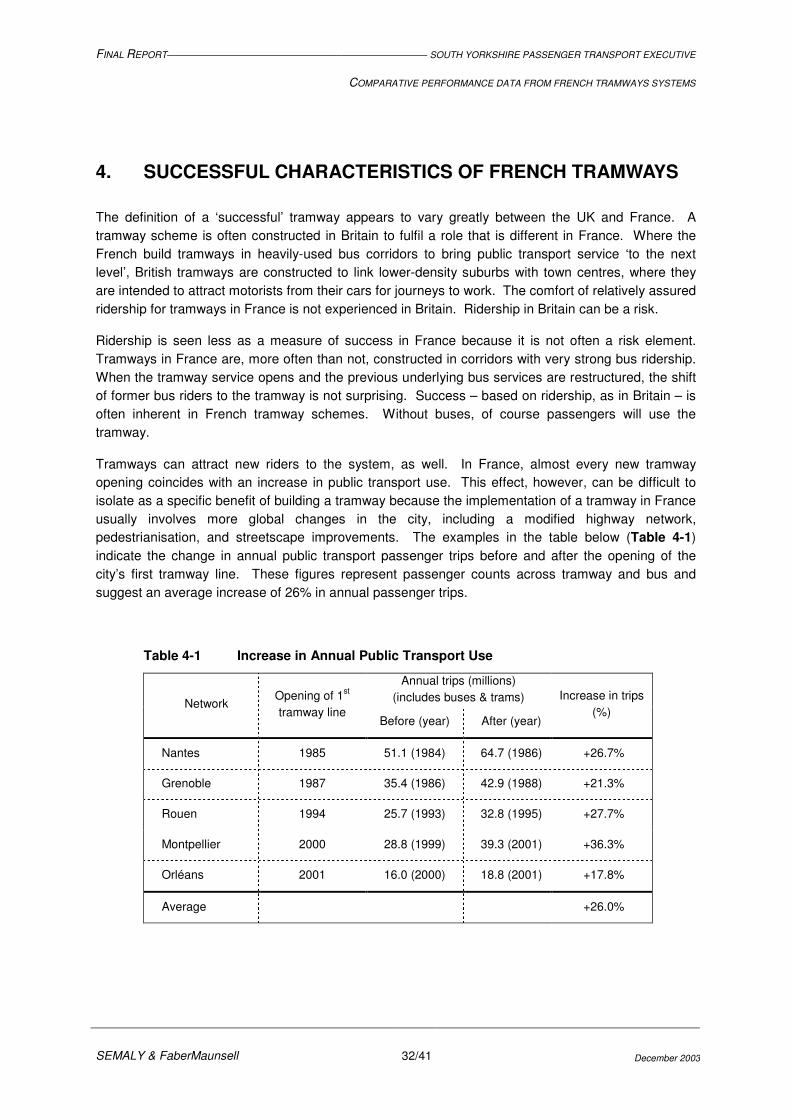
FINAL REPORT SOUTH YORKSHIRE PASSENGER TRANSPORT EXECUTIVE
COMPARATIVE PERFORMANCE DATA FROM FRENCH TRAMWAYS SYSTEMS
SEMALY & FaberMaunsell 32/41 December 2003
4. SUCCESSFUL CHARACTERISTICS OF FRENCH TRAMWAYS
The definition of a ‘successful’ tramway appears to vary greatly between the UK and France. A tramway scheme is often constructed in Britain to fulfil a role that is different in France. Where the French build tramways in heavily-used bus corridors to bring public transport service ‘to the next level’, British tramways are constructed to link lower-density suburbs with town centres, where they are intended to attract motorists from their cars for journeys to work. The comfort of relatively assured ridership for tramways in France is not experienced in Britain. Ridership in Britain can be a risk.
Ridership is seen less as a measure of success in France because it is not often a risk element. Tramways in France are, more often than not, constructed in corridors with very strong bus ridership. When the tramway service opens and the previous underlying bus services are restructured, the shift of former bus riders to the tramway is not surprising. Success – based on ridership, as in Britain – is often inherent in French tramway schemes. Without buses, of course passengers will use the tramway.
Tramways can attract new riders to the system, as well. In France, almost every new tramway opening coincides with an increase in public transport use. This effect, however, can be difficult to isolate as a specific benefit of building a tramway because the implementation of a tramway in France usually involves more global changes in the city, including a modified highway network, pedestrianisation, and streetscape improvements. The examples in the table below (Table 4-1) indicate the change in annual public transport passenger trips before and after the opening of the city’s first tramway line. These figures represent passenger counts across tramway and bus and suggest an average increase of 26% in annual passenger trips.
Table 4-1 Increase in Annual Public Transport Use
Annual trips (millions) (includes buses & trams) Network
Opening of 1st tramway line
Before (year) After (year)
Increase in trips (%)
Nantes 1985 51.1 (1984) 64.7 (1986) +26.7%
Grenoble 1987 35.4 (1986) 42.9 (1988) +21.3%
Rouen 1994 25.7 (1993) 32.8 (1995) +27.7%
Montpellier 2000 28.8 (1999) 39.3 (2001) +36.3%
Orléans 2001 16.0 (2000) 18.8 (2001) +17.8%
Average +26.0%
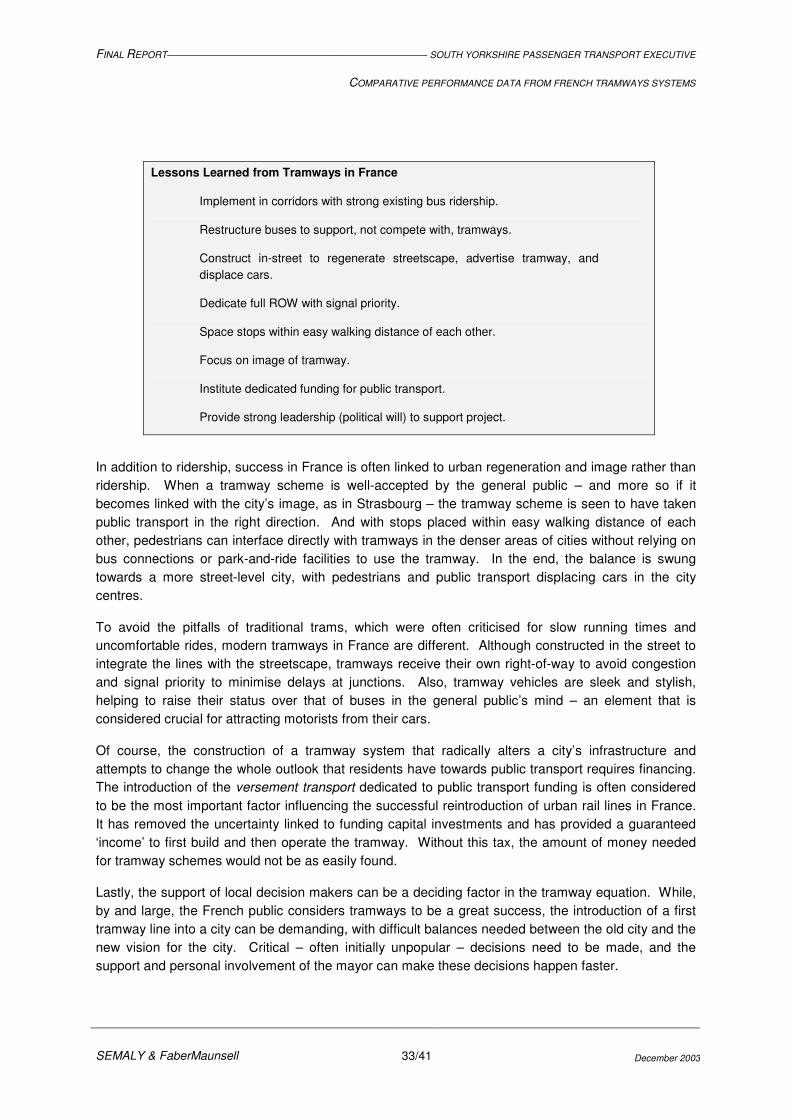
FINAL REPORT SOUTH YORKSHIRE PASSENGER TRANSPORT EXECUTIVE
COMPARATIVE PERFORMANCE DATA FROM FRENCH TRAMWAYS SYSTEMS
SEMALY & FaberMaunsell 33/41 December 2003
Lessons Learned from Tramways in France
Implement in corridors with strong existing bus ridership.
Restructure buses to support, not compete with, tramways.
Construct in-street to regenerate streetscape, advertise tramway, and displace cars.
Dedicate full ROW with signal priority.
Space stops within easy walking distance of each other.
Focus on image of tramway.
Institute dedicated funding for public transport.
Provide strong leadership (political will) to support project.
In addition to ridership, success in France is often linked to urban regeneration and image rather than ridership. When a tramway scheme is well-accepted by the general public – and more so if it becomes linked with the city’s image, as in Strasbourg – the tramway scheme is seen to have taken public transport in the right direction. And with stops placed within easy walking distance of each other, pedestrians can interface directly with tramways in the denser areas of cities without relying on bus connections or park-and-ride facilities to use the tramway. In the end, the balance is swung towards a more street-level city, with pedestrians and public transport displacing cars in the city centres.
To avoid the pitfalls of traditional trams, which were often criticised for slow running times and uncomfortable rides, modern tramways in France are different. Although constructed in the street to integrate the lines with the streetscape, tramways receive their own right-of-way to avoid congestion and signal priority to minimise delays at junctions. Also, tramway vehicles are sleek and stylish, helping to raise their status over that of buses in the general public’s mind – an element that is considered crucial for attracting motorists from their cars.
Of course, the construction of a tramway system that radically alters a city’s infrastructure and attempts to change the whole outlook that residents have towards public transport requires financing. The introduction of the versement transport dedicated to public transport funding is often considered to be the most important factor influencing the successful reintroduction of urban rail lines in France. It has removed the uncertainty linked to funding capital investments and has provided a guaranteed ‘income’ to first build and then operate the tramway. Without this tax, the amount of money needed for tramway schemes would not be as easily found.
Lastly, the support of local decision makers can be a deciding factor in the tramway equation. While, by and large, the French public considers tramways to be a great success, the introduction of a first tramway line into a city can be demanding, with difficult balances needed between the old city and the new vision for the city. Critical – often initially unpopular – decisions need to be made, and the support and personal involvement of the mayor can make these decisions happen faster.

FINAL REPORT SOUTH YORKSHIRE PASSENGER TRANSPORT EXECUTIVE
COMPARATIVE PERFORMANCE DATA FROM FRENCH TRAMWAYS SYSTEMS
SEMALY & FaberMaunsell 34/41 December 2003
5. FRENCH TRAITS IN THE UK
This study of French tramways has identified the key features that have resulted in the country being known worldwide as a leading force in the successful implementation of these public transport systems. The modern French tramways have a favourable public image, offer both high reliability and performance levels, and use zero-emissions vehicles.
This study has identified the various features of French systems, through a series of case studies, including the legal and planning processes that need to be undergone before approval. In particular this study has identified the successful characteristics of French tramways.
While the underlying objectives of the French systems are similar to those of the UK systems – namely, cost-effectiveness and traffic congestion and related environmental concerns – there are fundamental differences in the separate measures of success that are applied to the systems in the two countries. Taking a more holistic approach in assessing the success of a tramway, as in France, would pick up greater benefits that are currently not included in the analysis of UK systems, where ridership is the fundamental indicator of success.
This difference has knock-on effects, particularly in terms of the routing of the tramways, with the French systems being constructed in corridors with very strong bus ridership. Instead of the trams having to compete with the bus, bus services along the route are restructured which ensures a level of certainty over ridership that is not often the case with British systems. Incorporation of this feature into British systems would decrease the uncertainty of ridership and so allow other indicators of success to be taken into consideration and thus be more significant features of a tramway.
The emphasis in Britain on tram ridership and low importance on other benefits of the system could be argued to be heavily influenced by the legislative stages that a tramway has to be passed through. This process is shown in the Figure 5-1, which highlights the minimum time periods that are involved.
One of the key stages of this process is obtaining funding approval, which is very much based on cost benefit analysis. It does allow for other benefits to be included, such as the wider benefits to the city or urban renaissance and enhanced city image; however, these are generally afforded a lower priority in the overall appraisal process. Furthermore, city realm schemes and tram developments tend to be funded separately, which does not actively encourage joined up approaches, despite any best intentions.
In conclusion, a number of areas exist where the French approach to planning tramway systems facilitates more rapid implementation and overall scheme success. These include:
• Legislative processes, including scope for drawing upon local (municipal) taxation to develop tramway systems;
• Definition of success criteria in France - a more holistic approach in quantifying benefits; and,
• Route planning – high (existing) public transport markets, stop spacing and urban density issues – with bus restructuring where trams are introduced.
In effect to bring these factors about in the UK would require a complete change in the UK political and transport culture.

Figure 5-1 UK Process
Pre-Feasibility Study (Identify routes)
Feasibility Study (Route evaluation and selection)
Preferred Route(s) (in 12 months)
First Stage Consultation (on principles)
Annex E Submission (based on GOMMMS, can now be made at any time during the year)
Funding Approval (but dependent on passing all statutory processes)
STATUTORY
LTP Process
18 monthsminimum
12 months minimum
12 months minimum
24 months minimum
* Note: Text in pink (shade Total minimum time period
Second Stage Consultation
Transport and Works Act (TWA) Application • Based on ‘Limits of Deviation’ • Act grants the Applicant (PTE/LA) the powers to implement the proposal and all the
necessary accompanying works within the ‘Limits of Deviation’. • Traffic Regulation Order’s (TRO) • 6-week statutory objection period (for anybody)
d
TWA Inquiry (with an inspector appointed by government) • TRO’s/Compulsory Purchase Order’s etc
TWA Granted (Inspector)
Funding from Government Released (but can claim back design costs)
Prepare Tender Doc’s for systems • In-house design • Design (D) and Build (B) • Partnership • D, B and Operate (O)
Award Contract
Detailed Design
Implementation
Opening
) is crucial to stages of progress. if practices are approved is 5 years 6 months.
If not approved
If not approved
Could be in parallelpending TWAdecision


FINAL REPORT SOUTH YORKSHIRE PASSENGER TRANSPORT EXECUTIVE
COMPARATIVE PERFORMANCE DATA FROM FRENCH TRAMWAYS SYSTEMS
SEMALY & FaberMaunsell 35/41 December 2003
APPENDIX
FINAL REPORT SOUTH YORKSHIRE PASSENGER TRANSPORT EXECUTIVE
COMPARATIVE PERFORMANCE DATA FROM FRENCH TRAMWAYS SYSTEMS
SEMALY & FaberMaunsell 36/41 December 2003
APPENDIX
GLOSSARY
BASE CHARACTERISTICS
Urban population ('000s) – The population of the urban area served by the local public transport services.
Urban employment ('000s) – The number of jobs within the urban area served by the local public transport services.
Urban land area (km²) – The amount of land covered by the local public transport services.
Length of line (km) – The end-to-end length of the tramway line in revenue service. It does not include turn-around tracks, stabling areas, or depot access.
Number of stops – The number of stops available to passengers on a given line in French systems. The number of independent stops in British systems with double-counting for stops served by multiple tramway lines.
Number of trams – The total number of tram vehicles used by the line / system, including spares and maintenance vehicles.
Capital cost of alignment (� or £ millions) – The total costs for the construction of the tramway line, including land acquisitions and rolling stock purchases, at the time of opening. These figures have not been adjusted for inflation.
Year of service opening – The year the initial line / system entered revenue service. Where known, the year that additional lines or extensions went into revenue service is also noted.
FARES POLICY
Average fare (� or £) – The average revenue received for the line / system in one year. It is calculated by dividing the total passenger revenue (including farebox, weekly, monthly, annual passes) by the total number of passengers. This information is not available for tramways in France.
Single trip pass (� or £) – The cost of a one-way, undiscounted voyage for an adult.
Day pass (� or £) – The cost of a pass that allows unlimited travel to one undiscounted adult over a one day period.

FINAL REPORT SOUTH YORKSHIRE PASSENGER TRANSPORT EXECUTIVE
COMPARATIVE PERFORMANCE DATA FROM FRENCH TRAMWAYS SYSTEMS
SEMALY & FaberMaunsell 37/41 December 2003
Week pass (� or £) – The cost of a pass that allows unlimited travel to one undiscounted adult over a seven day period.
Month pass (� or £) – The cost of a pass that allows unlimited travel to one undiscounted adult over a one month (or four week or 28-30 day) period.
Other fares – A variety of specific passes or tickets available to tramway passengers.
Discounts available – The types of reductions (concessions) available to certain members of the passenger population.
CORRIDOR CHARACTERISTICS
Length of route – Segregated – The length of alignment, in kilometres, in which the tramway runs in off-street, dedicated right-of-way similar to heavy-rail operating conditions. The tramway does not run in the street, but it can cross highways at grade. (This condition often occurs when a tramway is built in a former railway right-of-way.)
Length of route – Dedicated ROW – The length of alignment, in kilometres, in which the tramway runs in the street within a dedicated right-of-way. Cars do not drive on the tramway tracks. The tramway receives priority at signalised junctions with cars. (This condition can have trams running in the centre of the street with car traffic on both sides or on one side of the street usually between the car traffic lanes and a footway.)
Length of route – In mixed traffic – The length of alignment, in kilometres, in which the tramway runs in traffic lanes with cars and/or buses. It operates in mixed traffic and receives no dedicated priority at signalised junctions. (This condition resembles the running conditions of old-style trams where no separate facilities are available to tram vehicles.)
Percentage of route – Segregated – This characteristic is calculated as ‘Length of route – Segregated’ divided by the ‘Length of line’ (see Base Characteristics).
Percentage of route – Dedicated ROW – This characteristic is calculated as ‘Length of route – Dedicated ROW’ divided by ‘Length of line’ (see Base Characteristics).
Percentage of route – In mixed traffic – This characteristic is calculated as ‘Length of route – In mixed traffic’ divided by ‘Length of line’ (see Base Characteristics).
Cost per km (� or £ millions) – This characteristic is calculated as ‘Capital cost of alignment’ divided by ‘Length of line’ (see Base Characteristics).
Trams per km – This characteristic is calculated as ‘Number of trams’ (see Base Characteristics) divided by the ‘Length of line’ (see Base Characteristics).
Stops – Number – This figure is copied from ‘Number of stops’ in ‘Base Characteristics’.
Stops – Average spacing (m) – The average distance between tramway stops calculated ‘Length of line’ (see Base Characteristics) divided by ‘Number of stops’ (see Base Characteristics).
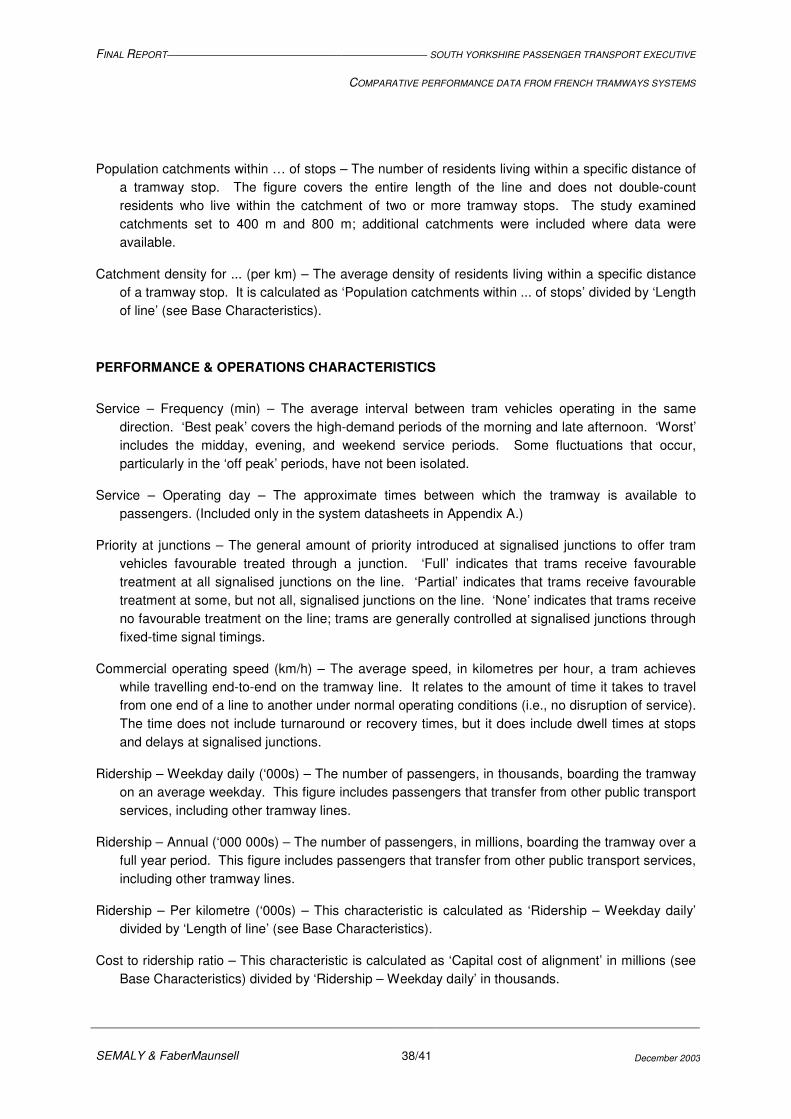
FINAL REPORT SOUTH YORKSHIRE PASSENGER TRANSPORT EXECUTIVE
COMPARATIVE PERFORMANCE DATA FROM FRENCH TRAMWAYS SYSTEMS
SEMALY & FaberMaunsell 38/41 December 2003
Population catchments within … of stops – The number of residents living within a specific distance of a tramway stop. The figure covers the entire length of the line and does not double-count residents who live within the catchment of two or more tramway stops. The study examined catchments set to 400 m and 800 m; additional catchments were included where data were available.
Catchment density for ... (per km) – The average density of residents living within a specific distance of a tramway stop. It is calculated as ‘Population catchments within ... of stops’ divided by ‘Length of line’ (see Base Characteristics).
PERFORMANCE & OPERATIONS CHARACTERISTICS
Service – Frequency (min) – The average interval between tram vehicles operating in the same direction. ‘Best peak’ covers the high-demand periods of the morning and late afternoon. ‘Worst’ includes the midday, evening, and weekend service periods. Some fluctuations that occur, particularly in the ‘off peak’ periods, have not been isolated.
Service – Operating day – The approximate times between which the tramway is available to passengers. (Included only in the system datasheets in Appendix A.)
Priority at junctions – The general amount of priority introduced at signalised junctions to offer tram vehicles favourable treated through a junction. ‘Full’ indicates that trams receive favourable treatment at all signalised junctions on the line. ‘Partial’ indicates that trams receive favourable treatment at some, but not all, signalised junctions on the line. ‘None’ indicates that trams receive no favourable treatment on the line; trams are generally controlled at signalised junctions through fixed-time signal timings.
Commercial operating speed (km/h) – The average speed, in kilometres per hour, a tram achieves while travelling end-to-end on the tramway line. It relates to the amount of time it takes to travel from one end of a line to another under normal operating conditions (i.e., no disruption of service). The time does not include turnaround or recovery times, but it does include dwell times at stops and delays at signalised junctions.
Ridership – Weekday daily (‘000s) – The number of passengers, in thousands, boarding the tramway on an average weekday. This figure includes passengers that transfer from other public transport services, including other tramway lines.
Ridership – Annual (‘000 000s) – The number of passengers, in millions, boarding the tramway over a full year period. This figure includes passengers that transfer from other public transport services, including other tramway lines.
Ridership – Per kilometre (‘000s) – This characteristic is calculated as ‘Ridership – Weekday daily’ divided by ‘Length of line’ (see Base Characteristics).
Cost to ridership ratio – This characteristic is calculated as ‘Capital cost of alignment’ in millions (see Base Characteristics) divided by ‘Ridership – Weekday daily’ in thousands.

FINAL REPORT SOUTH YORKSHIRE PASSENGER TRANSPORT EXECUTIVE
COMPARATIVE PERFORMANCE DATA FROM FRENCH TRAMWAYS SYSTEMS
SEMALY & FaberMaunsell 39/41 December 2003
Annual operating costs (� or £ M) – The costs per year associated with running the tramway. These figures include administration, operations, and maintenance. These data are not available for systems in France.

FINAL REPORT SOUTH YORKSHIRE PASSENGER TRANSPORT EXECUTIVE
COMPARATIVE PERFORMANCE DATA FROM FRENCH TRAMWAYS SYSTEMS
SEMALY & FaberMaunsell 40/41 December 2003
APPENDIX
DATA REFERENCES
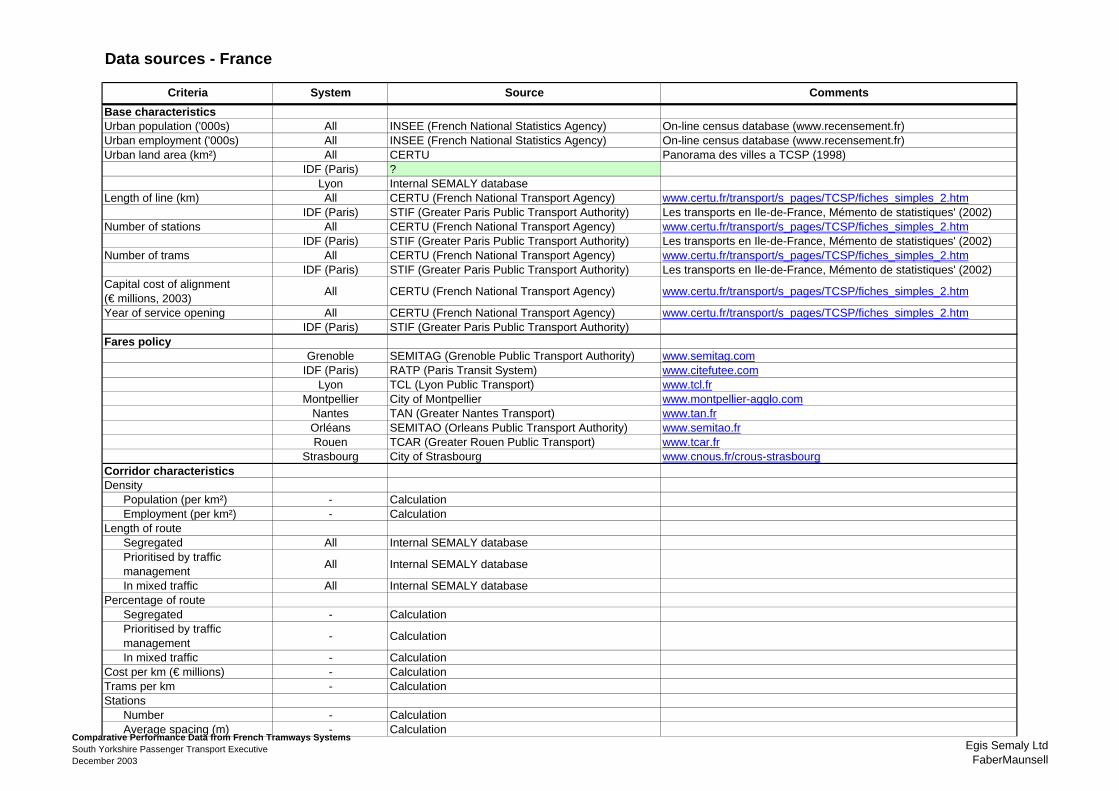
Data sources - France
Base characteristicsUrban population ('000s) All INSEE (French National Statistics Agency) On-line census database (www.recensement.fr)Urban employment ('000s) All INSEE (French National Statistics Agency) On-line census database (www.recensement.fr)Urban land area (km²) All CERTU Panorama des villes a TCSP (1998)
IDF (Paris) ?Lyon Internal SEMALY database
Length of line (km) All CERTU (French National Transport Agency) www.certu.fr/transport/s_pages/TCSP/fiches_simples_2.htmIDF (Paris) STIF (Greater Paris Public Transport Authority) Les transports en Ile-de-France, Mémento de statistiques' (2002)
Number of stations All CERTU (French National Transport Agency) www.certu.fr/transport/s_pages/TCSP/fiches_simples_2.htmIDF (Paris) STIF (Greater Paris Public Transport Authority) Les transports en Ile-de-France, Mémento de statistiques' (2002)
Number of trams All CERTU (French National Transport Agency) www.certu.fr/transport/s_pages/TCSP/fiches_simples_2.htmIDF (Paris) STIF (Greater Paris Public Transport Authority) Les transports en Ile-de-France, Mémento de statistiques' (2002)
Capital cost of alignment(€ millions, 2003)
All CERTU (French National Transport Agency) www.certu.fr/transport/s_pages/TCSP/fiches_simples_2.htm
Year of service opening All CERTU (French National Transport Agency) www.certu.fr/transport/s_pages/TCSP/fiches_simples_2.htmIDF (Paris) STIF (Greater Paris Public Transport Authority)
Fares policyGrenoble SEMITAG (Grenoble Public Transport Authority) www.semitag.com
IDF (Paris) RATP (Paris Transit System) www.citefutee.comLyon TCL (Lyon Public Transport) www.tcl.fr
Montpellier City of Montpellier www.montpellier-agglo.comNantes TAN (Greater Nantes Transport) www.tan.frOrléans SEMITAO (Orleans Public Transport Authority) www.semitao.frRouen TCAR (Greater Rouen Public Transport) www.tcar.fr
Strasbourg City of Strasbourg www.cnous.fr/crous-strasbourgCorridor characteristicsDensity
Population (per km²) - CalculationEmployment (per km²) - Calculation
Length of route Segregated All Internal SEMALY databasePrioritised by traffic management
All Internal SEMALY database
In mixed traffic All Internal SEMALY databasePercentage of route
Segregated - CalculationPrioritised by traffic management
- Calculation
In mixed traffic - CalculationCost per km (€ millions) - CalculationTrams per km - CalculationStations
Number - CalculationAverage spacing (m) - Calculation
Criteria System Source Comments
Comparative Performance Data from French Tramways SystemsSouth Yorkshire Passenger Transport ExecutiveDecember 2003
Egis Semaly LtdFaberMaunsell
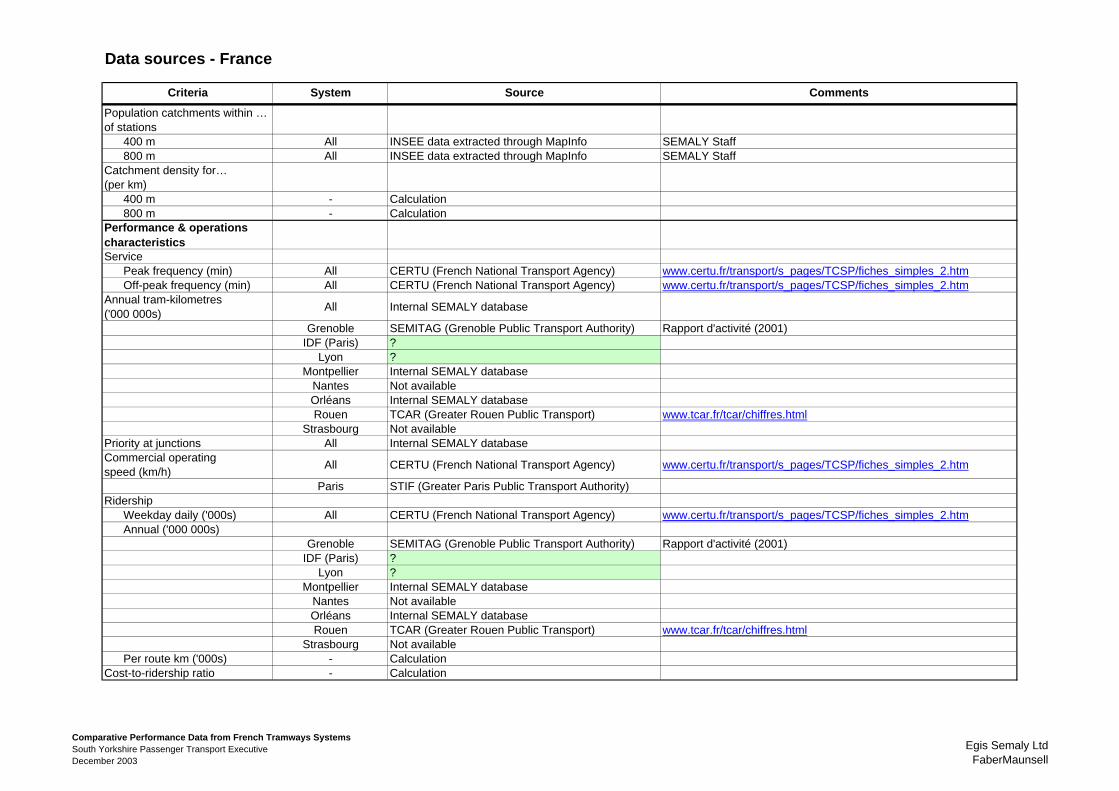
Data sources - France
Criteria System Source Comments
Population catchments within … of stations
400 m All INSEE data extracted through MapInfo SEMALY Staff800 m All INSEE data extracted through MapInfo SEMALY Staff
Catchment density for…(per km)
400 m - Calculation800 m - Calculation
Performance & operations characteristicsService
Peak frequency (min) All CERTU (French National Transport Agency) www.certu.fr/transport/s_pages/TCSP/fiches_simples_2.htmOff-peak frequency (min) All CERTU (French National Transport Agency) www.certu.fr/transport/s_pages/TCSP/fiches_simples_2.htm
Annual tram-kilometres('000 000s)
All Internal SEMALY database
Grenoble SEMITAG (Grenoble Public Transport Authority) Rapport d'activité (2001)IDF (Paris) ?
Lyon ?Montpellier Internal SEMALY database
Nantes Not availableOrléans Internal SEMALY databaseRouen TCAR (Greater Rouen Public Transport) www.tcar.fr/tcar/chiffres.html
Strasbourg Not availablePriority at junctions All Internal SEMALY databaseCommercial operating speed (km/h)
All CERTU (French National Transport Agency) www.certu.fr/transport/s_pages/TCSP/fiches_simples_2.htm
Paris STIF (Greater Paris Public Transport Authority)Ridership
Weekday daily ('000s) All CERTU (French National Transport Agency) www.certu.fr/transport/s_pages/TCSP/fiches_simples_2.htmAnnual ('000 000s)
Grenoble SEMITAG (Grenoble Public Transport Authority) Rapport d'activité (2001)IDF (Paris) ?
Lyon ?Montpellier Internal SEMALY database
Nantes Not availableOrléans Internal SEMALY databaseRouen TCAR (Greater Rouen Public Transport) www.tcar.fr/tcar/chiffres.html
Strasbourg Not availablePer route km ('000s) - Calculation
Cost-to-ridership ratio - Calculation
Comparative Performance Data from French Tramways SystemsSouth Yorkshire Passenger Transport ExecutiveDecember 2003
Egis Semaly LtdFaberMaunsell
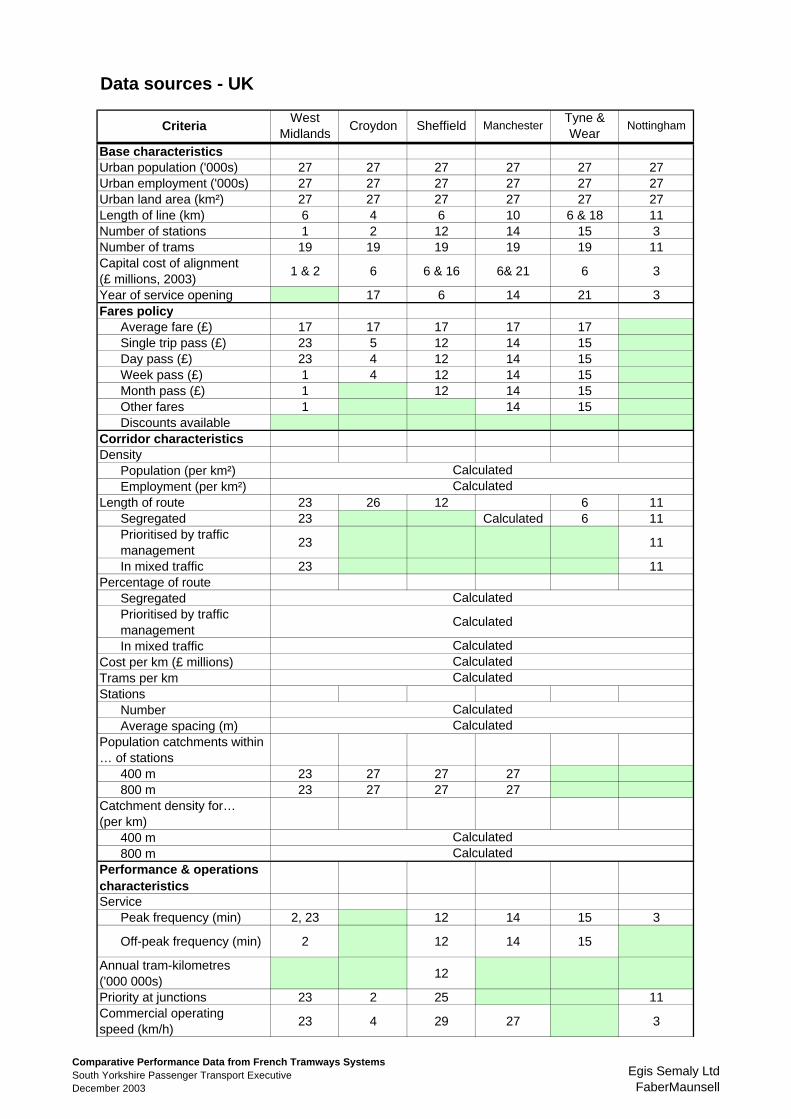
Data sources - UK
Base characteristicsUrban population ('000s) 27 27 27 27 27 27Urban employment ('000s) 27 27 27 27 27 27Urban land area (km²) 27 27 27 27 27 27Length of line (km) 6 4 6 10 6 & 18 11Number of stations 1 2 12 14 15 3Number of trams 19 19 19 19 19 11Capital cost of alignment(£ millions, 2003)
1 & 2 6 6 & 16 6& 21 6 3
Year of service opening 17 6 14 21 3Fares policy
Average fare (£) 17 17 17 17 17Single trip pass (£) 23 5 12 14 15Day pass (£) 23 4 12 14 15Week pass (£) 1 4 12 14 15Month pass (£) 1 12 14 15Other fares 1 14 15Discounts available
Corridor characteristicsDensity
Population (per km²)Employment (per km²)
Length of route 23 26 12 6 11Segregated 23 Calculated 6 11Prioritised by traffic management
23 11
In mixed traffic 23 11Percentage of route
SegregatedPrioritised by traffic managementIn mixed traffic
Cost per km (£ millions)Trams per kmStations
NumberAverage spacing (m)
Population catchments within … of stations
400 m 23 27 27 27800 m 23 27 27 27
Catchment density for…(per km)
400 m800 m
Performance & operations characteristicsService
Peak frequency (min) 2, 23 12 14 15 3
Off-peak frequency (min) 2 12 14 15
Annual tram-kilometres('000 000s)
12
Priority at junctions 23 2 25 11Commercial operating speed (km/h)
23 4 29 27 3
Calculated
Calculated
CalculatedCalculated
Calculated
Calculated
Calculated
CalculatedCalculated
CriteriaWest
MidlandsCroydon Sheffield Manchester
Tyne & Wear
Nottingham
CalculatedCalculated
Comparative Performance Data from French Tramways SystemsSouth Yorkshire Passenger Transport ExecutiveDecember 2003
Egis Semaly LtdFaberMaunsell
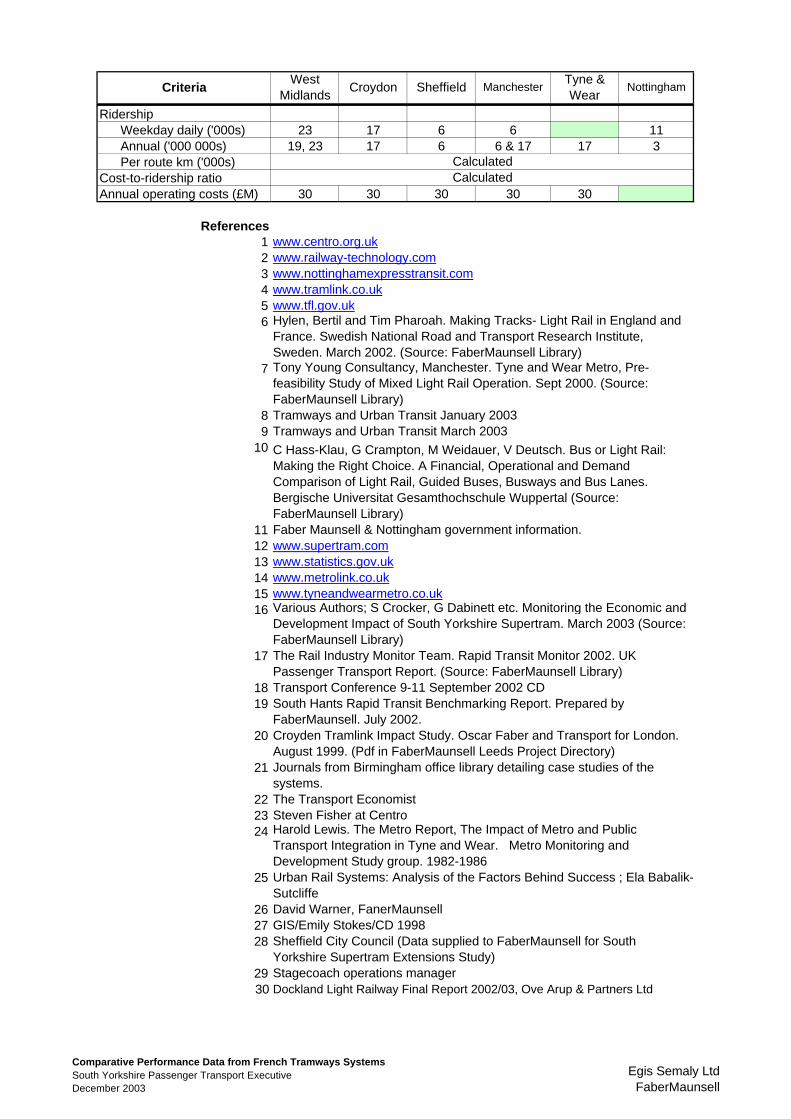
CriteriaWest
MidlandsCroydon Sheffield Manchester
Tyne & Wear
Nottingham
RidershipWeekday daily ('000s) 23 17 6 6 11Annual ('000 000s) 19, 23 17 6 6 & 17 17 3Per route km ('000s)
Cost-to-ridership ratioAnnual operating costs (£M) 30 30 30 30 30
References123456
7
89
10
111213141516
17
1819
20
21
222324
25
262728
2930
The Transport EconomistSteven Fisher at CentroHarold Lewis. The Metro Report, The Impact of Metro and Public Transport Integration in Tyne and Wear. Metro Monitoring and Development Study group. 1982-1986
Stagecoach operations manager
Urban Rail Systems: Analysis of the Factors Behind Success ; Ela Babalik- SutcliffeDavid Warner, FanerMaunsellGIS/Emily Stokes/CD 1998Sheffield City Council (Data supplied to FaberMaunsell for South Yorkshire Supertram Extensions Study)
Transport Conference 9-11 September 2002 CDSouth Hants Rapid Transit Benchmarking Report. Prepared by FaberMaunsell. July 2002. Croyden Tramlink Impact Study. Oscar Faber and Transport for London. August 1999. (Pdf in FaberMaunsell Leeds Project Directory)Journals from Birmingham office library detailing case studies of the systems.
www.metrolink.co.ukwww.tyneandwearmetro.co.ukVarious Authors; S Crocker, G Dabinett etc. Monitoring the Economic and Development Impact of South Yorkshire Supertram. March 2003 (Source: FaberMaunsell Library)The Rail Industry Monitor Team. Rapid Transit Monitor 2002. UK Passenger Transport Report. (Source: FaberMaunsell Library)
C Hass-Klau, G Crampton, M Weidauer, V Deutsch. Bus or Light Rail: Making the Right Choice. A Financial, Operational and Demand Comparison of Light Rail, Guided Buses, Busways and Bus Lanes. Bergische Universitat Gesamthochschule Wuppertal (Source: FaberMaunsell Library)Faber Maunsell & Nottingham government information.www.supertram.comwww.statistics.gov.uk
Hylen, Bertil and Tim Pharoah. Making Tracks- Light Rail in England and France. Swedish National Road and Transport Research Institute, Sweden. March 2002. (Source: FaberMaunsell Library)Tony Young Consultancy, Manchester. Tyne and Wear Metro, Pre-feasibility Study of Mixed Light Rail Operation. Sept 2000. (Source: FaberMaunsell Library)Tramways and Urban Transit January 2003Tramways and Urban Transit March 2003
www.railway-technology.comwww.nottinghamexpresstransit.comwww.tramlink.co.ukwww.tfl.gov.uk
CalculatedCalculated
www.centro.org.uk
Dockland Light Railway Final Report 2002/03, Ove Arup & Partners Ltd
Comparative Performance Data from French Tramways SystemsSouth Yorkshire Passenger Transport ExecutiveDecember 2003
Egis Semaly LtdFaberMaunsell

FINAL REPORT SOUTH YORKSHIRE PASSENGER TRANSPORT EXECUTIVE
COMPARATIVE PERFORMANCE DATA FROM FRENCH TRAMWAYS SYSTEMS
SEMALY & FaberMaunsell 41/41 December 2003
APPENDIX
TRAMWAY DATASHEETS
(Electronic file stored separately.)
• Croydon
• Dublin
• Grenoble
• Ile de France (Paris)
• Lyon
• Manchester
• Montpellier
• Nantes
• Nottingham
• Orléans
• Rouen
• Sheffield
• Strasbourg
• Tyne-and-Wear
• West Midlands