
Comparative Analysis with Heightmaps in VR
3
EUROVIS 2019/ J. Madeiras Pereira and R. Raidou Poster Comparative Analysis with Heightmaps in Virtual Reality Environments M. Kraus, J. Buchmüller, Daniel Schweitzer, D. A. Keim and J. Fuchs University of Konstanz Figure 1: Heightmaps in VR. We investigate the design space of VR heightmaps, discuss interaction techniques, such as interactive color adaption, selection (left), and zooming/filtering (center left). The overall focus is set on comparative heightmap visualizations. We use a stacked multi-layer design (center right) and enable the user to interactively position layers of heightmaps (right). Abstract 3D heightmaps can be considered as an extension of heatmaps using the third dimension to encode the respective value by height, often in addition to encoding it by color. In contrast to 2D heatmaps, 3D heightmaps allow a superposition without aggregation. However, they also have the general disadvantages of 3D visualizations, such as occlusion and perceptual distor- tion. Previous research has revealed various advantages of stereoscopic displays and virtual reality (VR) in the context of 3D visualizations, for example, concerning memorization, depth perception, and collaboration. In this paper, we present a novel technique to compare heightmaps in VR by introducing a multi-layer approach of stacked heightmaps. We demonstrate the applicability and usefulness of our method by means of a use case on comparative crime data analysis. CCS Concepts • Human-centered computing → Virtual reality; • General and reference → Design; 1. Introduction Heightmaps deploy the visual variable position (3D) in order to en- code information [BRLD17]. Additional variables, such as color, texture or transparency, can be used to encode even more attributes. Although the applicability and usefulness of heightmaps have been demonstrated on conventional 2D monitor screens, their deploy- ment in augmented or virtual realities has rarely been investi- gated. One challenge we are mainly concerned with is the use of heightmaps in comparative visualizations. There are three es- tablished approaches for comparing multiple heightmaps. One ap- proach is juxtaposition, that is the display of small multiples which can be visually compared with each other [vdEvW13]. With this approach, the user has to find the same position in each visual- ization and compare its value (color, height or both). Another ap- proach is to create a new visualization that combines the data of all heightmaps which are to be compared [KF13]. For instance, a difference view could be created in which values of the first heightmap are subtracted from values of the second one, result- ing in a heightmap that shows the differences between the two heightmaps at each position. As a result, absolute values are lost and only the relative offset between the two heightmaps is dis- played. We make use of the third option - superposition - by intro- ducing a multi-layer heightmap approach for comparative analysis in VR environments (VREs). 2. Prototype Our base visualization environment consists of a virtual room with white walls and a table in the center. The heightmap visualization is placed on top of the table (Figure 2) and the walls can be used to place 2D visualizations. As basic interactions, the user can nav- igate the VRE by walking and rotating the head-mounted display (HMD). For our prototype, we deployed the HTC Vive Pro HMD c 2019 The Author(s) Eurographics Proceedings c 2019 The Eurographics Association.
Transcript of Comparative Analysis with Heightmaps in VR

EUROVIS 2019/ J. Madeiras Pereira and R. Raidou Poster
Comparative Analysis with Heightmapsin Virtual Reality Environments
M. Kraus, J. Buchmüller, Daniel Schweitzer, D. A. Keim and J. Fuchs
University of Konstanz
Figure 1: Heightmaps in VR. We investigate the design space of VR heightmaps, discuss interaction techniques, such as interactive coloradaption, selection (left), and zooming/filtering (center left). The overall focus is set on comparative heightmap visualizations. We use astacked multi-layer design (center right) and enable the user to interactively position layers of heightmaps (right).
Abstract3D heightmaps can be considered as an extension of heatmaps using the third dimension to encode the respective value byheight, often in addition to encoding it by color. In contrast to 2D heatmaps, 3D heightmaps allow a superposition withoutaggregation. However, they also have the general disadvantages of 3D visualizations, such as occlusion and perceptual distor-tion. Previous research has revealed various advantages of stereoscopic displays and virtual reality (VR) in the context of 3Dvisualizations, for example, concerning memorization, depth perception, and collaboration. In this paper, we present a noveltechnique to compare heightmaps in VR by introducing a multi-layer approach of stacked heightmaps. We demonstrate theapplicability and usefulness of our method by means of a use case on comparative crime data analysis.
CCS Concepts• Human-centered computing → Virtual reality; • General and reference → Design;
1. Introduction
Heightmaps deploy the visual variable position (3D) in order to en-code information [BRLD17]. Additional variables, such as color,texture or transparency, can be used to encode even more attributes.Although the applicability and usefulness of heightmaps have beendemonstrated on conventional 2D monitor screens, their deploy-ment in augmented or virtual realities has rarely been investi-gated. One challenge we are mainly concerned with is the useof heightmaps in comparative visualizations. There are three es-tablished approaches for comparing multiple heightmaps. One ap-proach is juxtaposition, that is the display of small multiples whichcan be visually compared with each other [vdEvW13]. With thisapproach, the user has to find the same position in each visual-ization and compare its value (color, height or both). Another ap-proach is to create a new visualization that combines the data ofall heightmaps which are to be compared [KF13]. For instance,
a difference view could be created in which values of the firstheightmap are subtracted from values of the second one, result-ing in a heightmap that shows the differences between the twoheightmaps at each position. As a result, absolute values are lostand only the relative offset between the two heightmaps is dis-played. We make use of the third option - superposition - by intro-ducing a multi-layer heightmap approach for comparative analysisin VR environments (VREs).
2. Prototype
Our base visualization environment consists of a virtual room withwhite walls and a table in the center. The heightmap visualizationis placed on top of the table (Figure 2) and the walls can be usedto place 2D visualizations. As basic interactions, the user can nav-igate the VRE by walking and rotating the head-mounted display(HMD). For our prototype, we deployed the HTC Vive Pro HMD
c© 2019 The Author(s)Eurographics Proceedings c© 2019 The Eurographics Association.
M. Kraus, J. Buchmüller, Daniel Schweitzer, D. A. Keim and J. Fuchs / Comparative Analysis with Heightmaps in VR
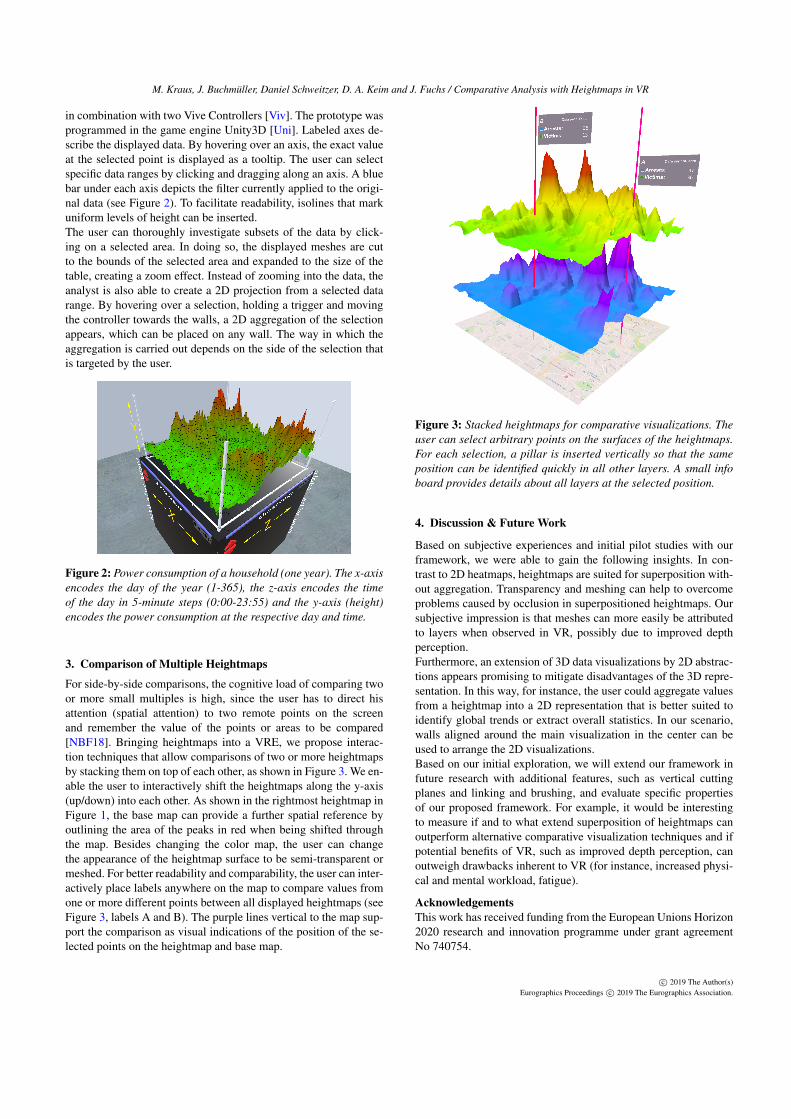
in combination with two Vive Controllers [Viv]. The prototype wasprogrammed in the game engine Unity3D [Uni]. Labeled axes de-scribe the displayed data. By hovering over an axis, the exact valueat the selected point is displayed as a tooltip. The user can selectspecific data ranges by clicking and dragging along an axis. A bluebar under each axis depicts the filter currently applied to the origi-nal data (see Figure 2). To facilitate readability, isolines that markuniform levels of height can be inserted.The user can thoroughly investigate subsets of the data by click-ing on a selected area. In doing so, the displayed meshes are cutto the bounds of the selected area and expanded to the size of thetable, creating a zoom effect. Instead of zooming into the data, theanalyst is also able to create a 2D projection from a selected datarange. By hovering over a selection, holding a trigger and movingthe controller towards the walls, a 2D aggregation of the selectionappears, which can be placed on any wall. The way in which theaggregation is carried out depends on the side of the selection thatis targeted by the user.
Figure 2: Power consumption of a household (one year). The x-axisencodes the day of the year (1-365), the z-axis encodes the timeof the day in 5-minute steps (0:00-23:55) and the y-axis (height)encodes the power consumption at the respective day and time.
3. Comparison of Multiple Heightmaps
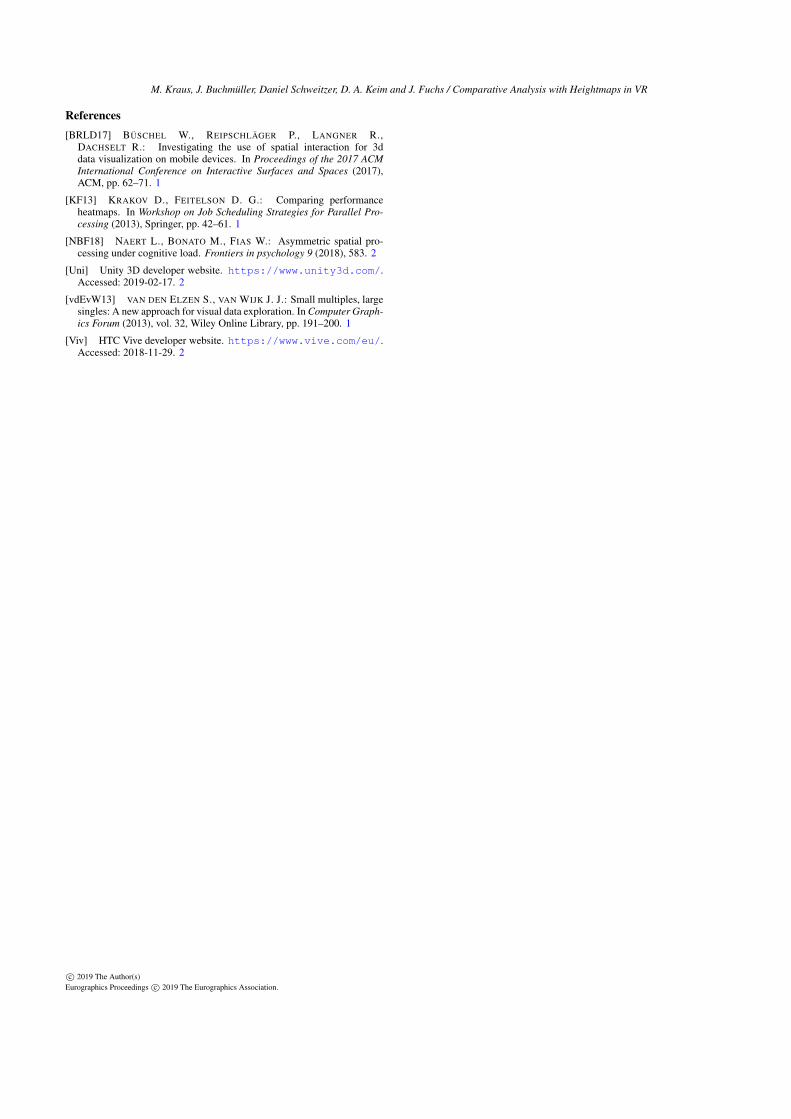
For side-by-side comparisons, the cognitive load of comparing twoor more small multiples is high, since the user has to direct hisattention (spatial attention) to two remote points on the screenand remember the value of the points or areas to be compared[NBF18]. Bringing heightmaps into a VRE, we propose interac-tion techniques that allow comparisons of two or more heightmapsby stacking them on top of each other, as shown in Figure 3. We en-able the user to interactively shift the heightmaps along the y-axis(up/down) into each other. As shown in the rightmost heightmap inFigure 1, the base map can provide a further spatial reference byoutlining the area of the peaks in red when being shifted throughthe map. Besides changing the color map, the user can changethe appearance of the heightmap surface to be semi-transparent ormeshed. For better readability and comparability, the user can inter-actively place labels anywhere on the map to compare values fromone or more different points between all displayed heightmaps (seeFigure 3, labels A and B). The purple lines vertical to the map sup-port the comparison as visual indications of the position of the se-lected points on the heightmap and base map.
Figure 3: Stacked heightmaps for comparative visualizations. Theuser can select arbitrary points on the surfaces of the heightmaps.For each selection, a pillar is inserted vertically so that the sameposition can be identified quickly in all other layers. A small infoboard provides details about all layers at the selected position.
4. Discussion & Future Work
Based on subjective experiences and initial pilot studies with ourframework, we were able to gain the following insights. In con-trast to 2D heatmaps, heightmaps are suited for superposition with-out aggregation. Transparency and meshing can help to overcomeproblems caused by occlusion in superpositioned heightmaps. Oursubjective impression is that meshes can more easily be attributedto layers when observed in VR, possibly due to improved depthperception.Furthermore, an extension of 3D data visualizations by 2D abstrac-tions appears promising to mitigate disadvantages of the 3D repre-sentation. In this way, for instance, the user could aggregate valuesfrom a heightmap into a 2D representation that is better suited toidentify global trends or extract overall statistics. In our scenario,walls aligned around the main visualization in the center can beused to arrange the 2D visualizations.Based on our initial exploration, we will extend our framework infuture research with additional features, such as vertical cuttingplanes and linking and brushing, and evaluate specific propertiesof our proposed framework. For example, it would be interestingto measure if and to what extend superposition of heightmaps canoutperform alternative comparative visualization techniques and ifpotential benefits of VR, such as improved depth perception, canoutweigh drawbacks inherent to VR (for instance, increased physi-cal and mental workload, fatigue).
AcknowledgementsThis work has received funding from the European Unions Horizon2020 research and innovation programme under grant agreementNo 740754.
c© 2019 The Author(s)Eurographics Proceedings c© 2019 The Eurographics Association.
M. Kraus, J. Buchmüller, Daniel Schweitzer, D. A. Keim and J. Fuchs / Comparative Analysis with Heightmaps in VR
References[BRLD17] BÜSCHEL W., REIPSCHLÄGER P., LANGNER R.,
DACHSELT R.: Investigating the use of spatial interaction for 3ddata visualization on mobile devices. In Proceedings of the 2017 ACMInternational Conference on Interactive Surfaces and Spaces (2017),ACM, pp. 62–71. 1
[KF13] KRAKOV D., FEITELSON D. G.: Comparing performanceheatmaps. In Workshop on Job Scheduling Strategies for Parallel Pro-cessing (2013), Springer, pp. 42–61. 1
[NBF18] NAERT L., BONATO M., FIAS W.: Asymmetric spatial pro-cessing under cognitive load. Frontiers in psychology 9 (2018), 583. 2
[Uni] Unity 3D developer website. https://www.unity3d.com/.Accessed: 2019-02-17. 2
[vdEvW13] VAN DEN ELZEN S., VAN WIJK J. J.: Small multiples, largesingles: A new approach for visual data exploration. In Computer Graph-ics Forum (2013), vol. 32, Wiley Online Library, pp. 191–200. 1
[Viv] HTC Vive developer website. https://www.vive.com/eu/.Accessed: 2018-11-29. 2
c© 2019 The Author(s)Eurographics Proceedings c© 2019 The Eurographics Association.


![Virtual Reality (VR) and Augmented Reality (AR) with ArcGIS...• Advanced controllers •Apps-AuGeo [mobile AR]-ArcGIS 360 VR [mobile VR] •Developer options-CityEngine-VR Experience](https://static.fdocuments.us/doc/165x107/5f35c40c3d0bbf62343de6ad/virtual-reality-vr-and-augmented-reality-ar-with-arcgis-a-advanced-controllers.jpg)