Comparative Advantage in International Trade for Central...
40
Comparative Advantage in International Trade for Central Asia by Matthias Lücke Kiel Institute of World Economics, Germany [email protected] (corresponding author) and Jacek Rothert Warsaw University, Poland *) Final version January 27, 2006 Comments welcome *) This paper was written while Jacek Rothert participated in the Advanced Studies Program at the Kiel Institute for World Economics, Germany.
Transcript of Comparative Advantage in International Trade for Central...

Comparative Advantage in International Trade for Central Asia
by
Matthias Lücke
Kiel Institute of World Economics, Germany
(corresponding author)
and
Jacek Rothert
Warsaw University, Poland *)
Final version
January 27, 2006
Comments welcome
*) This paper was written while Jacek Rothert participated in the Advanced Studies Program at the Kiel Institute for World Economics, Germany.

2
Contents
Executive Summary...............................................................................................................3
1 Introduction ...................................................................................................................5
2 Comparative Advantage with Many Goods and High Transport Costs ........................6
2.1 Theoretical Considerations ........................................................................................6
2.2 Approximations .........................................................................................................8
Factor Prices and Cost Structures..............................................................................8
Historic Trade and Production Patterns.....................................................................9
Recent Trends in Trade ...........................................................................................10
3 Cost Structures.............................................................................................................10
4 Historic Production Patterns........................................................................................13
5 Emerging Patterns of Trade.........................................................................................14
5.1 Direction of Trade ...................................................................................................14
5.2 Commodity Concentration ......................................................................................15
5.3 Normalized Net Exports ("Revealed Comparative Advantage") ............................15
6 Conclusions: Identifying Promising Export Markets and Policy Priorities ................16
Annex: The ITC Trade Map and Product Map Databases ..................................................24
Graphs and Appendix Tables ..............................................................................................26

3
Executive Summary
The purpose of this paper is to develop strategies for identifying the comparative advantage of Central Asian economies in international trade, given available information about factor prices and transport costs, historical production patterns, and recent trends in the geographical and product composition of Central Asian trade. In practice, it is not possible to determine a country's comparative advantage at the level of individual industries or products. However, awareness of a country's general pattern of comparative advantage can help policy makers to prioritize measures for promoting non-traditional exports along with policy reforms to reduce barriers to trade, whether related to trade policy instruments, to transport and transit, or to the investment climate. This paper focusses on Kazakhstan, the Kyrgyz Republic, Tajikistan and Uzbekistan, along with Azerbaijan and Mongolia.
While simple theoretical models of international trade suggest that every country must have a comparative advantage in some product, a careful examination of relevant theory suggests that this assertion provides no robust basis for predicting viable non-traditional export products. First, Central Asian countries are geographically remote and transport costs to the nearest sea ports (for access to the world market) are high because of long distances and multiple borders. With high transport costs, exporting (or importing) certain goods may become economically unviable and the country may end up producing a wider range of goods for domestic consumption (it will also be poorer, other things equal, than a similar country with better access to the world market).
Second, in practice, the number of goods produced is higher than the number of factors of production by any meaningful definition. In this case, even theoretical models no longer predict which particular goods a country will export (or import) under free trade. While a country will export the services of its abundant factors of production through its exports and imports of goods, there are normally multiple combinations of export and import products and quantities that are consistent with this requirement.
Third, the many labor migrants from Central Asia, working mainly in Russia, demonstrate that, when goods are expensive to trade because of geography and policy-induced barriers, it may be easier for workers to move in response to international wage differentials. Additional income in the form of migrant remittances is typically spent on both on imported and domestic goods. Therefore, exports will decline and the production of non-traded goods and services will increase in response to labor migration.
While it is not possible to determine a country's comparative advantage at the industry or product level and thus to predict the viability of particular non-traditional exports, this paper goes on to suggest broad guidelines for identifying potentially competitive export sectors. In each case, an initial assessment based on these guidelines will need to be complemented with a detailed analysis of what obstacles exist to the development of these exports and how these obstacles might be removed. What exports are economically viable can ultimately only be established through entrepreneurial activity under hard budget constraints defined by conditions in national and global markets.
First, this paper considers international comparisons of the prices of important factors of production, especially manufacturing wages. In contrast to the predictions of popular trade-theoretical models, factor endowments in reality are too different across countries for factor prices to be equalized through trade in goods and services. Therefore, current factor

4
prices are a useful indicator of a country's comparative advantage (this point is likely to be more obvious to non-economists than to economists trained in traditional trade theory). The largest international factor price differences are for low-to-medium-skilled labor, rather than financial capital or machinery. Among CAREC countries, the officially reported monthly wage ranges from around US$ 15 in resource-poor Tajikistan to nearly US$ 160 in oil-rich Kazakhstan. Among comparator countries, Sri Lanka has a monthly wage in the same low order of magnitude and China between US$ 100 and US$ 200. Therefore, the resource-rich CAREC countries (Kazakhstan and Azerbaijan) will hardly be able to compete on price in labor-intensive products manufactured for the world market (i.e. in direct competition with China, in particular). For the remaining countries, the viability of particular investment projects involving labor-intensive exports would have to be assessed based on detailed cost structures, including for buildings and transport.
Second, remoteness from the world market entails not only high monetary transport costs, but also long transport times which are an obstacle to export expansion in their own right. It has been estimated from US data that, for manufactured goods, each day saved in shipping is worth 0.8 percent ad-valorem in terms of a higher sales price (and vice versa). With transport time between Tashkent and Paris, for example, at around 250 hours compared to 25 hours between Paris and Warsaw, it is very difficult for Central Asian countries to expand exports by integrating into production networks operated by European firms (a strategy employed with much success in Central and Eastern Europe). Enhanced processing of local raw materials that are already exported (such as cotton) will often be a more viable option.
Third, the decline of trade among the republics of the former Soviet Union after 1990 occurred in a chaotic fashion and may partly have reflected the vagaries of the disintegration process rather than the long-term viability of particular trade flows under market conditions. Therefore, this paper examines historic production patterns in manufacturing with a view to identifying sectors that played a large role during the late 1980s but are no longer significant. While some such industries might be gone for good, it is conceivable that others could be restructured and become economically viable. In general, the spatial allocation of industries across the former Soviet Union appears to have rationally followed local resource endowments; however, there was a tendency in many industries to create oversized enterprises with a narrow product range acting as near-monopoly suppliers for large parts of the Soviet Union.
Fourth, recent international trade patterns offer some clues to possible paths of export expansion. In most CAREC countries, exports are highly concentrated on a few commodities, mostly raw materials. At the same time, prominent export products vary somewhat across countries so that export growth would not push Central Asian countries to compete all in the same products; many trade flows are also so small in relation to potential markets (Russia, Western Europe, etc.) that ruinous export competition is hardly a serious possibility. For several industrial products, Central Asian countries are significant exporters to CIS countries, but not to the rest of the world. While this observation suggests that transaction costs are lower in trade with CIS countries, for example because traditional supply channels are still functional, it also provides a starting point for an investigation of how exports to the rest of the world might be expanded.
Finally, this paper uses several brief case studies to demonstrate how recent trade patterns can be analyzed with the TradeMap and ProductMap data tools developed by the International Trade Center (which are described in the Annex in more detail) to identify possible opportunities for export expansion.

5
1 Introduction1
This paper develops strategies for identifying the comparative advantage of selected Central Asian economies in international trade against the background of recent trends in the geographical and product composition of Central Asian trade. It responds to a request from Central Asian governments, within the CAREC initiative, to assist them in identifying those sectors where they are likely to have particularly favorable prospects in the world economy. The purpose of this paper is to help governments prioritize policy reforms to reduce barriers to trade, whether related to trade policy, transport and transit or to the host of behind the border issues commonly summarized under the notion of the business climate. Setting priorities is crucial because there are simply too many potential concerns for governments to be able to tackle them simultaneously.
This paper focuses on Kazakhstan, the Kyrgyz Republic, Tajikistan and Uzbekistan, along with Azerbaijan and Mongolia.2 These countries are among the most remote contries anywhere from major international markets in Europe, America and Asia. In addition, their transport infrastructure was built with an orientation towards the other former Republics of the Soviet Union and their economies specialized within the division of labor of the Council for Mutual Economic Aid (CMEA), with a politically conditioned insulation from the world market.
Over the past 15 years, these countries have undergone a process of gradual as well as uneven integration into the world economy. The share of non-CIS countries in their foreign trade has increased somewhat, as politically induced isolation from world markets under the central planning system has been overcome. However exports to non-CIS countries are dominated by raw materials and commodities, particularly energy products, cotton, wheat, and gold; manufactures remain significant only in trade with CIS countries.
Remarkably, CAREC countries, with the possible exception of Uzbekistan, have relatively open and liberal trade regimes, along with several regional trade agreements (although these are not always consistently applied). Trade liberalization has not led to greater geographical and product diversification in international trade largely because of the remaining "behind-the-border" obstacles (including cumbersome regulations for business entry and exit, weak domestic financial markets, and pernicious governance problems) as well as shortcomings in transport and customs procedures.3
Against this background, this paper develops strategies for identifying the comparative advantage of CAREC economies with a view to helping governments to prioritize policy reforms. The paper begins by stressing the methodological difficulties of identifying comparative advantage in a dynamic world economy, with multiple products and factors, resource booms, and large inflows of remittances (Section 2). On this basis, we caution against attempting to protect or subsidize particular industries on the grounds of their 1 This paper was commissioned by the World Bank at the request of the Trade Policy Coordination Committee under the Central Asian Regional Economic Cooperation initiative, supported by a group of IFIs (ADB, EBRD, IMF, UNDP and World Bank). CAREC includes Azerbaijan, China, Kazakhstan, Kyrgyz Republic, Mongolia, Tajikistan, and Uzbekistan. 2 Neither China nor Afghanistan or Russia are included in this paper because their development and trade challenges are rather different. 3 These obstacles, and the potential benefits of removing them, are being analyzed by the ADB as part of a larger study on Trade, Transport and Transit (the 3Ts).

6
presumed future comparative advantage. We also discuss several rules of thumb that will allow us, in subsequent sections, to suggest an illustrative list of potentially competitive sectors. On this basis, it should be possible to prioritize government actions to improve conditions for international trade, involving suitably non-distortionary policy tools.
Sections 3 to 5 apply those rules of thumb to suggest where the comparative advantage of Central Asian countries may lie. Section 3 discusses the evolution of manufacturing wages and other key cost elements. Section 4 discusses historic production patterns in the former Central Asian Soviet republics. Section 5 reviews the geographic reorientation of trade towards non-CIS countries, the commodity concentration of exports and imports, and current patterns of "revealed comparative advantage" (i.e. net exports at commodity level).
Finally, Section 6 gives some hints on how businesses and policymakers can use these insights to identify products and sectors whose potential export competitiveness merits further investigation. This section also demonstrates the use of the TradeMap and ProductMap data tools developed by the International Trade Center Geneva (ITC), which are freely available in many developing countries and are described in more detail in the Annex. While economic theory does not permit us to determine comparative advantage down to the level of industries or even product groups, being aware of what general direction export expansion is likely to follow may enable policymakers to prioritize export promotion measures as well as policy reforms that remove obstacles to closer integration with regional and global markets.
2 Comparative Advantage with Many Goods and High Transport Costs
Comparative advantage and the benefits from specialization are popular notions in economic theory and are often useful, at a high level of abstraction, in understanding the mechanisms that drive international trade and the effects of trade policy. However, these notions provide no guidance for identifying particular sectors or industries that countries "should" specialize in. Section 2.1 explains in a non-technical fashion the theoretical considerations behind this assertion.
At the same time, it is possible to give some guidance as to what types of industries can realistically be expected to develop under existing conditions. Section 2.2 discusses several indicators, none of which should be looked at in isolation, but which may jointly give a sense of the likely international competitiveness of various economic activities.
2.1 Theoretical Considerations
Introductory courses in international economics frequently teach comparative advantage as the basis for specialization in international trade. Assume, for example, that the home country's trading partners are technologically superior in all industries (i.e. the home country finds itself at an absolute disadvantage in all sectors). Even then, it is normally possible to identify a good where the absolute technological disadvantage is less pronounced than elsewhere; this is the sector where the home country enjoys a comparative advantage. It is easy to see that the home country's consumption possibilities (or real income) will grow if it specializes in the production and export of that good and imports other goods (where it finds itself at a comparative as well as an absolute

7
disadvantage). In this sense, it is frequently asserted that every country must have a comparative advantage in some goods.
This assertion is not helpful for our present task because introductory models of international trade tend to neglect crucial features of reality that have a strong bearing on economic development in Central Asia. First, Central Asian countries are all landlocked and transport costs to the nearest sea port (still the best available approximation of an access point to the world market) are fairly high. One intuitive way of accounting for international transport costs in economic models is to assume that a certain share of imports and exports "evaporates" before reaching the respective importing country's border. If transport costs are too high, international trade becomes unattractive relative to domestic production. Furthermore, if transport costs differ sharply across products, they may drive the commodity composition of a country's international trade and push other determinants (factor endowments, technological level) into the background.
Second, elementary trade models typically assume that there is an equal number of goods and factors of production. However, in reality, by any meaningful definition, there are more goods than factors of production (e.g. human and physical capital, labor, natural resources). In that case, it is no longer possible to predict which particular goods a country will export under free trade. It is possible to state that each country will be a net exporter, through its international trade in goods, of the services of those factors of production with which it is better endowed than the rest of the world. However, this statement does not translate directly into "comparative advantage" in particular goods.
Third, elementary models normally do not include non-traded goods. This omission becomes particularly relevant when a country experiences a resource boom (such as Azerbaijan and Kazakhstan). Export prices of natural resources are higher than production costs by the amount of the resource rent. With a rapid increase in foreign exchange revenues from exports, the domestic currency tends to appreciate, rendering non-resource exports less competitive, and making imports cheaper. Factors of production will therefore shift from the production of non-resource exports and import-competing goods to the production of non-tradables.4
Fourth, elementary models of international trade assume that factors of production (or at least labor) cannot move across borders. In reality, the large number of labor migrants from Central Asia, who work mainly in Russia, attest to the fact that, when goods are expensive to trade because of geography and policy-induced barriers, it may be easier for people to move in response to international wage differentials. In some ways, the economic effects of greater opportunities for migration are similar to a natural resource boom. Remittances from workers abroad are typically spent not only on imports, but also on domestically produced goods and services. Increasing demand for non-traded goods will lead to a real appreciation of the domestic currency, cheaper imports, and less competitive goods exports. Although reliable numbers are hard to come by, it is clear that large shares of the working populations of the smaller, resource-poor CAREC countries now work abroad, especially in Russia.
This brief survey of relevant theory demonstrates that it is generally impossible to predict in which particular goods or industries has a comparative. Furthermore, with large natural
4 A development along these lines is frequently described as a "Dutch disease". As a result of natural gas discoveries in the Netherlands in the 1950s and a subsequent surge in gas exports, the Dutch currency appreciated in real terms and Dutch manufactured exports became less competitive.

8
resources or opportunities for migration, a country’s production structure may shift strongly towards non-tradable goods and services.
2.2 Approximations
The previous section demonstrates that there is no analytically rigorous and empirically robust way to identify sectors in which a transition economy will enjoy a comparative advantage. This insight alone cautions against government policies that attempt to “pick winners”, i.e. single out industries for special protection or subsidization based on the hope that they will later become internationally competitive. Other arguments against such policies are based on the political economy of protection. In particular, it is highly likely that government policy would be hijacked by sectoral interests and protection will become entrenched, rather than being phased out over time. Most countries that attempted such policies, especially in Latin America, suffered from economic stagnation as a result.5
However, the purpose of this paper is not to describe how to pick winners (industries to be protected and subsidized), but to suggest examples of industries that could become successful exporters or replace imports in Central Asia, given the right policy environment. While these examples would be used to suggest priorities for policy reforms, these reforms will still be meaningful (though possibly of a lower priority) if our suggestions regarding comparative advantage turn out to be wrong. In this sense, the following considerations may be useful in identifying the kinds of industries that might have a comparative advantage in Central Asia in the medium to long run.
Factor Prices and Cost Structures In traditional (Heckscher-Ohlin-Samuelson) trade theory, it is strictly a country’s endowment with factors of production (not the prevailing factor prices) that determines the pattern of international trade. This is important in theory because countries with “not-too-different” relative factor endowments may have their factor equalized through trade (trade increases demand for relatively abundant factors, and hence their relative prices). Therefore, even if factor prices are equalized across countries by trade, the pattern of trade reflects relative factor endowments.
In practice, however, factor endowments across most countries are too different for trade to equalize factor prices (Clague 1991a, 1991b). The largest international factor price differences exist for low-skilled labor where productivity-adjusted wages (expressed in US$) are far lower in labor-abundant developing countries than in capital-abundant industrial countries. By contrast, price differences for many other factors of production are less pronounced; for example special industry machinery is typically produced by a limited number of firms and exported world-wide for broadly the same ex-factory prices.
5 It is also true that South Korea and Taiwan had fairly interventionist trade and industrial policies in the 1950s and 1960s. Their much greater success with these policies is related to several factors. First, these countries chose the industries to be supported on the basis of the (successful) Japanese model of industrial development. It may be noted that the international division of labor is much more diverse today, so that Central Asian countries would not find an appropriate, straightforward industrial development model to follow step by step. Second, in South Korea and Taiwan, politicians remained firmly in charge of industrial policy. Without significant natural resources, the survival of the political regimes depended on economic success, which would have been hindered by uncompetitive, protected industries. In many Central Asian countries, the low quality of the business climate and wide prevalence of corruption suggest that govenrment policy could quickly succumb to special interests.

9
Therefore, international cost differences for machinery reflect mostly differences in the costs of transportation and importation (including tariffs, licences, etc.). Medium and high-skilled labor also tends to be cheaper in developing countries (when salaries are expressed in US$), but the difference is smaller than for low-skilled labor. Furthermore, developing countries may enjoy some cost advantage in buildings, whose construction tends to use low-skilled labor intensively.
In terms of pure manufacturing costs, therefore, low wages for low-skilled labor (productivity-adjusted; measured in foreign currency) suggest potential competitiveness in labor-intensive manufactures (unsurprisingly). However, for differentiated products, manufacturing costs may only be a small portion of the cost of getting the right kind of product to the customer. For example, many labor-intensive manufactures (clothing, shoes, etc.) are highly fashion-dependent; to export successfully, a firm must have low-cost access to up-to-date designs, marketing channels in importing countries, transport within the exporting country, international transport, etc. Ultimately, such costs and the time it takes to get a product to market may be more important for export competitiveness than pure manufacturing costs.
On balance, therefore, low manufacturing wages indicate potential competitiveness in pure manufacturing costs for low-skill-intensive goods. However, whether potential competitiveness can be translated into expanding exports depends crucially on the local business climate as well as the cost of transactions with international suppliers and customers.
Historic Trade and Production Patterns The central planning process in the former Soviet involved significant inefficiencies through excessive firm size, inefficient interactions among economic agents, and politically imposed insulation from world markets. At the same time, the allocation of economic activities across space within the former Soviet Union was arguably broadly rational – with low-skilled-labor-rich republics specializing in labor-intensive commodities (e.g. Murrell 1990, Chapter 7; Lücke 1992). The dissolution of the former Soviet Union and the early transition process, in which administrative trade among former Soviet republics was replaced by market-based trade among newly independent states, often proceeded in a chaotic fashion. Industrial restructuring to adapt existing industrial plant to the requirements of the world market, which would typically have required significant investment outlays, was frequently hampered by an unfavorable investment climate.
It is instructive, therefore, to consider historic production structures, particularly in manufacturing, with a view to identifying sectors that played a large role during the late 1980s but are no longer significant. While some such industries might be gone for good together with the inefficiencies of the central planning process (such as oversized monopoly producers for particular capital goods), others might conceivably be revived, given size adjustment, appropriate corporate governance, investment in technological updating, etc. If successful, newly competitive exports would partly reflect path dependency (existing plant and labor with sector-specific training), combined with a fundamentally rational location decision for the plant under the central planning system.
The notion of path dependency may be taken one step further. Given the CIS countries' shared language of international communication (Russian), history, transition experiences, business culture, existing transport links, regional trade agreements: Which exports from CAREC countries are most likely to benefit from these linkages, which should help to reduce transaction costs within the CIS compared to the rest of the world? Especially,

10
given recent import growth in Russia, which Russian imports would CAREC countries be in a good position to supply?
Recent Trends in Trade Obviously, a strong (or strongly improving) export performance in a commodity is also suggestive of comparative advantage. Less obviously, CIS countries tend to export a much wider range of goods (especially manufactures) to other CIS countries than to the rest of world. This is likely to reflect lower transaction costs in trade with CIS countries, familiarity with market conditions, traditional supply relationships, etc. At the same time, with appropriate investment in product design, marketing channels, etc., CIS markets could conceivably serve as a springboard to markets further away.
Similarly, declining imports combined with growing domestic production could indicate the emergence of comparative advantage in the sector – or at least, a reduction in a previous comparative disadvantage. However, any analysis of trends and patterns in foreign trade needs to take into account that observed trends and patterns may reflect existing distortions rather than future competitive potential.
3 Cost Structures
As discussed in Section 2.2, low wages for low-to-medium-skiled labor are a likely source of comparative advantage in manufacturing for Central Asian countries. At the same time, the actual competitiveness of labor-intensive industries based in Central Asian countries will also depend on other costs, especially transport costs to the “world market” (for practical purposes, to the nearest seaport or overland to Europe).
Table 1 compares the evolution of the monthly average wage in US dollars in CAREC and other selected countries. Among CAREC countries, the officially reported monthly wage ranges from around US$ 15 in resource-poor Tajikistan to nearly US$ 160 in oil-rich Kazakhstan. Among the comparator countries listed, only Sri Lanka has a monthly wage in the same low order of magnitude. However, the data source does not list China which is large exporter of labor-intensive products. The best available information indicates that China’s manufacturing workers earned around US$ 100 per month on average in 2002, with urban manufacturing employees closer to US$ 200 and manufacturing workers in Township and Village Enterprises (TVE), which are located mostly outside cities, closer to $ 70 (Banister 2004).
Table 1 suggests that the resource-rich CAREC countries (Kazakhstan and Azerbaijan) will hardly be able to compete on price in labor-intensive products manufactured for the world market (i.e. in direct competition with China, in particular). Both the relatively high wages (measured in US dollars) and high transport costs militate against such an approach. For the remaining countries, the viability of particular investment projects involving labor-intensive exports would have to be assessed based on detailed cost structures, including for buildings and transport.
Raballand, Kunth, Auty (2005) discuss the linkage between transport costs and the commodity and regional composition of Central Asian exports and imports. Two observations stand out. First, transport time between Western Europe (Paris) and locations to the East increases more or less proportionately with distance within Central Europe, but closer to exponentially after crossing the Polish-Belarusian border. This "virtual border" is

11
1995 1996 1997 1998 1999 2000 2001 2002 2003
CARECAzerbaijan n.a. n.a. n.a. n.a. 45 50 56 65 79Kazakhstan n.a. n.a. n.a. n.a. 90 97 118 133 156Kyrgyz Republic 33 29 40 29 23 26 30 37 44Mongolia 33 37 34 40 39 49 52 n.a. n.a.Tajikistan n.a. n.a. n.a. n.a. 9 9 10 12 15Uzbekistan 36 54 54 57 57 44 39 39 41
Comparator CountriesBrazil n.a. 920 926 885 542 560 470 405 427Czech Republic 405 470 446 478 469 453 501 613 754Hong Kong SAR 768 819 861 864 859 872 918 906 886Mexico 234 232 259 262 298 350 402 416 397Sri Lanka 77 77 74 75 74 77 72 78 n.a.
Source: IMF Country Reports, most recent issues available; World Bank Office Tashkent; US Bureau of Labor Statistics.
Table 1. CAREC and Comparator Countries: Average Monthly Wage, 1995-2003 (US$)
related to various factors such as time-consuming border controls when trucks or rail cars enter the EU from Eastern Europe and lower running speeds of trucks and trains in CIS countries.
Long transport times are likely to be an obstacle to trade development quite apart from direct transport costs. Hummels (2001) estimates, based on US data, that for manufactured goods each day saved in shipping is worth 0.8 percent ad-valorem in terms of a higher sales price. With transport time between Tashkent and Paris, say, at around 250 hours compared to 25 hours between Paris and Warsaw, this alone amounts to a substantial competitive disadvantage of Central Asian vs. Central European firms. As participation in production networks requires just-in-time deliveries of goods along the production chain, long (and presumably variable) transport times render it more difficult for Central Asian firms to initiate non-traditional exports by participating in production networks.6
Second, direct transport costs between Western Europe and Central Asia are rather high, relative to the fob prices of potential export goods, because of long distances as well as certain idiosyncratic factors. For example, shippers have to include the replacement cost of containers in the price of shipments to Central Asia on the assumption that containers cannot be recovered. Furthermore, logistics infrastructures in Central Asia are inefficient in meeting the needs of small exporters who are not able to guarantee a regular flow of full containers to a particular location.7 Table A1 reproduces estimates of the cost of road, rail/sea, and air transport from Central Asia and the Caucasus to Belgium for large (using
6 The growing importance of production networks is also reflected in the finding by Carrere and Schiff (2004) that the "average distance of trade" has declined over the last several decades for many country groups, especially those engaging in intensive regional integration such as EU member countries (which would also be important market for non-traditional exports from Central Asia). 7 For example, anecdotal evidence suggests that freight consolidation services hardly exist at all in Tajikistan.
12
full units, such as containers or planeloads) vs. small (shipping 1-ton parcels) exporters. For small exporters, road and air transport are approximately twice as expensive, and rail/sea transport up to 4 times as expensive as for large exporters.
It is difficult to translate these transport costs into an ad-valorem equivalent for exports to Western Europe. For a start, Ravalland, Kunth, Auty (2005) indicate that transport costs to Paris are 3 to 5 times as high from Tashkent as from Warsaw. Furthermore, they suggest that for metals exports from Central Asia to Western Europe as well as for cotton exports from Kyrgyzstan to Russia, transport costs are below 10 percent of the fob price of exports. On the other hand, for several agricultural products (tobacco, apple juice concentrate), transport costs from Central Asia quickly approach prohibitive levels even for deliveries to Russia (around 16 percent for tobacco), thus limiting exports in spite of ample local supplies and processing capacities.
At least two alternative strategies for expanding non-traditional exports from Central Asia could be conceived; both are hampered by elevated levels of transport times and costs. First, Central Asian firms could aim to integrate into global or European production chains. This would allow them to concentrate on specific components of the value added chain in which they enjoy a competitive advantage (for example, based on low labor costs). Commercial partners (for example, West European firms) would typically provide some intermediate inputs, machinery, financing, and a wide range of technological and marketing know-how.
However, such a strategy would force Central Asian firms to compete directly with enterprises in the Western CIS and Western Balkans where wages are also quite low while transport times and costs to Central and Western Europe are much lower than from Central Asia. Transport costs would be a particularly serious concern because export volumes would initially be small (driving up transport costs) and because integration into value added chains would require substantial imports of intermediate products (increasing the ratio of transport costs to local value added). In sum, integration into global, or more particularly, West European production chains presents many difficult challenges.
Second, Central Asia could aim to expand non-traditional exports by vertically integrated industries. This strategy would be most promising for the processing of raw materials that are already competitive (traditional) exports, such as local cotton processed into textile yarn, fabrics, or clothing. Central Asian firms would have to compete especially with producers in China which also benefit from low wages but enjoy well-functioning international transport links (container liner services across the world), enabling them to obtain inputs at world market prices and export world-wide at reasonable transport costs. In fact, container freight rates from the East China coast to Rotterdam appear to be substantially lower than rail freight from Central Asia,8 while transport times could also be somewhat shorter depending on the precise routing.
While manufactured exports based on processing traditional export commodities may frequently be viable, there are not many such raw commodities (cotton is probably the most important one). Furthermore, the production and marketing of textiles and clothing requires substantial managerial and technological know-how, which cannot be created overnight. It is essential, therefore, that processing activities should not be based on
8 Reportedly, transport costs for typical consumer good exports from the Far East to Europe are 1 to 2 percent of end user prices (Volk 2002), compared to around 10 percent 20 years ago. Shipping a rail car from Central Asia to Europe cost very approximately US$ 4,000 in 2003, compared with around US$ 2,000 for a container from China to Rotterdam.

13
artificial incentives, such as maximum prices imposed for local raw materials (whose domestic prices are already below the world market level because of high international transport costs). What is clear from this discussion is that long transport times and high transport costs are key obstacles for the expansion of non-traditional exports; any measures in the broad area of trade facilitation that effectively reduce these obstacles are likely to generate a high rate of return.
4 Historic Production Patterns
Appendix Table A2 summarizes the structure of industry according to the last industry census conducted in the Soviet Union in 1989. The data have been rearranged according to the 1987 version of the US Standard Industrial Classification. They cover civilian industry (including mining), but not the military industrial complex.
The structure of employment across branches of industry showed some similarities across the five countries (former Soviet republics) for which data are available. Food processing accounted for around 15 percent of civilian industrial employment in all countries. Light industry (leather goods, textiles, clothing) was very prominent, accounting for between 23 percent and 35 per cent of industrial employment except in Kazakhstan where its share was only 12 percent. Capital goods industries combined (industrial machinery including computers, electrical and electronic goods, transport equipment, precision instruments) accounted for 7 percent of industrial employment in Tajikistan, 20 percent in Kyrgyzstan, and 12 percent to 15 percent in the remaining countries. Mining played a particularly important role in Kazakhstan where it accounted for 24 percent of industrial employment.
Overall, these observations are compatible with the notion that the structure of industry during the late Soviet years reflected a broadly rational allocation of economic activity across space within the Soviet Union (Murrell 1990; Lücke 1992). In particular, light industry was especially important in the less developed republics (Tajikistan, Uzbekistan), where the main raw material – cotton – is also produced. Large primary metals industries in Azerbaijan, Kazakhstan, and Tajikistan reflect the local availability of energy resources.
At the same time, the data document a tendency of Soviet-era planners to set up large, highly specialized plants which were near-monopoly suppliers within the former Soviet Union (Brown, Ickes, Ryterman 1994; Lücke, 1994). One potential example is the electrical industry in Kyrgyzstan (at 9.4 percent of industrial employment), half of which was represented by one plant ("named after the 50th anniversary of the Soviet Union") that produced lightbulbs with more than 6,000 staff in 1989. After substantial restructuring and probably downsizing, it is conceivable that such plants could be viable under market economy conditions if their input requirements are broadly in line with local factor endwoments and if they can maintain access to a large enough regional market (in this case probably including South Eastern Kazakhstan, Kyrgyzstan, Uzbekistan, and Tajikistan).9
While path dependence may thus lead to the persistence of particular exports, this example also demonstrates the limitations of using past production and trade patterns as a guide to
9 Kandogan (2003 and 2004) summarize the interplay of changes in quantity, quality, and variety in the restructuring of former socialist enterprises in Central Eastern Europe and in the CIS. Crucially, enterprise restructuring in Central Eastern Europe was accompanied by reorienting exports towards adjacent West European markets.

14
what exports may be viable in the future. First, reorientation to the West European market was crucial for the restructuring of enterprises and exports in Central and Eastern Europe (Funke, Ruhwedel 2005). However, no trading partner of comparable size in close geographic proximity is easily available to Central Asian countries. Second, there are now (and will be in the foreseeable future) various informal and formal trade barriers among the CIS countries, disrupting even the limited regional (Soviet) market that enterprises had relied on until 1990. Third, during the Soviet era, the poorer Central Asian republics benefited from direct subsidies from the Soviet federal budget as well as cheap energy supplies (compared to world market prices). As a result, local demand was higher than at present, leading to higher local output along with higher imports from the rest of the Soviet Union.
Finally, enterprise restructuring and export expansion in Central Eastern Europe was sustained by a growing network of widely different inter-firm links with importing countries, such as foreign direct investment, outward processing arrangements, provision of designs and marketing of output, etc. (Smarzynska 2004; Lücke, Szalavetz 1999). Such links enabled firms to focus initially on manufacturing operations where their comparative advantage lay, and subsequently to gradually move into higher-value-added activities as technological and managerial competence were enhanced. At the same time, such links depend crucially on a good transport and communications infrastructure between the importing and the exporting countries. Although inter-firm links are widely observed in developing and transtition economies, firms in Central Asian countries may at present find it difficult to establish such link with partners outside the region because of the weak communications and transport infrastructure.
5 Emerging Patterns of Trade
5.1 Direction of Trade
Over the last 15 years, the international trade flows of the countries of the former Soviet Union have undergone significant restructuring. As the growing share of non-CIS countries in exports and imports of most countries demonstrates, the isolation from world markets that prevailed during the Soviet period is gradually being overcome (Elborgh-Woytek 2003).
Graph 1 paints a nuanced picture for changes in the direction of trade for the CAREC countries between the mid-1990s and early 2000s, based on IMF Direction of Trade Statistics. In Kazakhstan and Azerbaijan, trade with CIS countries has broadly held up well in US dollar terms, while trade with non-CIS countries grew sharply, fuelled by growing oil exports. Uzbekistan's foreign trade, both with CIS and non-CIS countries, suffered a substantial decline (the 2004-2005 recovery, following a reform of the exchange rate regime, is not yet reflected in the data). In Tajikistan, Kyrgyzstan, and Mongolia, total exports and imports remained broadly constant; in exports, the share of CIS countries decreased substantially, whereas in imports it increased (Tajikistan) or declined only slightly.
One possible explanation for the high share of imports from CIS countries is that consignments are typically smaller for imports than for exports (see also the discussion of the commodity concentration of exports and imports in the following section). Therefore,
15
the cost of diversifying imports may be higher, relative to the value of imports, than for exports which are more concentrated across commodities.
5.2 Commodity Concentration
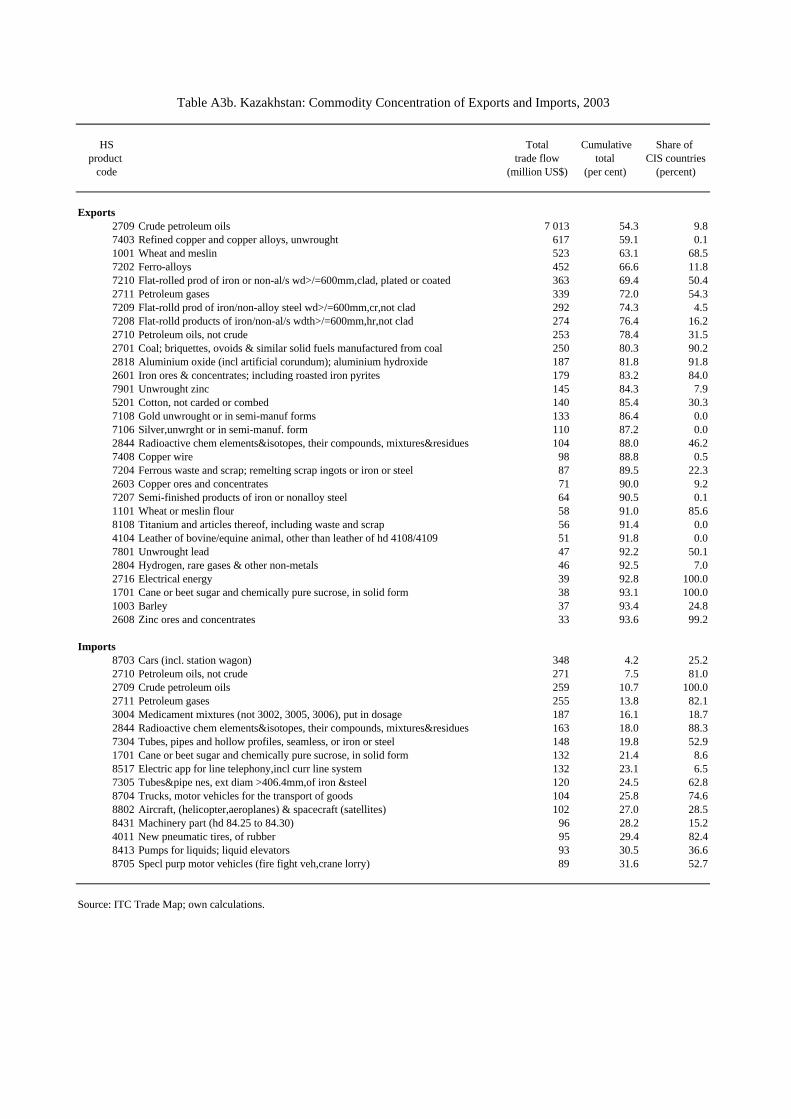
CAREC country exports are highly concentrated (Appendix Table A3) and dominated by raw materials (including primary metals). According to the ITC Trade Map database, the top 3 products at the 4-digit level of the Harmonized System accounted for between 48 percent (Uzbekistan) and 87 percent (Azerbaijan) of total merchandise exports in 2003. The only case of a manufactured product in this “top 3” group is cotton fabrics in Tajikistan (its third-ranked export valued at US$ 12 million or 2.2 percent of total merchandise exports in 2003).
It is noteworthy that Uzbekistan’s exports are more diversified than in the remaining countries, not least due to motor vehicle exports of US$ 93 million (5.3 percent of total exports) in 2003. Furthermore, across CAREC countries, prominent export products are somewhat diverse – so that any future expansion of non-traditional exports need not force Central Asian countries into competing all in the same products. In particular, agricultural exports (fresh and processed) tend to differ across countries; many trade flows, especially for the smaller CAREC countries, are also so small in relation to potential markets (Russia, Western Europe, etc.) that ruinous export competition is hardly a serious possibility. While most CAREC countries are large exporters of raw cotton, their exports of textile yarns, fabrics, and clothing are still quite small; vertical integration would open opportunities for specializing in various product niches of the (fairly large) textile and clothing complex, without placing CAREC countries in excessive competition with one another.
5.3 Normalized Net Exports ("Revealed Comparative Advantage")
In the empirical trade literature, many indicators have been developed that seek to characterize an economy’s revealed comparative advantage as expressed through its trade pattern. In interpreting such indicators, it needs to be borne in mind that exports can be due to “genuine” comparative advantage as well as policy-induced distortions – the fact that a good is exported successfully does not mean it is being produced economically.
Appendix Table A4 presents a comprehensive description of the CAREC countries’ revealed competitive advantage based on net exports (exports minus imports) for each major (1-digit) commodity group according to the SITC classification and a few important sub-groups. Since trade flows for individual commodity groups are vastly different in size, net exports are normalized by dividing by the sum of exports and imports for the same commodity group (and multiplying by 100). When there are only exports and no imports, suggesting a strong comparative advantage for the commodity group, the indicator is +100; with only imports and no exports, the indicator is -100. Normalized net exports for all merchandise trade taken together (equal to 0 if total merchandise trade is balanced) may be looked upon as the dividing line between revealed comparative advantage and disadvantage.
Overall, normalized net exports for all trading partners are mostly negative for broadly defined categories of manufactures (SITC 5, 6, 7, and 8) and positive for non-energy raw materials (SITC 2), food products (SITC 0 and 1) and energy materials (SITC 3) in Azerbaijan, Kazakhstan, and Uzbekistan. This picture demonstrates that Central Asian exports are heavily resource-based. Some of the few positive indices of net exports among

16
broad categories of manufactures, such as for SITC 6 (basic manufactures) in Kazakhstan and Tajikistan, reflect metallurgical products (particularly steel and aluminium) which are often excluded from narrower definitions of manufactures. With the exception of Mongolia, net exports of miscellaneous manufactures (SITC 8) are rather low; this observation is significant because this category includes the clothing industry (SITC 84) which was historically the starting point for manufactured export growth in many developing countries,
At the same time, for some food products and manufactures, Table A4 shows pronounced differences between net exports to CIS vs. non-CIS countries. Azerbaijan, for example, is a net exporter of beverages and tobacco (SITC 1) as well as special industry machinery (SITC 72) to the CIS countries, but a net importer from the rest of the world. Net exports to the CIS are also higher than to the rest of the world for oils and fats (SITC 4) and for miscellaneous manufactures (SITC 8). Similar examples can be found for other CAREC countries, such as food and live animals (SITC 0) in Kazakhstan, electrical products (SITC 77) in Kyrgyzstan, food and beverages (SITC 0 and 1) in Tajikistan, and machines and transport equipment (SITC 7) in Uzbekistan.
For agricultural products, a regional orientation of exports is to be expected. For industrial products, a relatively high level of normalized net exports to CIS countries, compared to the rest of the world, suggests that traditional supply channels may still be functional. For example, Kyrgyzstan’s large exports of electrical goods probably reflect the strong historical role of this industry in the country (see Section 4). However, in sharp contrast to industrial restructuring in Central Eastern Europe, non-traditional export markets have not been developed on a wide scale. It may be useful, on a case-by-case basis, to identify the main obstacles to the commercial reorientation of enterprises; while the business climate, transport and communication costs are obvious candidates, a detailed investigation may be useful in pinpointing bottlenecks and devising operational strategies for improvements.
6 Conclusions: Identifying Promising Export Markets and Policy Priorities
Against the background of Section 5 as well as the foregoing discussion, the TradeMap and ProductMap data tools developed by the International Trade Center (ITC) can be used to identify sectors that could become competitive exporters. These data tools have been developed to help structure large amounts of trade data and related information. They are freely available via the internet in many developing countries, including in Central Asia (for detailed descriptions and conditions of access see their websites, www.trademap.org and www.p-maps.org; the Annex includes comments on the coverage of Central Asian countries). Since there are very many potentially competitive export products, this section presents only an introductory discussion of a few salient examples. The best way for readers to become familiar with the TradeMap and ProductMap tools would be for them to explore the databases themselves to assess trade patterns for particular sectors.
The textiles and clothing sector is of special relevance because it played an important role in Central Asia during the Soviet period. It is also a key export sector for many developing countries. The WTO Agreement on Textiles and Clothing has recently expired and quantitative restrictions on textile and clothing trade have been largely abolished. As a result, China is now competing with other developing countries on an equal footing, having previously been restricted by quotas. However, textile and clothing products are

17
HS rev.1 Tajikistan Uzbekistan
5201 Cotton, not carded or combed 165,520 752,5935202 Cotton waste (including yarn waste and garnetted stock) 891 10,9985203 Cotton, carded or combed 151 2,2205204 Cotton sewing thread 435205 Cotton yarn (not sewing thread) 85% or more cotton, not retail 10,251 139,8005206 Cotton yarn (not sewing thread) less than 85%cotton, not retail 41 1535207 Cotton yarn (not sewing thread) put up for retail sale 1885208 Woven cotton fabrics, 85% or more cotton, weight less than 200 g/m2 5,706 43,0105209 Woven cotton fabrics, 85% or more cotton,weight over 200 g/m2 9,521 18,0185210 Woven cotton fabrics, < 85% cotton, mxd w/ manm. fib., weight <200g/m2 235212 Woven fabrics of cotton, nes 101 14952 TOTAL 192,205 967,172
Source: ITC TradeMap calculations based on COMTRADE statistics.Data are based on mirror statistics.
Table 2. Exports of Raw Cotton and Cotton Products, Tajikistan and Uzbekistan, 2004(thousand US$)
very diverse, with physical capital intensive processes (spinning and weaving) as well as labor-intensive ones (clothing assembly).
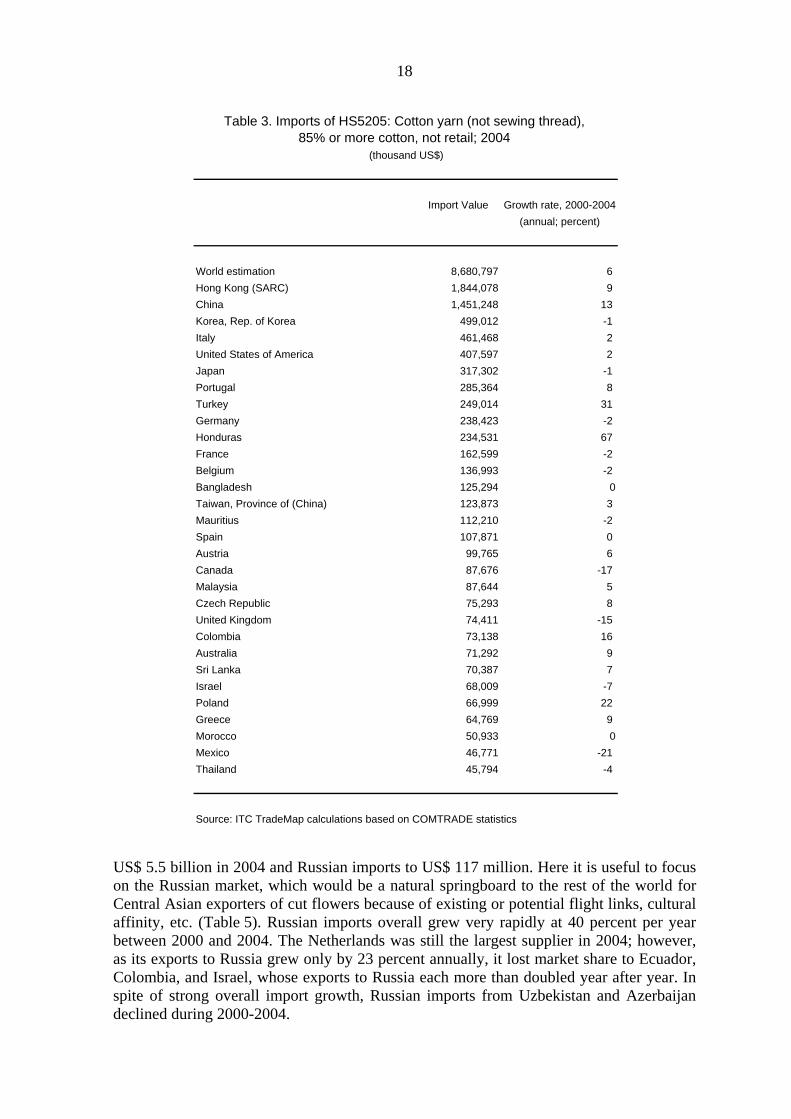
Along the value-added chain starting with raw cotton, Central Asian exports are heavily concentrated in the very first stage (HS5201: cotton, not carded or combed); Table 2 demonstrates this observation for Tajikistan and Uzbekistan. It would be useful (but beyond the scope of this paper) to explore in detail what is holding back downstream processing of cotton and related exports. There are significant (but still smallish) exports of cotton yarn (HS5205), and conditions for export expansion in terms of historical production experience, factor endowments etc. are likely to be favorable. One issue to consider is the quality and price of transport links to fast-growing import markets for cotton yarns and fabrics (most prominently, Hong Kong and China, which incidentally registered no HS5205 imports from Central Asia at all; Table 3).
Another potential export sector in Central Asia is cut flowers and ornamental plants. Climatic conditions are favorable, agricultural wages are low, and Central Asian capitals have relatively frequent flights (at least, passenger flights) to Russia, a fast-growing import market. Exports from developing countries (including Kenya, Colombia, and Ecuador) have increased substantially in recent years to rival those of the Netherlands, still the world's largest producer and exporter of cut flowers in particular.
Since the Harmonized System of commodity classification does not always place technologically similar products in adjacent product codes, it is useful to obtain a list of the products of the cut flowers and ornamental plants sector from the ProductMap data tool (Table 4). It turns out that, while most products are in HS Chapter 06, flower seeds are in Chapter 12.
Within Central Asia, the main product (HS 0603: cut flowers) is only exported by Uzbekistan and Azerbaijan in very small amounts to Russia and Ukraine, with total exports at just above US$ 1 million. This is surprising because world imports amounted to
18
Import Value Growth rate, 2000-2004(annual; percent)
World estimation 8,680,797 6 Hong Kong (SARC) 1,844,078 9 China 1,451,248 13 Korea, Rep. of Korea 499,012 -1 Italy 461,468 2 United States of America 407,597 2 Japan 317,302 -1 Portugal 285,364 8 Turkey 249,014 31 Germany 238,423 -2 Honduras 234,531 67 France 162,599 -2 Belgium 136,993 -2 Bangladesh 125,294 0Taiwan, Province of (China) 123,873 3 Mauritius 112,210 -2 Spain 107,871 0 Austria 99,765 6 Canada 87,676 -17 Malaysia 87,644 5 Czech Republic 75,293 8 United Kingdom 74,411 -15 Colombia 73,138 16 Australia 71,292 9 Sri Lanka 70,387 7 Israel 68,009 -7 Poland 66,999 22 Greece 64,769 9 Morocco 50,933 0Mexico 46,771 -21 Thailand 45,794 -4
Source: ITC TradeMap calculations based on COMTRADE statistics
Table 3. Imports of HS5205: Cotton yarn (not sewing thread), 85% or more cotton, not retail; 2004
(thousand US$)
US$ 5.5 billion in 2004 and Russian imports to US$ 117 million. Here it is useful to focus on the Russian market, which would be a natural springboard to the rest of the world for Central Asian exporters of cut flowers because of existing or potential flight links, cultural affinity, etc. (Table 5). Russian imports overall grew very rapidly at 40 percent per year between 2000 and 2004. The Netherlands was still the largest supplier in 2004; however, as its exports to Russia grew only by 23 percent annually, it lost market share to Ecuador, Colombia, and Israel, whose exports to Russia each more than doubled year after year. In spite of strong overall import growth, Russian imports from Uzbekistan and Azerbaijan declined during 2000-2004.

19
Import value Growth rate 2000-2004(thousand US$) (annual; percent)
World 117,238 40 Netherlands 46,882 27 Ecuador 28,036 110 Colombia 16,351 127 Israel 7,035 168 Belgium 4,350 112 Germany 3,762 305 Turkey 2,294 200 France 2,227 0Poland 1,555 110 Denmark 1,296 0Italy 1,294 0Uzbekistan 621 -47 China 359 166 Azerbaijan 312 -28 Lithuania 274 192 Spain 249 54 Thailand 149 0Ukraine 19 -15 Armenia 16 -40 Costa Rica 11 0South Africa 10 0
Source: ITC TradeMap calculations based on COMTRADE statistics
Table 5. Russia: Imports of HS 060310: Cut Flowers & Flower Buds ..., Fresh; 2004
It would be worth exploring in detail why Central Asian exports of cut flowers were so small and exporters failed to take advantage of clear opportunities such as the growth of the Russian market. Notably, exporting fresh flowers requires a well-functioning logistics chain across borders (regular cargo flights seem to be less widespread in Central Asia than passenger flights), irrigation in many cases, well-functioning communication with potential customers, good knowledge of relevant markets, etc. – all of which may be weak points in many Central Asian countries.
Finally, as Russia is the largest and most accessible regional market for the CAREC countries (and could be used as a springboard to the rest of Europe), it is useful to ask how CAREC countries might benefit from the recent economic recovery there. Table 6 lists Russia's 2004 imports from Central Asian republics for 2-digit HS chapters by descending import value, together with total Russian imports. While Central Asia has high market shares in Russian imports of many resource-based products, its role in Russian manufactured imports is typically much smaller. This is often the case even when Central Asian exports are significant and total Russian imports are growing rapidly, suggesting a significant potential for export expansion. These observations also suggest that regional integration with Russia, such as in the framework of the Eurasian Economic Community in which Tajikistan, Kyrgyzstan, and Kazakhstan are members alongside with Russia, could

20
benefit the growth of non-traditional exports in Central Asia if it leads to lower international transaction costs, for example, through regional cooperation in border procedures, transport, and communication.
These examples demonstrate how recent trade patterns can be analysed to identify products that might become viable exports, and how this information can subsequently be used to identify obstacles to export expansion and necessary policy reforms to remove them. Economic theory does not permit us to determine comparative advantage down to particular industries or even product groups. What exports are ultimately viable can only be established through entrepreneurial activity under hard budget constraints defined by national and global markets. However, being aware of the likely direction of viable export expansion allows policymakers to prioritize export promotion activities as well as policy reforms aimed at better integrating Central Asian economies with regional and global markets.

21

22
References
Banister, Judith (2004). Manufacturing Employment and Compensation in China. U.S. Department of Labor, Bureau of Labor Statistics (downloadable).
Brown, Annette, Barry Ickes, Randy Ryterman (1994). The Myth of Monopoly. A New View of Industrial Structure in Russia. World Bank Policy Research Working Paper 1331 (downloadable).
Carrere, Céline, Maurice Schiff (2004). On the Geography of Trade: Distance is Alive and Well. World Bank Policy Research Working Paper 3206, February (downloadable).
Clague, Christopher (1991a). "Factor Proportions, Relative Efficiency, and comparative Costs of Less Developed Countries". Journal of Development Economics, Vol. 35, pp. 357-380.
Clague, Christopher (1991b). "Relative Efficiency, Self-Containment, and Comparative Costs of Less Developed Countries". Economic Development and Clutural Change, Vol. 39, pp. 507-529.
Elborgh-Woytek , Katrin (2003). Of Openness and Distance: Trade Developments in the Commonwealth of Independent States, 1993–2002. IMF Working Paper 03/207.ublishing, Ltd. Oxford, UK ECOT The Economics of Transition 0967-0750 ©
Funke, Michael, Ralf Ruhwedel (2005). “Export variety and economic growth in East European transition economies”. Economics of Transition, Vol. 13 (1), pp. 25-50. Download: http://gulliver.econ.uni-hamburg.de/IWWT/homepage/qmwps/qm105b.pdf
Hummels, David (2001). Time as a Trade Barrier. GTAP Working Paper #17, July. Download: http://www.gtap.agecon.purdue.edu/resources/download/2009.pdf
International Trade Center (ITC) (2003). Product Map User Guide. Market Analysis Section, Division of Product and Market Development. June (mimeo; downloadable).
International Trade Center (ITC) (2004). Trade Map User Guide. Market Analysis Section, Division of Product and Market Development. February (mimeo; downloadable).
Kandogan, Yener (2003). The Reorientation of Transition Countries’ Exports: Changes in Quantity, Quality and Variety. William Davidson Institute Working Paper Number 631, November. Download: http://www.bus.umich.edu/KresgeLibrary/Collections/Workingpapers/wdi/wp631.pdf
Kandogan, Yener (2004). How Much Restructuring did the Transition Countries Experience? Evidence from Quality of their Exports. William Davidson Institute Working Paper Number 637, January.
Lücke, Matthias (1992). "Produktionsstruktur und Außenhandelsverflechtung der Nachfolgestaaten der Sowjetunion". Die Weltwirtschaft, 1992, No. 3, pp. 317-337.
Lücke, Matthias (1994). "Beschäftigungsstruktur und realwirtschaftliche Anpassung in der ehemaligen Sowjetunion". Die Weltwirtschaft, 1994, No. 3, pp. 349-362.
Lücke, Matthias, Andrea Szalavetz (1999). Export Reorientation and Transfer of Know-how and Technology: The Case of Hungarian Manufactured Exports. In: Michael Fritsch, Horst Brezinski (eds), Innovation and Technological Change in Eastern Europe. Cheltenham UK 1999 (Edward Elgar), pp.123-141. Download working paper version: http://www.geocities.com/matthiasluecke/kap801.pdf
23
Murrell, Peter (1990). The nature of socialist economies: lessons from Eastern European foreign trade. Princeton University Press.
Raballand, Gael, Antoine Kunth, Richard Auty (2005). "Central Asia's Transport Cost Burden and Its Impact on Trade". Economic Systems, Vol. 29, March, pp. 6-31.
Smarzynska Javorcik, Beata (2004). "Does Foreign Direct Investment Increase the Productivity of Domestic Firms? In Search of Spillovers Through Backward Linkages". American Economic Review, Vol. 94(3), pp. 605-627.
Volk, Berthold (2002). Growth Factors in Container Shipping. Oldenburg University of Applied Sciences (mimeo). Download: http://maritimebusiness.amc.edu.au/papers/AMC3_GRO.pdf

24
Annex: The ITC Trade Map and Product Map Databases
The analysis of the commodity composition of CAREC country trade in this paper draws on two analytical tools developed by the International Trade Center. Trade Map (www.trademap.org) breaks down international trade by commodity and country at the 6-digit level of the Harmonized System of commodity classification. Moreover, this data is integrated with a full list of import tariffs and non-tariff barriers by product in all target markets. The database allows researcher to analyze the dynamics of market demand for a target product and in a target market by looking at changes over the past 5 years, and to bring this in relation with market access conditions for each country relative to its major competitors (ITC 2004). ProductMap (www.p-maps.org) provides for detailed sectoral market analysis for more broadly defined sectors (such as "footwear" or "textiles and clothing"; ITC 2003).
The ITC Trademap and ProductMap tools rely on the COMTRADE international trade database maintained by the United Nations Statistical Office. Regarding the countries included in the present analysis, it should be noted that COMTRADE data for Tajikistan and Uzbekistan are based on not on reporting by the countries themselves, but on mirror statistics form partner countries. A comparison with data from the IMF’s Direction of Trade Statistics reveals that the ITC data for Uzbekistan are reasonably complete, with ITC exports and imports falling short of the likely correct total (IMF DTS data) by 7 percent and 13 percent, respectively for 2003 (Table 7). More substantial discrepancies are shown for Tajikistan; in particular, Tajik aluminium exports to the Netherlands do not show up in the ITC Trademap (possibly due to classification issues in Dutch international trade statistics). Therefore, conclusions for COMTRADE-based analyses for Tajikistan may include a significant margin of error.
Azerbaijan Kazakhstan Uzbekistan Tajikistan 1/ Kyrgyzstan Mongolia
Exports IMF-DTS (million US$) 2,625 12,921 1,894 791 582 616Exports ITC (million US$) 2,592 12,926 1,760 552 582 616
Divergence (in percent of IMF-DTS) 1.3% 0.0% 7.1% 30.2% 0.0% 0.0%
Imports IMF-DTS (million US$) 2,723 8,510 2,484 881 717 801Imports ITC (million US$) 2,626 8,409 2,159 582 717 801
Divergence (in percent of IMF-DTS) 3.5% 1.2% 13.1% 33.9% 0.0% 0.0%
1/ ITC data does not include Tajikistan's aluminium exports to the Netherlands valued at appr. US$ 200 mln.
Table 7. CAREC Countries: Comparison of International Trade Data from IMF and ITC, 2003

25
The COMTRADE database is also available from ITC under the PC-TAS (trade analysis system) label, classified according to SITC rather than HS. Since SITC categories are based on the level of processing, they are often analytically more useful than HS categories that are mainly based on the underlying raw material. The PC-TAS database was used in the compilation of Table A3 on patterns of comparative advantages.

26
Graphs and Appendix Tables
Graph 1. CAREC Countries: Direction of Trade, 1995-1997 and 2001-2003 (million US$)
Kazakhstan, Azerbaijan & Uzbekistan - trade by region, 1995-1997 and 2001-2003 (annual averages)
0
2000
4000
6000
8000
10000
12000
Export Import Export Import Export Import Export Import Export Import Export Import
1995-1997 2001-2003 1995-1997 2001-2003 1995-1997 2001-2003
Kazakstan Azerbaijan Uzbekistan
Mln
$ Non-CIS countries CIS countries
Tajikistan, Kyrgyzstan & Mongolia - trade by region, 1995-1997 and 2001-2003 (annual averages)
0
100
200
300
400
500
600
700
800
900
Export Import Export Import Export Import Export Import Export Import Export Import
1995-1997 2001-2003 1995-1997 2001-2003 1995-1997 2001-2003
Tajikistan Kyrgyzstan Mongolia
Mln
$ Non-CIS countries CIS countries
Source: IMF Direction of Trade Statistics, various issues; own calculations.

Table A1. Indicative Transport Costs for Large vs. Small Exporters, To Antwerp/Rotterdam/Bruges International Airport, Spring 2004 (US$/ton; including unofficial payments)
Freight for large exporters using full
units (40’ container, full planeload) Freight for small exporters using parcels of 1 ton
Typical transit time in days by
Road *) Rail & Sea**) Air***) Road *) Rail & Sea**) Air***) Road Rail & Sea Air
Dushanbe (TAJ) 230 83 1,300 500 400 2,500 15 28 7
Khujand (TAJ) 220 75 1,300 480 400 2,200 14 26 7
Tashkent (UZB) 175 70 1,250 300 300 2,000 12 23 4
Almaty (KAZ) 180 72 1,150 300 300 2,000 13 21 4
Ashgabat (TKM) 200 77 1,200 400 350 2,300 14 28 6
Baku (AZB) 163 68 1,070 280 300 2,000 13 24 5
Tbilisi (GEO) 150 63 1,070 300 280 2,000 12 24 5
Yerevan (ARM) 170 70 1,040 420 350 2,400 14 30 7
Chisinau (MOL) 100 50 1,000 280 200 2,400 7 14 4
*) A 40-ton truck with CIS registry and driver fully loaded (typically the payload is less than 40 tons). **) Central Asian countries: rail transport to a Baltic port, and from there by feeder ship to Antwerp; South Caucasus countries: by ship to Odessa in Ukraine, after which by rail; Moldova: rail all the way. ***) Russian TU-154 cargo aircraft with a payload of 15 tons; these aircraft can fly to only a very limited number of EU airports till Spring 2005. Replacing these will increase air freight by a factor of 1.5 or more. Source: World Bank, Tajikistan Trade Diagnostic Study, background document (mimeo; 2004).
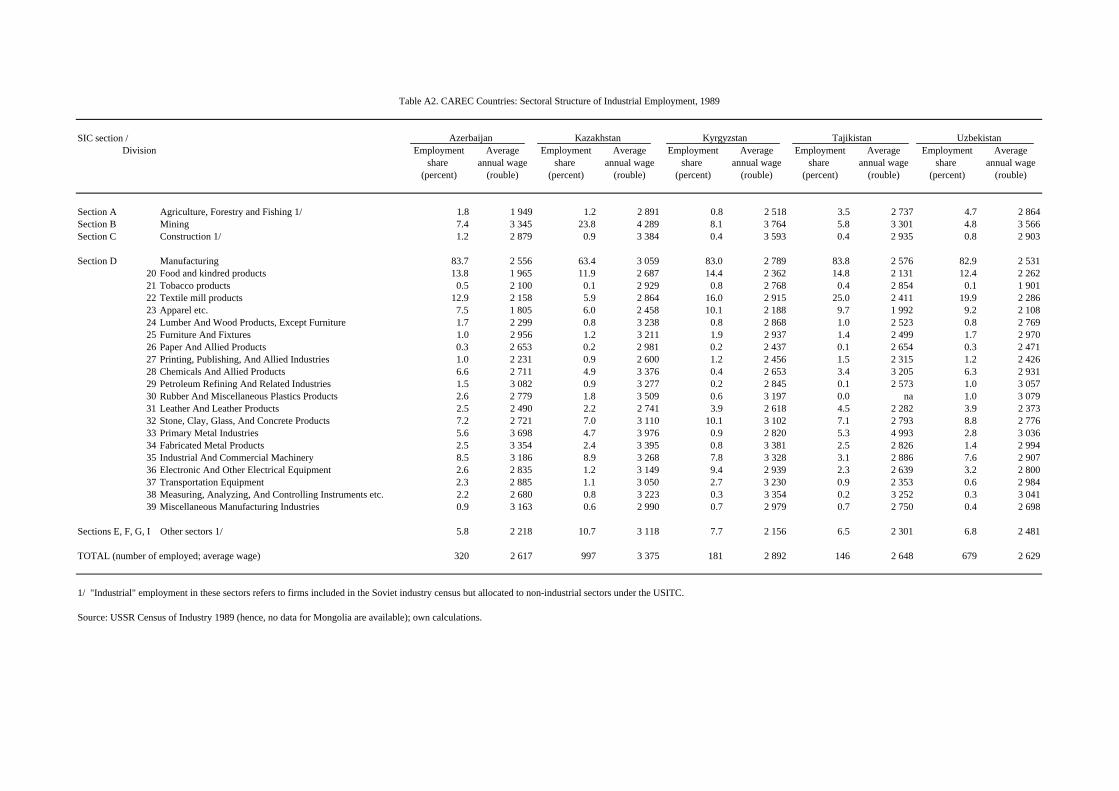
Table A2. CAREC Countries: Sectoral Structure of Industrial Employment, 1989
SIC section / Azerbaijan Kazakhstan Kyrgyzstan Tajikistan UzbekistanDivision Employment Average Employment Average Employment Average Employment Average Employment Average
share annual wage share annual wage share annual wage share annual wage share annual wage(percent) (rouble) (percent) (rouble) (percent) (rouble) (percent) (rouble) (percent) (rouble)
Section A Agriculture, Forestry and Fishing 1/ 1.8 1 949 1.2 2 891 0.8 2 518 3.5 2 737 4.7 2 864Section B Mining 7.4 3 345 23.8 4 289 8.1 3 764 5.8 3 301 4.8 3 566Section C Construction 1/ 1.2 2 879 0.9 3 384 0.4 3 593 0.4 2 935 0.8 2 903
Section D Manufacturing 83.7 2 556 63.4 3 059 83.0 2 789 83.8 2 576 82.9 2 53120 Food and kindred products 13.8 1 965 11.9 2 687 14.4 2 362 14.8 2 131 12.4 2 26221 Tobacco products 0.5 2 100 0.1 2 929 0.8 2 768 0.4 2 854 0.1 1 90122 Textile mill products 12.9 2 158 5.9 2 864 16.0 2 915 25.0 2 411 19.9 2 28623 Apparel etc. 7.5 1 805 6.0 2 458 10.1 2 188 9.7 1 992 9.2 2 10824 Lumber And Wood Products, Except Furniture 1.7 2 299 0.8 3 238 0.8 2 868 1.0 2 523 0.8 2 76925 Furniture And Fixtures 1.0 2 956 1.2 3 211 1.9 2 937 1.4 2 499 1.7 2 97026 Paper And Allied Products 0.3 2 653 0.2 2 981 0.2 2 437 0.1 2 654 0.3 2 47127 Printing, Publishing, And Allied Industries 1.0 2 231 0.9 2 600 1.2 2 456 1.5 2 315 1.2 2 42628 Chemicals And Allied Products 6.6 2 711 4.9 3 376 0.4 2 653 3.4 3 205 6.3 2 93129 Petroleum Refining And Related Industries 1.5 3 082 0.9 3 277 0.2 2 845 0.1 2 573 1.0 3 05730 Rubber And Miscellaneous Plastics Products 2.6 2 779 1.8 3 509 0.6 3 197 0.0 na 1.0 3 07931 Leather And Leather Products 2.5 2 490 2.2 2 741 3.9 2 618 4.5 2 282 3.9 2 37332 Stone, Clay, Glass, And Concrete Products 7.2 2 721 7.0 3 110 10.1 3 102 7.1 2 793 8.8 2 77633 Primary Metal Industries 5.6 3 698 4.7 3 976 0.9 2 820 5.3 4 993 2.8 3 03634 Fabricated Metal Products 2.5 3 354 2.4 3 395 0.8 3 381 2.5 2 826 1.4 2 99435 Industrial And Commercial Machinery 8.5 3 186 8.9 3 268 7.8 3 328 3.1 2 886 7.6 2 90736 Electronic And Other Electrical Equipment 2.6 2 835 1.2 3 149 9.4 2 939 2.3 2 639 3.2 2 80037 Transportation Equipment 2.3 2 885 1.1 3 050 2.7 3 230 0.9 2 353 0.6 2 98438 Measuring, Analyzing, And Controlling Instruments etc. 2.2 2 680 0.8 3 223 0.3 3 354 0.2 3 252 0.3 3 04139 Miscellaneous Manufacturing Industries 0.9 3 163 0.6 2 990 0.7 2 979 0.7 2 750 0.4 2 698
Sections E, F, G, I Other sectors 1/ 5.8 2 218 10.7 3 118 7.7 2 156 6.5 2 301 6.8 2 481
TOTAL (number of employed; average wage) 320 2 617 997 3 375 181 2 892 146 2 648 679 2 629
1/ "Industrial" employment in these sectors refers to firms included in the Soviet industry census but allocated to non-industrial sectors under the USITC.
Source: USSR Census of Industry 1989 (hence, no data for Mongolia are available); own calculations.
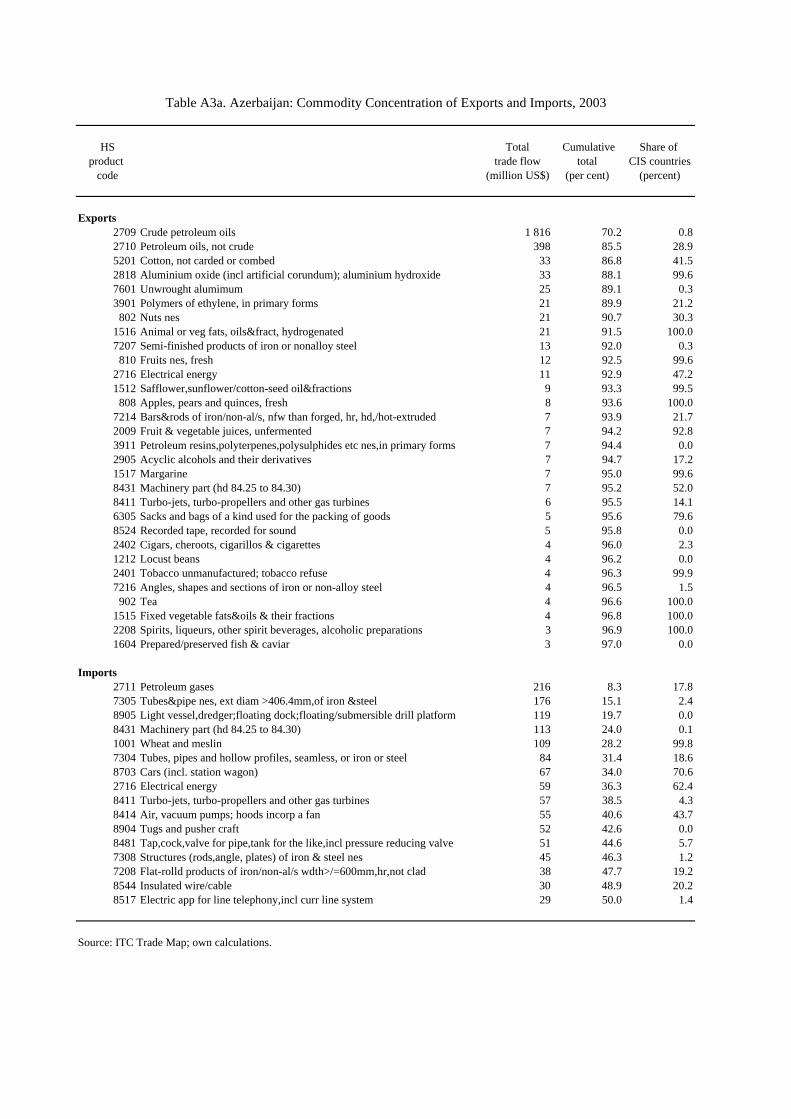
HS Total Cumulative Share of product trade flow total CIS countries
code (million US$) (per cent) (percent)
Exports2709 Crude petroleum oils 1 816 70.2 0.82710 Petroleum oils, not crude 398 85.5 28.95201 Cotton, not carded or combed 33 86.8 41.52818 Aluminium oxide (incl artificial corundum); aluminium hydroxide 33 88.1 99.67601 Unwrought alumimum 25 89.1 0.33901 Polymers of ethylene, in primary forms 21 89.9 21.2
802 Nuts nes 21 90.7 30.31516 Animal or veg fats, oils&fract, hydrogenated 21 91.5 100.07207 Semi-finished products of iron or nonalloy steel 13 92.0 0.3
810 Fruits nes, fresh 12 92.5 99.62716 Electrical energy 11 92.9 47.21512 Safflower,sunflower/cotton-seed oil&fractions 9 93.3 99.5
808 Apples, pears and quinces, fresh 8 93.6 100.07214 Bars&rods of iron/non-al/s, nfw than forged, hr, hd,/hot-extruded 7 93.9 21.72009 Fruit & vegetable juices, unfermented 7 94.2 92.83911 Petroleum resins,polyterpenes,polysulphides etc nes,in primary forms 7 94.4 0.02905 Acyclic alcohols and their derivatives 7 94.7 17.21517 Margarine 7 95.0 99.68431 Machinery part (hd 84.25 to 84.30) 7 95.2 52.08411 Turbo-jets, turbo-propellers and other gas turbines 6 95.5 14.16305 Sacks and bags of a kind used for the packing of goods 5 95.6 79.68524 Recorded tape, recorded for sound 5 95.8 0.02402 Cigars, cheroots, cigarillos & cigarettes 4 96.0 2.31212 Locust beans 4 96.2 0.02401 Tobacco unmanufactured; tobacco refuse 4 96.3 99.97216 Angles, shapes and sections of iron or non-alloy steel 4 96.5 1.5
902 Tea 4 96.6 100.01515 Fixed vegetable fats&oils & their fractions 4 96.8 100.02208 Spirits, liqueurs, other spirit beverages, alcoholic preparations 3 96.9 100.01604 Prepared/preserved fish & caviar 3 97.0 0.0
Imports2711 Petroleum gases 216 8.3 17.87305 Tubes&pipe nes, ext diam >406.4mm,of iron &steel 176 15.1 2.48905 Light vessel,dredger;floating dock;floating/submersible drill platform 119 19.7 0.08431 Machinery part (hd 84.25 to 84.30) 113 24.0 0.11001 Wheat and meslin 109 28.2 99.87304 Tubes, pipes and hollow profiles, seamless, or iron or steel 84 31.4 18.68703 Cars (incl. station wagon) 67 34.0 70.62716 Electrical energy 59 36.3 62.48411 Turbo-jets, turbo-propellers and other gas turbines 57 38.5 4.38414 Air, vacuum pumps; hoods incorp a fan 55 40.6 43.78904 Tugs and pusher craft 52 42.6 0.08481 Tap,cock,valve for pipe,tank for the like,incl pressure reducing valve 51 44.6 5.77308 Structures (rods,angle, plates) of iron & steel nes 45 46.3 1.27208 Flat-rolld products of iron/non-al/s wdth>/=600mm,hr,not clad 38 47.7 19.28544 Insulated wire/cable 30 48.9 20.28517 Electric app for line telephony,incl curr line system 29 50.0 1.4
Source: ITC Trade Map; own calculations.
Table A3a. Azerbaijan: Commodity Concentration of Exports and Imports, 2003
HS Total Cumulative Share of product trade flow total CIS countries
code (million US$) (per cent) (percent)
Exports2709 Crude petroleum oils 7 013 54.3 9.87403 Refined copper and copper alloys, unwrought 617 59.1 0.11001 Wheat and meslin 523 63.1 68.57202 Ferro-alloys 452 66.6 11.87210 Flat-rolled prod of iron or non-al/s wd>/=600mm,clad, plated or coated 363 69.4 50.42711 Petroleum gases 339 72.0 54.37209 Flat-rolld prod of iron/non-alloy steel wd>/=600mm,cr,not clad 292 74.3 4.57208 Flat-rolld products of iron/non-al/s wdth>/=600mm,hr,not clad 274 76.4 16.22710 Petroleum oils, not crude 253 78.4 31.52701 Coal; briquettes, ovoids & similar solid fuels manufactured from coal 250 80.3 90.22818 Aluminium oxide (incl artificial corundum); aluminium hydroxide 187 81.8 91.82601 Iron ores & concentrates; including roasted iron pyrites 179 83.2 84.07901 Unwrought zinc 145 84.3 7.95201 Cotton, not carded or combed 140 85.4 30.37108 Gold unwrought or in semi-manuf forms 133 86.4 0.07106 Silver,unwrght or in semi-manuf. form 110 87.2 0.02844 Radioactive chem elements&isotopes, their compounds, mixtures&residues 104 88.0 46.27408 Copper wire 98 88.8 0.57204 Ferrous waste and scrap; remelting scrap ingots or iron or steel 87 89.5 22.32603 Copper ores and concentrates 71 90.0 9.27207 Semi-finished products of iron or nonalloy steel 64 90.5 0.11101 Wheat or meslin flour 58 91.0 85.68108 Titanium and articles thereof, including waste and scrap 56 91.4 0.04104 Leather of bovine/equine animal, other than leather of hd 4108/4109 51 91.8 0.07801 Unwrought lead 47 92.2 50.12804 Hydrogen, rare gases & other non-metals 46 92.5 7.02716 Electrical energy 39 92.8 100.01701 Cane or beet sugar and chemically pure sucrose, in solid form 38 93.1 100.01003 Barley 37 93.4 24.82608 Zinc ores and concentrates 33 93.6 99.2
Imports8703 Cars (incl. station wagon) 348 4.2 25.22710 Petroleum oils, not crude 271 7.5 81.02709 Crude petroleum oils 259 10.7 100.02711 Petroleum gases 255 13.8 82.13004 Medicament mixtures (not 3002, 3005, 3006), put in dosage 187 16.1 18.72844 Radioactive chem elements&isotopes, their compounds, mixtures&residues 163 18.0 88.37304 Tubes, pipes and hollow profiles, seamless, or iron or steel 148 19.8 52.91701 Cane or beet sugar and chemically pure sucrose, in solid form 132 21.4 8.68517 Electric app for line telephony,incl curr line system 132 23.1 6.57305 Tubes&pipe nes, ext diam >406.4mm,of iron &steel 120 24.5 62.88704 Trucks, motor vehicles for the transport of goods 104 25.8 74.68802 Aircraft, (helicopter,aeroplanes) & spacecraft (satellites) 102 27.0 28.58431 Machinery part (hd 84.25 to 84.30) 96 28.2 15.24011 New pneumatic tires, of rubber 95 29.4 82.48413 Pumps for liquids; liquid elevators 93 30.5 36.68705 Specl purp motor vehicles (fire fight veh,crane lorry) 89 31.6 52.7
Source: ITC Trade Map; own calculations.
Table A3b. Kazakhstan: Commodity Concentration of Exports and Imports, 2003

HS Total Cumulative Share of product trade flow total CIS countries
code (million US$) (per cent) (percent)
Exports7108 Gold unwrought or in semi-manuf forms 260 44.9 0.02710 Petroleum oils, not crude 48 53.2 13.55201 Cotton, not carded or combed 43 60.6 64.92716 Electrical energy 19 63.9 99.98539 Electric filament or discharge lamps 16 66.6 87.12401 Tobacco unmanufactured; tobacco refuse 13 68.8 92.87003 Cast&rolled glass, sheets/profiles 12 70.8 95.06811 Articles of asbestos-cement, of cellulose fibre-cement 8 72.2 93.58708 Parts & access of motor vehicles 7 73.4 57.41701 Cane or beet sugar and chemically pure sucrose, in solid form 7 74.5 100.03923 Plastic packing goods or closures stoppers, lids, caps, closures, plastic containers 6 75.6 92.74101 Raw hides&skins of bovine/equine animals 6 76.7 1.32523 Cements, portland, aluminous, slag, supersulfate & similar hydraulic cements 6 77.7 99.87204 Ferrous waste and scrap; remelting scrap ingots or iron or steel 6 78.7 2.56203 Men's suits, jackets, trousers etc & shorts 5 79.5 86.46204 Women's suits, jackets,dresses skirts etc&shorts 5 80.4 92.1
713 Dried vegetables, shelled 4 81.1 49.72841 Salts of oxometallic or peroxometallic acids 4 81.9 4.77005 Float glass&surf grd/polishd glas in sheet 4 82.6 98.77602 Aluminum waste and scrap 4 83.3 0.0
802 Nuts nes 3 83.8 5.55512 Woven fab of syn staple fibre (> 85% of such fiber) 3 84.3 74.18704 Trucks, motor vehicles for the transport of goods 3 84.8 51.62105 Ice cream 3 85.3 100.0
902 Tea 2 85.8 28.0406 Cheese and curd 2 86.2 99.9401 Milk and cream, not concentrated nor sweetened 2 86.6 100.0
8475 Machine for assg elec/electrn lamp;mach for wrkg glassware 2 86.9 95.96206 Women's blouses & shirts 2 87.3 100.07106 Silver,unwrght or in semi-manuf. form 2 87.6 0.0
Imports2710 Petroleum oils, not crude 124 17.5 96.63004 Medicament mixtures (not 3002, 3005, 3006), put in dosage 34 22.4 22.62711 Petroleum gases 32 26.8 100.08703 Cars (incl. station wagon) 23 30.2 19.72701 Coal; briquettes, ovoids & similar solid fuels manufactured from coal 21 33.2 100.04011 New pneumatic tires, of rubber 15 35.3 83.28474 Machinery for sorting/screening/washg;agglomeratg/shapg mineral product 12 37.0 40.61701 Cane or beet sugar and chemically pure sucrose, in solid form 12 38.7 79.75515 Woven fabrics of synthetic staple fibres, nes 10 40.1 0.02402 Cigars, cheroots, cigarillos & cigarettes 9 41.4 78.38708 Parts & access of motor vehicles 9 42.7 30.08525 Television camera, transmissn app for radio-telephony 9 43.9 2.52203 Beer made from malt 8 45.0 98.71001 Wheat and meslin 7 46.1 100.08802 Aircraft, (helicopter,aeroplanes) & spacecraft (satellites) 7 47.1 14.93907 Polyacetal,o polyether,epoxide resin,polycarbonate,etc,in primary form 7 48.1 1.6
Source: ITC Trade Map; own calculations.
Table A3c. Kyrgyzstan: Commodity Concentration of Exports and Imports, 2003

HS Total Cumulative Share of product trade flow total CIS countries
code (million US$) (per cent) (percent)
Exports2603 Copper ores and concentrates 164 26.6 1.07108 Gold unwrought or in semi-manuf forms 140 49.3 4.24105 Sheep/lamb skin leather,other than leather of hd no4108/4109 34 54.9 0.06204 Women's suits, jackets,dresses skirts etc&shorts 31 60.0 0.05105 Wool & fine or coarse animal hair, carded or combed 28 64.4 0.02529 Felspar; leucite; nepheline & nepheline syenite; flourspar 21 67.9 92.66110 Jerseys, pullovers, cardigans, etc, knitted or crocheted 20 71.2 0.62613 Molybdenum ores and concentrates 15 73.7 0.26203 Men's suits, jackets, trousers etc & shorts 12 75.6 0.05102 Fine or coarse animal hair, not carded or combed 12 77.5 0.06104 Women's suits,dresses,skirt etc&short, knit/croch 11 79.3 0.04104 Leather of bovine/equine animal, other than leather of hd 4108/4109 10 80.9 0.06205 Men's shirts 10 82.5 0.0202 Meat of bovine animals, frozen 9 84.0 100.0
6106 Women's blouses & shirts, knitted or crocheted 7 85.2 0.06105 Men's shirts, knitted or crocheted 7 86.3 0.04101 Raw hides&skins of bovine/equine animals 6 87.2 0.02701 Coal; briquettes, ovoids & similar solid fuels manufactured from coal 6 88.2 0.05101 Wool, not carded or combed 5 89.0 2.9504 Guts, bladders and stomachs of animals other than fish 5 89.9 1.2
2709 Crude petroleum oils 5 90.6 0.0205 Meat of horses, asses or mules - fresh, chilled or frozen 4 91.2 98.5
2710 Petroleum oils, not crude 3 91.8 77.16201 Men's overcoats, capes, windjackets etc o/t those of hd 62.03 3 92.3 0.06103 Men's suits,jackets,trousers etc&shorts, knit/croch 3 92.9 0.04106 Goat/kid skin leather, other than leather of hd no 41.08/41.09 3 93.4 0.06109 T-shirts, singlets and other vests, knitted or crocheted 3 93.8 0.06208 Women's singlets, slips, briefs, pyjamas, bathrobes etc 2 94.2 0.07403 Refined copper and copper alloys, unwrought 2 94.6 0.07207 Semi-finished products of iron or nonalloy steel 2 95.0 0.0
Imports2710 Petroleum oils, not crude 148 18.6 93.28703 Cars (incl. station wagon) 38 23.5 10.28429 Self-propelld bulldozer, angledozer, grader, excavator,etc 20 26.0 7.08704 Trucks, motor vehicles for the transport of goods 17 28.1 22.88474 Machinery for sorting/screening/washg;agglomeratg/shapg mineral produc 17 30.3 42.74907 Unused stamps;cheque forms,banknotes,bond certificates,etc. 12 31.8 0.01101 Wheat or meslin flour 12 33.3 76.28529 Part suitable for use solely/princ with televisions, recpt app 10 34.6 0.06002 Knitted or crocheted fabrics, nes 10 35.8 0.08431 Machinery part (hd 84.25 to 84.30) 9 37.0 31.95209 Woven cotton fabrics, 85% or more cotton,weight over 200 g/m2 9 38.1 0.42203 Beer made from malt 9 39.2 2.31001 Wheat and meslin 8 40.2 78.78421 Centrifuges, incl centrifugal dryers; filtering/purifying machinery 8 41.1 2.28471 Automatic data processing machines;optical reader, etc 8 42.1 2.11507 Soya-bean oil&its fractions 8 43.1 5.6
Source: ITC Trade Map; own calculations.
Table A3d . Mongolia: Commodity Concentration of Exports and Imports, 2003
HS Total Cumulative Share of product trade flow total CIS countries
code (million US$) (per cent) (percent)
Exports7601 Unwrought alumimum 296 53.7 0.75201 Cotton, not carded or combed 137 78.6 20.35209 Woven cotton fabrics, 85% or more cotton,weight over 200 g/m2 12 80.8 0.7813 Dried fruit 12 83.0 100.0
6203 Men's suits, jackets, trousers etc & shorts 8 84.4 2.45205 Cotton yarn (not sewing thread) 85% or more cotton, not retail 7 85.7 37.12716 Electrical energy 6 86.8 100.0703 Onions, garlic and leeks, fresh or chilled 6 87.9 99.3
5208 Woven cotton fabrics, 85% or more cotton, weight less than 200 g/m2 6 89.0 2.62009 Fruit & vegetable juices, unfermented 5 89.9 100.07602 Aluminum waste and scrap 5 90.9 0.03901 Polymers of ethylene, in primary forms 2 91.3 0.06204 Women's suits, jackets,dresses skirts etc&shorts 2 91.8 0.02617 Ores and concentrates, nes 2 92.2 45.9713 Dried vegetables, shelled 2 92.6 96.1806 Grapes, fresh or dried 2 93.0 100.0
7606 Aluminum plates, sheets and strip, of a thickness exceeding 0.2mm 2 93.3 0.01202 Ground-nuts, not roasted 2 93.7 100.02002 Tomatoes prepared or preserved 2 94.0 100.0802 Nuts nes 2 94.3 100.0
7607 Aluminum foil of a thicknes not exceeding 0.2mm 1 94.5 0.06205 Men's shirts 1 94.8 0.03907 Polyacetal,o polyether,epoxide resin,polycarbonate,etc,in primary form 1 95.0 0.01404 Vegetable products, nes 1 95.2 27.12401 Tobacco unmanufactured; tobacco refuse 1 95.4 100.0810 Fruits nes, fresh 1 95.5 100.0
7202 Ferro-alloys 1 95.7 0.07605 Aluminum wire 1 95.8 100.07204 Ferrous waste and scrap; remelting scrap ingots or iron or steel 1 96.0 0.05408 Woven fabrics of synth. filam yarn (incl. hd no 54.05) 1 96.1 0.0
Imports2818 Aluminium oxide (incl artificial corundum); aluminium hydroxide 79 14.5 56.82709 Crude petroleum oils 46 22.9 0.01101 Wheat or meslin flour 31 28.6 65.52710 Petroleum oils, not crude 22 32.6 94.11701 Cane or beet sugar and chemically pure sucrose, in solid form 18 35.9 12.88703 Cars (incl. station wagon) 12 38.1 63.11001 Wheat and meslin 11 40.1 95.42713 Petroleum coke, petroleum bitumen & other residues of petroleum oils 11 42.0 100.02826 Fluorides;fluorosilicate,fluoraluminates&other complex fluorine salt 9 43.6 100.04407 Wood sawn/chipped lengthwise, sliced/peeled 8 45.2 97.85702 Carpets&o tex floor covg, woven,not tufted/flocked 8 46.7 0.03401 Soap; organic surface-active preparations for soap use 8 48.1 19.01704 Sugar confectionery (incl white choc), not containing cocoa 7 49.4 8.91806 Chocolate and other food preparations containing cocoa 7 50.6 84.48517 Electric app for line telephony,incl curr line system 6 51.8 1.85703 Carpets and other textile floor covering tufted 6 52.9 5.6
Source: ITC Trade Map; own calculations.
Table A3e. Tajikistan: Commodity Concentration of Exports and Imports, 2003
HS Total Cumulative Share of product trade flow total CIS countries
code (million US$) (per cent) (percent)
Exports5201 Cotton, not carded or combed 592 33.9 17.25205 Cotton yarn (not sewing thread) 85% or more cotton, not retail 128 41.2 8.77403 Refined copper and copper alloys, unwrought 113 47.7 0.07108 Gold unwrought or in semi-manuf forms 106 53.7 0.08703 Cars (incl. station wagon) 93 59.0 99.92711 Petroleum gases 86 64.0 100.05208 Woven cotton fabrics, 85% or more cotton, weight less than 200 g/m2 46 66.6 9.32844 Radioactive chem elements&isotopes, their compounds, mixtures&resid 38 68.8 48.1
806 Grapes, fresh or dried 27 70.3 95.62612 Uranium or thorium ores and concentrates 26 71.8 0.07901 Unwrought zinc 23 73.1 12.07112 Waste & scrap of precious metal 20 74.3 0.02710 Petroleum oils, not crude 19 75.3 23.53102 Mineral or chemical fertilizers, nitrogenous 18 76.4 9.9
702 Tomatoes 18 77.4 100.07106 Silver,unwrght or in semi-manuf. form 17 78.4 0.07214 Bars&rods of iron/non-al/s, nfw than forged, hr, hd,/hot-extruded 16 79.4 44.05209 Woven cotton fabrics, 85% or more cotton,weight over 200 g/m2 13 80.1 5.5
703 Onions, garlic and leeks, fresh or chilled 13 80.8 95.15601 Wadding of tex mat&art thereof;tex fib 12 81.5 97.43901 Polymers of ethylene, in primary forms 12 82.2 29.8
807 Melons (including watermelons) & papayas, fresh 12 82.9 99.72002 Tomatoes prepared or preserved 10 83.5 99.9
809 Apricots, cherries, peaches, nectarines, plums & sloes, fresh 10 84.1 100.06204 Women's suits, jackets,dresses skirts etc&shorts 9 84.5 0.05202 Cotton waste (including yarn waste and garnetted stock) 8 85.0 35.36110 Jerseys, pullovers, cardigans, etc, knitted or crocheted 8 85.5 0.36002 Knitted or crocheted fabrics, nes 8 86.0 1.4
713 Dried vegetables, shelled 8 86.4 33.86203 Men's suits, jackets, trousers etc & shorts 7 86.8 5.6
Imports8708 Parts & access of motor vehicles 165 8.0 2.28802 Aircraft, (helicopter,aeroplanes) & spacecraft (satellites) 136 14.7 4.03004 Medicament mixtures (not 3002, 3005, 3006), put in dosage 65 17.8 42.68411 Turbo-jets, turbo-propellers and other gas turbines 38 19.7 89.68471 Automatic data processing machines;optical reader, etc 38 21.5 2.18525 Television camera, transmissn app for radio-telephony 38 23.3 2.08413 Pumps for liquids; liquid elevators 37 25.1 16.82709 Crude petroleum oils 35 26.9 100.08433 Harvesting/threshing machinery,hay mower,etc 31 28.4 1.98430 Moving/grading/scraping/boring machinery for earth 29 29.8 11.64011 New pneumatic tires, of rubber 28 31.2 59.18703 Cars (incl. station wagon) 27 32.5 18.01101 Wheat or meslin flour 25 33.7 96.52608 Zinc ores and concentrates 24 34.8 93.48431 Machinery part (hd 84.25 to 84.30) 23 36.0 17.38429 Self-propelld bulldozer, angledozer, grader, excavator,etc 22 37.0 15.0
Source: ITC Trade Map; own calculations.
Table A3f. Uzbekistan: Commodity Concentration of Exports and Imports, 2003

SITC Product description Tradewith 1998 1999 2000 2001 2002 exports imports
0 Food and live animals CIS -78 -76 -74 -72 -63 8.1 20.0RoW -88 -71 -65 -85 -72 0.8 10.3Total -85 -74 -70 -79 -67 1.5 13.7
04 Cereals and cereal preparations CIS -100 -100 -98 -99 -97 0.4 15.6RoW -100 -100 -100 -100 -100 0.0 1.7Total -100 -100 -98 -99 -97 0.0 6.5
1 Beverages and tobacco CIS 79 78 19 78 49 6.9 1.1RoW -20 -42 -59 -41 -25 0.4 1.7Total 52 47 -1 6 -1 1.1 1.5
2 Crude materials, inedible CIS -44 -38 -44 -40 -42 3.8 4.2RoW 79 75 13 40 41 2.6 2.8Total 36 38 -1 17 16 2.8 3.3
3 Fuels, lubricants, etc. CIS 58 52 61 -23 -39 51.0 31.4RoW 83 91 96 97 96 93.1 3.7Total 74 84 93 81 74 88.7 13.3
33 Petroleum, petroleum products CIS 70 78 85 95 92 44.0 1.0and related materials RoW 96 98 99 99 99 93.6 1.0
Total 87 95 98 99 99 88.1 1.0
34 Gas, natural and manufactured CIS -71 -100 -100 -99 -99 0.2 26.8RoW -100 -100 -100 -100 50 0.0 0.0Total -72 -100 -100 -99 -99 0.0 9.2
35 Electric current CIS 21 3 14 -11 -80 4.0 3.8RoW -100 -100 -100 -100 -36 0.3 2.7Total -17 -27 -30 -72 -56 0.7 3.1
4 Animal, vegetable oils, fat, wax CIS 68 89 27 37 -1 1.3 0.4RoW -100 -99 -70 -97 -95 0.0 1.1Total -52 -53 -44 -62 -57 0.2 0.8
5 Chemicals, related products nes CIS -27 -33 -28 -2 -6 7.1 4.0RoW -83 -51 -53 -70 -54 1.0 7.5Total -63 -46 -46 -50 -41 1.6 6.3
6 Manufactured goods CIS -82 -85 -88 -87 -86 2.6 16.6RoW -80 -74 -83 -84 -87 0.8 19.5Total -81 -78 -85 -85 -87 1.0 18.5
67 Iron and steel CIS -89 -97 -99 -95 -93 0.4 8.8RoW -93 -89 -95 -80 -79 0.4 7.9Total -90 -94 -97 -86 -83 0.4 8.2
69 Manufactures of metals, n.e.s CIS -96 -91 -66 -85 -82 0.4 1.5RoW -95 -97 -98 -92 -96 0.1 5.3Total -95 -97 -93 -91 -94 0.1 4.0
7 Machines, transport equipment CIS -69 -74 -39 -49 -81 12.7 20.4RoW -93 -88 -92 -92 -90 1.0 44.3Total -87 -85 -76 -86 -88 2.2 36.1
71 Power-generating machinery CIS -42 -77 -91 -91 -92 0.1 1.4and equipment RoW -62 -93 -93 -94 -92 0.1 7.7
Total -49 -91 -92 -94 -92 0.1 5.5
72 Machinery specialized CIS -26 50 31 44 51 3.9 0.8for particular industries RoW -88 -71 -82 -81 -75 0.5 8.7
Total -80 -58 -64 -63 -65 0.9 6.0
74 General industrial machinery and CIS -36 -74 -23 -21 -82 1.3 2.2equipment, n.e.s., and RoW -89 -94 -94 -82 -96 0.1 5.9machine parts, n.e.s. Total -74 -88 -84 -71 -93 0.3 4.6
76 Telecommunications and sound-recording CIS -100 -100 -100 -100 -100 0.0 0.1and reproducing apparatus and equipment RoW -98 -98 -97 -99 -99 0.0 6.8
Total -98 -98 -97 -99 -99 0.0 4.5
77 Electrical machinery, apparatus and appliances, CIS -91 -95 -92 -92 -97 0.2 2.3n.e.s., and electrical parts thereof RoW -97 -97 -99 -90 -97 0.1 5.0
Total -95 -97 -98 -90 -97 0.1 4.1
78 Road vehicles CIS -98 -92 -77 -73 -95 1.4 7.2(including air-cushion vehicles) RoW -100 -91 -94 -80 -92 0.1 1.9
Total -99 -92 -81 -75 -94 0.2 3.7
79 Other transport equipment CIS -95 -95 -20 -73 -92 4.5 6.2RoW -32 -73 -63 -98 -86 0.1 6.0Total -59 -79 -25 -96 -90 0.6 6.1
8 Miscelaneous manufactured articles CIS -55 -41 -37 -18 -8 2.1 1.4RoW -73 -69 -86 -82 -91 0.3 9.0Total -70 -66 -80 -75 -81 0.5 6.4
9 Goods not classified by kind CIS n.a. -100 n.a. 67 54 4.3 0.5RoW -100 -100 n.a. -88 -99 0.0 0.0Total -100 -100 n.a. 66 52 0.5 0.2
Total All products CIS -27 -24 -26 -35 -49 654 1,471RoW -34 2 31 37 32 5,579 2,797Total -31 -5 19 24 13 6,233 4,268
Source: own calculations based on PC-TAS dataset.
Normalized net exports (per cent)
(million US dollars)
Table A4a. Azerbaijan: Normalized Net Exports and Commodity Composition of International Trade, 1998-2002
Percent share in 2000-2002
SITC Product description Tradewith 1998 1999 2000 2001 exports imports
0 Food and live animals CIS 57 47 38 25 15.4 6.5RoW -49 -48 -6 -33 1.9 6.6Total 14 19 25 3 5.7 6.5
04 Cereals and cereal preparations CIS 94 90 88 82 14.3 1.0RoW 72 72 88 82 1.8 0.3Total 90 87 88 82 5.3 0.7
1 Beverages and tobacco CIS 0 -21 -17 0 0.9 0.8RoW -94 -99 -94 -90 0.0 1.4Total -61 -70 -54 -41 0.3 1.1
2 Crude materials, inedible CIS 57 63 75 75 17.9 2.1RoW 50 44 48 28 3.5 3.6Total 54 53 64 59 7.6 2.8
28 Metalliferous ores and metal scrap CIS 60 76 94 90 15.4 0.6RoW 33 31 35 22 1.9 2.5Total 44 52 73 70 5.8 1.5
3 Fuels, lubricants, etc. CIS 25 27 33 27 48.6 21.6RoW 95 98 99 98 55.6 1.1Total 49 76 78 71 53.6 12.0
33 Petroleum, petroleum products CIS 62 90 81 58 37.4 6.3and related materials RoW 100 100 100 100 54.6 0.0
Total 81 98 96 89 49.7 3.2
4 Animal, vegetable oils, fat, wax CIS -92 -88 -94 -84 0.1 1.1RoW -100 -100 -100 -100 0.0 0.4Total -96 -95 -95 -88 0.0 0.8
5 Chemicals, related products nes CIS 7 4 -58 -64 3.6 12.2RoW -41 -15 -33 -40 2.2 11.0Total -14 -4 -46 -52 2.6 11.6
52 Inorganic chemicals CIS 44 48 -32 -46 2.9 6.0RoW 84 94 77 77 2.1 0.6Total 54 63 10 -1 2.3 3.4
6 Manufactured goods CIS -68 -68 -53 -52 8.3 21.6RoW 63 70 71 55 32.9 17.2Total 36 50 43 25 25.9 19.5
67 Iron and steel CIS -76 -74 -34 -33 6.1 10.8RoW 78 83 81 52 14.0 6.4Total 41 62 51 23 11.7 8.6
68 Non-ferrous metals CIS 6 17 2 -17 1.4 1.5RoW 97 98 96 96 19.0 0.9Total 92 94 91 89 14.0 1.2
69 Manufactures of metals, n.e.s CIS -74 -77 -79 -81 0.3 2.6RoW -93 -86 -76 -68 0.3 3.9Total -85 -84 -78 -73 0.3 3.3
7 Machines, transport equipment CIS -66 -63 -79 -76 4.5 29.3RoW -82 -74 -85 -90 1.3 48.7Total -76 -70 -83 -85 2.2 38.5
72 Machinery specialized CIS -18 -40 -66 -69 1.0 4.8 for particular industries RoW -97 -86 -83 -89 0.4 11.5
Total -79 -76 -77 -83 0.6 8.1
74 General industrial machinery CIS -32 -17 -63 -71 1.1 5.1and equipment, n.e.s., RoW -49 -21 -90 -93 0.2 12.2and machine parts, n.e.s. Total -44 -20 -81 -85 0.5 8.6
76 Telecommunications and sound-recording CIS -50 -38 -76 -86 0.1 0.5and reproducing apparatus and equipment RoW -96 -88 -72 -83 0.3 6.0
Total -92 -83 -72 -83 0.3 3.2
77 Electrical machinery, apparatus and appliances, CIS -67 -46 -69 -79 0.6 3.9n.e.s., and electrical parts thereof RoW -94 -98 -97 -96 0.1 6.2
Total -85 -82 -86 -89 0.2 5.0
78 Road vehicles CIS -92 -96 -94 -94 0.4 11.1(including air-cushion vehicles) RoW -97 -95 -91 -91 0.1 6.3
Total -94 -96 -93 -93 0.2 8.7
8 Miscelaneous manufactured articles CIS -54 -54 -59 -84 1.0 4.7RoW -85 -83 -83 -87 0.3 9.5Total -79 -76 -73 -86 0.5 6.9
9 Goods not classified by kind CIS n.a. -57 -100 -100 0.0 0.1RoW 84 88 85 87 2.2 0.4Total 84 86 80 87 1.6 0.2
Total CIS 1 -3 -8 -11 4969 6030RoW 17 36 47 32 12440 5359Total 11 23 27 15 17408 11389
Source: own calculations based on PC-TAS dataset
(million US dollars)
Normalized net exports (per cent)
Table A4b. Kazakhstan: Normalized Net Exports and Commodity Composition of International Trade, 1998-2001
Percent share in 2000-2001

SITC Product description1998 1999 2002 exports imports*
0 Food and live animals CIS 18 -11 -23 12.9 10.9RoW -90 -85 -32 3.3 7.1Total -38 -38 -26 6.8 9.2
04 Cereals and cereal preparations CIS -31 -46 -95 0.3 6.8RoW -60 -87 -85 0.1 1.8Total -40 -63 -93 0.2 4.1
05 Vegetables and fruit CIS 96 80 79 6.2 0.5RoW -40 14 63 2.4 0.6Total 73 70 72 3.8 0.5
06 Sugars, sugar preparations and honey CIS 47 2 -25 3.3 3.7RoW -92 -96 -83 0.2 2.5Total -53 -37 -45 1.4 3.1
1 Beverages and tobacco CIS 91 71 15 11.5 4.6RoW -19 7 -49 0.6 1.8Total 58 56 5 4.6 3.3
12 Tobacco and tobacco manufactures CIS 97 76 51 12.2 2.7RoW 27 18 -34 0.6 1.2Total 81 63 37 4.9 1.9
2 Crude materials, inedible CIS -42 19 35 19.5 5.1RoW 87 54 73 17.0 3.0Total 29 44 55 17.9 4.1
21 Hides, skins and furskins, raw CIS 100 100 -84 0.1 1.0RoW 98 96 100 7.2 0.0Total 98 96 79 4.6 0.5
26 Textile fibres (other than wool tops CIS 0 93 93 18.3 0.5and other combed wool) RoW 83 89 64 7.3 1.6and their wastes Total 72 90 80 11.4 1.1
3 Fuels, lubricants, etc. CIS -75 -38 -68 16.7 47.0RoW -91 -100 77 10.3 1.5Total -76 -39 -45 12.6 26.2
34 Gas, natural and manufactured CIS -100 -100 -100 0.0 18.6RoW -100 -100 No data 0.0 0.0Total -100 -100 -100 0.0 8.6
35 Electric current CIS 53 90 39 14.1 4.3RoW -100 100 100 0.0 0.0Total 53 90 39 5.2 2.0
4 Animal, vegetable oils, fat, wax CIS -90 -61 -99 0.0 0.6RoW -98 -92 -81 0.1 0.8Total -96 -85 -89 0.0 0.7
5 Chemicals, related products nes CIS -73 -79 -77 2.1 8.5RoW -53 -54 -86 1.4 20.0Total -64 -63 -83 1.6 13.8
54 Medicinal and pharmaceutical products CIS -94 -79 -93 0.1 1.8RoW -99 -97 -100 0.0 9.1Total -97 -93 -99 0.0 5.7
6 Manufactured goods CIS -20 -34 -30 13.2 13.2RoW -72 -78 -49 4.1 13.1Total -39 -57 -38 7.4 13.2
65 Textile yarn, fabrics, made-up articles, CIS -2 -24 61 2.9 0.5n.e.s., and related products RoW -47 -68 -83 0.5 5.6
Total -30 -55 -46 1.4 3.2
7 Machines, transport equipment CIS 2 -3 4 16.8 8.3RoW -80 -84 -65 7.1 36.5Total -50 -61 -43 10.6 21.2
72 Machinery specialized CIS -15 -18 -63 1.1 3.3for particular industries RoW -94 -97 -93 0.6 16.2
Total -75 -81 -88 0.8 10.2
77 Electrical machinery, apparatus CIS 46 29 50 8.7 2.0and appliances, n.e.s., RoW -43 -80 -64 1.0 4.4and electrical parts thereof Total 3 -55 0 3.8 3.3
78 Road vehicles CIS -2 10 -4 4.4 3.2(including air-cushion vehicles) RoW -59 -54 -16 5.1 7.0
Total -38 -31 -12 4.9 5.3
8 Miscelaneous manufactured articles CIS -32 9 37 7.3 1.8RoW -94 -75 -93 0.5 16.3Total -74 -60 -56 3.0 8.4
84 Articles of apparel and clothing CIS 100 100 100 2.7 0.0accessories RoW -99 -96 -88 0.4 6.6
Total -66 -66 -53 1.3 3.5
9 Goods not classified by kind CIS -100 100 100 0 0RoW 100 100 100 55.7 0.0Total 97 100 100 35.4 0.0
97 Gold, non-monetary CIS n.a. n.a. n.a. 0.0 0.0 (excluding gold ores and concentrates) RoW 100 n.a. 100 61.2 0.0
Total 100 n.a. 100 38.6 0.0
Total CIS -31 -17 -30 168 315RoW -17 -12 5 292 264Total -24 -14 -11 460 579
Source: own calculations based on PC-TAS dataset.
(million US dollars)
Normalized net exports (per cent)
Table A4c. Kyrgyzstan: Normalized Net Exports and Commodity Composition of International Trade - 1998, 1999, and 2002
Percent share in 2002
SITC Product description Trade Percent share in 2000-2001with 1998 1999 2000 2001 exports imports*
0 Food and live animals CIS 29 31 -17 -42 36.2 13.7RoW -91 -88 -96 -91 0.6 12.6Total -59 -38 -62 -64 4.4 13.1
01 Meat and meat preparations CIS 98 100 100 99 36.9 0.0RoW 70 99 99 -3 0.1 0.0Total 96 100 100 98 3.9 0.0
04 Cereals and cereal preparations CIS -100 -100 -100 -100 0.0 19.2RoW -100 -100 -100 -100 0.0 6.0Total -100 -100 -100 -100 0.0 9.2
1 Beverages and tobacco CIS -95 -60 -67 -100 0.6 1.5RoW -89 -91 -98 -99 0.0 4.5Total -90 -86 -92 -99 0.1 3.3
2 Crude materials, inedible CIS 88 89 92 93 58.0 0.5RoW 98 98 97 96 58.6 1.2Total 97 97 97 95 58.5 0.9
21 Hides, skins and furskins, raw CIS -100 -100 -50 42 0.1 0.0RoW 100 100 100 98 5.4 0.0Total 100 100 100 98 4.8 0.0
26 Textile fibres (other than wool tops CIS -100 -89 77 83 0.7 0.0and other combed wool) RoW 95 95 92 90 15.6 0.9and their wastes Total 91 94 92 90 14.1 0.7
27 Crude fertilizers, other than those CIS 92 92 93 92 39.2 0.6of division 56, and crude minerals RoW -100 -41 -82 -87 0.2 0.3
Total 81 87 85 82 4.2 0.4
28 Metalliferous ores and metal scrap CIS 100 99 99 100 18.8 0.0RoW 100 100 100 100 36.1 0.0Total 100 100 100 100 34.3 0.0
3 Fuels, lubricants, etc. CIS -99 -100 -99 -98 1.6 49.9RoW -82 -60 -69 -65 0.6 2.6Total -98 -97 -96 -95 0.7 20.6
4 Animal, vegetable oils, fat, wax CIS -100 -100 -100 -100 0.0 0.3RoW -100 -100 -100 -100 0.0 1.2Total -100 -100 -100 -100 0.0 0.8
5 Chemicals, related products nes CIS -100 -100 -100 -100 0.0 2.4RoW -99 -93 -88 -81 0.4 6.9Total -99 -94 -90 -84 0.3 5.2
6 Manufactured goods CIS -91 -97 -87 -95 1.6 9.9RoW -75 -77 -81 -29 7.6 21.6Total -79 -81 -82 -40 7.0 17.1
61 Leather, leather manufactures, n.e.s., CIS 100 100 100 100 0.3 0.0and dressed furskins RoW 11 -60 100 100 6.4 0.0
Total 80 0 100 100 5.7 0.0
65 Textile yarn, fabrics, made-up articles, CIS -84 -100 -100 -82 0.1 0.3n.e.s., and related products RoW -95 -91 -92 -95 0.5 14.6
Total -95 -92 -92 -95 0.4 11.1
7 Machines, transport equipment CIS -95 -96 -99 -98 1.3 20.5RoW -91 -90 -98 -95 0.5 38.2Total -92 -91 -98 -95 0.6 31.5
72 Machinery specialized CIS -98 -100 -99 -100 0.1 9.9 for particular industries RoW -80 -97 -94 -92 0.2 8.4
Total -83 -98 -95 -94 0.2 8.8
74 General industrial machinery and CIS -100 -97 -100 -91 0.4 3.3equipment, n.e.s., and machine RoW -97 -61 -100 -98 0.0 5.2parts, n.e.s. Total -98 -68 -100 -97 0.1 4.7
76 Telecommunications and sound-recording CIS -100 99 -100 -100 0.1 0.3and reproducing apparatus and equipment RoW -93 -95 -100 -99 0.0 5.4
Total -93 -92 -100 -99 0.0 4.2
77 Electrical machinery, apparatus CIS -100 -93 -100 -99 0.0 2.8and appliances, n.e.s., and electrical RoW -99 -99 -100 -100 0.0 4.9parts thereof Total -99 -98 -100 -100 0.0 4.4
78 Road vehicles CIS -93 -96 -99 -98 0.3 19.2 (including air-cushion vehicles) RoW -98 -96 -99 -95 0.1 10.0
Total -97 -96 -99 -96 0.1 12.2
8 Miscelaneous manufactured articles CIS -78 -67 -77 -79 0.6 1.3RoW -2 28 40 43 25.0 11.2Total -5 26 38 39 22.4 7.4
84 Articles of apparel and CIS 86 35 98 93 0.5 0.0clothing accessories RoW 88 79 76 81 24.9 3.4
Total 88 79 76 81 22.4 2.6
9 Goods not classified by kind CIS n.a. n.a. n.a. n.a. 0.0 n.a.RoW n.a. n.a. n.a. n.a. 6.7 n.a.Total n.a. n.a. n.a. n.a. 6.0 n.a.
97 Gold, non-monetary CIS n.a. n.a. n.a. n.a. 0.0 0.0 (excluding gold ores and concentrates) RoW 100 100 100 100 6.7 0.0
Total 100 100 100 100 6.0 0.0
Total CIS -45 -53 -64 -68 148 473RoW -8 -7 3 3 1247 772Total -17 -18 -14 -17 1395 1245
Source: own calculations based on PC-TAS dataset.
(million US dollars)
Normalized net exports (per cent)
Table A4d. Mongolia: Normalized Net Exports and Commodity Composition of International Trade, 1998-2001

SITC Product description Normalizednet exports exports imports(per cent)
0 Food and live animals CIS -43 5.9 10.0RoW -93 0.1 4.0Total -45 3.6 9.2
04 Cereals and cereal preparations CIS -100 0.0 9.8RoW -100 0.0 0.2Total -100 0.0 8.3
05 Vegetables and fruit CIS 99 6.0 0.0RoW 29 0.1 0.1Total 98 3.2 0.0
1 Beverages and tobacco CIS 89 1.5 0.1RoW 17 0.1 0.3Total 83 0.9 0.1
2 Crude materials, inedible CIS 56 4.6 0.9RoW -100 0.0 0.0Total 56 2.8 0.8
26 Textile fibres (other than wool tops CIS 96 3.9 0.1and other combed wool) and their wastes RoW 100 21.6 0.0(not manufactured into yarn or fabric) Total 99 12.2 0.1
3 Fuels, lubricants, etc. CIS -45 24.7 43.2RoW -97 0.0 0.2Total -45 14.8 37.5
33 Petroleum, petroleum products CIS -99 0.1 8.4and related materials RoW 0.0 0.0
Total -99 0.0 7.1
35 Electric current CIS -13 25.1 25.4RoW 0.0 0.0Total -13 13.4 21.4
4 Animal, vegetable oils, fat, wax CIS -100 0.0 1.1RoW -100 0.0 0.2Total -100 0.0 1.0
5 Chemicals, related products nes CIS -90 2.5 33.4RoW -100 0.0 55.5Total -92 1.5 36.4
52 Inorganic chemicals CIS -99 0.3 35.8RoW -100 0.0 52.2Total -99 0.2 38.3
6 Manufactured goods CIS 77 50.0 4.3RoW 97 82.1 3.1Total 87 62.8 4.1
68 Non-ferrous metals CIS 100 49.0 0.0RoW 100 60.4 0.1Total 100 54.3 0.0
7 Machines, transport equipment CIS 8 10.6 6.0RoW -32 5.9 33.2Total -6 8.7 9.6
78 Road vehicles CIS -95 0.1 2.7(including air-cushion vehicles) RoW -20 0.9 4.8
Total -69 0.5 3.1
79 Other transport equipment CIS 74 10.1 1.2RoW 42 0.3 0.5Total 73 5.5 1.1
8 Miscelaneous manufactured articles CIS -79 0.2 0.9RoW 31 2.0 3.1Total -17 0.9 1.2
9 Goods not classified by kind CIS -69 0.1 0.2RoW 97 9.8 0.4Total 89 4.0 0.2
97 Gold, non-monetary CIS 0.0 0.0 (excluding gold ores and concentrates) RoW 100 7.6 0.0
Total 100 3.5 0.0
Total CIS -20 373 558RoW 49 250 86Total -2 623 644
Source: own calculations based on PC-TAS dataset
(million US dollars)
Table A4e. Tajikistan: Normalized Net Exports and Commodity Composition of International Trade, 2000
Percent share in
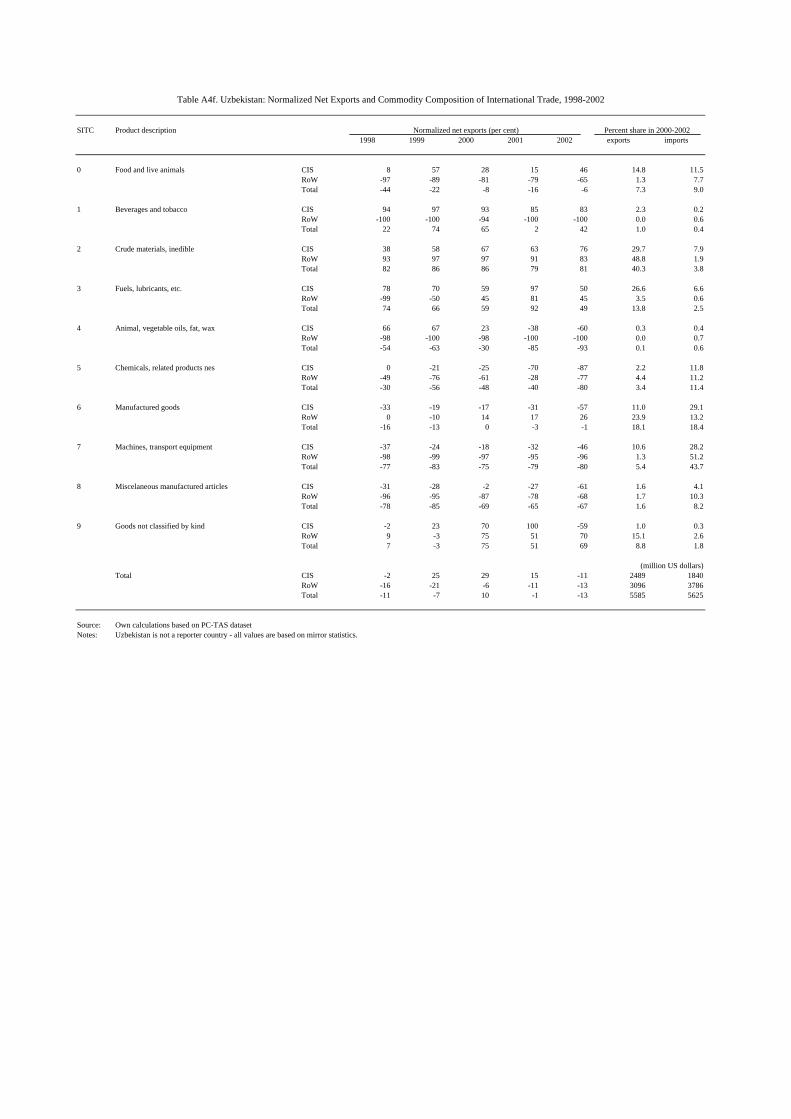
SITC Product description1998 1999 2000 2001 2002 exports imports
0 Food and live animals CIS 8 57 28 15 46 14.8 11.5RoW -97 -89 -81 -79 -65 1.3 7.7Total -44 -22 -8 -16 -6 7.3 9.0
1 Beverages and tobacco CIS 94 97 93 85 83 2.3 0.2RoW -100 -100 -94 -100 -100 0.0 0.6Total 22 74 65 2 42 1.0 0.4
2 Crude materials, inedible CIS 38 58 67 63 76 29.7 7.9RoW 93 97 97 91 83 48.8 1.9Total 82 86 86 79 81 40.3 3.8
3 Fuels, lubricants, etc. CIS 78 70 59 97 50 26.6 6.6RoW -99 -50 45 81 45 3.5 0.6Total 74 66 59 92 49 13.8 2.5
4 Animal, vegetable oils, fat, wax CIS 66 67 23 -38 -60 0.3 0.4RoW -98 -100 -98 -100 -100 0.0 0.7Total -54 -63 -30 -85 -93 0.1 0.6
5 Chemicals, related products nes CIS 0 -21 -25 -70 -87 2.2 11.8RoW -49 -76 -61 -28 -77 4.4 11.2Total -30 -56 -48 -40 -80 3.4 11.4
6 Manufactured goods CIS -33 -19 -17 -31 -57 11.0 29.1RoW 0 -10 14 17 26 23.9 13.2Total -16 -13 0 -3 -1 18.1 18.4
7 Machines, transport equipment CIS -37 -24 -18 -32 -46 10.6 28.2RoW -98 -99 -97 -95 -96 1.3 51.2Total -77 -83 -75 -79 -80 5.4 43.7
8 Miscelaneous manufactured articles CIS -31 -28 -2 -27 -61 1.6 4.1RoW -96 -95 -87 -78 -68 1.7 10.3Total -78 -85 -69 -65 -67 1.6 8.2
9 Goods not classified by kind CIS -2 23 70 100 -59 1.0 0.3RoW 9 -3 75 51 70 15.1 2.6Total 7 -3 75 51 69 8.8 1.8
Total CIS -2 25 29 15 -11 2489 1840RoW -16 -21 -6 -11 -13 3096 3786Total -11 -7 10 -1 -13 5585 5625
Source: Own calculations based on PC-TAS datasetNotes: Uzbekistan is not a reporter country - all values are based on mirror statistics.
Table A4f. Uzbekistan: Normalized Net Exports and Commodity Composition of International Trade, 1998-2002
Percent share in 2000-2002
(million US dollars)
Normalized net exports (per cent)


![Reso[ucio'n ]qfatum[](https://static.fdocuments.us/doc/165x107/586edc671a28ab4d418b45d2/resoucion-qfatum.jpg)