Embrace Opportunities...Unlock Potential...Inspire Excellence!

Company Presentation
February 2016

Forward-Looking Statements
2
This presentation, including the accompanying oral presentation (collectively, this “presentation”), does not constitute an offer to sell or the solicitation of an offer to buy anysecurities. This presentation is provided by On Deck Capital, Inc. (“OnDeck”) for informational purposes only. No representations express or implied are being made byOnDeck or any other person as to the accuracy or completeness of the information contained herein.
This presentation contains “forward-looking statements” within the meaning of the Private Securities Litigation Reform Act of 1995 and other legal authority. Forward-looking statements include statements about scalability, growing distribution channels, credit predictability and information concerning our future financial performance,business plans and objectives, potential growth opportunities, financing plans, competitive position, industry environment and potential market opportunities. Forward-looking statements can also be identified by words such as "will," "enables," "expects," "allows," "continues," "believes," "anticipates," "estimates" or similar expressions.Forward-looking statements are neither historical facts nor assurances of future performance. They are based only on our current beliefs, expectations and assumptionsregarding the future of our business, anticipated events and trends, the economy and other future conditions. Moreover, we do not assume responsibility for the accuracyand completeness of forward-looking statements. As such, they are subject to inherent uncertainties, changes in circumstances, known and unknown risks and otherfactors that are difficult to predict and in many cases outside our control.
As a result, you should not rely on any forward-looking statements. Our expected results may not be achieved, and actual results may differ materially from ourexpectations. Important factors that could cause actual results to differ from our forward-looking statements are the risks that we may not be able to manage our anticipatedor actual growth effectively, that our credit models do not adequately identify potential risks, and other risks, including those under the heading “Risk Factors” in our AnnualReport on Form 10-K for the year ended December 31, 2014 and in other documents that we file with the Securities and Exchange Commission, or SEC, from time to timewhich are available on the SEC website at www.sec.gov. We undertake no obligation to publicly update any forward-looking statements for any reason after the date of thispresentation to conform these statements to actual results or to changes in our expectations, except as required by law.
In addition to the U.S. GAAP financial information, this presentation includes certain non-GAAP financial measures. We believe that non-GAAP measures can provideuseful supplemental information for period-to-period comparisons of our core business and is useful to investors and others in understanding and evaluating our operatingresults. These non-GAAP measures have not been calculated in accordance with U.S. GAAP. You should not consider them in isolation or as a substitute for an analysis ofour results under U.S. GAAP. There are a number of limitations related to the use of these non-GAAP measures versus their nearest GAAP equivalents. For example,neither Adjusted EBITDA nor Adjusted Net (Loss) Income is a substitute for Net (Loss) Income and Operating expense (or any of its components) net of stock-basedcompensation is not a substitute for Operating expense (or any of its components) presented under GAAP. In addition, other companies may calculate non-GAAP financialmeasures differently or may use other measures to evaluate their performance, all of which could reduce the usefulness of our non-GAAP financial measures as tools forcomparison. Adjusted EBITDA excludes some recurring costs, including interest expense associated with debt used for corporate purposes, non-cash stock-basedcompensation, depreciation and amortization expense and fair value adjustment for our warrant liability. Therefore Adjusted EBITDA does not reflect interest expense, thenon-cash impact of stock-based compensation or working capital needs that will continue for the foreseeable future. Adjusted Net (Loss) Income excludes stock-basedcompensation expense and warrant liability fair value adjustment which will continue for the foreseeable future and therefore will generally be more favorable than Net(Loss) Income determined in accordance with GAAP. Please refer to the Non-GAAP Reconciliations at the end of this presentation for a description of these non-GAAPmeasures and a reconciliation to Net (Loss) Income.

$4 Billion+ total originations1
Scalable financial model
5th Generation proprietary credit scoring model
45,000+ small businesses served
76 net promoter score 2
62% y-o-y originations growth
A Leading Online Platform for Small Business Lending
31. Occurred subsequent to December 31, 2015.
2. Based on OnDeck’s Direct channel.
1,1581,874
369 557
2014 2015 4Q '14 4Q '15
Originations$MM
158255
50 68
2014 2015 4Q '14 4Q '15
Gross Revenue$MM
73
160
25 42
2014 2015 4Q '14 4Q '15
Net Revenue$MM
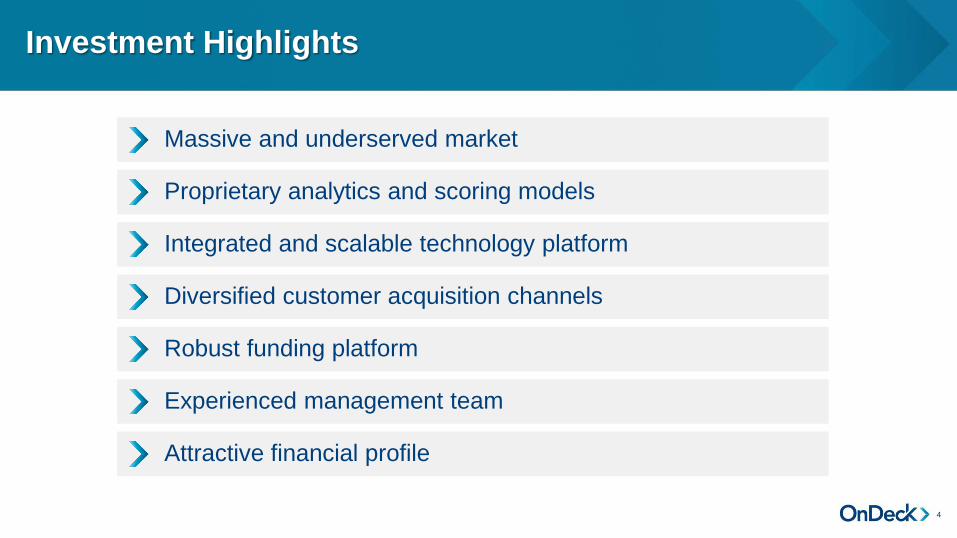
Investment Highlights
4
Massive and underserved market
Proprietary analytics and scoring models
Integrated and scalable technology platform
Diversified customer acquisition channels
Robust funding platform
Experienced management team
Attractive financial profile

Small Business Lending Market is Massive and Underserved
5
Sources: U.S. SBA, FDIC 09/30/15, Oliver Wyman, How “New-Form Lending” Will Shape Banks’ Small Business Strategies, 2013
1. As of December 31, 2015. Loans Under Management represents the unpaid principal balance of loans held for investment plus the amount of principal outstanding forloans held for sale, excluding net deferred origination costs, plus the amount of principal outstanding of term loans the company serviced for others, each at the end of theperiod.
$80-120Bn
Unmet
Demand for Small
Business Lines
of Credit
$0.9Bn
OnDeck Loans Under
Management1
$80-120BnUnmet
Demand for Small
Business Lines
of Credit
$186BnBusiness Loan
Balances Under
$250,000 in
the U.S.
in Q3 ꞌ15
28MMU.S. Small Businesses
OnDeck Unique Small
Businesses Served
45K+

Credit Card Rev. Cash Rev. Monthly Exp. Inventory & Payroll
Landscaping Rev. Snow Removal Rev. Monthly Exp. Fuel & Payroll
Repair Rev. Subcontractor Rev. Monthly Exp. Supplies & Payroll
• Diverse businesses require
manual underwriting
• Technology and data
limitations
• Lack of standardized small
business credit score
Diversity of Small Businesses Creates Challenges for Traditional Lenders…
CHALLENGES FOR
TRADITIONAL LENDERS
Cash Flow ProfileRestaurant
Landscaping Company
Plumbing Company
6
Q1 Q2 Q3 Q4

…Leading to a Frustrating Borrowing Experience for Small Businesses
FRUSTRATIONS FOR
SMALL BUSINESSES
• Time consuming offline process
• Non-tailored credit assessment
• Product mismatch
• Rigid collateral requirements
7

The OnDeck Score®
Proprietary and Purpose Built for Small Business
100+ external data sources
5th Generationproprietary credit scoring model
10 Million+ small businesses in proprietary database
2,000+ data points per application
8
Score
A
B
C
D
E
Ris
k G
rad
ing
• Probabilistic record linkage
• Dimensionality reduction
• Ensemble learning
• Exhaustive cross validation
• Feature engineering
• Adaptive learning
Proprietary Data
Analysis Platform
Public
RecordsCredit
Data
Social
Data
Proprietary
Data
Transactional
Data
Accounting
DataF

Acceptance Rate (%)
OnDeck Score Personal Credit Score Random
Resulting in Funding Significantly More
Loans for the Same Risk…
More Accurate than the Personal Credit Score
at Predicting Bad Credit Risk1…
We Rely on the OnDeck Score for Greater Accuracy, Predictability and Access
91. Analysis on OnDeck Score v5 using actual OnDeck loan performance data.
90%
100%
0%
100% 40% 20% 10% 0%
% o
f D
efa
ults E
limin
ate
d
10%
10
20
40
Random Personal CreditScore
OnDeck ScoreOnDeck Score
OnDeck Score

Online Minutes1
Automated Review As Fast As Immediately3
As Fast As Same Day
The OnDeck Solution for Small Business Lending
10
1. Application time depends on customer having the required documentation available.
2. Source: Small business survey conducted by the Federal Reserve Bank of New York, Spring 2014.
3. Approximately 1/3 of customers are subjected to secondary, manual review process.
FundApproveApply
Offline33 Hours2
Manual ReviewWeeks or Months
Several Days
Traditional
Lending

Use Case
Size $5,000 – $500,000 $5,000 – $100,000
Term 3 – 36 months 6 months
PricingAnnual Interest Rate as low as 5.99%1
Average 42% APR2 13.99% – 36% APR
Payment Automated daily or weekly payments Automated weekly payments
Availability Renewal opportunity at ~50% paid down Draw on-demand
Tailored Products for Small Businesses
1. For select customers.
2. Based on 4Q ꞌ15.
Term Loan(Launched in 2007)
Line of Credit(Launched in 2013)
HiringNewStaff
Buying Inventory
Marketing Managing Cash Flow
11
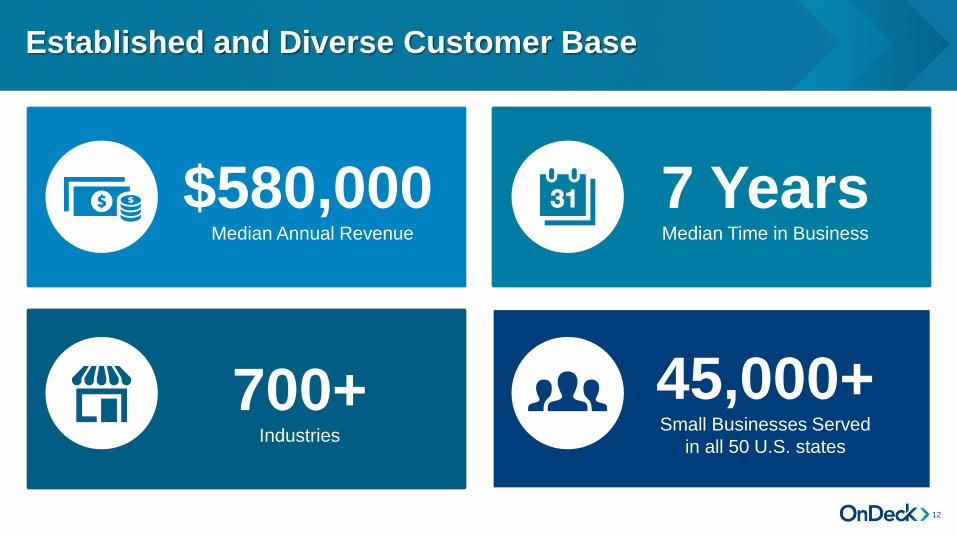
7 YearsMedian Time in Business
$580,000Median Annual Revenue
700+Industries
45,000+Small Businesses Served
in all 50 U.S. states
Established and Diverse Customer Base
12

Online
Customer
Experience
Data
Aggregation,
Analytics
and Scoring
Technology
Powered
Servicing &
Collections
Integrated and Scalable Technology Platform
13
$4 Billion+Total Originations1
80,000+Total Loans
9 Million+Customer Payments
1. Occurred intra-quarter 1Q ’16.
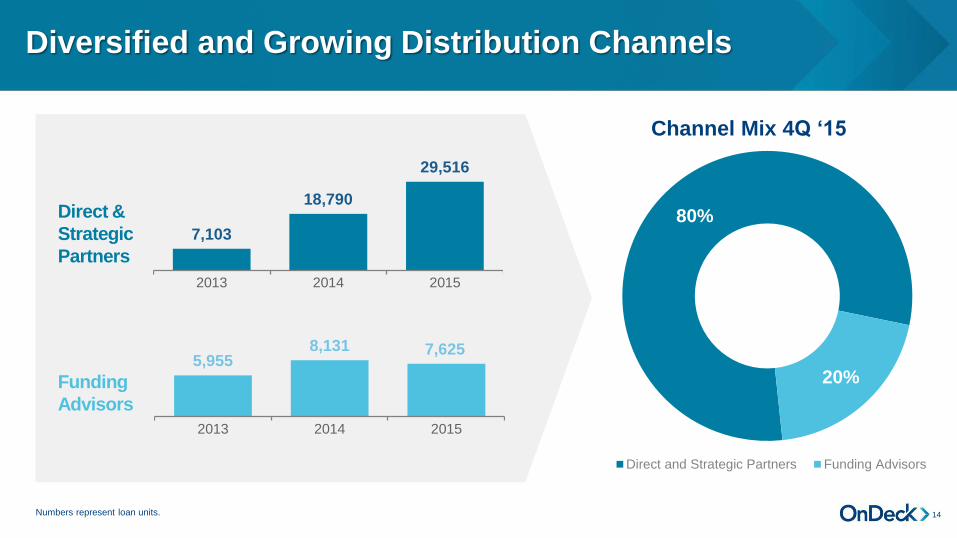
Diversified and Growing Distribution Channels
Numbers represent loan units. 14
7,103
18,790
29,516
2013 2014 2015
Direct &
Strategic
Partners
5,9558,131 7,625
2013 2014 2015
Funding
Advisors
80%
20%
Direct and Strategic Partners Funding Advisors
Channel Mix 4Q ‘15
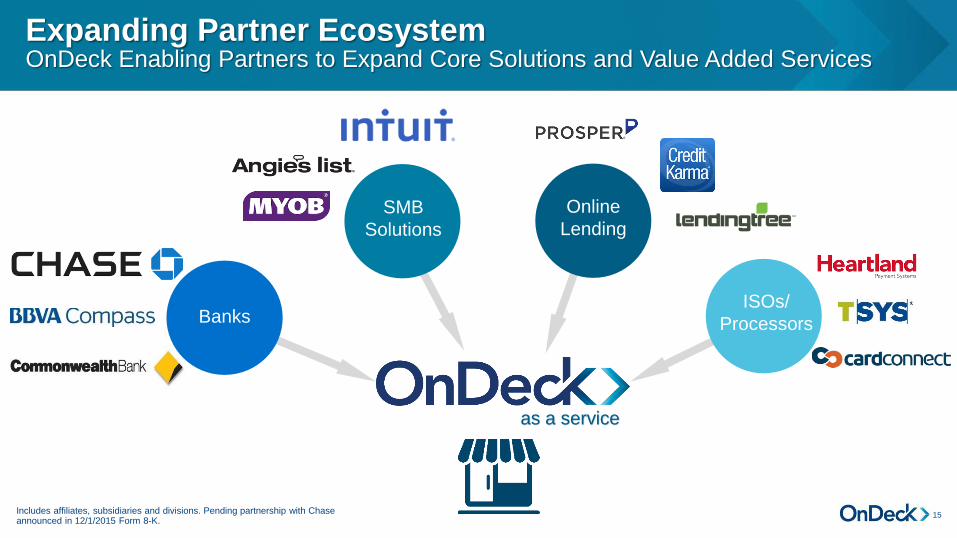
Expanding Partner EcosystemOnDeck Enabling Partners to Expand Core Solutions and Value Added Services
15
ISOs/
Processors
SMB
Solutions
Online
Lending
Banks
as a service
Includes affiliates, subsidiaries and divisions. Pending partnership with Chase announced in 12/1/2015 Form 8-K.

Hybrid Funding Model Focused on Diversity
16Funding mix includes the principal balance outstanding in Loans Under Management as of December 31, 2015 for loans financed with funding debt or sold to OnDeck Marketplace investors.
Securitization
Warehouse
Lines
OnDeck
Marketplace®
Target Mix55-65% of Term Loan
Originations
35-45% of Term Loan
Originations
Investor
Type
Investors Seeking Fixed
Returns
Investors Seeking Variable
Returns
FlexibilityScalable as Originations
Grow
Greater Product and
Investor Flexibility
Cost Low Cost Execution Profitable Revenue Stream
ResiliencyCapital-Light Structure,
Equity Contribution Aligns
Interests
Diversified Risk Exposure,
Servicing Fee Aligns
Interests
Securitization /
WarehouseMarketplace
Funding Mix 4Q ‘15

2
Net Charge-offs by Cohort 1
Consistent Portfolio Performance Over Time
17
1. Percentage of dollars loaned that are charged off.
2. As of December 31, 2015, principal balance of all term loans in Loans Under Management still outstanding was 0% for all cohorts except the 2013, 2014, 1Q ‘15, 2Q ’15, 3Q ’15, 4Q ’15cohorts, which had principal outstanding of 0.1%, 1.8%, 11.5%, 26.1%, 56.8% and 88.2%, respectively.
5.5%
9.0%
6.4%
4.4%
5.5%
6.9% 6.9% 6.8%
5.2%
2.9%
0.9%
0.0%
2007 2008 2009 2010 2011 2012 2013 2014 1Q '15 2Q '15 3Q '15 4Q '1522222

Growth Strategy
Brand and direct
marketing
Strategic partnerships
Data and analytics
Product expansion
Expand customer
lifetime value
International expansion
18
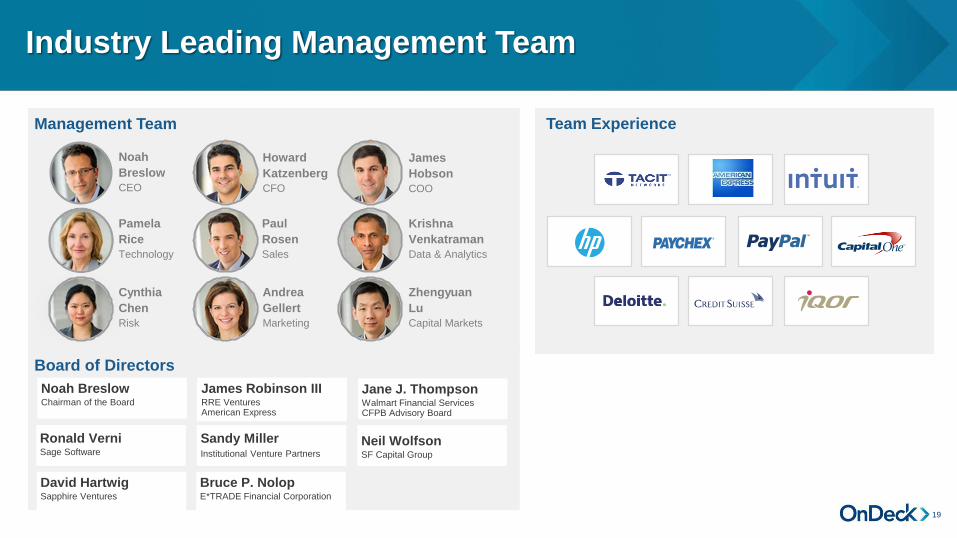
Industry Leading Management Team
Noah
Breslow
CEO
James
Hobson
COO
Paul
Rosen
Sales
Howard
Katzenberg
CFO
Zhengyuan
Lu
Capital Markets
Krishna
Venkatraman
Data & Analytics
Pamela
Rice
Technology
Cynthia
Chen
Risk
Andrea
Gellert
Marketing
Management Team Team Experience
19
Board of Directors
David HartwigSapphire Ventures
Bruce P. NolopE*TRADE Financial Corporation
Neil WolfsonSF Capital Group
Sandy MillerInstitutional Venture Partners
Noah BreslowChairman of the Board
Jane J. ThompsonWalmart Financial ServicesCFPB Advisory Board
Ronald VerniSage Software
James Robinson IIIRRE VenturesAmerican Express

Capital Light Funding Model
Compelling Customer LTV
Demonstrated Operating Leverage
Rapid Growth
Financial Highlights
20
1,1581,874
369 557
2014 2015 4Q '14 4Q '15
Originations$MM
158255
50 68
2014 2015 4Q '14 4Q '15
Gross Revenue$MM
73
160
25 42
2014 2015 4Q '14 4Q '15
Net Revenue$MM

Loan
Profit
Revenues Expenses
–
Illustrative Loan Economics
21
=
Origination Fee
Interest Income
Losses
Funding Costs
Processing and Servicing
Acquisition
-

Compelling Customer Lifetime Value
22
1. Includes upfront internal and external commissions as well as direct marketing expenses.
2. Contribution is defined to include interest income and fees collected on initial and repeat loans, less acquisition costs for repeat loans, less the following items for both initial and repeat loans:estimated third party processing and servicing expenses, estimated funding costs (excluding any cost of equity capital) and charge offs. For this purpose, processing and servicing expenses areestimated based on the mix of new and renewal originations and outstanding principal balances. Includes all loans originated in the period. New and repeat loans sold funding cost is estimatedbased on the average on-balance sheet cost of funds rate in the period. Estimates may be adjusted in subsequent periods to reflect updated information.
3. Return on Investment (ROI) is contribution divided by initial acquisition cost. Acquisition costs include upfront internal and external commissions as well as direct marketing expenses.
4. Figures may not foot due to rounding
All Customers Acquired in 2013
• Average 2.3 loans per customer through 9 quarters
($MM)
3.1x+ROI
after
9 quarters
or
$83Return3
$27Investment
2013
$27
$17
$8
$9
$7
$7
Acquisition
Cost1Contribution2 +2Q +3Q +4Q +5Q +6Q
$6
+7Q
$20
$5
+8QThrough
Dec 31, 2015
$3
+9Q

Lifetime Value Improving Over Time
231. Cumulative Contribution as defined on the previous page.
2. Return on Investment (ROI) as defined on the previous page.
Return on Investment 2Cohort Contribution Per Customer 1
$(2,000)
$3,000
$8,000
2014
2013
All Customers Acquired in 2013 and 2014
• At comparable seasoning points, 2014 shows improved returns.
2013
2014
0.5x
1.5x
2.5x
3.5x
+5 Quarters +9 Quarters +5 Quarters +9 Quarters

81%
61%
54%
37%
2012 2013 2014 2015
Driving Efficiencies in Cost of Revenues Expanding OpEx Investment to Support Growth
84%
68%
51%
63%
2012 2013 2014 2015
Provision for Loan LossesFunding CostsSales & Marketing Technology & Analytics
Processing & Servicing General & Administrative
Demonstrated Operating Leverage, but Investing for Growth
Figures are based on a percentage of gross revenue.24
Operating Leverage
Potential

Adjusted EBITDA and Adjusted Net Income (Loss)
See appendix for a reconciliation of these non-GAAP measures.
($0.2)
$16.2
$0.6 $0.3
($4.6)
$10.3
($0.8) ($1.1)
Adjusted EBITDA Adjusted Net Income (Loss)
2014 2015 4Q ꞌ14 4Q ꞌ15
25

Building Shareholder Value
26
Expand our addressable market and increase customer lifetime value with a full
spectrum of SMB credit products and by investing in long-term customer relationships
Drive sustainable net revenue growth for the longer term, prioritizing stable credit
quality across the portfolio
Leverage technology and analytics leadership to extend our competitive “moats”
while driving operating leverage and enhancing profitability
Diversify our funding sources by type and investor to balance risk retention with
flexibility and resiliency over an economic cycle

APPENDIX
1

Supplemental Key Performance Metrics Revisions1
28
Revised Historical
Average Loans
Loans Held for Investment and Loan Held for Sale
Average of Months in the Period
Loans Held for Investment
Average of the Quarters in the Period
Effective Interest Yield
Business Day Adjusted Interest Income
Divided by Revised Average Loans
Interest Income
Divided by Average Loans
Average Funding Debt Outstanding
Funding Debt Outstanding Adjusted for ASC 835-302
Average of Months in the Period
Funding Debt Outstanding
Average of the Quarters in the Period
Cost of Funds Rate
Funding Cost
Divided by Revised Average Funding Debt Outstanding
Funding Cost
Divided by Average Funding Debt Outstanding
1. For summary purposes only and is qualified in its entirety by the descriptions of the Key Performance Metrics in our earnings release issued February 22, 2016.
2. In April 2015, the Financial Accounting Standards Board issued ASU 2015-03, Simplifying the Presentation of Debt Issuance Costs, which amends ASC 835-30, Interest - Imputation ofInterest. ASU 2015-03 requires entities to reclassify the presentation of deferred debt issuance costs in their financial statements. Under the update to the accounting standard, an entity willbe required to present such deferred costs in the balance sheet as a direct deduction from the related debt liability rather than as an asset. This accounting standard is effective beginningJanuary 1, 2016 and is to be applied retrospectively.

530.3 535.2513.2
532.6534.5550.5 541.2
564.8
1Q '15 2Q '15 3Q '15 4Q '15
Supplemental Key Performance Metrics Revisions1
29
Average Loans$MM
Revised Historical
393.2 383.4
359.8 365.6
385.6363.9
351.7364.4
1Q '15 2Q '15 3Q '15 4Q '15
Average Funding Debt Outstanding$MM
36.7% 37.6% 37.9%
35.7%
37.6%35.9%
34.8% 34.2%
1Q '15 2Q '15 3Q '15 4Q '15
Effective Interest Yield
Cost of Funds Rate
5.1% 5.0%
5.7% 5.8%5.2% 5.2%
5.8% 5.8%
1Q '15 2Q '15 3Q '15 4Q '15
1. Beginning with the quarter ending March 31, 2016, the Company is refining the calculation of Effective Interest Yield (EIY) and certain related definitions to reflect the substantial growth andimpact of OnDeck Marketplace and to present EIY on a business day adjusted basis. In addition, effective January 1, 2016, the company is adopting a new a GAAP requirement regarding thepresentation of deferred debt issuance costs related to average funding debt outstanding. In preparation for these changes and to enhance comparability of prior periods, the above tablecontains the relevant Key Performance Metrics (1) as originally presented historically and (2) as revised to conform to the pending adoption of the 2016 calculation methodology and theretrospective application of the new GAAP requirement regarding the presentation of deferred debt issuance costs. For summary purposes only and is qualified in its entirety by the descriptionsof the Key Performance Metrics in our earnings release issued February 22, 2016.
Three Months Ended / Ending
Annualization Table 1Q ‘15 2Q ‘15 3Q ‘15 4Q ‘15 1Q ‘16 2Q ‘16 3Q ‘16 4Q ‘16
Business Days in Period 61 64 65 62 62 64 64 61
Annualization Factor 4.1311 3.9375 3.8769 4.0645 4.0484 3.9219 3.9219 4.1148

Current Debt Facilities: Considerable Existing Capacity
1. Balances and Capacities as of December 31, 2015.
2. The period during which remaining cash flow can be used to purchase additional loans expires April 30, 2016.
3. The period during which new borrowings may be made expires in August 2016.
4. While the lenders under our corporate debt facility and partner synthetic participation have direct recourse to us as the borrower thereunder, lenders to our subsidiaries do not have direct recourse to us.
30
($MM) Maturity DateWA Interest
Rate
Principal
Outstanding
Borrowing
Capacity
Funding Debt 1,4
OnDeck Asset Securitization Trust LLC May-18 2 3.4% $175.0 $175.0
Prime OnDeck Receivable Trust, LLC June-17 2.7% 59.4 100.0
Receivable Assets of OnDeck, LLC May-17 3.3% 47.5 50.0
OnDeck Account Receivables Trust 2013-1 LLC Sept-17 2.6% 42.1 150.0
On Deck Asset Company, LLC May-17 8.6% 27.7 50.0
Small Business Asset Fund 2009 LLC Jan 2016 through Aug 2017 6.9% 12.8 12.8
On Deck Asset Pool, LLC Aug-17 3 5.0% 8.7 100.0
Partner Synthetic Participations 4 Jan 2016 through Oct 2017 Various 6.9 6.9
Total Funding Debt $380.1 $644.7
Corporate Debt 1,4
On Deck Capital, Inc. Oct-16 4.50% $2.7 $20.0

Net Cumulative Lifetime Charge-off Ratios – All Loans
31As of December 31, 2015, net charge-off as a percentage of original loan amount for all term loan originations, regardless of funding source, including loans sold through OnDeck Marketplaceor held for sale on our balance sheet.

Non-GAAP Operating Expense Reconciliation
32
Sales and Marketing Non-GAAP Expense Reconciliation
($MM) 4Q '15 4Q '14 2015 2014
GAAP expense $17.1 $11.4 $60.6 $33.2
Stock-based compensation (0.9) (0.4) (3.1) (0.7)
Expense excluding stock-based compensation $16.2 $11.0 $57.5 $32.5
Percentage of Gross Revenue
GAAP expense 25.3% 22.6% 23.8% 21.0%
Stock-based compensation (1.3) (0.7) (1.2) (0.4)
Expense excluding stock-based compensation 23.9% 21.9% 22.6% 20.6%
Percentage of Originations
GAAP expense 3.1% 3.1% 3.2% 2.9%
Stock-based compensation (0.2) (0.1) (0.2) (0.1)
Expense excluding stock-based compensation 2.9% 3.0% 3.1% 2.8%
Technology and Analytics Non-GAAP Expense Reconciliation
($MM) 4Q '15 4Q '14 2015 2014
GAAP expense 12.7 6.0 42.7 17.4
Stock-based compensation (0.6) (0.2) (2.4) (0.5)
Expense excluding stock-based compensation $12.1 $5.8 $40.3 $16.9
Percentage of Gross Revenue
GAAP expense 18.9% 12.0% 16.7% 11.0%
Stock-based compensation (0.9) (0.5) (0.9) (0.3)
Expense excluding stock-based compensation 17.9% 11.5% 15.8% 10.7%
Processing and Servicing Non-GAAP Expense Reconciliation
($MM) 4Q '15 4Q '14 2015 2014
GAAP expense $4.0 $2.3 $13.1 $8.2
Stock-based compensation (0.2) (0.1) (0.8) (0.2)
Expense excluding stock-based compensation $3.7 $2.2 $12.3 $8.0
Percentage of Gross Revenue
GAAP expense 5.9% 4.6% 5.1% 5.2%
Stock-based compensation (0.4) (0.2) (0.3) (0.1)
Expense excluding stock-based compensation 5.5% 4.4% 4.8% 5.1%
General and Administrative Non-GAAP Expense Reconciliation
($MM) 4Q '15 4Q '14 2015 2014
GAAP expense $13.6 $7.7 $45.3 $21.7
Stock-based compensation (1.7) (0.7) (5.4) (1.4)
Expense excluding stock-based compensation $11.8 $7.0 $39.9 $20.3
Percentage of Gross Revenue
GAAP expense 20.1% 15.3% 17.8% 13.7%
Stock-based compensation (2.6) (1.4) (2.1) (0.9)
Expense excluding stock-based compensation 17.5% 13.9% 15.7% 12.8%
Operating expense (or its components) excluding stock-based compensation expense and the percentages computed using those metrics are not presented in accordance with GAAP and are non-GAAP financial measures. Management believes they can provide useful supplemental information to investors and others for comparisons in understanding and evaluating our operating expenses without the impact of non-cash stock-based compensation which can vary significantly from period to period.

Adjusted EBITDATwelve Months Ended
December 31,
Three Months Ended
December 31,
(000s) 2014 2015 2014 2015
Net Loss ($18,708) ($2,231) ($4,291) ($5,144)
Adjustments:
Corporate Interest Expense 398 306 124 56
Income Tax Expense – – – –
Depreciation and Amortization 4,071 6,508 1,223 1,886
Stock-Based Compensation Expense 2,842 11,582 1,395 3,517
Warrant Liability Fair Value Adjustment 11,232 – 2,110 –
Adjusted EBITDA ($165) $16,165 $561 $315
Non-GAAP Adjusted EBITDA Reconciliation
Adjusted EBITDA represents our net income (loss), adjusted to exclude interest expense associated with debt used for corporate purposes (rather than funding costs associated with lending activities), income tax expense, depreciation and amortization, stock-based compensation expense and warrant liability fair value adjustment. EBITDA is impacted by changes from period to period in the fair value of the liability related to preferred stock warrants. Management believes that adjusting EBITDA to eliminate the impact of the changes in fair value of these warrants is useful to analyze the operating performance of the business, unaffected by changes in the fair value of preferred stock warrants which are not relevant to the ongoing operations of the business. All such preferred stock warrants converted to common stock warrants upon initial our initial public offering in December 2014. 33

Adjusted Net (Loss) IncomeTwelve Months Ended
December 31,
Three Months Ended
December 31,
(000s) 2014 2015 2014 2015
Net (Loss) Income ($18,708) ($2,231) ($4,291) ($5,144)
Adjustments:
Stock-Based Compensation Expense 2,842 11,582 1,395 3,517
Net loss attributable to non-controlling interest – 958 – 500
Warrant Liability Fair Value Adjustment 11,232 – 2,110 –
Adjusted Net (Loss) Income ($4,634) $10,309 ($786) ($1,127)
Non-GAAP Adjusted (Loss) Income Reconciliation
Adjusted Net Income (Loss) per share represents our net income (loss) adjusted to exclude net loss attributable to non-controlling interest, stock-based compensation expense and warrant liability fair value adjustment, each on the same basis and with the same limitations as described above for Adjusted EBITDA, divided by the weighted average common shares outstanding during the period. Adjusted Net Income (Loss) per share does not include the impact of accretion of dividends on redeemable convertible preferred stock or Series A and B preferred stock redemptions. All such preferred stock converted to common stock upon our initial public offering in December 2014.
34
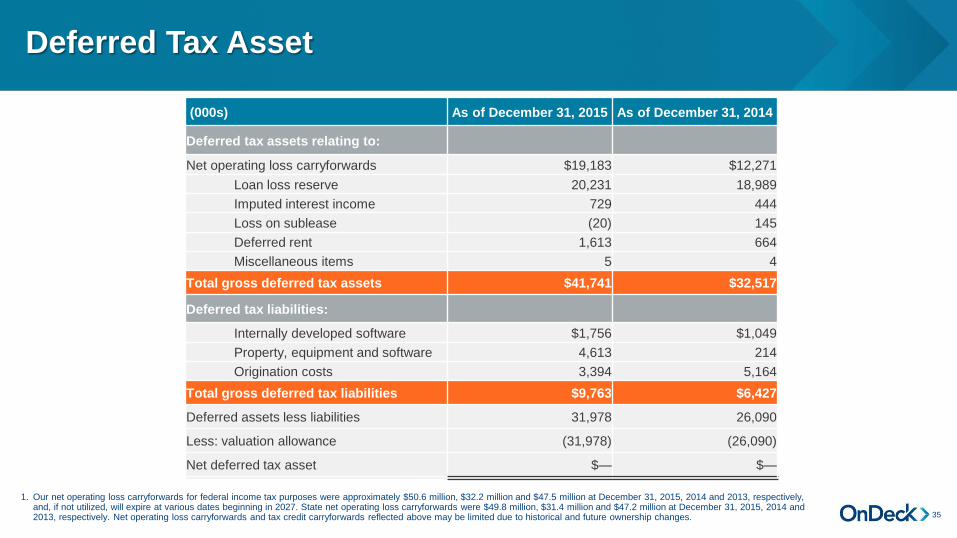
Deferred Tax Asset
35
1. Our net operating loss carryforwards for federal income tax purposes were approximately $50.6 million, $32.2 million and $47.5 million at December 31, 2015, 2014 and 2013, respectively, and, if not utilized, will expire at various dates beginning in 2027. State net operating loss carryforwards were $49.8 million, $31.4 million and $47.2 million at December 31, 2015, 2014 and 2013, respectively. Net operating loss carryforwards and tax credit carryforwards reflected above may be limited due to historical and future ownership changes.
(000s) As of December 31, 2015 As of December 31, 2014
Deferred tax assets relating to:
Net operating loss carryforwards $19,183 $12,271
Loan loss reserve 20,231 18,989
Imputed interest income 729 444
Loss on sublease (20) 145
Deferred rent 1,613 664
Miscellaneous items 5 4
Total gross deferred tax assets $41,741 $32,517
Deferred tax liabilities:
Internally developed software $1,756 $1,049
Property, equipment and software 4,613 214
Origination costs 3,394 5,164
Total gross deferred tax liabilities $9,763 $6,427
Deferred assets less liabilities 31,978 26,090
Less: valuation allowance (31,978) (26,090)
Net deferred tax asset $— $—