1 Potential Monetization Opportunities September 2009.
13
1 Potential Monetization Opportunities September 2009
-
Upload
bartholomew-hawkins -
Category
Documents
-
view
226 -
download
5
Transcript of 1 Potential Monetization Opportunities September 2009.
1
Potential Monetization Opportunities
September 2009
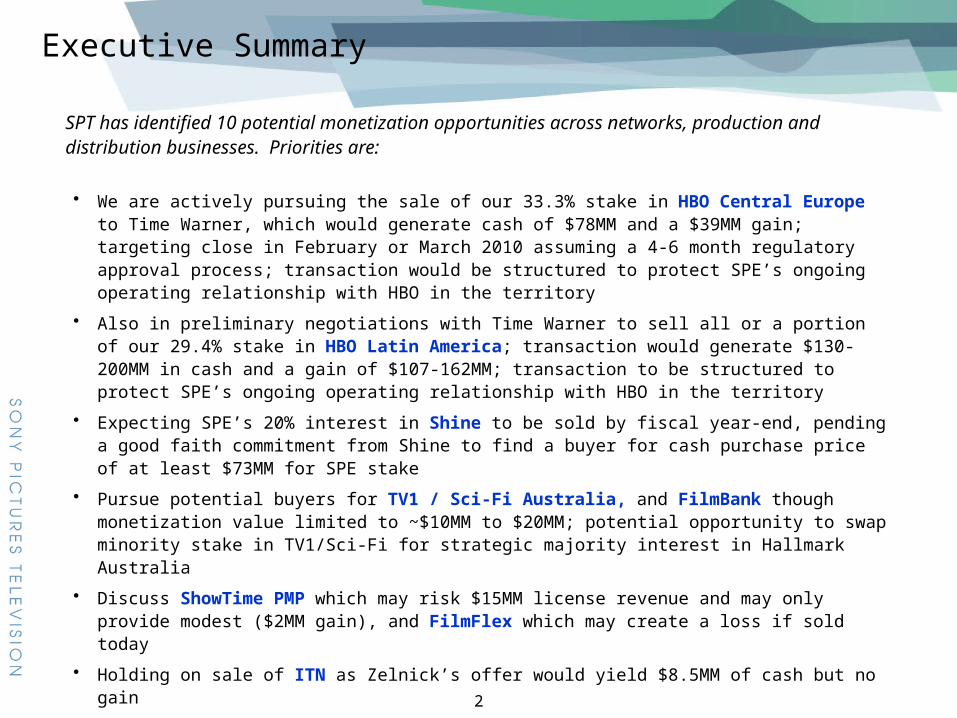
Executive Summary
• We are actively pursuing the sale of our 33.3% stake in HBO Central Europe to Time Warner, which would generate cash of $78MM and a $39MM gain; targeting close in February or March 2010 assuming a 4-6 month regulatory approval process; transaction would be structured to protect SPE’s ongoing operating relationship with HBO in the territory
• Also in preliminary negotiations with Time Warner to sell all or a portion of our 29.4% stake in HBO Latin America; transaction would generate $130-200MM in cash and a gain of $107-162MM; transaction to be structured to protect SPE’s ongoing operating relationship with HBO in the territory
• Expecting SPE’s 20% interest in Shine to be sold by fiscal year-end, pending a good faith commitment from Shine to find a buyer for cash purchase price of at least $73MM for SPE stake
• Pursue potential buyers for TV1 / Sci-Fi Australia, and FilmBank though monetization value limited to ~$10MM to $20MM; potential opportunity to swap minority stake in TV1/Sci-Fi for strategic majority interest in Hallmark Australia
• Discuss ShowTime PMP which may risk $15MM license revenue and may only provide modest ($2MM gain), and FilmFlex which may create a loss if sold today
• Holding on sale of ITN as Zelnick’s offer would yield $8.5MM of cash but no gain
• Open to sale of remaining GSN stake which could generate ~$270MM in cash and $200MM in EBIT; however timing not within SPE control
• Could explore sale of 33.3% of FEARnet stake, but forego opportunity to launch a linear channel and buyer interest is uncertain
SPT has identified 10 potential monetization opportunities across networks, production and distribution businesses. Priorities are:
2

Potential Monetization Summary
3
($ in Millions)
Revenue EBIT EBIT Cash
20% SPE56.3% E. Murdoch23.7% Other
600 54 7(c)400 - 600(less net debt,
equity value~265-465)SPE full exit 55(d) ~18
(minimum)~73
(Minimum)
35% SPE65% Liberty Media
221 42103.8
(84.4 gain)~780 SPE full exit 74 ~200 ~270
15% SPE78% VSS7% Zelnick/Mgmt
200 33 0130 - 190(less net debt,
equity value ~66-120)SPE full exit 8.5 ~1 - 10 ~8.5 - 18
PMP
20% SPE20% Liberty20% Paramount20% Fox20% Universal
84 5 1.235 - 40
(add ~$10MM cash, equity value ~45-50)
SPE full exit 7.4 ~2 - 3 ~9 - 10
33.3% SPE33.3% CBS Paramount33.3% NBCU
26 5 1.8 30 - 50 SPE full exit 3.5 ~7 - 13 ~10 - 17
50% SPE50% Disney
53 5 1.6 10 - 22 SPE full exit 12.4 ~(7) -(1) ~5 - 11
33.3% SPE33.3% HBO33.3% Disney
125 15(b) 5 234 SPE full exit 39 39 78
SPE full exit 38 162 200
Partial exit and retain Board seat 25 107 130
50% SPE50% Warner Bros
15 0.4 0 6 - 14 SPE full exit 0 ~3 - 7 ~3 - 7
33.3% SPE33.3% Lions Gate33.3% Comcast
15 (5.5) (1.9) 20 - 40 SPE full exit 0.4 ~6 - 13 ~6 - 13
(a) Entity figures may differ from SPE figures due to fiscalization of amounts
(b) Range of 10-20; dependent on investment levels for CIS and other projects under consideration. Midpoint of 15 used for valuation purposes
(c) Includes recent acquisition of Metronome; FY10 figures reflect CY09 latest projections provided by Shine as part of Metronome transaction evaluation
(d) Projected book value at end of FY10, which is estimated time of exit
Potential SPE Financial Benefit
Book ValuePotential TransactionEntity Current Equity
Rough Enterprise Valuation
(100%)
SPE FY10Q2
EBIT
FY10 - at 100%(a)
9.8 6805129.4% SPE58.8% HBO11.8% Ole
352

Shine
Key Considerations
• As part of SPE’s funding in the Metronome acquisition, Shine made good faith commitment to find a buyer for SPE stake by end of FY10, with purchase price in cash of at least $73MM
Valuation Basis
• DCF analysis based on terminal value of 10x EBITDA and 10% discount rate
• Implied multiple of ~0.7x-1.0x FY10E revenue and ~7.5x-11x EBITDA
Shine
DescriptionLeading UK production super-indie with ownership of Reveille in U.S. and Metronome in Scandinavia
Equity Ownership
20% SPE; 56.3% Elizabeth Murdoch; 23.7% other
FY09A* FY10E FY11E FY12E
Revenue(100%) $359MM $600MM $679MM $718MM
EBIT (100%) $26MM $54MM $77MM $88MM
SPE EBIT $4MM $7MM $15MM $18MM
* Calendar year. Note FY10-FY12E include Metronome acquisition
Note: SPE basis reflects proforma as of end of FY10
ShineLow Med High
Enterprise Value $400.0 $500.0 $600.0
Less Debt ($135.0) ($135.0) ($135.0)
Equity Value $265.0 $365.0 $465.0
SPE % 20.0% 20.0% 20.0%
Cash to SPE $53.0 $73.0 $93.0
SPE Basis ($55.0) ($55.0) ($55.0)
EBIT Gain/(Loss) ($2.0) $18.0 $38.0
4

GSN
Key Considerations
• Sizeable divestiture; sale of our 35% stake could
generate ~$270MM of cash and ~$200MM in EBIT
• May be difficult to entice Liberty/DirecTV to acquire in the near-term
• Buy/sell or put/call provisions are not triggered until December 2011
• Liberty / DirecTV could acquire sooner but has shown little progress
– Liberty has not yet executed Liberty Entertainment spin-off previously planned for June
– Subsequent merger with DirecTV is negotiated but not yet approved
Valuation Basis
• Value estimate based on recent transaction values, may be at high-end of range
– GSN valued at $600MM– FUN valued at $180MM– Implied combined value of $780MM
GSN
DescriptionCable network with a primary programming focus on game show content with distribution to over 66MM homes
Equity Ownership
35% SPE; 65% Liberty Media
CY07A CY08A CY09E CY10E CY11E
Revenue(100%) $126MM $134MM $218MM $219MM $234MM
EBIT (100%) * $26.7MM $47.4MM $54.1MM $61.0MM $72.4MM
SPE EBIT $13.8MM $19.9MM $19.0MM $21.5MM $25.5MM
GSN
Enterprise Value $780.0
Less Debt $0.0
Equity Value $780.0
SPE % 35.0%
Cash to SPE $273.0
SPE Basis ($73.8)
EBIT Gain/(Loss) $199.2
5* CY07 and CY08 EBIT is before audit adjustments

ITN
Key Considerations
• ITN is a smaller divestiture with our likely buyers (existing partners VSS or Zelnick) expected to be interested at discounted price
– SPE’s minority position and VSS’s approval right over our transfer limits number of potential buyers
• Zelnick has confirmed that they are interested in acquiring our stake, but only at our cost ($8.5MM, or total valuation of $126MM)
• Exiting at fair value likely requires waiting for sale of entire company (timing TBD)
Valuation Basis
• Low case based on DCF of historical average EBITDA (2006-09 for low end, 2000-09 for high end) and 20% illiquidity discount (implied 4.1 - 4.6x multiple)
• Mid case assumes no change in enterprise value from acquisition; pay-down of debt increases equity value over acquisition (4.8x multiple)
• High case based on DCF of historical average EBITDA (2006-09 for low end, 2000-09 for high end) with no illiquidity discount (5.1 - 5.8x multiple)
• Compares to trailing Omnicom multiple of 5.7x as of 4/24/09
ITN
DescriptionDevelops and markets targeted national advertising through the aggregation of local television spot inventory
Equity Ownership
15% SPE; 78% Veronis Suhler Stevenson; 7% Zelnick Media and key management
CY06A CY07A CY08A CY09E CY10E
Revenue(100%) $152MM $203MM $200MM $162MM NA
EBITDA (100%) $17.2MM $16.0MM $32.7MM $26.1MM NA
SPE EBIT NA NA NA NA NA
6
Zelnick Low Mid High
Enterprise Value $125.7 $135-$152 $156.00 $168-$190
Less Debt ($69.0) ($69.0) ($69.0) ($69.0)
Equity Value $56.70 $66-$83 $87.00 $99-$121
SPE % 15% 15% 15% 15%
Cash to SPE * $8.5 $9.8-$12.4 $13.1 $14.9-$18.1
SPE Basis ($8.5) ($8.5) ($8.5) ($8.5)
EBIT Gain/(Loss) $0.0 $1.3 - $3.9 $4.6 $6.4 - $9.6
* Proceeds calculation is before adjustment for MIP
ITN

PMP Showtime
Key Considerations
• While PMP provides positive EBIT and
cash contribution, it is not a strategic
asset
• Potential negative impact to licensing
revenue, currently ~$15MM per year,
could be mitigated by securing a long-
term contract
• Buyers are some or all of existing
partners
Valuation Basis
• DCF analysis based on 8-10x EBIT terminal value and 10% discount rate
PMP Showtime
Description Leading Australian pay TV channel
Equity Ownership20% SPE; 20% Liberty Media; 20% Paramount; 20% Fox; 20% NBCU
FY08A FY09A FY10E FY11E FY12E
Revenue(100%) $79MM $83MM $84MM $89MM N/A
Net Income 100%) $6.1MM $6.2MM $5.3MM $5.6MM N/A
SPE EBIT $2.3MM $0.9MM $1.2MM $1.1MM N/A
PMP ShowtimeLow Med High
Enterprise Value $35.0 $37.5 $40.0
Less Debt $0.0 $0.0 $0.0
Add Cash * $10.0 $10.0 $10.0
Equity Value $45.0 $47.5 $50.0
SPE % 20.0% 20.0% 20.0%
Cash to SPE $9.0 $9.5 $10.0
SPE Basis ($7.4) ($7.4) ($7.4)
EBIT Gain/(Loss) $1.6 $2.1 $2.6
* Appr. A$14MM on balance sheet
7

TV1 / Sci-Fi Channel
Key Considerations
• Positive EBIT and cash flow contribution but not strategic assets
• Cash sale may be feasible due to presence of competitive buyers in the market– Universal has shown interest in acquiring
TV1 as part of its efforts to consolidate the Sci Fi brand.
– Potential negative impact to licensing revenue, currently ~$3.5MM per year, could be mitigated by long-term contract.
• Asset may provide an opportunity to swap into a wholly-owned channel– Universal’s interest may allow us to
“swap” our stake in TV1/Sci Fi for Hallmark Channel, which could then be re-branded to AXN or Animax
– Deal may require incremental cash of ~$5MM
Valuation Basis
• DCF analysis with 8x EBIT exit multiple and 10% discount rate
TV1 / Sci Fi
Description Australian pay television channels
Equity Ownership 33.3% SPE; 33.3% CBS Paramount; 33.3% NBCU
FY08A FY09A FY10E FY11E FY12E
Revenue(100%) $22MM $25MM $26MM $28MM $30MM
Net Income (100%) $4.2MM $5.9MM $4.6MM $3.6MM $6.0MM
SPE EBIT $1.4Mm $1.9MM $1.8MM $1.1MM $2.0MM
TV1 / Sci Fi
Low Medium High
Enterprise Value $30.0 $40.0 $50.0
Less Debt $0.0 $0.0 $0.0
Equity Value $30.0 $40.0 $50.0
SPE % 33.3% 33.3% 33.3%
Cash to SPE $10.0 $13.3 $16.7
SPE Basis ($3.5) ($3.5) ($3.5)
EBIT Gain / Loss $6.5 $9.8 $13.2
8

FilmFlex
FilmFlex
Description UK VOD service on Virgin Media
Equity Ownership
50% SPE; 50% Disney
FY08A FY09A FY10E FY11E FY12E
Revenue(100%) $56MM $49MM $53MM $58MM $64.5MM
EBIT (100%) $5.3MM $5.5MM $4.8MM $5.1MM $5.4MM
SPE EBIT $1.9MM $2.3MM $1.6MM $2.2MM $2.4MM
NOTE: projections do not include potential expansion to broadband and new territories
Key Considerations
• With 3 years remaining on carriage agreement with Virgin, currently negotiating a renewal but may not reach agreement on an extension.
• If renewal is successful, Filmflex has growth potential through expanding to broadband and new territories which would significantly enhance valuation if sale can be delayed until after expansion. Otherwise, expect venture to end in 3 years, with incentive for partners to cut costs and maximize value of remaining cash flow stream.
• Delaying sale also allows time to potentially gain carriage with additional operator which would significantly enhance asset value
• No obvious potential buyer – Disney has no desire to buy up and sale to Virgin would not generate attractive valuation.
Valuation Basis
• If carriage is not renewed (i.e. no terminal value or expansion potential), expected enterprise valuation of $10-22MM implying ~2-4x EBITDA. This compares to a potential valuation of $40-60MM, if assume projected expansion into new territories and platforms as well as terminal value of 6-8x based on long term growth (implied current EBITDA multiples of 7-10x)
• Note: SPE and Disney bought ODG's share in 2008, at implied enterprise valuation of ~$40MM (excluding part of consideration paid in lieu of future dividends)
FilmFlex Low Med HighEnterprise Value $10.0 $16.0 $22.0
Less Debt $0.0 $0.0 $0.0
Equity Value $10.0 $16.0 $22.0
% Sold 50.0% 50.0% 50.0%
Cash to SPE $5.0 $8.0 $11.0
SPE Basis ($12.4) ($12.4) ($12.4)
EBIT Gain / Loss ($7.4) ($4.4) ($1.4)
9
Note: There is a potential for a dividend distribution in FY10 not reflected in figures above

10
HBO Valuation, Cash, and Gain Considerations
• Time Warner recently purchased Disney’s 29.4% stake in HBO Latin America on a $680MM valuation and is believed to have a hand-shake deal to acquire Disney’s 33.3% stake in HBO CE on a $235MM valuation
• Sales of our HBO CE and HBO Latin America stakes at these valuations would generate gains of $146-201MM and cash of $210-278MM in FY10
Valuation Consideration Gain and Cash Considerations
Retain 10%
($MM) of HBO LA
Valuation
HBO CE - 100% $234 $234
HBO Latam - 100% $680 $680
SPE Interest Sold
HBO CE 33.3% 33.3%
HBO Latam 19.4% 29.4%
Proceeds from Sale
HBO CE $78 $78
HBO Latam $132 $200Total Cash Proceeds $210 $278
Book Value of Amount Sold
HBO CE $39 $39
HBO Latam $25 $38
Gain
Gain - HBO CE $39 $39
Gain - HBO Latam $107 $162Total Gain $146 $201
Full Sale

HBO EBIT Impact
FY10 impact assumed December 31, 2009 close of both transactions
FY09 EBIT of $37.9MM from HBO Central Europe includes $26.6MM of income from sale of SpektrumFY10 EBIT from HBO Central Europe excludes potential benefit of special dividend; HBO CE will dividend excess cash of ~$10-20MM (~$3-7MM to SPE) prior to closeFY10 EBIT of $62.7MM from HBO Latin America includes $45MM in one time proceeds for SPT not to exercise its right to buy-up as part of the Disney/TW transaction
11
($MM) FY09Retain 10%of HBO LA
Full Saleof HBO LA FY11 FY12
No SaleSPE Share of HBO Net IncomeHBO Central Europe (Fcst) $37.9 $6.0 $6.0 $5.6 $5.8HBO Latin America (MRP) $62.7 $15.0 $15.0 $15.4 $16.4
Total Ops $100.6 $21.0 $21.0 $21.0 $22.2
If SoldSPE Share of HBO Net IncomeHBO Central Europe $37.9 $5.0 $5.0 $0.0 $0.0HBO Latin America $62.7 $10.3 $9.8 $0.0 $0.0
Subtotal $100.6 $15.3 $14.8 $0.0 $0.0
Sale ProceedsHBO Central Europe $0.0 $39.2 $39.2 $0.0 $0.0HBO Latin America $0.0 $108.0 $163.0
Subtotal $0.0 $147.2 $202.2 $0.0 $0.0
Total $100.6 $162.5 $217.0 $0.0 $0.0
VarianceHBO Central Europe $0.0 $38.2 $38.2 ($5.6) ($5.8)HBO Latin America $0.0 $103.3 $157.8 ($15.4) ($16.4)
Total $0.0 $141.5 $196.0 ($21.0) ($22.2)
FY10

FilmBank
FilmBank
Description UK leader in non-theatrical and pay TV services (key markets: Hotelvision, Seavision, Public Video Screening License)
Equity Ownership 50% SPE; 50% Warner Bros.
FY08A FY09E FY10E FY11E FY12E
Revenue(100%) $13.0MM $14.3MM $15.4MM $17.4MM $20.0MM
EBIT (100%) ($427K) $328K $405K $896K $1.5MM
SPE EBIT* ~$0 ~$0 ~$0 ~$0 ~$0
NOTE: Projections per management 9/09 forecasts, exchange rate used: 1.65 USD/GBP*SPE equity pick up is nominal (based on 50%of net income figures), currently confirming actuals
Key Considerations
• FilmBank is no longer a strategic asset - SPE’s annual licensing revenues (~$2-3MM) does not require equity participation and board involvement
• However, no obvious potential buyers and Warner Bros. may be averse to SPE exit (Warner Bros. currently has favorable deal structure and SPE as owner guarantees SPE content)
Valuation Basis
• Valuation estimate based on comparable revenue multiples of 1x – 2x and DCF valuation with terminal value of 10-15x EBITDA and 10% discount rate
• Valuation may be discounted due to limited buyer interest
FilmBankLow Med High
Enterprise Value $6.0 $10.0 $14.0
Less Debt $0.0 $0.0 $0.0
Equity Value $6.0 $10.0 $14.0
SPE % 50.0% 50.0% 50.0%
Cash to SPE $3.0 $5.0 $7.0
SPE Basis $0.0 $0.0 $0.0
EBIT Gain/(Loss) $3.0 $5.0 $7.0
12

FEARnet
FEARnet
DescriptionCurrently VOD only Horror Channel with limited distribution; goal of taking channel linear
Equity Ownership
33.3% SPE; 33.3% Lions Gate; 33.3% Comcast
FY08A FY09A FY10E FY11E FY12E
Revenue(100%) $14.9MM $19.2MM $27.2MM
EBIT (100%) ($16.8MM) ($12.9MM) ($5.5MM) ($12.8MM) ($15.1MM)
SPE EBIT* ($5.6MM) ($4.8MM) ($1.9MM) ($4.9MM) ($6.2MM)
Key Considerations
• If retained, represents and opportunity to expand U.S. linear channel presence and gain an important foothold in the domestic market
• If sold, license agreement likely needs to be restructured
• Limited pool of potential buyers
– Comcast: Currently not funding operations
– Lions Gate: Uncertain appetite; still integrating TV Guide
– NBCU: Need to validate fit with Chiller
– DirecTV: Expressed some interest last year
Valuation Basis
• Transfer restrictions create difficulty
– Comcast and Lions Gate unlikely to support sale below invested capital
– Buyers may not be interested at $39.9MM valuation
• High valuation assumed SPE is bought out at invested capital
• Low valuation assumes SPT bought out at 50% of invested capital
13
Confirming
($MM) Low High
Enterprise Value $20.0 $39.9
SPE % Share 33.3% 33.3%
Cash to SPE $6.67 $13.30
SPE Basis $0.40 $0.40
EBIT Gain/(Loss) $6.27 $12.90
FEARnet