Company Presentation - Hamborner · Historical development of the company From mining to real...
27
Company Presentation Preliminary figures business year 2011, February 2012
Transcript of Company Presentation - Hamborner · Historical development of the company From mining to real...

Company Presentation
Preliminary figures business year 2011, February 2012
Historical development of the companyFrom mining to real estate
Issuing of special share fund
Change of major shareholder
Strategy change / new management:Growth courseLiquidation of special share fund SüdinvestConcentration on core business property
Since February 18th company name HAMBORNER REIT AG
Foundation of company: HAMBORNER founded as a mining company1953
Integration of the mining activities into Ruhrkohle AG1969
Continuation of HAMBORNER AG as a property company1970
1990
2007
2007 ff.
2010
Mining
Assetadministration
Growth and value creation as"pure property
public limited company"
Inclusion in S‐DAX2011
Listed on stock exchange as HAMBORNER Bergbau AG1954
Capital Increase October 20102010
Company presentation, February 2012 (preliminary figures) 2

Shareholder structure
Company presentation, February 2012 (preliminary figures) 3

Corporate structure
Lean structure – no holding/parent companies
HAMBORNER REIT AG
Directly owned propertyGerman‐wide portfolioMarket value of properties: € 504 million(12/2011)
26 employees2 board members
High street OfficeLarge‐scale retailing
Undeveloped property holdings
Internal management of REITOnly infrastructural building servicesexternally contracted out
Company presentation, February 2012 (preliminary figures) 4

Company presentation, February 2012 (preliminary figures)
Strategy
Value‐creating growth through continuous expansion of portfolio
Strategic prime objectives:
Yield‐oriented expansion of existing commercial property portfolio
Regional diversification into German regions with strong growth
Measures:
Improving cost‐yield structures through buying larger properties and selling smaller properties
Continued focus on towns and cities outside the metropolises (in particular South and Southwest Germany)
Retentionof theinvestment mix
5

→ 69 properties at 51
locations in Germany
→ Approx. 1.4 million m²
undeveloped areas
→ Approx. € 504 million
market value total assets
31,7 %Commercial(High‐Street)
34,1 %Large‐scale retail trade
Current property portfolio (31.12.2011)
→ Distribution of
portfolio according to
rental income
34,2 %Office / Other
6Company presentation, February 2012 (preliminary figures)
historicalcore areaNRW
regional diversifikation
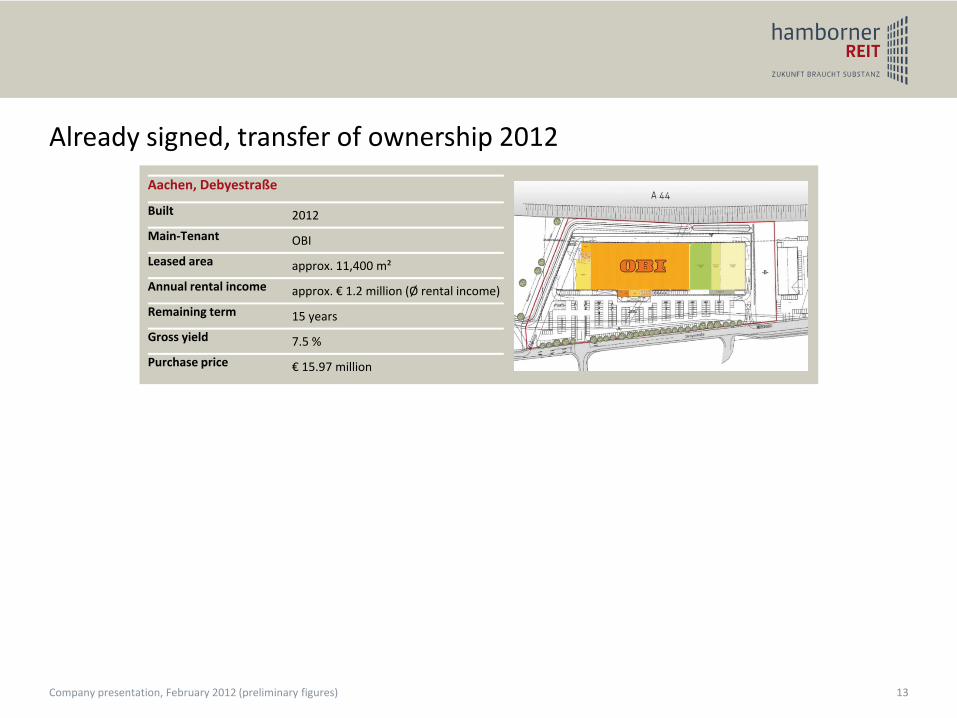
Development of HAMBORNERs portfolio value
Company presentation, February 2012 (preliminary figures) 7
2004
€ 179 million
€ 177 million
€ 186 million
€ 504 million
2006
€ 273 million
2008 20102007
€ 281 million
€ 308 million
2005 2009 2011
€ 376 million
Change of strategy

Latest Investments
Company presentation, February 2012 (preliminary figures) 8
City Address Asset‐Class Space in m² Rent p. yearin € thousand
Purchase pricein € million
Bad Homburg Louisenstr. 53‐57 High Street 3,232 849 13.7Brunnthal Eugen‐Sänger‐Ring 7 Office 6,721 912 12.0Leipzig Brandenburger Str. 21 Retail / DIY market 11,139 890 11.6Regensburg Hildegard‐von‐Bingen‐Str. 1 Office/ Medical Practices 8,998 1,363 21.0Freiburg Lörracher Str. 8 Large Scale Retail 3,987 860 11.4Erlangen Allee‐am‐Röthelheimpark 11‐15 Office / Retail 11,600 1,733 28.1Langenfeld Solinger Str. 5‐11 High Street 6,295 1,111 16.3
Offenburg Hauptstr. 72/74 High Street 5,150 520 7.957,122 8,238 122.0
City Address Asset‐Class Space in m² Rent p. yearin € thousand
Purchase pricein € million
Transfer ofownership
Aachen Debyestraße Retail / DIY market 11,431 1,020 approx. 16 2012e
München Domagkstraße 10 Office approx. 12,000 2,294 approx. 40 2013e
Transfer of ownership 2011
Transfer of ownership 2012 / 2013

Brunnthal, Eugen‐Sänger‐Ring 7
Built 2010
Main‐Tenant SFC Energy AG
Leased area approx. 6,700 m²
Annual rental income € 912,490
Remaining term approx. 8.4 years
Gross initial yield 7.6 %
Purchase price € 12 million
Transfer of ownership in 2011
9
Bad Homburg, Louisenstr. 53‐57
Built 1985
Main‐Tenant Naspa, Hussel, Hof Apotheke,…
Leased area approx. 3,200 m²
Annual rental income € 860,622
Remaining term approx. 4.4 years
Gross initial yield 6.3 %
Purchase price € 13.7 million
Company presentation, February 2012 (preliminary figures)

Leipzig, Brandenburger Str. 21
Built 2010
Main‐Tenant OBI
Leased area approx. 11,000 m²
Annual rental income € 889,527
Remaining term approx. 13.0 years
Gross initial yield 7.6 %
Purchase price € 11.6 million
10
Regensburg, Hildegard‐von‐Bingen‐Str. 1
Built 2007
Main‐Tenant different medical practices
Leased area approx. 8,800 m²
Annual rental income € 1.43 million
Remaining term approx. 6.8 years
Gross initial yield 6.8 %
Purchase price € 21.0 million
Company presentation, February 2012 (preliminary figures)
Transfer of ownership in 2011

11Company presentation, February 2012 (preliminary figures)
Langenfeld, Solinger Str. 5
Built 2011
Main‐TenantH&M, Tom Tailor, Depot, dm, and other
Leased area approx. 6,400 m²
Annual rental income approx. € 1.14 million
Remaining term approx. 9.3 years
Gross initial yield 6.6 %
Purchase price € 17.1 million
Transfer of ownership in 2011
Erlangen, Allee am Röthelheimpark 11‐15
Built 2010/2011
Main‐Tenant Konsum, dm, Pfrimmer and other
Leased area approx. 11,600 m²
Annual rental income € 1.93 million
Remaining term approx. 9.6 years
Gross initial yield 6.9 %
Purchase price € 28.1 million

12Company presentation, February 2012 (preliminary figures)
Transfer of ownership in 2011
Offenburg, Hauptstraße 72‐74
Built 1973, reconstruction 2008/2009
Main‐Tenant Müller Drogeriemarkt
Leased area approx. 5,100 m²
Annual rental income approx. € 525,000
Remaining term approx. 6.3 years
Gross initial yield 6.6 %
Purchase price € 7.9 million
Freiburg, E‐Center
Built 2011
Main‐Tenant EDEKA
Leased area approx. 4,000 m²
Annual rental income € 860,000
Remaining term 18 years
Gross initial yield 7.5 %
Purchase price € 11.4 million
13Company presentation, February 2012 (preliminary figures)
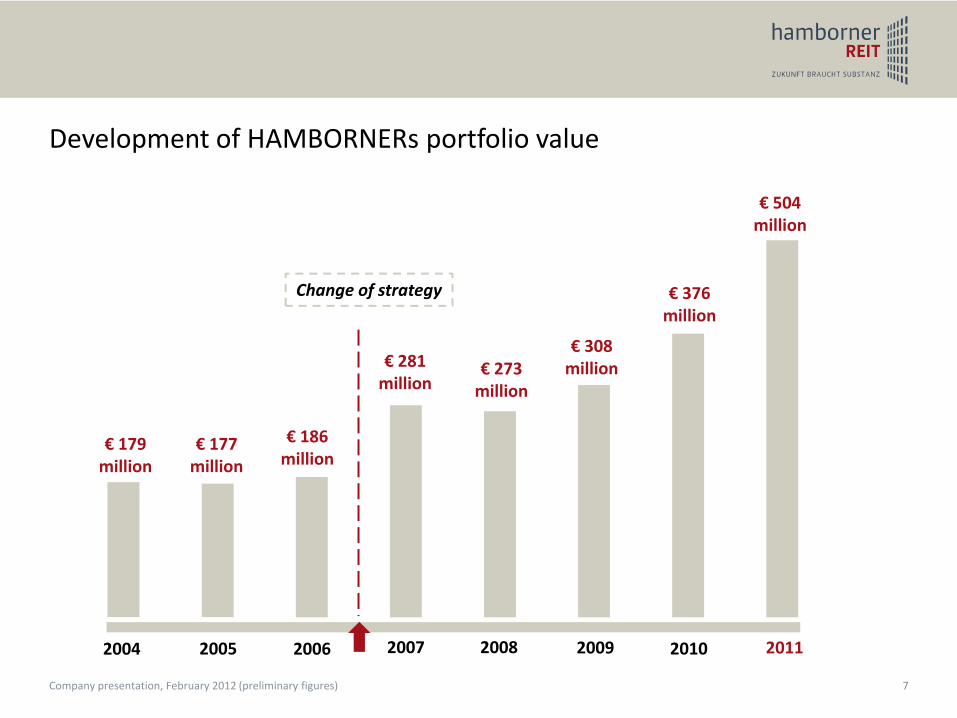
Already signed, transfer of ownership 2012
Aachen, Debyestraße
Built 2012
Main‐Tenant OBI
Leased area approx. 11,400 m²
Annual rental income approx. € 1.2 million (Ø rental income)
Remaining term 15 years
Gross yield 7.5 %
Purchase price € 15.97 million

Acquisition in sustainability
Munich, NuOffice
aiming at LEED‐platinum certification
building under construction / completion 2012
Annual rental income € 2.3 million
Remaining term 8.8 years
Gross initial yield 5.9 %
Purchase price € 39.3 million
Already signed, transfer of ownership 2013
14Company presentation, February 2012 (preliminary figures)
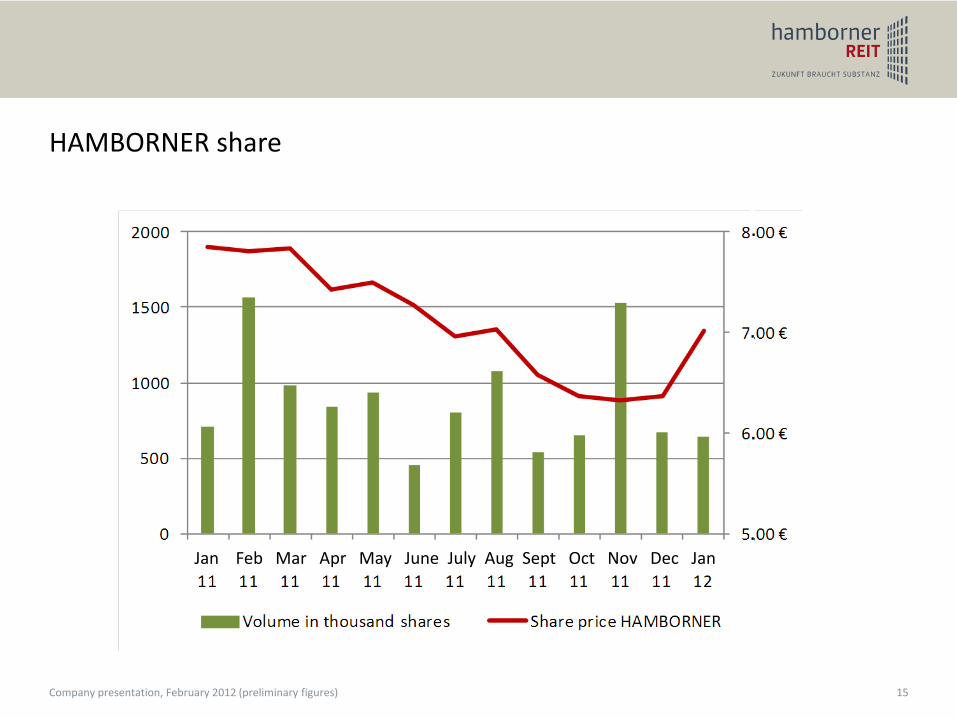
HAMBORNER share
Company presentation, February 2012 (preliminary figures) 15
Jan Feb Mar Apr May June July Aug Sept Oct Nov Dec Jan
.
.
.
.

Significant key figures 2011 (preliminary)
16
Key figures 2011 2010 Change
Rental revenues € 32.2 million € 25.0 million + 29 %
Operating result € 14.9 million € 12.5 million + 19 %
Profit for the period € 7.9 million € 5.7 million + 39 %
Funds from Operations € 16.0 million € 12.1 million + 32 %
Funds from Operations (FFO) per share € 0.47 € 0.36 + 32 %
2011 2010
REIT equity ratio 55.7 % 74.4 % ‐ 18.7 %‐points
Loan to Value (LTV) 39.1 % 19.3 % + 19.8 %‐points
Net Asset Value (NAV) per share € 8.77 € 8.74 + 0.3 %
Dividend per share *€ 0.40 € 0.37 + 8.1 %
Company presentation, February 2012 (preliminary figures)
* proposal of the boardof management
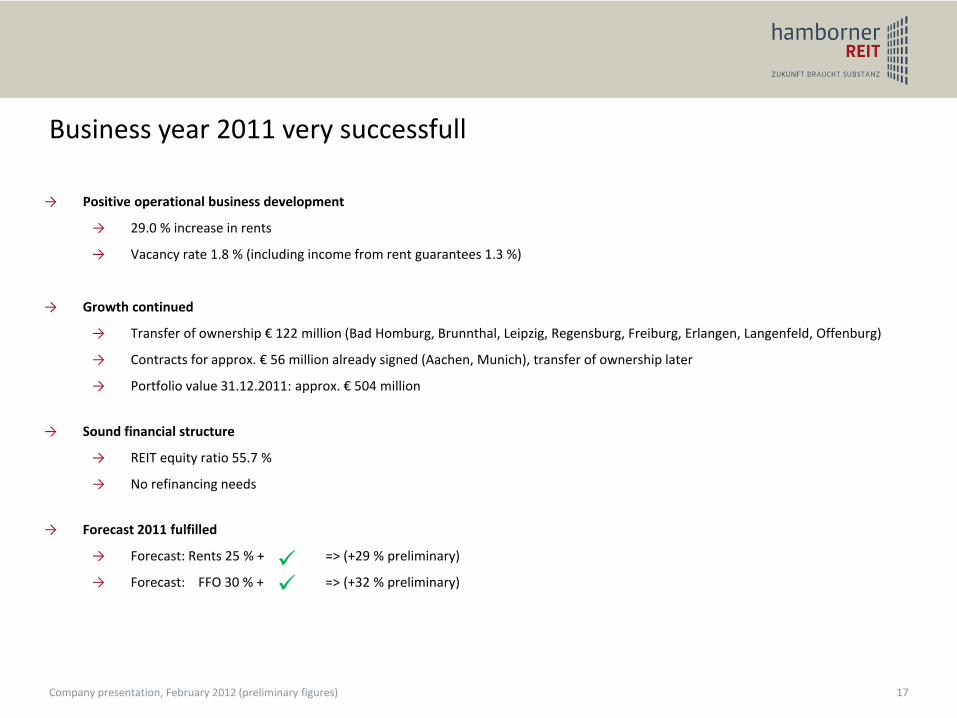
→ Positive operational business development
→ 29.0 % increase in rents
→ Vacancy rate 1.8 % (including income from rent guarantees 1.3 %)
→ Growth continued
→ Transfer of ownership € 122 million (Bad Homburg, Brunnthal, Leipzig, Regensburg, Freiburg, Erlangen, Langenfeld, Offenburg)
→ Contracts for approx. € 56 million already signed (Aachen, Munich), transfer of ownership later
→ Portfolio value 31.12.2011: approx. € 504 million
→ Sound financial structure
→ REIT equity ratio 55.7 %
→ No refinancing needs
→ Forecast 2011 fulfilled
→ Forecast: Rents 25 % + => (+29 % preliminary)
→ Forecast: FFO 30 % + => (+32 % preliminary)
Company presentation, February 2012 (preliminary figures) 17
Business year 2011 very successfull

Vacancy rate: 1.8 %
Vacancy rate (incl. rent guarantees): 1.3 %
Company presentation, February 2012 (preliminary figures) 18
Management revenuesSteady increase in management revenues combined with low vacancies
Q1 2008
5,300T €
5,314T €
5,482 T €
5,502 T €
5,958 T €
6,264T €
6,345T €
Q1 2009
Q3 2008
Q22009
Q2 2008
Q3 2009
Q4 2008
6,303T €
Q4 2009
6,445T €
Q1 2010
6,743T €
Q2 2010
7,055T €
Q3 2010
7,484T €
Q4 2010
7,810T €
2008: 21,589 T€
2009: 24,870 T€
2010: 27,727 T€
8,700T €
Q1 2011
Q2 2011
9,345T €
Q3 2011
9,552T €
Q4 2011
2011: 35,407 T€

Rental agreementsAround 70% of the contractual rental income first expires in 2016 and later.
Share of rental agreementexpiries in entire portfolio
2016 and later
Ø Remaining terms of rental agreementsaccording to type of properties
19Company presentation, February 2012 (preliminary figures)

Share in total rent p.a.
(incl. rent guarantees) in %
Kaufland Group 13.0 %
EDEKA 10.4 %
OBI 5.0 %
AREVA 2.8 %
SFC Energy 2.6 %
Telefonica O2 2.3 %
REWE 2.2 %
BfA 2.1 %
dm 2.0 %
Kaspersky 2.0 %
Total 49.5 %
TOP 10 TenantsCreditworthy tenants
20Company presentation, February 2012 (preliminary figures)
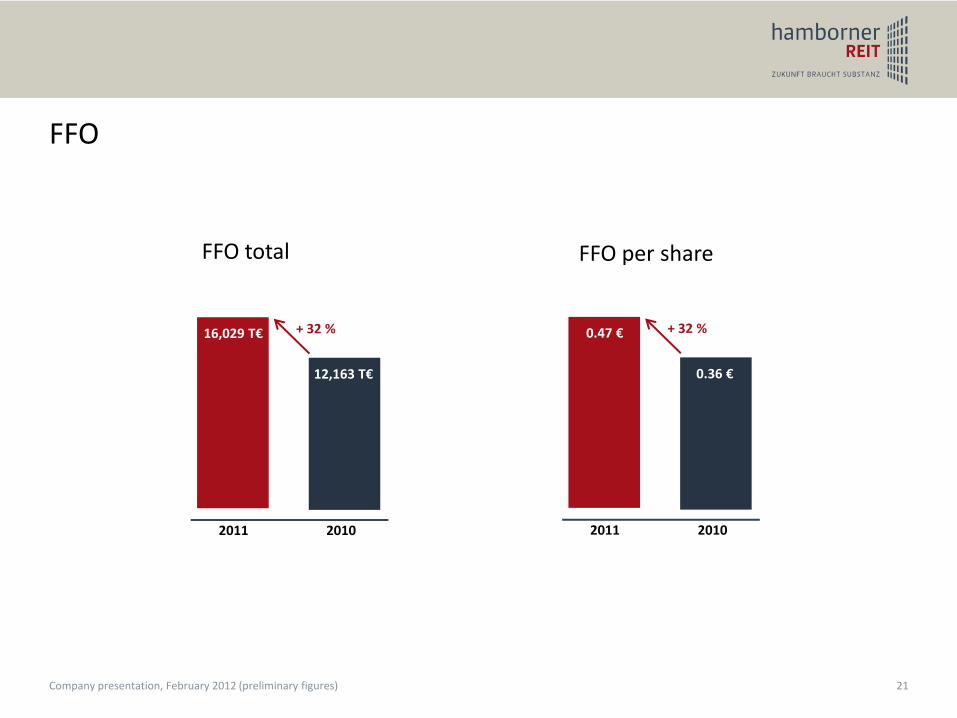
FFO
2011
16,029 T€
12,163 T€
2010
+ 32 %
21Company presentation, February 2012 (preliminary figures)
FFO total
2011
0.47 €
0.36 €
2010
+ 32 %
FFO per share

0% 0% 0% 0%2%
19% 19%
2%
30%
25%
3%
2012 2013 2014 2015 2016 2017 2018 2019 2020 2021 2022
FinancingNo short‐term refinancing needs.
Expiration of fixed interest rates
in % of the total financial debt
Ø interest rate
of debt capital:
4.43 %
actual financial debt:
€ 216.2 million
Ø remaining term of
fixed interest rate:
7.8 years
22Company presentation, February 2012 (preliminary figures)
liquid funds: € 18.7 million
LTV: 39.1 %
REIT‐equity ratio: 55.7 %

0,10 €
0,15 €
0,20 €
0,25 €
0,30 €
0,35 €
0,40 €
90 92 94 96 98 00 02 04 06 08 10
Dividend Bonus
FFO 2011:0.47 €
Development of dividends
0.40 €
23Company presentation, February 2012 (preliminary figures)
Dividend‐proposalof the board of management
0.40 €
0.35 €
0.30 €
0.25 €
0.20 €
0.15 €
0.10 €
+ 8.1 %

Dividend expectations
Company presentation, February 2012 (preliminary figures) 24
Source: Solventis Research, Feb 2012
Dividend yield 2011e

Financial Calendar 2012
HAMBORNER REIT AG
Annual report 2011 29 March 2012
Interim report for 1st quarter 2012 10 May 2012
Annual general shareholders´ meeting 2012 15 May 2012
Interim report for 1st half 2012 9 August 2012
Interim report for 3rd quarter 2012 8 November 2012
25Company presentation, February 2012 (preliminary figures)
Many thanks for your attention!

Contact
Dr. Rüdiger Mrotzek ‐ Vorstand
T +49 (0)203 / 54405‐55
Hans Richard Schmitz ‐ Vorstand
T +49 (0)203 / 54405‐21
Sybille Albeser ‐ Investor Relations
T +49 (0)203 / 54405‐32

Disclaimer
27Company presentation, February 2012
(preliminary figures)
This presentation was exclusively prepared for the addresses specified on the title page and/or the participants at the mentioned event.The information in this presentation is based on both public information and documents as well as information which was made available toHAMBORNER REIT AG by the respectively mentioned companies and third parties.
All statements, opinions and assessments contained in this presentation correspond to the current estimates and/or opinions of HAMBORNERREIT AG and may therefore not be construed as constant, immutable statements. HAMBORNER gives no guarantee with regard to thecorrectness or completeness of the information contained herein. HAMBORNER and its organs, boards, employees or other parties acting onbehalf of HAMBORNER accept no liability whatsoever for the statements made in this presentation.


![HAMBORNER REIT AG Company Presentation March … · Company Presentation March 2018 - Annual report 2017 [R] ... Herbalife, Alcan Systems Leased ... Book value as of 31 Dec 2016:](https://static.fdocuments.us/doc/165x107/5b16f34e7f8b9a0b548b6821/hamborner-reit-ag-company-presentation-march-company-presentation-march-2018.jpg)