CONTENTS · · 2017-04-10CONTENTS Company Information Vision and Mission Statement ... Notes to...
66
Transcript of CONTENTS · · 2017-04-10CONTENTS Company Information Vision and Mission Statement ... Notes to...
www.nimir.com.pk
Annual Report 2016
1
CONTENTSCompany Information
Vision and Mission Statement
Chairman Message
CEO Message
Our Performance
Wealth Generated and Distributed
Key Operating & Financial Data For Last Six Years
Directors’ Report
Statement of Compliance CCG
Review Report from Auditors
Auditors Report
Financial Statements
Notes to the Financial Statements
Pattern of Shareholding
Statement Pursuant To Section 218
Notice of Annual General Meeting
Form of Proxy
02
03
04
05
06
07
09
12
18
20
21
22
27
57
60
61
Annual Report 2016
Nimir Resins Limited2
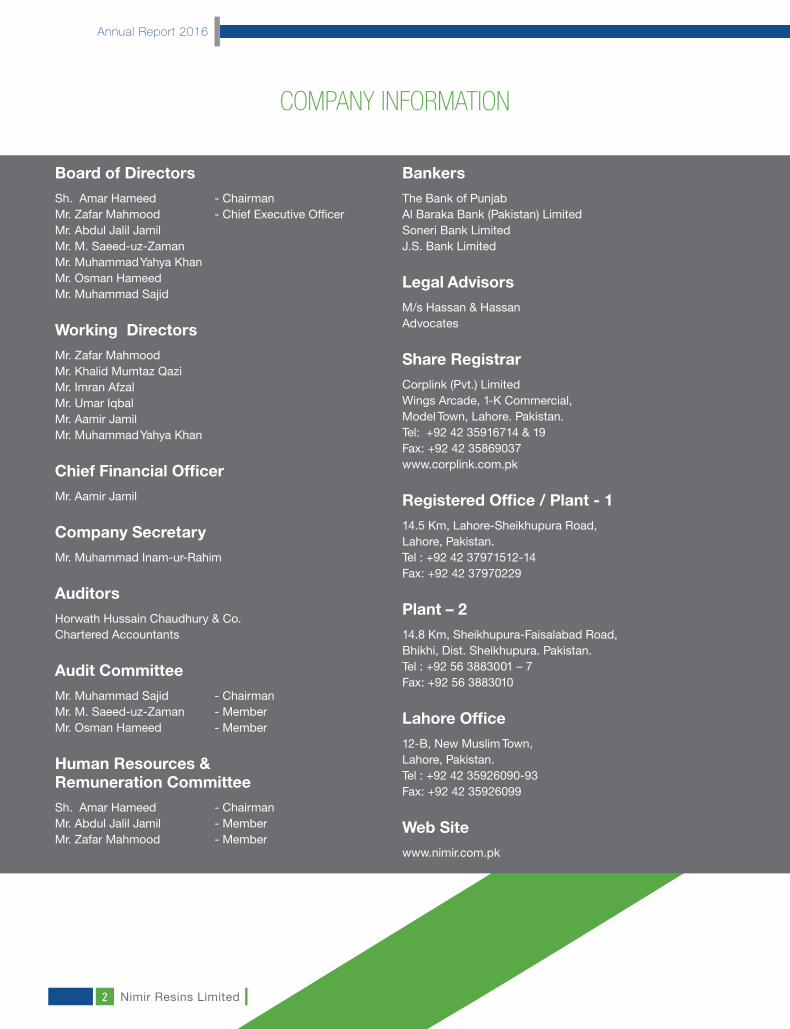
COMPANY INFORMATION
Board of DirectorsSh. Amar Hameed - Chairman Mr. Zafar Mahmood - Chief Executive Officer Mr. Abdul Jalil Jamil Mr. M. Saeed-uz-Zaman Mr. Muhammad Yahya Khan Mr. Osman Hameed Mr. Muhammad Sajid
Working DirectorsMr. Zafar MahmoodMr. Khalid Mumtaz QaziMr. Imran AfzalMr. Umar IqbalMr. Aamir JamilMr. Muhammad Yahya Khan
Chief Financial OfficerMr. Aamir Jamil
Company SecretaryMr. Muhammad Inam-ur-Rahim
AuditorsHorwath Hussain Chaudhury & Co.Chartered Accountants
Audit CommitteeMr. Muhammad Sajid - ChairmanMr. M. Saeed-uz-Zaman - MemberMr. Osman Hameed - Member
Human Resources &Remuneration CommitteeSh. Amar Hameed - ChairmanMr. Abdul Jalil Jamil - MemberMr. Zafar Mahmood - Member
Bankers The Bank of PunjabAl Baraka Bank (Pakistan) LimitedSoneri Bank LimitedJ.S. Bank Limited
Legal AdvisorsM/s Hassan & HassanAdvocates
Share RegistrarCorplink (Pvt.) LimitedWings Arcade, 1-K Commercial,Model Town, Lahore. Pakistan.Tel: +92 42 35916714 & 19Fax: +92 42 35869037www.corplink.com.pk
Registered Office / Plant - 114.5 Km, Lahore-Sheikhupura Road,Lahore, Pakistan.Tel : +92 42 37971512-14Fax: +92 42 37970229
Plant – 214.8 Km, Sheikhupura-Faisalabad Road,Bhikhi, Dist. Sheikhupura. Pakistan.Tel : +92 56 3883001 – 7Fax: +92 56 3883010
Lahore Office12-B, New Muslim Town,Lahore, Pakistan.Tel : +92 42 35926090-93Fax: +92 42 35926099
Web Sitewww.nimir.com.pk

www.nimir.com.pk
Annual Report 2016
3
OUR VISION & MISSION
Our VisionTo become an industry leader through a persistent commitment to customer focus, technical innovation, managerial excellence, entrepreneurial spirit and social responsibility.
Our MissionTo deliver unparalleled value to stakeholders and continually striving to exceed customer expectations by developing innovative industrial chemical solutions with special emphasis on workforce, health, safety, environment and contribution to the national economic development.

Annual Report 2016
Nimir Resins Limited4
CHAIRMAN’S MESSAGE
I am pleased to announce the operating results of Nimir Resins Limited (NRL) for the year ending 30th June 2016. From a loss of Rs.83 million in the previous year your company has made a net profit of Rs.53 million this year. These results are all the more remarkable because this turnaround of Rs.136 million was achieved within six months. Credit must be given where due and the credit for this achievement belongs to our new management team of NRL who took over the reins of this company in January this year.
The new sponsors of your company injected considerable amount into the company to reduce financial cost and fund essential capital expenditure. Your new management capitalised on this by introducing improvements and efficiencies at every level in every department. Their hard work and Allah’s blessings ensured our success.
While I congratulate our management team and all other stakeholders, I am acutely aware that further innovative improvements are necessary, if shareholders are to receive a fair return on their investment Inshallah. To this end your management intends to take full advantage of
our versatile equipment by introducing new products in coming years and has upgraded the company’s R&D department for this purpose.
I am hopeful that our government will continue to pursue fiscal policies which will encourage industrialization and fair competition in the country so that companies like ours can continue to grow and prosper.
Sheikh Amar HameedChairman

www.nimir.com.pk
Annual Report 2016
5
CEO’S MESSAGE
By the Grace of Allah and the support of our dynamic team and staff, I am proud to announce the turnaround in Nimir Resins Limited (NRL). The new sponsors and management team took over control of the Company in January 2016. The new management has significantly improved the operating performance of the Company and made a seamless turnaround of the Company from a loss making unit to a profitable unit in a very short span of time.
By reshaping the Company, the management has focused on advancement in its product range and quality with enhanced research and development. This will lead to constant improvements in the products and plant, and help keep pace with current competitive trends in the local and global markets.
Being pioneers and leaders in the chemicals industry with an in depth knowledge of the sector, the management is now focusing on a dynamic marketing strategy.
At NRL customer satisfaction is our ultimate goal. Hence, we are committed to every possible means to achieve that. The best product, at the best price is our mantra.
To achieve this, we have introduced a dedicated team that ensures quality control so that only the best product goes into the market at a competitive rate.
I would like to thank our management team and staff that have worked tirelessly to make this turnaround possible in such a short span of time.
Zafar MahmoodChief Executive Officer
Annual Report 2016
Nimir Resins Limited6
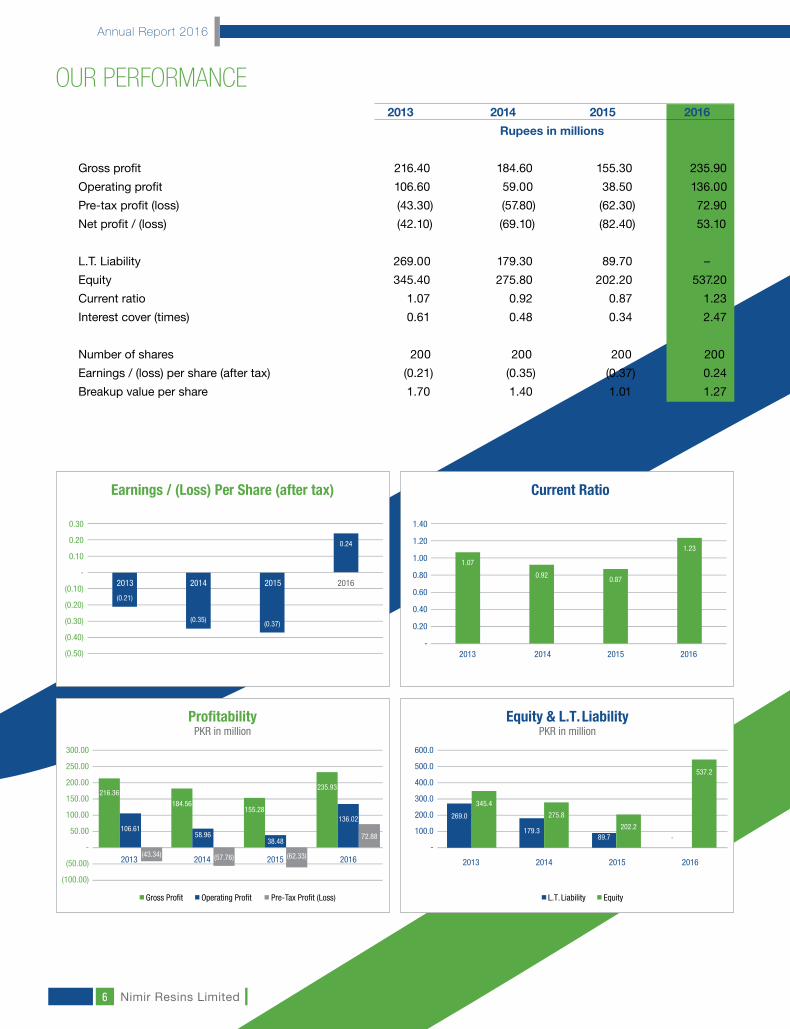
OUR PERFORMANCE 2013 2014 2015 2016 Rupees in millions
Gross profit 216.40 184.60 155.30 235.90
Operating profit 106.60 59.00 38.50 136.00
Pre-tax profit (loss) (43.30) (57.80) (62.30) 72.90
Net profit / (loss) (42.10) (69.10) (82.40) 53.10
L.T. Liability 269.00 179.30 89.70 –
Equity 345.40 275.80 202.20 537.20
Current ratio 1.07 0.92 0.87 1.23
Interest cover (times) 0.61 0.48 0.34 2.47
Number of shares 200 200 200 200
Earnings / (loss) per share (after tax) (0.21) (0.35) (0.37) 0.24
Breakup value per share 1.70 1.40 1.01 1.27
ProfitabilityPKR in million
2013 2014 2015 2016
Gross Profit Operating Profit Pre-Tax Profit (Loss)
300.00
250.00
200.00
150.00
100.00
50.00
-
(50.00)
(100.00)
216.36
106.61
(43.34)
184.56
58.96
(57.76)
155.28
38.48
(62.33)
235.93
136.02
72.88
Equity & L.T. LiabilityPKR in million
2013 2014 2015 2016
269.0
345.4
179.3
275.8
89.7202.2
537.2
L.T. Liability Equity
600.0
500.0
400.0
300.0
200.0
100.0
-
Earnings / (Loss) Per Share (after tax)
0.30
0.20
0.10
-
(0.10)
(0.20)
(0.30)
(0.40)
(0.50)
2013 2014 2015 2016
(0.21)
(0.35)(0.37)
0.24
Current Ratio
1.40
1.20
1.00
0.80
0.60
0.40
0.20
-2013 2014 2015 2016
1.07
0.920.87
1.23

www.nimir.com.pk
Annual Report 2016
7
WEALTH GENERATED AND DISTRIBUTED
Rs million PercentageWealth Generated
Sales with sales Tax 2,055 99%
Other operating profit 23 1%
2,078 100%
Distribution of Wealth
Cost of materials & services 1,521 73%
Duties & taxes 352 17%
Employees 103 5%
Finance cost 50 2%
Wealth retained 53 3%
2,078 100%
Wealth retained3%
Cost of materials& services
66.7%Finance cost
2%
Employee5%
Duties & taxes17%
Annual Report 2016
Nimir Resins Limited8
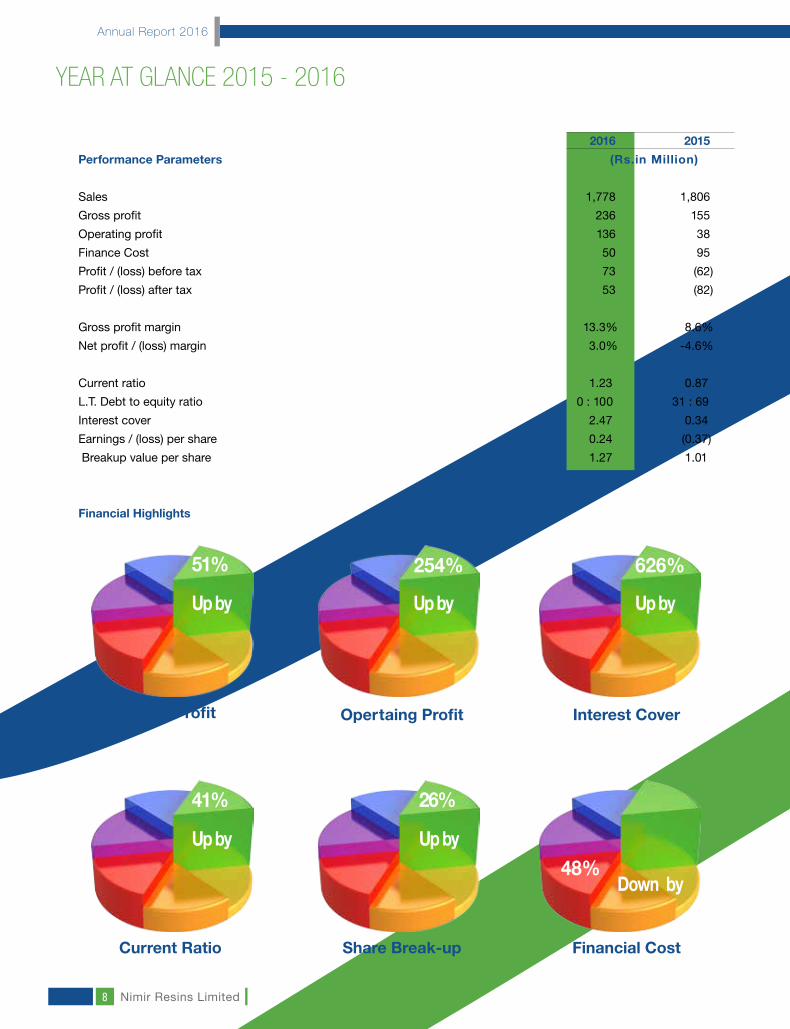
2016 2015 Performance Parameters (Rs.in Million)
Sales 1,778 1,806
Gross profit 236 155
Operating profit 136 38
Finance Cost 50 95
Profit / (loss) before tax 73 (62)
Profit / (loss) after tax 53 (82)
Gross profit margin 13.3% 8.6%
Net profit / (loss) margin 3.0% -4.6%
Current ratio 1.23 0.87
L.T. Debt to equity ratio 0 : 100 31 : 69
Interest cover 2.47 0.34
Earnings / (loss) per share 0.24 (0.37)
Breakup value per share 1.27 1.01
Financial Highlights
YEAR AT GLANCE 2015 - 2016
Gross Profit
Current Ratio
Opertaing Profit
Share Break-up
Interest Cover
Financial Cost
51%
41% 26%
48%
254% 626%
Up by
Up by Up by
Down by
Up by Up by

www.nimir.com.pk
Annual Report 2016
9
Key Operating & Financial Data for Last Six Years
2016 2015 2014 2013 2012 2011
(Rs.in Million)
Summary of Profit and Loss
Sales 1,778.0 1,806.4 2,199.5 2,402.4 2,560.9 2,601.7
Gross Profit 235.9 155.3 184.6 216.4 219.2 314.0
Operating profit 136.0 38.5 59.0 106.6 118.3 151.1
Finance Cost 49.6 94.6 111.5 110.5 125.7 159.2
Profit / (loss) before tax 72.9 (62.3) (57.8) (43.3) (4.3) 1.2
Profit / (loss) after tax 53.1 (82.4) (69.1) (42.1) (61.7) (19.3)
Financial Position
Share Capital 997.8 997.8 997.8 997.8 997.8 997.8
Net Worth 537.2 202.2 275.8 345.4 386.2 447.1
Long term borrowings from Banks 0.0 89.7 179.3 269.0 287.0 33.5
Current Assets 1,207.8 774.3 885.7 902.7 928.4 1,069.0
Current Liabilities 978.8 889.3 961.7 846.6 818.8 1,195.4
Total Assets 1,692.9 1,289.0 1,491.2 1,537.0 1,580.5 1,771.0
Investor Information
Gross profit margin 13.27% 8.60% 8.39% 9.01% 8.56% 12.07%
Pre tax margin 4.1% -3.45% -2.63% -1.80% -0.17% 0.05%
Net profit margin 3.0% -4.56% -3.14% -1.75% -2.41% -0.74%
Current Ratio 1.23 0.87 0.92 1.07 1.13 0.89
LT Bank Debt to Equity Ratio 0 : 100 31 : 69 39 : 61 44 : 56 43 : 57 7 : 93
Interest cover (Times) 2.47 0.34 0.48 0.61 0.97 1.01
Earnings / (loss) per share 0.24 (0.37) (0.35) (0.21) (0.31) (0.10)
Breakup value per share 1.27 1.01 1.38 1.73 1.94 2.24

Annual Report 2016
Nimir Resins Limited10
Core Business At A Glance
Textile Chemicals
UnsaturatedPolyester Resins
Coatings & Emulsions
Pulp & Paper Chemicals
Adhesives
Exports
Complete range of specialility chemicals for pre-treatment and finishing fortextile industry including
. Textile Auxiliaries. . Obtical Brightners. . Binders and PVAs.
A complete line of resin products for composites. • General purpose & Gel Coat Resins for Tanks, Ducts, Pipes, sheets & Articals.• Chemicals Resistant Resin.• Fillament Winding Resin, Pigment dispersion Resin & Accelerator catalyst.• Promoted & Non promoted Resins.
One of the Leading & Oldest manufacturer of Resins, Emulsions & Additivesfor the Coatings industry. Range include following products
• All types of Alkyd Resins & Modified Alkyds for Decorative, Refinish & OEM Paints.• Amino Resins, Saturated Polyesters, Eposxy ester & Urethane Alkyds.• Rosin modified Maleic & Phenolic Resins.• Thermo plastic, Thermo setting & Acrylic Polyol Resins.• Metal Driers (Cobalt, Zirconium & Calcium)• Acrylic, Styrene Acrylic & PVA Emulsion binders.• Weting Agent, Antifoam, Liquid polymeric Pigment & Emulsifiers.
Manufacturing all sizing solutions for paper industry including Alkaline,Neutral and Acidic sizing
• Coating Chemicals• Specialty Chemicals• Optical Brightening Agent
• Food grade packaging • Flexible packaging industry • Laminate glue
Export is another area of interest where we stress more and we currnltyexporting our products to Middle East and South Asian regions.
Coa
tings
, Em
ulsi
ons
& P
olye
ster
Text
ile, P
aper
& A
dhes
ives
Oth
ers

www.nimir.com.pk
Annual Report 2016
11

Annual Report 2016
Nimir Resins Limited12
DIRECTORS’ REPORTThe Board of directors of the Company is pleased to submit the annual report along with the audited financial statements for the year ended June 30, 2016.
The financial year ended on June 30, 2016 brought a lot of changes in the Company; change of shareholding, change of board of directors, change of senior management and the turnaround of the company from a loss making unit to a profitable venture.
The results for the year are summarized as follows:
2016 2015 Change PKR Million
Sales Revenue 1,778 1,806 -28Gross Profit 236 155 +81Pre-Tax Profit / (Loss) 73 (62) +135Profit after Tax / (Loss) 53 (82) +135Earnings (Loss) per share (Rs.) 0.24 (0.37) +0.61
There has been a decline in the sale turnover of the company in last few years. The first half of the current financial year also followed the same trend. However, after taking control of the company in January 2016, the new management has significantly improved the operating performance of the company.
It is a pleasure to report that by the grace of Almighty, the Company has been turned into a profit of Rs.53 million after a long history of red figures at the bottom line (last year loss was Rs.82 million). The Company achieved EPS of Rs. 0.24 per share for the year ended June 30, 2016 against loss per share of Rs.0.37 in the last year.
Future Outlook
The Company is operating in a very competitive environment and competing with the unorganized sector. Having a strong knowledge and experience of the chemicals business, the management is now focusing on increasing volumes, improving buying, reducing wastages and increasing efficiencies. A considerable capital expenditure plan has also been devised for BMR of the plant. Every capex is spent carefully after complete due diligence.
A process of issuing right shares of Rs.385 million has already been initiated. The process is in an advanced stage and would be completed in October 2016.
With the above measures supplemented with the efforts of our human resource team, we expect better results in the coming years, Insha Allah.
Summary of Key operating and financial data of last six financial years
Summary of key operating and financial data of last six years is annexed.
Outstanding statutory payments
All outstanding payments are of nominal and of routine nature.
Retirement Benefit Schemes:
The Company operates a funded provident and gratuity scheme for its employee as referred in Note-6 to the accounts.
Board of Directors
New management took over the control of the Company on January 5, 2016. Following changes were made in the board of directors of the Company during the year.
• Sh. Amar Hameed was appointed as director and chairman of the board of directors in place of outgoing director and chairman, Abdul Razak Dawood.
• Abdul Jalil Jamil, Muhammad Saeed-uz–Zaman, Muhammad Yahya Khan, Muhammad Sajid, Osman Hameed and Zafar Mahmood were appointed as directors of the Company in place of outgoing directors Farooq Nazir, Taimur Dawood, Faisal Dawood Salman Zakria, Syed Zamanat Abbas and Muhammad Saddiq.
• Zafar Mahmood was appointed as Chief Executive Officer of the Company on January 5, 2016 in place of outgoing chief executive officer Aamir Niazi. The statement under section 218 of the Companies Ordinance 1984 is annexed.
New Board comprises of two executives, four non-executives and one independent director.
The board also reconstituted the audit and human resources and remuneration committees as follows in their meeting held on January 5, 2016.
Audit Committee:
1. Muhammad Sajid (Independent) Chairman2. M. Saeed-uz-Zaman (Non Executive) Member3. Osman Hameed (Non Executive) Member
Human Resources and Remuneration Committee:
1. Sh. Amar Hameed (Non Executive) Chairman2. Abdul Jalil Jamil (Non Executive) Member3. Zafar Mahmood (Executive) Member
www.nimir.com.pk
Annual Report 2016
13
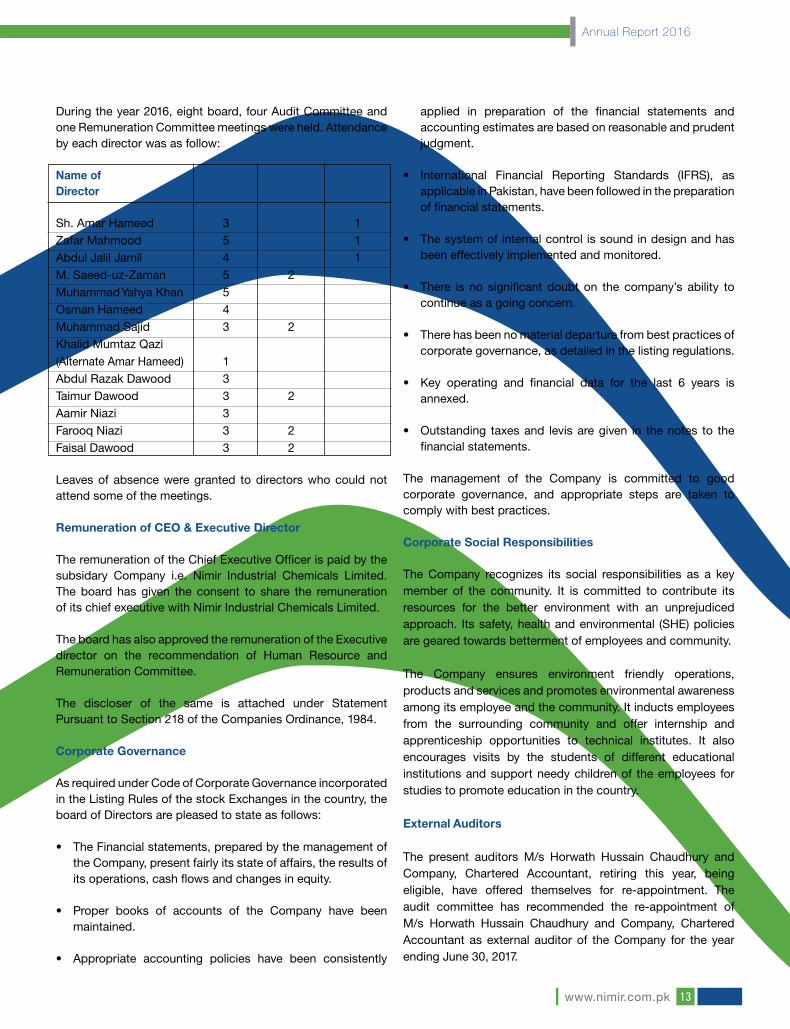
During the year 2016, eight board, four Audit Committee and one Remuneration Committee meetings were held. Attendance by each director was as follow:
Name of Board of Audit HR & RDirector Directors Committee Committee
Sh. Amar Hameed 3 1Zafar Mahmood 5 1Abdul Jalil Jamil 4 1M. Saeed-uz-Zaman 5 2 Muhammad Yahya Khan 5 Osman Hameed 4 Muhammad Sajid 3 2 Khalid Mumtaz Qazi(Alternate Amar Hameed) 1 Abdul Razak Dawood 3 Taimur Dawood 3 2 Aamir Niazi 3 Farooq Niazi 3 2 Faisal Dawood 3 2
Leaves of absence were granted to directors who could not attend some of the meetings.
Remuneration of CEO & Executive Director The remuneration of the Chief Executive Officer is paid by the subsidary Company i.e. Nimir Industrial Chemicals Limited. The board has given the consent to share the remuneration of its chief executive with Nimir Industrial Chemicals Limited.
The board has also approved the remuneration of the Executive director on the recommendation of Human Resource and Remuneration Committee.
The discloser of the same is attached under Statement Pursuant to Section 218 of the Companies Ordinance, 1984.
Corporate Governance
As required under Code of Corporate Governance incorporated in the Listing Rules of the stock Exchanges in the country, the board of Directors are pleased to state as follows:
• The Financial statements, prepared by the management of the Company, present fairly its state of affairs, the results of its operations, cash flows and changes in equity.
• Proper books of accounts of the Company have been maintained.
• Appropriate accounting policies have been consistently
applied in preparation of the financial statements and accounting estimates are based on reasonable and prudent judgment.
• International Financial Reporting Standards (IFRS), as applicable in Pakistan, have been followed in the preparation of financial statements.
• The system of internal control is sound in design and has been effectively implemented and monitored.
• There is no significant doubt on the company’s ability to continue as a going concern.
• There has been no material departure from best practices of corporate governance, as detailed in the listing regulations.
• Key operating and financial data for the last 6 years is annexed.
• Outstanding taxes and levis are given in the notes to the financial statements.
The management of the Company is committed to good corporate governance, and appropriate steps are taken to comply with best practices.
Corporate Social Responsibilities
The Company recognizes its social responsibilities as a key member of the community. It is committed to contribute its resources for the better environment with an unprejudiced approach. Its safety, health and environmental (SHE) policies are geared towards betterment of employees and community.
The Company ensures environment friendly operations, products and services and promotes environmental awareness among its employee and the community. It inducts employees from the surrounding community and offer internship and apprenticeship opportunities to technical institutes. It also encourages visits by the students of different educational institutions and support needy children of the employees for studies to promote education in the country.
External Auditors
The present auditors M/s Horwath Hussain Chaudhury and Company, Chartered Accountant, retiring this year, being eligible, have offered themselves for re-appointment. The audit committee has recommended the re-appointment of M/s Horwath Hussain Chaudhury and Company, Chartered Accountant as external auditor of the Company for the year ending June 30, 2017.

Annual Report 2016
Nimir Resins Limited14
Dividend / Bonus Shares
The Company did not declare dividend or issue bonus shares during the financial year ended June 30, 2016. The cash flow generated from the business mainly used for strengthening the liquidity position of the Company.
Pattern of Shareholding
A pattern of shareholding of the Company is annexed. There was no trading in the shares of the Company by the Directors, Chief Executive, Chief Financial Officer, Company Secretary, Company Executive and their spouses and minor children during the year except those who are mentioned in the annexed statement required under code of Code of Corporate Governance (CCG).
Necessary returns in this respect filed with the regulatory authorities besides informing the Board and the stock exchanges of the said transactions as required under the Code of Corporate Governance.
Acknowledgment
The Board of Directors of the Company highly appreciates the dedication, commitment and hard work extended by its human resource capital and the cooperation extended by the customers, suppliers, bankers and all all other stakeholders in bringing the company back to profit. We are also thankful to our shareholders for reposing their confidence in the management.
For and on behalf of the Board
_____________________Lahore, Zafar MahmoodSeptember 9, 2016 Chief Executive Officer

www.nimir.com.pk
Annual Report 2016
15

Annual Report 2016
Nimir Resins Limited16
1 3
1 5
1 4
2 5
5
4
2 3
1
3
2 3
3
2 3
2 3

www.nimir.com.pk
Annual Report 2016
17
Annual Report 2016
Nimir Resins Limited18
This statement is being presented to comply with the Code of Corporate Governance 2012 (CCG) contained in Regulation No. 5.19.23 of Listing Regulations of the Rule Book of Pakistan Stock Exchange Limited for the purpose of establishing a framework of good governance, whereby a listed Company is managed in compliance with the best practices of corporate governance.
Nimir Resins Limited (the “Company”) has applied the principles contained in the Code of Corporate Governance 2012 in the following manner:
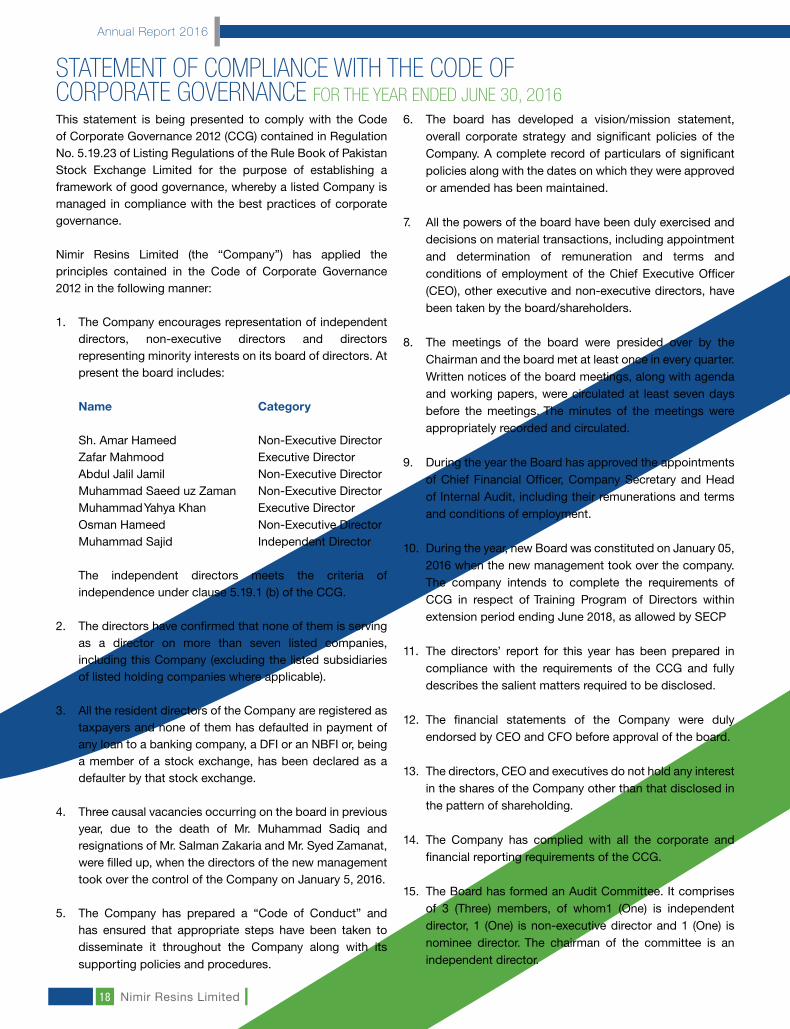
1. The Company encourages representation of independent directors, non-executive directors and directors representing minority interests on its board of directors. At present the board includes:
Name Category Sh. Amar Hameed Non-Executive Director Zafar Mahmood Executive Director Abdul Jalil Jamil Non-Executive Director Muhammad Saeed uz Zaman Non-Executive Director Muhammad Yahya Khan Executive Director Osman Hameed Non-Executive Director Muhammad Sajid Independent Director
The independent directors meets the criteria of independence under clause 5.19.1 (b) of the CCG.
2. The directors have confirmed that none of them is serving as a director on more than seven listed companies, including this Company (excluding the listed subsidiaries of listed holding companies where applicable).
3. All the resident directors of the Company are registered as taxpayers and none of them has defaulted in payment of any loan to a banking company, a DFI or an NBFI or, being a member of a stock exchange, has been declared as a defaulter by that stock exchange.
4. Three causal vacancies occurring on the board in previous year, due to the death of Mr. Muhammad Sadiq and resignations of Mr. Salman Zakaria and Mr. Syed Zamanat, were filled up, when the directors of the new management took over the control of the Company on January 5, 2016.
5. The Company has prepared a “Code of Conduct” and has ensured that appropriate steps have been taken to disseminate it throughout the Company along with its supporting policies and procedures.
6. The board has developed a vision/mission statement, overall corporate strategy and significant policies of the Company. A complete record of particulars of significant policies along with the dates on which they were approved or amended has been maintained.
7. All the powers of the board have been duly exercised and decisions on material transactions, including appointment and determination of remuneration and terms and conditions of employment of the Chief Executive Officer (CEO), other executive and non-executive directors, have been taken by the board/shareholders.
8. The meetings of the board were presided over by the Chairman and the board met at least once in every quarter. Written notices of the board meetings, along with agenda and working papers, were circulated at least seven days before the meetings. The minutes of the meetings were appropriately recorded and circulated.
9. During the year the Board has approved the appointments of Chief Financial Officer, Company Secretary and Head of Internal Audit, including their remunerations and terms and conditions of employment.
10. During the year, new Board was constituted on January 05, 2016 when the new management took over the company. The company intends to complete the requirements of CCG in respect of Training Program of Directors within extension period ending June 2018, as allowed by SECP
11. The directors’ report for this year has been prepared in compliance with the requirements of the CCG and fully describes the salient matters required to be disclosed.
12. The financial statements of the Company were duly endorsed by CEO and CFO before approval of the board.
13. The directors, CEO and executives do not hold any interest in the shares of the Company other than that disclosed in the pattern of shareholding.
14. The Company has complied with all the corporate and financial reporting requirements of the CCG.
15. The Board has formed an Audit Committee. It comprises of 3 (Three) members, of whom1 (One) is independent director, 1 (One) is non-executive director and 1 (One) is nominee director. The chairman of the committee is an independent director.
STATEMENT OF COMPLIANCE WITH THE CODE OFCORPORATE GOVERNANCE FOR THE YEAR ENDED JUNE 30, 2016

www.nimir.com.pk
Annual Report 2016
19
16. The meetings of the audit committee were held at least once every quarter prior to approval of interim and final results of the Company and as required by the CCG. The terms of reference of the committee have been formed and advised to the committee for compliance.
17. The Board has formed a Human Resource and
Remuneration Committee. It comprises of 3 (Three) members, of whom 2 (Two) are non-executive directors and 1 (One) is executive director. The chairman of the committee is a non-executive director.
18. The Board has set up an effective internal audit function, which is considered suitably qualified and experienced for the purpose and are conversant with the policies and procedures of the Company.
19. The statutory auditors of the Company have confirmed that they have been given a satisfactory rating under the quality control review program of the ICAP, that they or any of the partners of the firm, their spouses and minor children do not hold shares of the Company and that the firm and all its partners are in compliance with International Federation of Accountants (IFAC) guidelines on code of ethics as adopted by the ICAP.
20. The statutory auditors or the persons associated with them have not been appointed to provide other services except in accordance with the listing regulations and the auditors have confirmed that they have observed IFAC guidelines in this regard.
21. The “Closed Period”, prior to the announcement of interim/final results, and business decisions, which may materially affect the market price of Company’s securities, was determined and intimated to directors, employees and stock exchange(s).
22. Material/price sensitive information has been disseminated among all market participants at once through stock exchange(s).
23. We confirm that other material principles enshrined in the CCG have been complied.
For Nimir Resins Limited (Formerly Descon Chemicals Limited)
_____________________Lahore Zafar Mahmood September 09, 2016 Chief Executive Officer

Annual Report 2016
Nimir Resins Limited20
We have reviewed the enclosed Statement of Compliance
with the best practices contained in the Code of Corporate
Governance (the “Code”) prepared by the Board of Directors of
Nimir Resins Limited (formerly Descon Chemicals Limited) for
the year ended June 30, 2016 to comply with the requirements
of Listing Regulations of Pakistan Stock Exchange Limited,
where the company is listed.
The responsibility for compliance with the Code is that of the
Board of Directors of the Company. Our responsibility is to
review, to the extent where such compliance can be objectively
verified, whether the Statement of Compliance reflects the
status of the Company’s compliance with the provisions of
the Code and report if it does not and to highlight any non-
compliance with the requirements of the Code. A review is
limited primarily to inquiries of the Company’s personnel and
review of various documents prepared by the Company to
comply with the Code.
As a part of our audit of financial statements we are required to
obtain an understanding of the accounting and internal control
systems sufficient to plan the audit and develop an effective
audit approach. We are not required to consider whether the
Board of Directors’ statement on internal control covers all
risks and controls or to form an opinion on the effectiveness of
such internal controls, the Company’s corporate governance
procedures and risks.
The Code requires the Company to place before the
Audit Committee, and upon recommendation of the Audit
Committee, place before the Board of Directors for their review
and approval its related party transactions distinguishing
between transactions carried out on terms equivalent to those
that prevail in arm’s length transactions and transactions which
are not executed at arm’s length price and recording proper
justification for using such alternate pricing mechanism. We are
only required and have ensured compliance of this requirement
to the extent of the approval of the related party transactions
by the Board of Directors upon recommendation of the
Audit Committee. We have not carried out any procedures
to determine whether the related party transactions were
undertaken at arm’s length price or not.
Based on our review, nothing has come to our attention which
causes us to believe that the Statement of Compliance does
not appropriately reflect the Company’s compliance, in all
material respects, with the best practices contained in the
Code as applicable to the Company for the year ended June
30, 2016.
HORWATH HUSSAIN CHAUDHURY & CO.Chartered Accountants
(Engagement Partner: Amin Ali)
LahoreSeptember 9, 2016
REVIEW REPORT TO THE MEMBERS ON STATEMENTOF COMPLIANCE WITH THE CCG
www.nimir.com.pk
Annual Report 2016
21
We have audited the annexed balance sheet of NIMIR RESINS
LIMITED (formerly Descon Chemicals Limited) as at June 30,
2016 and the related profit and loss account, statement of
comprehensive income, cash flow statement and statement of
changes in equity, together with the notes forming part thereof,
for the year then ended and we state that we have obtained
all the information and explanations which, to the best of our
knowledge and belief, were necessary for the purposes of our
audit.
It is the responsibility of the Company’s management to
establish and maintain a system of internal control, and prepare
and present the above said statements in conformity with the
approved accounting standards and the requirements of the
Companies Ordinance, 1984. Our responsibility is to express
an opinion on these statements based on our audit.
We conducted our audit in accordance with the auditing
standards as applicable in Pakistan. These standards require
that we plan and perform the audit to obtain reasonable
assurance about whether the above said statements are free
of any material misstatement. An audit includes examining, on
a test basis, evidence supporting the amounts and disclosures
in the above said statements. An audit also includes assessing
the accounting policies and significant estimates made by
management, as well as, evaluating the overall presentation of
the above said statements. We believe that our audit provides
a reasonable basis for our opinion and, after due verification,
we report that:
a) in our opinion, proper books of accounts have been kept
by the Company as required by the Companies Ordinance,
1984;
b) in our opinion;
(i) the balance sheet and profit and loss account
together with the notes thereon have been drawn up
in conformity with the Companies Ordinance, 1984,
and are in agreement with the books of account and
are further in accordance with the accounting policies
consistently applied;
(ii) the expenditure incurred during the year was for the
purpose of the Company’s business; and
(iii) the business conducted, investments made and
the expenditure incurred during the year were in
accordance with the objects of the Company;
(c) in our opinion and to the best of our information and
according to the explanations given to us, the balance
sheet, profit and loss account, statement of comprehensive
income, cash flow statement and statement of changes
in equity together with the notes forming part thereof
conform with approved accounting standards as
applicable in Pakistan and give the information required by
the Companies Ordinance, 1984, in the manner so required
and respectively give a true and fair view of the state of the
Company’s affairs as at June 30, 2016 and of the profit,
total comprehensive income, its cash flows and changes
in equity for the year then ended; and
(d) in our opinion, no Zakat was deductible at source under
the Zakat and Ushr Ordinance, 1980 (XVIII of 1980).
HORWATH HUSSAIN CHAUDHURY & CO.Chartered Accountants
(Engagement Partner: Amin Ali)
LahoreSeptember 9, 2016
AUDITORS’ REPORT TO THE MEMBERSFOR THE YEAR ENDED JUNE 30, 2016

Annual Report 2016
Nimir Resins Limited22
Note 2016 2015 Rupees Rupees (Restated) ASSETS Non Current Assets Property, plant and equipment 4 474,446,524 486,101,762 Intangible assets 5 1,658,684 18,482,976 Long term deposits 7,649,956 7,649,956 Retirement benefit asset - prepayments 6 1,384,343 2,438,088 485,139,507 514,672,782
Current Assets Stores and spares 11,111,654 12,623,714 Stock in trade 7 489,991,718 310,962,253 Trade debts 8 404,114,867 321,961,579 Loans and advances 9 219,154,776 115,995,531 Short term prepayments and other receivables 10 12,459,218 10,847,437 Bank balances 11 70,965,604 1,947,185 1,207,797,837 774,337,699 Total Assets 1,692,937,344 1,289,010,481 EQUITY AND LIABILITIES Share Capital and Reserves Authorized share capital 300,000,000 (2015: 230,000,000) Ordinary shares of Rs. 5 each 1,500,000,000 1,150,000,000 Issued, subscribed and paid up share capital 12 997,789,280 997,789,280 Share deposit money 13 283,000,000 – Equity portion of sponsors’ interest free loans 17.3 7,751,322 8,389,442 Reserves 14 (751,332,372) (804,018,820) 537,208,230 202,159,902 Surplus on Revaluation of Property, Plant and Equipment 15 46,940,630 47,149,031 Non Current Liabilities Long term financing from banking companies 16 – 89,666,672 Long term financing from sponsors 17 99,248,678 31,610,558 Deferred tax liability 18 30,701,004 29,161,545 129,949,682 150,438,775 Current Liabilities Trade and other payables 19 179,668,385 287,349,743 Accrued mark up 20 9,806,364 14,485,877 Short term borrowings 21 771,366,069 479,571,170 Current portion of long term financing 16 – 89,666,661 Provision for taxation 22 17,997,984 18,189,322 978,838,802 889,262,773 Contingencies and Commitments 23 – – Total Equity and Liabilities 1,692,937,344 1,289,010,481 The annexed notes form an integral part of these financial statements.
CHIEF EXECUTIVE OFFICER DIRECTOR
BALANCE SHEET AS AT JUNE 30, 2016

www.nimir.com.pk
Annual Report 2016
23
PROFIT AND LOSS ACCOUNTFOR THE YEAR ENDED JUNE 30, 2016 Note 2016 2015 Rupees Rupees Sales 24 1,778,018,742 1,806,427,261Cost of sales 25 (1,542,084,055) (1,651,145,112)
Gross profit 235,934,687 155,282,149
Distribution cost 26 (46,523,528) (62,009,584)Administrative expenses 27 (53,388,218) (54,202,952)Research and development expenses – (593,811) (99,911,746) (116,806,347) Operating profit 136,022,941 38,475,802 Other operating expenses 28 (36,284,159) (19,203,070)Finance cost 29 (49,605,099) (94,645,423)Other income 30 22,744,813 25,633,469 Share of net loss of associate – (12,585,993) Profit / (loss) before taxation 72,878,496 (62,325,215) Taxation 31 (19,796,345) (20,041,701) Net profit / (loss) for the year 53,082,151 (82,366,916) Profit / (loss) per share - Basic and diluted (2015- Restated) 32 0.24 (0.37)
CHIEF EXECUTIVE OFFICER DIRECTOR

Annual Report 2016
Nimir Resins Limited24
STATEMENT OF COMPREHENSIVE INCOMEFOR THE YEAR ENDED JUNE 30, 2016 Note 2016 2015 Rupees Rupees Profit / (loss) for the year 53,082,151 (82,366,916)
Other comprehensive income Items that will not be re-classified subsequently to the profit or loss Remeasurement of retirement benefits (liability) / asset (863,006) 542,480 Less: related tax impact 258,902 (162,744) Items that may be re-classified subsequently to the profit or loss Unrealized (loss) / gain on available for sale investment – (76,000) Fair value reserve transferred to profit and loss account on disposal of investments classified as ‘available for sale’ – (181,438) Other comprehensive (loss) / income for the year (604,104) 122,298 Total comprehensive income / (loss) for the year 52,478,047 (82,244,618) The annexed notes form an integral part of these financial statements.
CHIEF EXECUTIVE OFFICER DIRECTOR
www.nimir.com.pk
Annual Report 2016
25
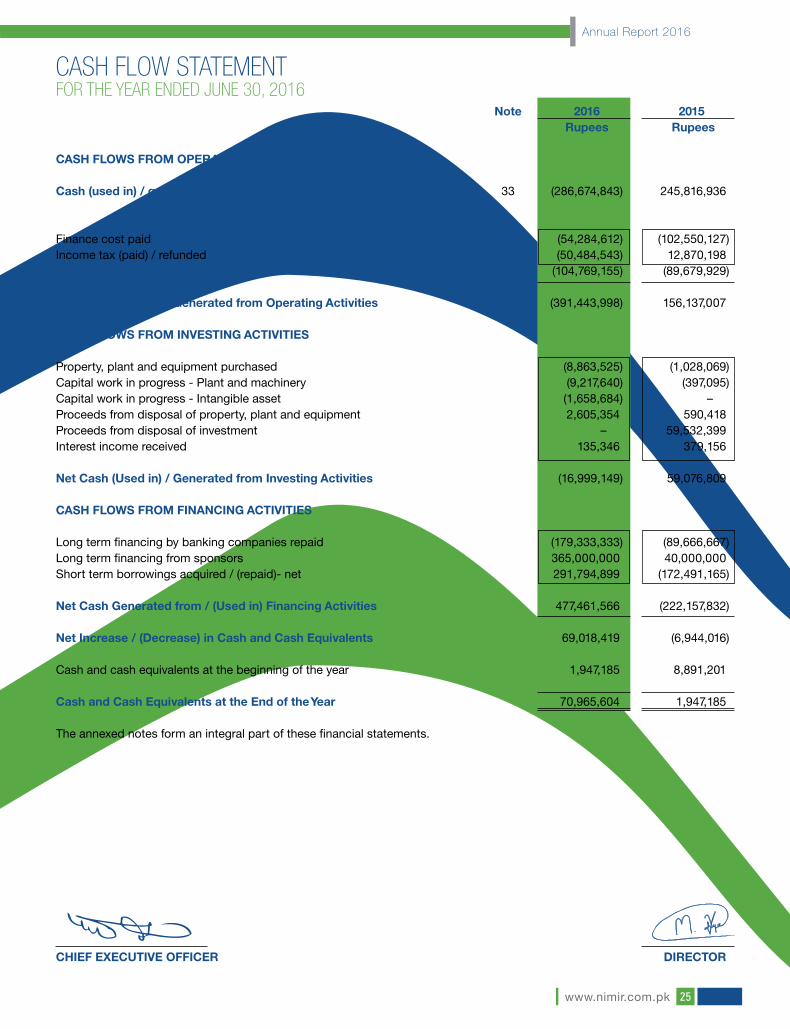
CASH FLOW STATEMENTFOR THE YEAR ENDED JUNE 30, 2016 Note 2016 2015 Rupees Rupees CASH FLOWS FROM OPERATING ACTIVITIES Cash (used in) / generated from operations 33 (286,674,843) 245,816,936 Finance cost paid (54,284,612) (102,550,127)Income tax (paid) / refunded (50,484,543) 12,870,198 (104,769,155) (89,679,929) Net Cash (Used in) / Generated from Operating Activities (391,443,998) 156,137,007 CASH FLOWS FROM INVESTING ACTIVITIES Property, plant and equipment purchased (8,863,525) (1,028,069)Capital work in progress - Plant and machinery (9,217,640) (397,095)Capital work in progress - Intangible asset (1,658,684) – Proceeds from disposal of property, plant and equipment 2,605,354 590,418 Proceeds from disposal of investment – 59,532,399 Interest income received 135,346 379,156 Net Cash (Used in) / Generated from Investing Activities (16,999,149) 59,076,809 CASH FLOWS FROM FINANCING ACTIVITIES Long term financing by banking companies repaid (179,333,333) (89,666,667)Long term financing from sponsors 365,000,000 40,000,000 Short term borrowings acquired / (repaid)- net 291,794,899 (172,491,165) Net Cash Generated from / (Used in) Financing Activities 477,461,566 (222,157,832) Net Increase / (Decrease) in Cash and Cash Equivalents 69,018,419 (6,944,016) Cash and cash equivalents at the beginning of the year 1,947,185 8,891,201 Cash and Cash Equivalents at the End of the Year 70,965,604 1,947,185 The annexed notes form an integral part of these financial statements.
CHIEF EXECUTIVE OFFICER DIRECTOR

Annual Report 2016
Nimir Resins Limited26
Reserves Share Share Equity Particulars Capital deposit Portion of Share Fair Value Revaluation Accumulated Total money Sponsors’ Premium Reserve Reserve Loss Loan Reserve Rupees
Balance as at June 30, 2014 997,789,280 – – 1,281,303 257,438 717,676 (724,241,257) 275,804,440 Net loss for the year – – – – – – (82,366,916) (82,366,916) Other comprehensive income for the year – – – – (257,438) – 379,736 122,298 Total comprehensive loss for the year – – – – (257,438) – (81,987,180) (82,244,618) Incremental depreciation for the year on surplus on revaluation of property, plant and equipment - net of deferred tax – – – – – 210,638 – 210,638 Transactions with owners of the Company Equity portion of sponsors’ loan – – 8,389,442 – – – – 8,389,442 Balance as at June 30, 2015 (as restated) 997,789,280 – 8,389,442 1,281,303 – 928,314 (806,228,437) 202,159,902 Balance as at June 30, 2015 (as previously reported) 997,789,280 – – 1,281,303 – 928,314 (806,228,437) 193,770,460 Equity portion of sponsors’ loan – – 8,389,442 – – – – 8,389,442 Balance as at June 30, 2015 (as restated) 997,789,280 – 8,389,442 1,281,303 – 928,314 (806,228,437) 202,159,902 Balance as at June 30, 2015 (as restated) 997,789,280 – 8,389,442 1,281,303 – 928,314 (806,228,437) 202,159,902 Net profit for the year – – – – – – 53,082,151 53,082,151 Other comprehensive loss for the year – – – – – – (604,104) (604,104)
Total comprehensive income for the year – – – – – – 52,478,047 52,478,047
Incremental depreciation for the year on surplus on revaluation of property, plant and equipment - net of deferred tax – – – – – 208,401 – 208,401 Transactions with owners of the Company
Reinstatement adjustment (refer Note 17.2) – – (8,389,442) – – – – (8,389,442) Equity portion of sponsors’ loan – – 7,751,322 – – – – 7,751,322 – Share deposit money – 283,000,000 – – – – – 283,000,000
– 283,000,000 (638,120) – – – – 282,361,880 Balance as at June 30, 2016 997,789,280 283,000,000 7,751,322 1,281,303 – 1,136,715 (753,750,390) 537,208,230 The annexed notes form an integral part of these financial statements.
CHIEF EXECUTIVE OFFICER DIRECTOR
STATEMENT OF CHANGES IN EQUITYFOR THE YEAR ENDED JUNE 30, 2016
www.nimir.com.pk
Annual Report 2016
27
1. The Company and its Operations 1.1 Nimir Resins Limited (the “Company”) (Formerly Descon Chemicals Limited) was initially incorporated in Pakistan on
December 17, 1964 as a private limited company under the Companies Act, 1913 (now the Companies Ordinance, 1984) and was converted into public limited company on August 19, 1991 with the name of Nimir Resins Limited. The name of the Company was changed to Descon Chemicals Limited on April 01, 2010 when the Company entered into a scheme of arrangement for merger / amalgamation with Descon Chemicals (Private) Limited.
1.2 During the half year ending on December 31, 2015, sponsoring directors of Descon Chemicals Limited and their related persons disposed off 69.48% shareholding in the Company. Consequently, all the directors resigned and new directors were elected on January 05, 2016. The new management changed the name of the Company to Nimir Resins Limited as per the approval of Securities and Exchange Commission of Pakistan dated April 18, 2016.
1.3 The shares of the Company are quoted on Pakistan Stock Exchange Limited. The registered office of the Company is situated at 14.5 KM, Lahore-Sheikhupura Road, Lahore. The principal activity of the Company is to manufacture surface coating resins, polyesters for paint industry, optical brightener and textile auxiliaries for textile industry.
2. Basis of Preparation 2.1 Statement of compliance
These financial statements have been prepared in accordance with approved accounting standards as applicable
in Pakistan. Approved accounting standards comprise of such International Financial Reporting Standards (IFRS) issued by the International Accounting Standards Board as are notified under the Companies Ordinance, 1984, provisions of and directives issued under the Companies Ordinance, 1984. In case requirements differ, the provisions or directives of the Companies Ordinance, 1984 shall prevail.
2.2 Basis of measurement
These financial statements have been prepared under the historical cost convention except to the extent of following:
Certain property, plant and equipment Note 4 Revalued / Fair value Employee retirement benefits (Gratuity) Note 6 Present value
2.3 Functional and presentation currency These financial statements are prepared and presented in Pak Rupees which is the Company’s functional and presentation currency. All the figures have been rounded off to the nearest rupee, unless otherwise stated.
2.4 Use of estimates and judgements
The preparation of financial statements in conformity with IFRSs requires management to make judgments, estimates and assumptions that affect the application of policies and reported amounts of assets, liabilities, income and expenses. These estimates and related assumptions are based on historical experience and various other factors that are believed to be reasonable under the circumstances.
These estimates and related assumptions are reviewed on an on going basis. Accounting estimates are revised in the period in which such revisions are made. Significant management estimates in these financial statements relate to the useful life and residual values of property, plant and equipment, provisions for doubtful receivables, provisions for defined benefit plans, slow moving and obsolete inventory and taxation. However, the management believes that the change in outcome of estimates would not have a material effect on the amounts disclosed in these financial statements.
2.5 Changes in accounting standards, interpretations and pronouncements
NOTES TO AND FORMING PART OF THE FINANCIAL STATEMENTSFOR THE YEAR ENDED JUNE 30, 2016

Annual Report 2016
Nimir Resins Limited28
2.5.1 Standards, interpretations and amendments to approved accounting standards which became effective during the year
The following amendments to standards are relevant that became effective during the year. These amendments are not likely to have any impact on the Company’s financial statements.
Amendments to IFRS 13 ‘Fair Value Measurement’ (effective for annual periods beginning on or after January 1, 2015) aim to improve consistency and reduce complexity by providing a precise definition of fair value. The requirements do not extend the use of fair value accounting but provide guidance on how it should be applied where its use is already required or permitted by other standards within IFRSs. The adoption of this standard is not likely to have an impact on the Company’s financial statements.
2.5.2 Standards, interpretations and amendments to approved accounting standards which became effective during the year but are not relevant There were certain amendments to the approved accounting standards which became effective during the year but are considered not to be relevant or have any significant effect on the Company’s operations and are, therefore, not disclosed in these financial statements.
2.5.3 Standards, interpretations and amendments to approved accounting standards that are relevant but not yet effective
IFRS 16 ‘Leases’ (effective for annual periods beginning on or after 1 January 2019) is introduced during the year that aims to set out the principles for recognition, measurement, presentation and disclosure of leases. It introduces a single lessee accounting model and requires a lessee to recognize assets and liabilities for all the leases with a term of more than 12 months, unless the underlying asset is of low value. A lessee is required to recognize a right-of-use asset representing its right to use the underlying leased asset and a lease liability representing its obligation to make the lease payments. IFRS 16 substantially carries forward the lessor accounting requirements of IAS 17 Leases. Accordingly, a lessor continues to classify its leases as operating leases or finance leases, and to account for those two types of leases differently. IFRS 16 replaces IAS 17 Leases, IFRIC 4 Determining whether an arrangement contains a lease , SIC-15 Operating Leases-Incentives and SIC-27 Evaluating the Substance of Transactions Involving the Legal Form of a Lease.
2.5.4 Standards, interpretations and amendments to approved accounting standards that are neither relevant and nor yet effective There were no new standards or amendments to existing standards and interpretations that are neither relevant nor yet effective.
3. Significant Accounting Policies
The significant accounting policies adopted in the preparation of these financial statements are set out below. These policies have been consistently applied, unless stated otherwise. 3.1 Property, plant and equipment
Owned
Property, plant and equipment are stated at cost / revalued amounts less accumulated depreciation and identified impairment losses, if any, except freehold land which is stated at revalued amount. Cost of property, plant and equipment consists of historical cost, borrowing cost pertaining to the construction and erection period and directly attributable cost of bringing assets to their working condition.
Depreciation is charged to income on reducing balance method except vehicles that are depreciated using straight line method at the rates specified in Note 4. Full month’s depreciation is charged on additions during the month, whereas no depreciation is charged on assets disposed off during the month. Where an impairment loss

www.nimir.com.pk
Annual Report 2016
29
is recognized, the depreciation charge is adjusted in future periods to allocate the asset’s revised carrying amount over its estimated useful life. Freehold land and buildings on freehold land are revalued every three years. Latest revaluation of land and buildings was carried out by an independent valuer as at June 30, 2014. Depreciation method, residual value and useful lives of assets are reviewed at least at each balance sheet date and adjusted if impact on depreciation is significant.
The Company assesses at each balance sheet date whether there is any indication that property, plant and equipment is impaired. If such indication exists, the carrying amounts of such assets are reviewed to assess whether they are recorded in excess of their recoverable amount. Where carrying amounts exceed the respective recoverable amount, assets are written down to their recoverable amounts and the resulting impairment loss is recognized in the profit and loss account. The recoverable amount is the higher of an asset’s fair value less cost to sell and value in use. Where an impairment loss is recognized, the depreciation charge is adjusted in future periods to allocate the asset’s revised carrying amount over its estimated useful life. Maintenance and normal repairs are charged to income as and when incurred. Major renewals and replacements are capitalized. Gains or losses on disposal of property, plant and equipment are included in the current year’s income. Capital work-in-progress Capital work-in-progress is stated at cost less any identified impairment loss.
3.2 Intangible asset An intangible asset is recognized as an asset if it is probable that future economic benefits attributable to the asset will flow to the Company and the cost of such asset can be measured reliably. Cost of intangible assets i.e. ERP software includes purchase cost and directly attributable expenses incidental to bring the software to its intended use. Costs that are directly associated with identifiable software and have probable economic benefits beyond one year, are recognized as an intangible asset. However, costs associated with the maintenance of software are recognized as an expense. All intangibles are measured initially at cost and subsequently stated at cost less accumulated amortization and identified impairment losses, if any. Amortization is charged to income using the straight line method so as to write off the cost of an asset over its estimated useful life. The amortization period and the amortization method for an intangible asset are reviewed, at each balance sheet date, and adjusted if impact on amortization is significant. ERP software is being amortized over 10 years based on estimated useful life.
At each balance sheet date, the management reviews the functionality and legal permissions issues relating to the ERP software. Adjustments to the carrying value are incorporated as may be required under the circumstances.
3.3 Investment in associate
`An enterprise is considered to be the associate of the Company in which the Company has ownership of not less than 20% and not more than 50% of the voting power and / or has significant influence but not control. Investments in associates are accounted for using the equity method. The equity method is applied from the date when the significant influence is established until the date when that significant influence ceases.
3.4 Stores and spares These are valued at lower of moving average cost and net realizable value; whilst items considered obsolete are carried at nil value. Cost of items in transit comprises invoice value plus incidental charges paid thereon.
3.5 Stock in trade These are valued at lower of cost and net realizable value. Cost is determined as follows:

Annual Report 2016
Nimir Resins Limited30
Raw and packing materials - Moving average cost Materials in transit - Invoice value plus incidental charges Work in process - Estimated manufacturing cost Finished goods - Average manufacturing cost Wastes - Net realizable value
Manufacturing cost in relation to work in process and finished goods comprises cost of material, labor and appropriate manufacturing overheads. Net realizable value signifies estimated selling price in the ordinary course of business less necessary cost to make the sale.
3.6 Trade debts Trade debts are recognized at fair value less provision for impairment. A provision for impairment of trade debts and other receivables is established when there is objective evidence that the Company will not be able to collect all amounts due according to the original terms of the receivable. Significant financial difficulties of the debtor, probability that the debtor will enter bankruptcy or financial re-organization, and default or delinquency in payments are considered indicators that the trade receivable has been impaired. Debts, considered irrecoverable, are written off, as and when identified.
3.7 Cash and cash equivalents Cash and cash equivalents are carried at cost. For the purpose of cash flow statement, cash and cash equivalents comprise cash in hand and cash at banks in current and saving accounts.
3.8 Provisions A provision is recognized in the balance sheet when the Company has a legal or constructive obligation as a result of a past event and it is probable that an outflow of economic benefits will be required to settle the obligation and a reliable estimate of the amount can be made. Provisions are reviewed at each balance sheet date and adjusted to reflect the current best estimate.
3.9 Staff retirement benefits Defined benefits plan The Company operates a funded gratuity scheme for employees whose period of service is seven years or more. Under this scheme, gratuity is paid to retiring employees on the basis of their last drawn basic salary for each completed year of service by applying the following factor: Service period in the Company Factor
Less then 7 years Nil
7 years or more but less than 10 years 50% 10 years or more but less than 15 years 60% 15 years or more but less than 20 years 72% 20 years or more but less then 25 years 85% 25 years or more (Maximum of 25 basic salaries) 100%
A recognized fund for gratuity scheme of employees was established during the year 2012 and related liabilities and assets were transferred to that fund.
Actuarial gains / (losses) arising from experience adjustments and changes in actuarial assumptions for the defined
benefits plan are charged or credited to other comprehensive income in the period in which they arise. Past service costs are recognized immediately in the profit and loss account. Defined contribution plan The Company operates an approved provident fund scheme for all its permanent employees. The Company and employees make equal monthly contributions to the fund at the rate of 10% of basic salary.
www.nimir.com.pk
Annual Report 2016
31
3.10 Taxation Income tax on the profit or loss for the year comprises current and deferred tax. Income tax expense is recognized in the profit and loss account except to the extent that relates to items recognized directly in equity, in which case it is recognized in equity. Current The charge for current tax is based on taxable income for the year determined in accordance with the prevailing laws of taxation. All tax credits and tax rebates are taken into account in calculating this charge. However, in case of loss for the year, income tax expense is recognized as minimum tax liability on turnover of the Company in accordance with the provisions of the Income Tax Law. Deferred
Deferred tax is recognized using the balance sheet liability method on all temporary differences between the carrying amount of assets and liabilities and their tax bases. Deferred tax liabilities are recognized for all major taxable temporary differences. Deferred tax assets are recognized for all major deductible temporary differences to the extent that it is probable that taxable profit will be available against which deductible temporary differences can be utilized. Carrying amount of the deferred tax asset is reviewed at each balance sheet date and is recognized only to the extent that it is probable that future taxable profits will be available against which assets may be utilized. Deferred tax assets are reduced to the extent that it is no longer probable that the related tax benefit will be realized. Unrecognized deferred tax assets are reassessed at each balance sheet date and are recognized to the extent of probable future taxable profit available that will allow deferred tax asset to be recovered. Deferred tax assets and liabilities are measured at the tax rate that are expected to apply to the year when the asset is utilized or the liability is settled, based on the tax rates that have been enacted or substantially enacted at the balance sheet date.
3.11 Trade and other payables Liabilities for trade and other amounts payable are carried at cost which is the fair value of the consideration to be paid or given in future for goods and services received or to be delivered or for any other amount, whether or not billed to the Company.
3.12 Contingent liabilities
Contingent liability is disclosed when there is a possible obligation that arises from past events and whose existence is confirmed only by the occurrence or non-occurrence of one or more uncertain future events not wholly within the control of the Company.
A contingent liability is also disclosed when there is a present obligation that arises from past events but it is not probable that an outflow of resources embodying economic benefits would be required to settle the obligation or the amount of the obligation cannot be measured with sufficient reliability.
3.13 Borrowing cost
Borrowing costs are charged to income as and when incurred except costs directly attributable to acquisition, construction or production of qualifying assets that are capitalized as part of the cost of assets.
3.14 Foreign currency transactions
Transactions denominated in foreign currencies are initially recorded at Pak Rupees by applying the foreign exchange rate ruling on the date of transaction. All monetary assets and liabilities in foreign currencies are translated into Pak Rupees at exchange rate prevailing at the balance sheet date. Exchange differences are included in income currently.
Annual Report 2016
Nimir Resins Limited32
3.15 Revenue recognition
- Local sales are recorded on dispatch of goods to customers. - Export sales are recorded on the receipt of bills of lading. - Profit on bank deposits is recognized on a time proportion basis that takes into account the effective yield on deposits.
3.16 Related party transactions
Transactions in relation to sales, purchases and services with related parties are made at arm’s length prices
determined in accordance with the Company’s policy except for the allocation of expenses such as utilities, rental and common overheads shared with related parties, which are on actual basis.
3.17 Financial instruments
3.17.1 Financial assets
The classification depends on the purpose for which the financial assets were acquired. The management determines the classification of its financial assets at the time of initial recognition. The Company classifies its financial assets in the following categories:
At fair value through profit or loss
Financial assets at fair value through profit or loss are financial assets held for trading and financial assets designated upon initial recognition as at fair value through profit or loss. A financial asset is classified as held for trading if acquired principally for the purpose of selling in the short term. Assets in this category are classified as current assets.
Loans and receivables
Loans and receivables are non-derivative financial assets with fixed or determinable payments that are not quoted in an active market. These are included in current assets, except for maturities greater than twelve months after the balance sheet date, which are classified as non-current assets. Loans and receivables comprise loans, deposits and other receivables in the balance sheet.
Held to maturity Held to maturity are financial assets with fixed or determinable payments and fixed maturity, management has the intention and ability to hold till maturity are carried at amortized cost.
Available-for-sale
Available-for-sale financial assets are non-derivatives that are either designated in this category or not classified in any of the other categories. These are included in non-current assets unless the management intends to dispose off the investments within twelve months from the balance sheet date, in which case these financial assets are classified as short term investments in the balance sheet.
When securities classified as available-for-sale are sold or impaired, the accumulated fair value adjustments
recognized directly in equity are included in the profit and loss account as gains / losses from investment securities. Interest on available-for-sale securities calculated using the effective interest method is recognized in the profit and loss account. Dividends on available-for sale equity instruments are recognized in the profit and loss account when the Company’s right to receive payments is established.
Measurement criteria
All financial assets are recognized at the time when the Company becomes a party to the contractual provisions of the instrument. Regular purchases and sales of investments are recognized at trade date that is the date on which the Company commits to purchase or sell the asset.
www.nimir.com.pk
Annual Report 2016
33
Financial assets are initially recognized at fair value plus transaction costs for all financial assets not carried at fair value through profit or loss. Financial assets carried at fair value through profit or loss are initially recognized at fair value and their transaction costs are expensed in the profit and loss account. Available-for-sale financial assets and financial assets at fair value through profit or loss are subsequently carried at fair value. ‘Loans and receivables’ and ‘held to maturity’ investments are carried at amortized cost using the effective interest rate method. Fair values of quoted investments are based on current prices. If the market for a financial asset is not active (for unlisted securities), the Company measures the investments at cost less impairment in value, if any. Financial assets are derecognized when the rights to receive cash flows from the assets have expired or have been transferred and the Company has transferred substantially all risks and rewards of ownership. The Company assesses at each balance sheet date whether there is objective evidence that a financial asset or group of financial assets is impaired.
3.17.2 Financial liabilities All financial liabilities are recognized at the time when the Company becomes a party to the contractual provisions of the instrument. Financial liabilities, other than those at fair value through profit or loss, are measured at amortized cost using the effective yield method.
A financial liability is derecognized when the obligation under the liability is discharged, cancelled or expired. Where an existing financial liability is replaced by another from the same lender on substantially different terms, or the terms of an existing liability are substantially modified, such an exchange and modification is treated as a derecognition of the original liability and the recognition of a new liability. The difference in respective carrying amounts is recognized in the profit and loss account.
3.17.3 Off-setting of financial assets and financial liabilities
A financial asset and a financial liability is offset and the net amount is reported in the financial statements if the Company has a legally enforceable right to set-off the transaction and also intends either to settle on a net basis or to realize the asset and settle the liability simultaneously.
3.18 Impairment Carrying amounts of the Company’s assets are reviewed at each balance sheet date to determine whether there is any indication of impairment. If any such indication exists, the asset’s recoverable amount is estimated in order to determine the extent of the impairment loss, if any. The recoverable amount is the higher of fair value less costs to sell and value in use. In the absence of any information about the fair value, the recoverable amount is determined to be the value in use. Impairment losses are recognized as expense in the profit and loss account.
3.19 Segment reporting
Operating segments are reported in a manner consistent with the internal reporting provided to the Chief Operating Decision Maker (the Chief Executive Officer of the Company). Segment results, assets and liabilities include items directly attributable to a segment. Segment capital expenditure is the total cost incurred during the year to acquire property, plant and equipment and intangible assets.
3.20 Dividend
Dividends are recognized as a liability in the period in which these are declared.
Annual Report 2016
Nimir Resins Limited34
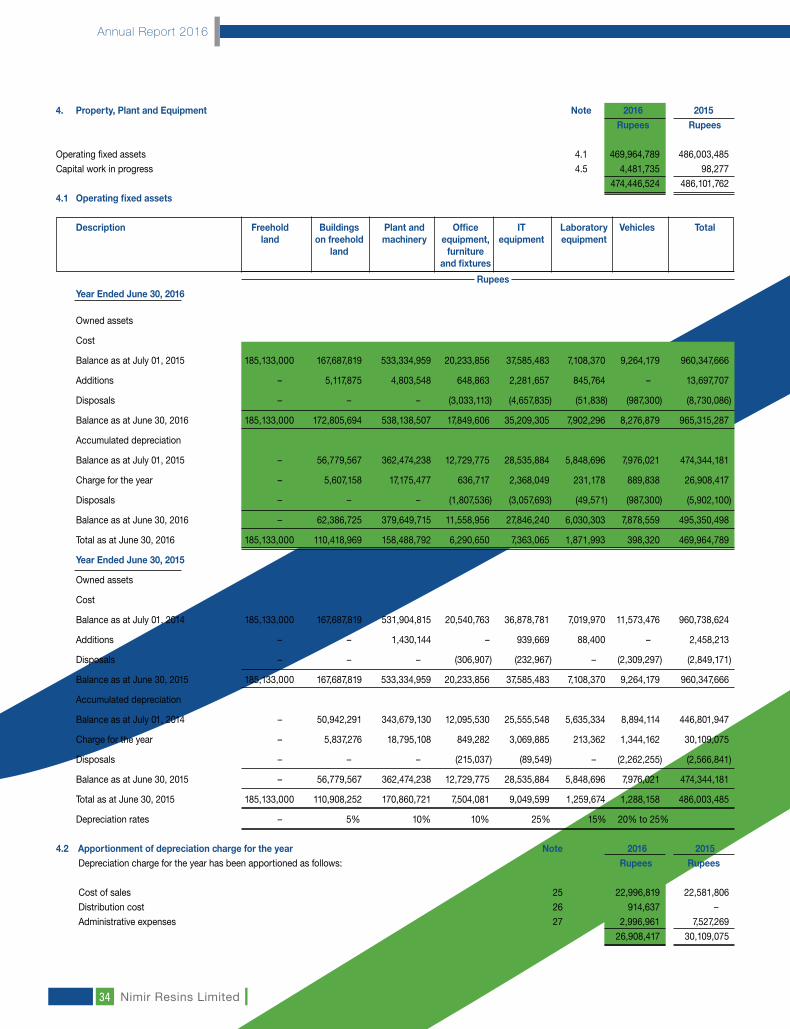
4. Property, Plant and Equipment Note 2016 2015 Rupees Rupees Operating fixed assets 4.1 469,964,789 486,003,485 Capital work in progress 4.5 4,481,735 98,277 474,446,524 486,101,762 4.1 Operating fixed assets Description Freehold Buildings Plant and Office IT Laboratory Vehicles Total land on freehold machinery equipment, equipment equipment land furniture and fixtures
Rupees Year Ended June 30, 2016 Owned assets
Cost
Balance as at July 01, 2015 185,133,000 167,687,819 533,334,959 20,233,856 37,585,483 7,108,370 9,264,179 960,347,666
Additions – 5,117,875 4,803,548 648,863 2,281,657 845,764 – 13,697,707
Disposals – – – (3,033,113) (4,657,835) (51,838) (987,300) (8,730,086)
Balance as at June 30, 2016 185,133,000 172,805,694 538,138,507 17,849,606 35,209,305 7,902,296 8,276,879 965,315,287
Accumulated depreciation
Balance as at July 01, 2015 – 56,779,567 362,474,238 12,729,775 28,535,884 5,848,696 7,976,021 474,344,181
Charge for the year – 5,607,158 17,175,477 636,717 2,368,049 231,178 889,838 26,908,417
Disposals – – – (1,807,536) (3,057,693) (49,571) (987,300) (5,902,100)
Balance as at June 30, 2016 – 62,386,725 379,649,715 11,558,956 27,846,240 6,030,303 7,878,559 495,350,498
Total as at June 30, 2016 185,133,000 110,418,969 158,488,792 6,290,650 7,363,065 1,871,993 398,320 469,964,789
Year Ended June 30, 2015
Owned assets
Cost
Balance as at July 01, 2014 185,133,000 167,687,819 531,904,815 20,540,763 36,878,781 7,019,970 11,573,476 960,738,624
Additions – – 1,430,144 – 939,669 88,400 – 2,458,213
Disposals – – – (306,907) (232,967) – (2,309,297) (2,849,171)
Balance as at June 30, 2015 185,133,000 167,687,819 533,334,959 20,233,856 37,585,483 7,108,370 9,264,179 960,347,666
Accumulated depreciation
Balance as at July 01, 2014 – 50,942,291 343,679,130 12,095,530 25,555,548 5,635,334 8,894,114 446,801,947
Charge for the year – 5,837,276 18,795,108 849,282 3,069,885 213,362 1,344,162 30,109,075
Disposals – – – (215,037) (89,549) – (2,262,255) (2,566,841)
Balance as at June 30, 2015 – 56,779,567 362,474,238 12,729,775 28,535,884 5,848,696 7,976,021 474,344,181
Total as at June 30, 2015 185,133,000 110,908,252 170,860,721 7,504,081 9,049,599 1,259,674 1,288,158 486,003,485
Depreciation rates – 5% 10% 10% 25% 15% 20% to 25%
4.2 Apportionment of depreciation charge for the year Note 2016 2015 Depreciation charge for the year has been apportioned as follows: Rupees Rupees Cost of sales 25 22,996,819 22,581,806 Distribution cost 26 914,637 – Administrative expenses 27 2,996,961 7,527,269 26,908,417 30,109,075
www.nimir.com.pk
Annual Report 2016
35
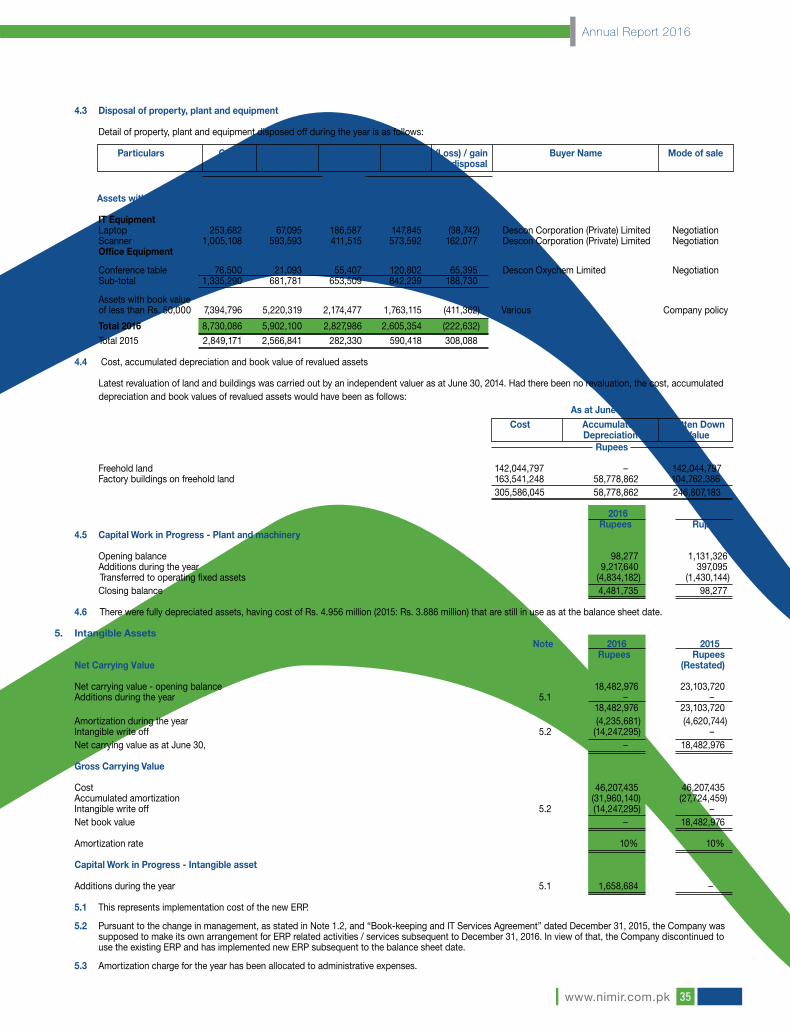
4.3 Disposal of property, plant and equipment Detail of property, plant and equipment disposed off during the year is as follows: Particulars Cost Accumulated Written Sale (Loss) / gain Buyer Name Mode of sale depreciation down value proceeds on disposal Rupees
Assets with book value exceeding Rs. 50,000 IT Equipment Laptop 253,682 67,095 186,587 147,845 (38,742) Descon Corporation (Private) Limited Negotiation Scanner 1,005,108 593,593 411,515 573,592 162,077 Descon Corporation (Private) Limited Negotiation Office Equipment Conference table 76,500 21,093 55,407 120,802 65,395 Descon Oxychem Limited Negotiation Sub-total 1,335,290 681,781 653,509 842,239 188,730 Assets with book value of less than Rs. 50,000 7,394,796 5,220,319 2,174,477 1,763,115 (411,362) Various Company policy
Total 2016 8,730,086 5,902,100 2,827,986 2,605,354 (222,632) Total 2015 2,849,171 2,566,841 282,330 590,418 308,088 4.4 Cost, accumulated depreciation and book value of revalued assets Latest revaluation of land and buildings was carried out by an independent valuer as at June 30, 2014. Had there been no revaluation, the cost, accumulated depreciation and book values of revalued assets would have been as follows: As at June 30, 2016 Cost Accumulated Written Down Depreciation Value Rupees Freehold land 142,044,797 – 142,044,797 Factory buildings on freehold land 163,541,248 58,778,862 104,762,386 305,586,045 58,778,862 246,807,183 2016 2015 Rupees Rupees 4.5 Capital Work in Progress - Plant and machinery Opening balance 98,277 1,131,326 Additions during the year 9,217,640 397,095 Transferred to operating fixed assets (4,834,182) (1,430,144) Closing balance 4,481,735 98,277 4.6 There were fully depreciated assets, having cost of Rs. 4.956 million (2015: Rs. 3.886 million) that are still in use as at the balance sheet date. 5. Intangible Assets Note 2016 2015 Rupees Rupees Net Carrying Value (Restated) Net carrying value - opening balance 18,482,976 23,103,720 Additions during the year 5.1 – – 18,482,976 23,103,720 Amortization during the year (4,235,681) (4,620,744) Intangible write off 5.2 (14,247,295) – Net carrying value as at June 30, – 18,482,976 Gross Carrying Value Cost 46,207,435 46,207,435 Accumulated amortization (31,960,140) (27,724,459) Intangible write off 5.2 (14,247,295) – Net book value – 18,482,976 Amortization rate 10% 10% Capital Work in Progress - Intangible asset Additions during the year 5.1 1,658,684 – 5.1 This represents implementation cost of the new ERP. 5.2 Pursuant to the change in management, as stated in Note 1.2, and “Book-keeping and IT Services Agreement” dated December 31, 2015, the Company was supposed to make its own arrangement for ERP related activities / services subsequent to December 31, 2016. In view of that, the Company discontinued to use the existing ERP and has implemented new ERP subsequent to the balance sheet date.
5.3 Amortization charge for the year has been allocated to administrative expenses.
Annual Report 2016
Nimir Resins Limited36
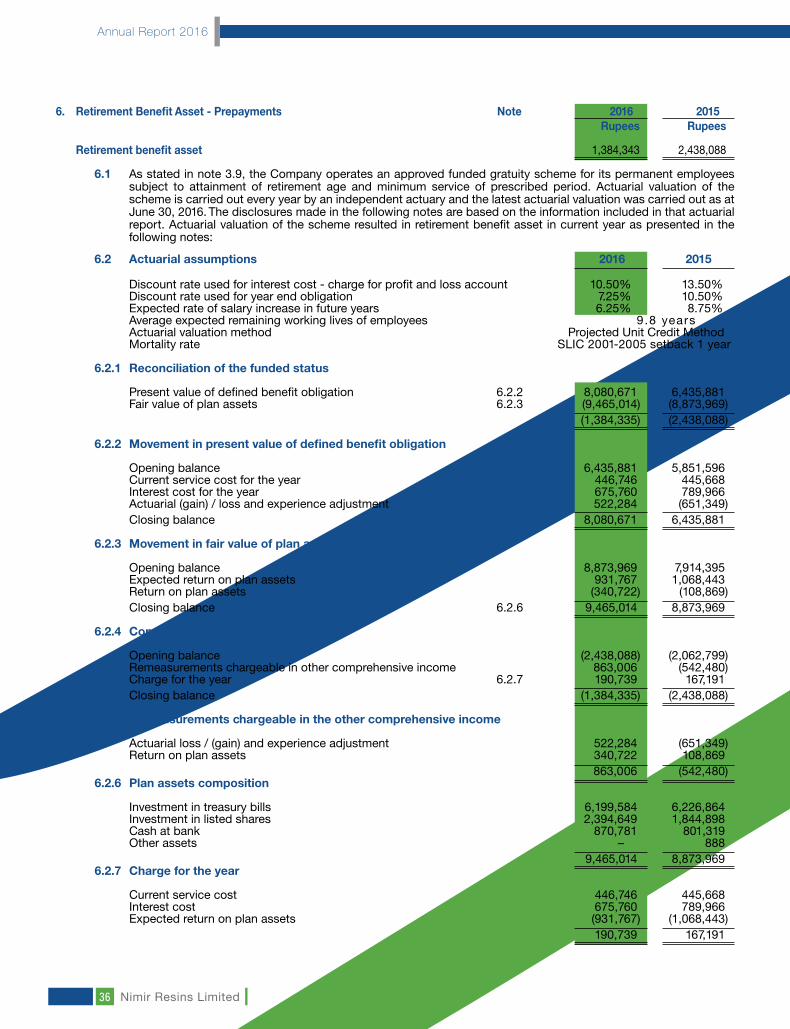
6. Retirement Benefit Asset - Prepayments Note 2016 2015 Rupees Rupees Retirement benefit asset 1,384,343 2,438,088
6.1 As stated in note 3.9, the Company operates an approved funded gratuity scheme for its permanent employees
subject to attainment of retirement age and minimum service of prescribed period. Actuarial valuation of the scheme is carried out every year by an independent actuary and the latest actuarial valuation was carried out as at June 30, 2016. The disclosures made in the following notes are based on the information included in that actuarial report. Actuarial valuation of the scheme resulted in retirement benefit asset in current year as presented in the following notes:
6.2 Actuarial assumptions 2016 2015
Discount rate used for interest cost - charge for profit and loss account 10.50% 13.50% Discount rate used for year end obligation 7.25% 10.50% Expected rate of salary increase in future years 6.25% 8.75% Average expected remaining working lives of employees 9 .8 years
Actuarial valuation method Projected Unit Credit Method Mortality rate SLIC 2001-2005 setback 1 year
6.2.1 Reconciliation of the funded status Present value of defined benefit obligation 6.2.2 8,080,671 6,435,881
Fair value of plan assets 6.2.3 (9,465,014) (8,873,969) (1,384,335) (2,438,088) 6.2.2 Movement in present value of defined benefit obligation
Opening balance 6,435,881 5,851,596
Current service cost for the year 446,746 445,668 Interest cost for the year 675,760 789,966 Actuarial (gain) / loss and experience adjustment 522,284 (651,349) Closing balance 8,080,671 6,435,881 6.2.3 Movement in fair value of plan assets
Opening balance 8,873,969 7,914,395
Expected return on plan assets 931,767 1,068,443 Return on plan assets (340,722) (108,869) Closing balance 6.2.6 9,465,014 8,873,969 6.2.4 Company’s asset
Opening balance (2,438,088) (2,062,799)
Remeasurements chargeable in other comprehensive income 863,006 (542,480) Charge for the year 6.2.7 190,739 167,191 Closing balance (1,384,335) (2,438,088)
6.2.5 Remeasurements chargeable in the other comprehensive income Actuarial loss / (gain) and experience adjustment 522,284 (651,349)
Return on plan assets 340,722 108,869 863,006 (542,480)6.2.6 Plan assets composition Investment in treasury bills 6,199,584 6,226,864 Investment in listed shares 2,394,649 1,844,898 Cash at bank 870,781 801,319 Other assets – 888 9,465,014 8,873,969 6.2.7 Charge for the year
Current service cost 446,746 445,668
Interest cost 675,760 789,966 Expected return on plan assets (931,767) (1,068,443) 190,739 167,191
www.nimir.com.pk
Annual Report 2016
37
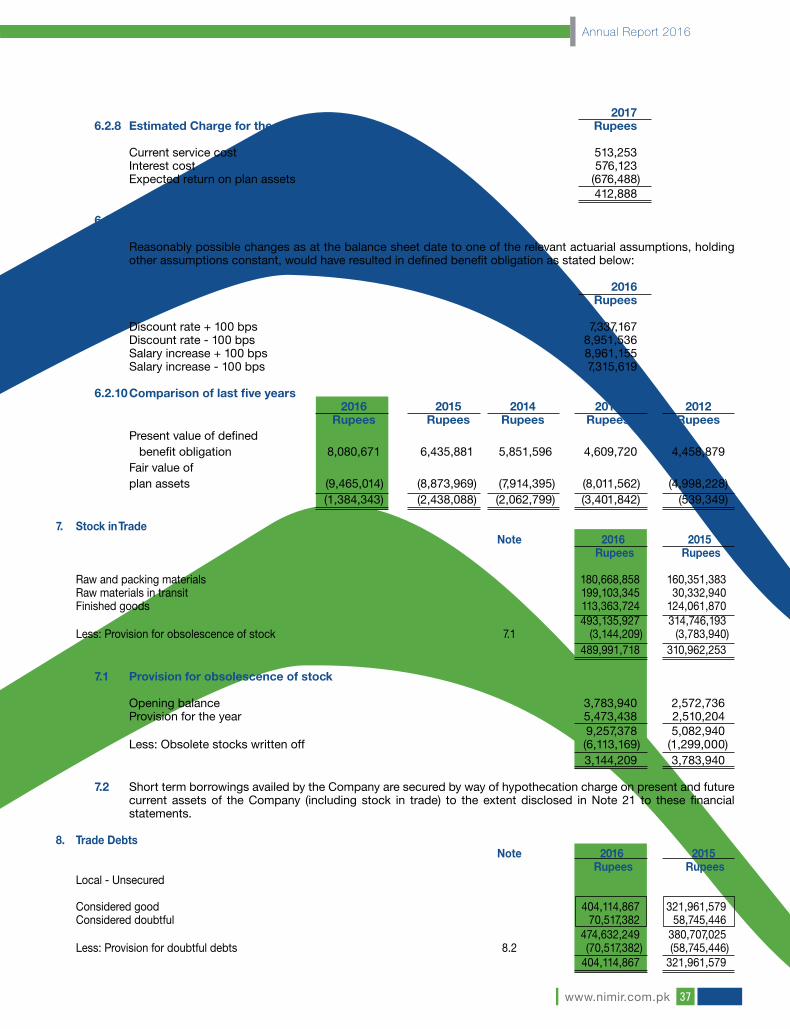
20176.2.8 Estimated Charge for the year 2016-2017 Rupees
Current service cost 513,253 Interest cost 576,123 Expected return on plan assets (676,488) 412,888
6.2.9 Year end sensitivity analysis on defined benefit obligation Reasonably possible changes as at the balance sheet date to one of the relevant actuarial assumptions, holding other assumptions constant, would have resulted in defined benefit obligation as stated below:
2016 Rupees
Discount rate + 100 bps 7,337,167 Discount rate - 100 bps 8,951,536 Salary increase + 100 bps 8,961,155 Salary increase - 100 bps 7,315,619
6.2.10 Comparison of last five years 2016 2015 2014 2013 2012
Rupees Rupees Rupees Rupees Rupees Present value of defined benefit obligation 8,080,671 6,435,881 5,851,596 4,609,720 4,458,879 Fair value of
plan assets (9,465,014) (8,873,969) (7,914,395) (8,011,562) (4,998,228) (1,384,343) (2,438,088) (2,062,799) (3,401,842) (539,349)
7. Stock in Trade Note 2016 2015 Rupees Rupees Raw and packing materials 180,668,858 160,351,383 Raw materials in transit 199,103,345 30,332,940 Finished goods 113,363,724 124,061,870 493,135,927 314,746,193 Less: Provision for obsolescence of stock 7.1 (3,144,209) (3,783,940) 489,991,718 310,962,253
7.1 Provision for obsolescence of stock
Opening balance 3,783,940 2,572,736 Provision for the year 5,473,438 2,510,204 9,257,378 5,082,940 Less: Obsolete stocks written off (6,113,169) (1,299,000) 3,144,209 3,783,940 7.2 Short term borrowings availed by the Company are secured by way of hypothecation charge on present and future
current assets of the Company (including stock in trade) to the extent disclosed in Note 21 to these financial statements.
8. Trade Debts Note 2016 2015 Rupees Rupees Local - Unsecured Considered good 404,114,867 321,961,579 Considered doubtful 70,517,382 58,745,446 474,632,249 380,707,025 Less: Provision for doubtful debts 8.2 (70,517,382) (58,745,446) 404,114,867 321,961,579

Annual Report 2016
Nimir Resins Limited38
8.1 Trade debts do not include any amount due from related parties.
8.2 Provision for doubtful debts 2016 2015
Rupees Rupees
Opening balance 58,745,446 62,518,280 Provision for the year 12,033,136 17,395,507 70,778,582 79,913,787 Less: Bad debts written off (261,200) (21,168,341) 70,517,382 58,745,446
9. Loans and Advances Note 2016 2015 Rupees Rupees Advances (Unsecured - Considered good): - Suppliers and contractors 9.1 47,314,943 6,523,609 - Employees 9.2 263,389 274,931 Margin against letters of guarantees 12,386,050 – Margin against letters of credit 7,484,978 – Short term loans to employees (Secured - Considered good) 9.3 890,408 1,031,787 Income tax deducted at source and advance tax 132,795,519 100,500,298 Sales tax refundable - Net 18,019,489 7,664,906 219,154,776 115,995,531
9.1 This includes an amount of Rs. 25.269 million (2015: Rs. 0.122 million) for clearing the imported raw material.
9.2 Advances to employees do not include any amount (2015: Rs. 21,382) given to directors and executives of the
Company.
9.3 This represents interest-free loans given to employees as per the Company’s policy. These loans are recoverable in monthly installments from salary and are secured against provident fund balances of employees.
10. Short Term Prepayments and Other Receivables Note 2016 2015 Rupees Rupees (Restated) Prepayments 1,670,190 2,873,952 Due from associates / related parties 10.1 637,405 – Imprest with employees – 30,000 Other receivables 10.2 10,151,623 7,943,485
12,459,218 10,847,437 10.1 This represents amounts due from associates / related parties as under:
Nimir Industrial Chemicals Limited 102,848 –
Nimir Management (Private) Limited 534,557 – 637,405 – 10.2 Pursuant to the change in management, balances due from associated and related companies of previous
management have been reclassified as other receivable.
11. Bank Balances Note 2016 2015 Rupees Rupees Cash in hand 239,717 – Cash at banks in: Current accounts 69,413,543 66,510 Saving accounts 11.1 1,312,344 1,880,675 70,965,604 1,947,185
11.1 These balances yield interest at the rates ranging from 4.0% to 8.0% (2015: 4.5% to 8.0%) per annum.
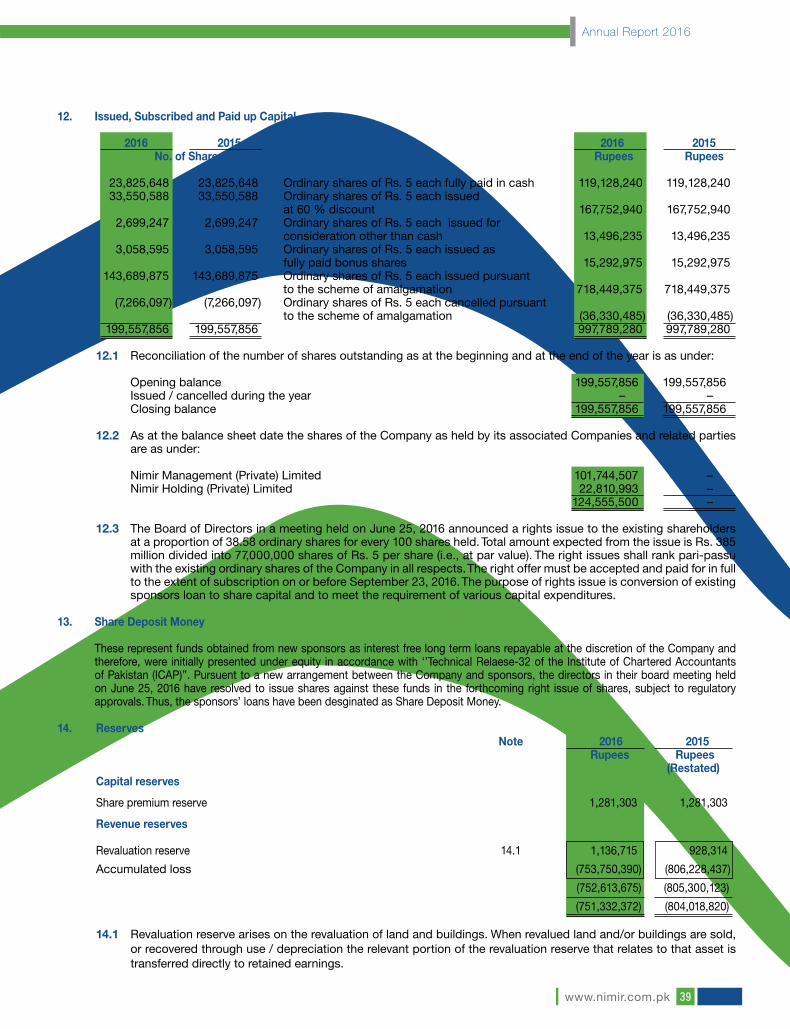
www.nimir.com.pk
Annual Report 2016
39
12. Issued, Subscribed and Paid up Capital
2016 2015 2016 2015 No. of Shares Rupees Rupees 23,825,648 23,825,648 Ordinary shares of Rs. 5 each fully paid in cash 119,128,240 119,128,240 33,550,588 33,550,588 Ordinary shares of Rs. 5 each issued at 60 % discount 167,752,940 167,752,940 2,699,247 2,699,247 Ordinary shares of Rs. 5 each issued for consideration other than cash 13,496,235 13,496,235 3,058,595 3,058,595 Ordinary shares of Rs. 5 each issued as fully paid bonus shares 15,292,975 15,292,975 143,689,875 143,689,875 Ordinary shares of Rs. 5 each issued pursuant to the scheme of amalgamation 718,449,375 718,449,375 (7,266,097) (7,266,097) Ordinary shares of Rs. 5 each cancelled pursuant to the scheme of amalgamation (36,330,485) (36,330,485) 199,557,856 199,557,856 997,789,280 997,789,280
12.1 Reconciliation of the number of shares outstanding as at the beginning and at the end of the year is as under: Opening balance 199,557,856 199,557,856
Issued / cancelled during the year – – Closing balance 199,557,856 199,557,856 12.2 As at the balance sheet date the shares of the Company as held by its associated Companies and related parties
are as under: Nimir Management (Private) Limited 101,744,507 –
Nimir Holding (Private) Limited 22,810,993 – 124,555,500 – 12.3 The Board of Directors in a meeting held on June 25, 2016 announced a rights issue to the existing shareholders
at a proportion of 38.58 ordinary shares for every 100 shares held. Total amount expected from the issue is Rs. 385 million divided into 77,000,000 shares of Rs. 5 per share (i.e., at par value). The right issues shall rank pari-passu with the existing ordinary shares of the Company in all respects. The right offer must be accepted and paid for in full to the extent of subscription on or before September 23, 2016. The purpose of rights issue is conversion of existing sponsors loan to share capital and to meet the requirement of various capital expenditures.
13. Share Deposit Money
These represent funds obtained from new sponsors as interest free long term loans repayable at the discretion of the Company and therefore, were initially presented under equity in accordance with ‘’Technical Relaese-32 of the Institute of Chartered Accountants of Pakistan (ICAP)’’. Pursuent to a new arrangement between the Company and sponsors, the directors in their board meeting held on June 25, 2016 have resolved to issue shares against these funds in the forthcoming right issue of shares, subject to regulatory approvals. Thus, the sponsors’ loans have been desginated as Share Deposit Money.
14. Reserves Note 2016 2015 Rupees Rupees (Restated) Capital reserves
Share premium reserve 1,281,303 1,281,303 Revenue reserves
Revaluation reserve 14.1 1,136,715 928,314
Accumulated loss (753,750,390) (806,228,437)
(752,613,675) (805,300,123)
(751,332,372) (804,018,820) 14.1 Revaluation reserve arises on the revaluation of land and buildings. When revalued land and/or buildings are sold,
or recovered through use / depreciation the relevant portion of the revaluation reserve that relates to that asset is transferred directly to retained earnings.

Annual Report 2016
Nimir Resins Limited40
15. Surplus on Revaluation of Property, Plant and Equipment 2016 2015 Rupees Rupees Land - freehold 43,088,203 43,088,203 Buildings on freehold land 4,060,828 3,970,933 47,149,031 47,059,136 Add: Effect of change in rate – 300,533 Less: Incremental depreciation charged on revalued property, plant and equipment in current year - net of deferred tax (208,401) (210,638) 46,940,630 47,149,031
15.1 Latest revaluation of property, plant and equipment was carried out as on June 30, 2014 by an approved, independent valuer using the replacement value method that resulted in net revaluation surplus of Rs. 9,722,414. Previous revaluations of land and buildings were carried out as on December 31, 2011 and December 31, 2006 by an approved independent valuer using the replacement value method that resulted in revaluation surplus of
Rs. 4,865,549 and Rs. 40,819,989 respectively.
15.2 Incremental depreciation charged on revalued building has been transferred to the statement of changes in equity to record realization of surplus to the extent of incremental depreciation.
16. Long Term Financing Note 2016 2015 Rupees Rupees Banking companies - Secured Bank Al-Habib Limited 16.1 – 150,000,000 Habib Metropolitan Bank Limited 16.1 – 29,333,333 – 179,333,333 Less: Current portion – (89,666,661) – 89,666,672
16.1 This represented outstanding long-term financing obtained from Bank Al-Habib Limited and Habib Metropolitan
Bank Limited to meet the long term and working capital requirements of the Company. This financing carried mark-up at 3 to 6 months’ KIBOR + 2% per annum. The entire financing has been repaid during the year and charges on the Company’s assets have been vacated accordingly.
17. Long Term Financing From Sponsors Note 2016 2015 Rupees Rupees Opening balance - at amortized cost 31,610,558 – Interest free loans received from ex-director 17.1 82,000,000 40,000,000 Reinstatement adjustment for change in loan terms 17.2 8,389,442 – 122,000,000 40,000,000 Loan waived off by lenders 17.2 & 30 (15,000,000) – Less: Present value adjustment at reporting date 17.3 (7,751,322) (8,389,442) Closing balance of sponsors’ loans - at amortized cost 99,248,678 31,610,558
17.1 This represents long term loans obtained from ex-director of the Company. These loans are interest free and repayable as explained in Note 17.2 below.
17.2 During the year, the loans amounting Rs. 122 million were novated by ex-director in favour of new management which waived off Rs. 15 million thereof and, as a transitionary arrangement, treated the balance of such loans as interest free and repayable at discretion of the Company. For that arrangement, the loans were reinstated from discounted values to original values and classified from Non-Current Liablities to Equity. Later on, the lenders and the Company have mutually decided as on June 25, 2016, that such loans will be repayable at the option of lenders. However, lenders have decided not to demand for repayment untill at least one year.
17.3 As detailed in note 17.2 above, the loans terms were changed on June 25, 2016. Pursuant to that change, the outstanding balance of sponsors’ interest free loans has been discounted using market based interest rates applicable on similar loans, in accordance with “Technical Relase, TR-32” issued by the ICAP on January 9, 2016. The resulting adjustment has been shown as Equity Portion of Sponsors’ Loan. In subsequent year, the imputed

www.nimir.com.pk
Annual Report 2016
41
markup expense shall be recognized through profit and loss account by using the same rates of interest, and equivalent amount shall be reinstated to the loan through un-winding of discount. The movement during the year in equity portion of sponsors’ interest free loans, is given below:
Note 2016 2015 Rupees Rupees
Opening Balance 8,389,442 – Reinstatement adjustment for change in loan terms 17.2 (8,389,442) – – – Present value adjustment at reporting date 7,751,322 8,389,442 Closing Balance 7,751,322 8,389,442
18. Deferred Tax Liability Taxable temporary differences - Accelerated tax depreciation 66,835,386 71,670,315 - Surplus on revaluation of property, plant and equipment 1,798,796 1,893,470 68,634,182 73,563,785 Deductible temporary differences - Recognized losses – (26,374,850) - Minimum tax (16,250,004) – - Provisions and others (21,683,174) (18,027,390) (37,933,178) (44,402,240) 30,701,004 29,161,545
19. Trade and Other Payables Note 2016 2015 Rupees Rupees (Restated) Creditors 19.1 108,006,450 98,085,472 Letter of credit payable 31,688,311 82,254,338 Bills payable – 29,310,100 Accrued liabilities 12,873,544 14,976,433 Advances from customers 18,014,556 59,895,562 Provident fund payable – 55,137 Unclaimed dividends 292,819 292,819 Workers’ profit participation fund 3,050,617 – Workers’ welfare fund 83,221 – Other payables 19.2 5,658,867 2,479,882 179,668,385 287,349,743
19.1 Creditors do not include any amount due to related parties (2015: Rs. 207,370) arising in the normal course of
business.
19.2 This represents balance payable to associated / related parties of previous management.
20. Accrued Mark up 2016 2015 Rupees Rupees Long term financing - Banking companies – 5,178,166 Short term borrowings - Banking companies 9,806,364 9,307,711 9,806,364 14,485,877
21. Short Term Borrowings Banking companies - Secured Running finance 417,466,196 173,421,336 Borrowings / FATRs 353,899,873 306,149,834 771,366,069 479,571,170
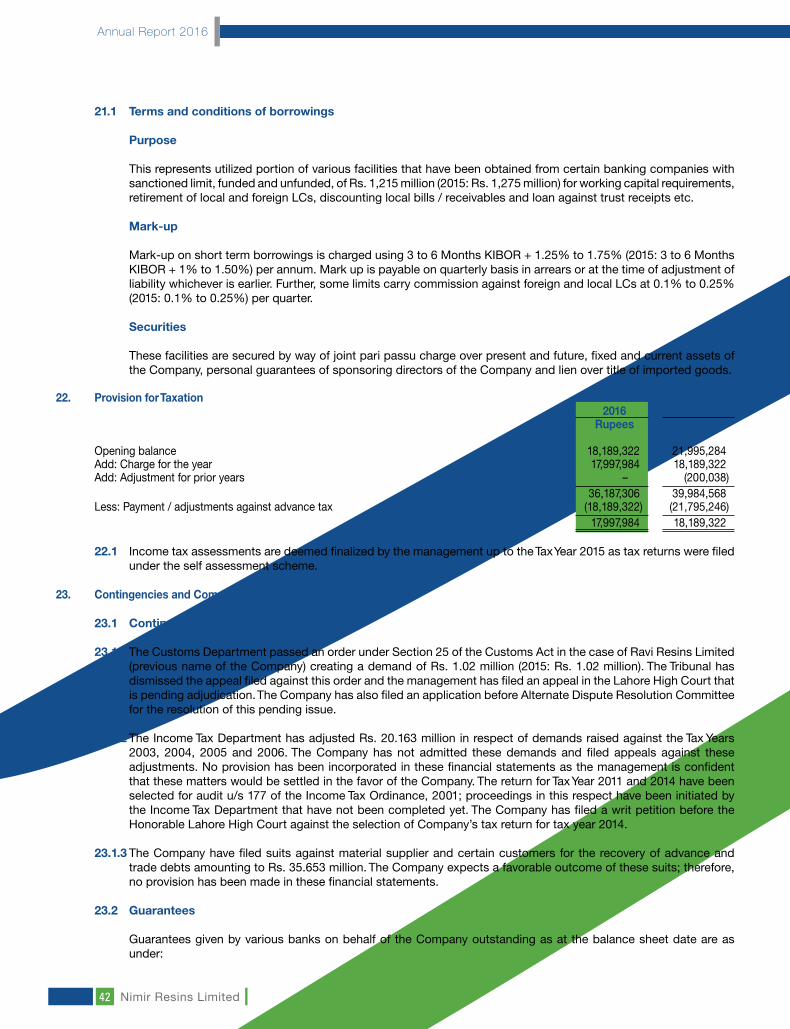
Annual Report 2016
Nimir Resins Limited42
21.1 Terms and conditions of borrowings Purpose
This represents utilized portion of various facilities that have been obtained from certain banking companies with sanctioned limit, funded and unfunded, of Rs. 1,215 million (2015: Rs. 1,275 million) for working capital requirements, retirement of local and foreign LCs, discounting local bills / receivables and loan against trust receipts etc.
Mark-up Mark-up on short term borrowings is charged using 3 to 6 Months KIBOR + 1.25% to 1.75% (2015: 3 to 6 Months KIBOR + 1% to 1.50%) per annum. Mark up is payable on quarterly basis in arrears or at the time of adjustment of liability whichever is earlier. Further, some limits carry commission against foreign and local LCs at 0.1% to 0.25% (2015: 0.1% to 0.25%) per quarter. Securities These facilities are secured by way of joint pari passu charge over present and future, fixed and current assets of the Company, personal guarantees of sponsoring directors of the Company and lien over title of imported goods.
22. Provision for Taxation 2016 2015 Rupees Rupees Opening balance 18,189,322 21,995,284 Add: Charge for the year 17,997,984 18,189,322 Add: Adjustment for prior years – (200,038) 36,187,306 39,984,568 Less: Payment / adjustments against advance tax (18,189,322) (21,795,246) 17,997,984 18,189,322
22.1 Income tax assessments are deemed finalized by the management up to the Tax Year 2015 as tax returns were filed
under the self assessment scheme.
23. Contingencies and Commitments
23.1 Contingencies
23.1.1 The Customs Department passed an order under Section 25 of the Customs Act in the case of Ravi Resins Limited (previous name of the Company) creating a demand of Rs. 1.02 million (2015: Rs. 1.02 million). The Tribunal has dismissed the appeal filed against this order and the management has filed an appeal in the Lahore High Court that is pending adjudication. The Company has also filed an application before Alternate Dispute Resolution Committee for the resolution of this pending issue.
23.1.2 The Income Tax Department has adjusted Rs. 20.163 million in respect of demands raised against the Tax Years 2003, 2004, 2005 and 2006. The Company has not admitted these demands and filed appeals against these adjustments. No provision has been incorporated in these financial statements as the management is confident that these matters would be settled in the favor of the Company. The return for Tax Year 2011 and 2014 have been selected for audit u/s 177 of the Income Tax Ordinance, 2001; proceedings in this respect have been initiated by the Income Tax Department that have not been completed yet. The Company has filed a writ petition before the Honorable Lahore High Court against the selection of Company’s tax return for tax year 2014.
23.1.3 The Company have filed suits against material supplier and certain customers for the recovery of advance and trade debts amounting to Rs. 35.653 million. The Company expects a favorable outcome of these suits; therefore, no provision has been made in these financial statements.
23.2 Guarantees
Guarantees given by various banks on behalf of the Company outstanding as at the balance sheet date are as under:
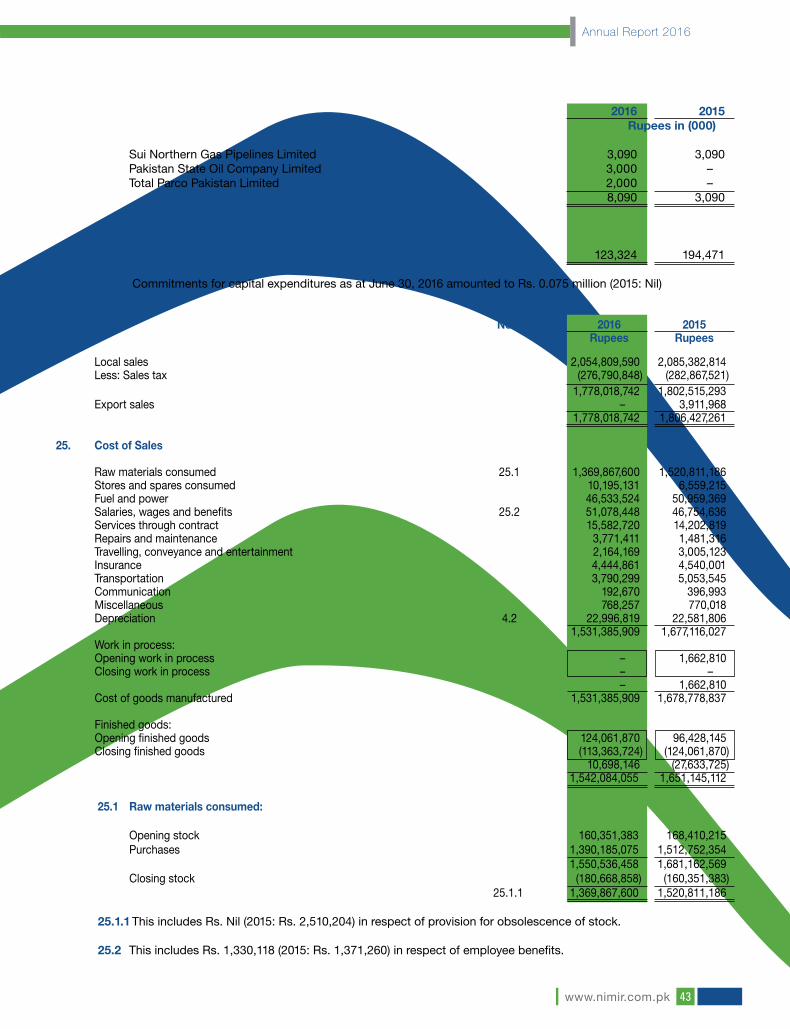
www.nimir.com.pk
Annual Report 2016
43
2016 2015 Rupees in (000)
Sui Northern Gas Pipelines Limited 3,090 3,090
Pakistan State Oil Company Limited 3,000 – Total Parco Pakistan Limited 2,000 – 8,090 3,090 23.3 Commitments
23.3.1 Letters of credit 123,324 194,471 23.3.2 Commitments for capital expenditures as at June 30, 2016 amounted to Rs. 0.075 million (2015: Nil)
24. Sales Note 2016 2015 Rupees Rupees Local sales 2,054,809,590 2,085,382,814 Less: Sales tax (276,790,848) (282,867,521) 1,778,018,742 1,802,515,293 Export sales – 3,911,968 1,778,018,742 1,806,427,261
25. Cost of Sales Raw materials consumed 25.1 1,369,867,600 1,520,811,186 Stores and spares consumed 10,195,131 6,559,215 Fuel and power 46,533,524 50,959,369 Salaries, wages and benefits 25.2 51,078,448 46,754,636 Services through contract 15,582,720 14,202,819 Repairs and maintenance 3,771,411 1,481,316 Travelling, conveyance and entertainment 2,164,169 3,005,123 Insurance 4,444,861 4,540,001 Transportation 3,790,299 5,053,545 Communication 192,670 396,993 Miscellaneous 768,257 770,018 Depreciation 4.2 22,996,819 22,581,806 1,531,385,909 1,677,116,027 Work in process: Opening work in process – 1,662,810 Closing work in process – – – 1,662,810 Cost of goods manufactured 1,531,385,909 1,678,778,837 Finished goods: Opening finished goods 124,061,870 96,428,145 Closing finished goods (113,363,724) (124,061,870) 10,698,146 (27,633,725) 1,542,084,055 1,651,145,112
25.1 Raw materials consumed:
Opening stock 160,351,383 168,410,215
Purchases 1,390,185,075 1,512,752,354 1,550,536,458 1,681,162,569 Closing stock (180,668,858) (160,351,383) 25.1.1 1,369,867,600 1,520,811,186 25.1.1 This includes Rs. Nil (2015: Rs. 2,510,204) in respect of provision for obsolescence of stock.
25.2 This includes Rs. 1,330,118 (2015: Rs. 1,371,260) in respect of employee benefits.

Annual Report 2016
Nimir Resins Limited44
26. Distribution Cost Note 2016 2015 Rupees Rupees Salaries, wages and benefits 26.1 16,779,408 21,748,681 Packing, carriage and forwarding 16,475,556 22,026,035 Commission and discount 6,514,828 4,198,028 Travelling, conveyance and entertainment 2,228,374 5,141,974 Sales promotion expenses 960,460 345,108 Insurance and license fee 934,004 1,954,541 Communication 280,697 750,012 Sampling 113,179 1,657,098 Rent, rates and taxes 431,251 1,064,751 Utilities 161,236 2,373,218 Repairs and maintenance 210,006 112,523 Public relations 112,537 161,739 Miscellaneous 407,355 475,876 Depreciation 4.2 914,637 – 46,523,528 62,009,584
26.1 This includes Rs. 504,646 (2015: Rs. 908,030) in respect of employee benefits.
27. Administrative Expenses Salaries, wages and benefits 27.1 24,803,064 31,112,560 Travelling, conveyance and entertainment 3,159,779 3,767,382 Repairs and maintenance 922,051 837,187 Insurance 163,757 192,916 Printing and stationery 4,316,931 3,996,542 Communication 1,315,526 1,372,109 Fees and subscription 27.2 10,728,913 7,178,864 Advertisement 697,840 150,060 Manpower development – 199,289 Legal and professional charges 27.2 4,345,042 2,883,578 Miscellaneous 498,134 568,498 Amortization 5.3 4,235,681 4,620,744 Depreciation 4.2 2,996,961 7,527,269
58,183,679 64,406,998 Less: Recovery from associates (4,795,461) (10,204,046) 53,388,218 54,202,952 27.1 This includes Rs. 824,947 (2015: Rs. 2,078,914) in respect of employee benefits.
27.2 This includes Rs. 7.385 million (2015: Rs. Nil) in respect of cost incurred on proposed right issue.
28. Other Operating Expenses
Auditors’ remuneration: - Audit fee 695,740 632,500 - Half yearly review and other certifications 424,950 379,500 - Out of pocket expenses 53,130 48,300 1,173,820 1,060,300 Provision for doubtful debts 8.2 12,033,136 17,395,507 Provision for obsolescence of stock 7.1 5,473,438 – Workers’ profit participation fund 3,050,617 – Workers’ welfare fund 83,221 – Loss on disposal of property, plant and equipment 222,632 – Intangible assets written off 14,247,295 – Security deposits written off – 747,263 36,284,159 19,203,070
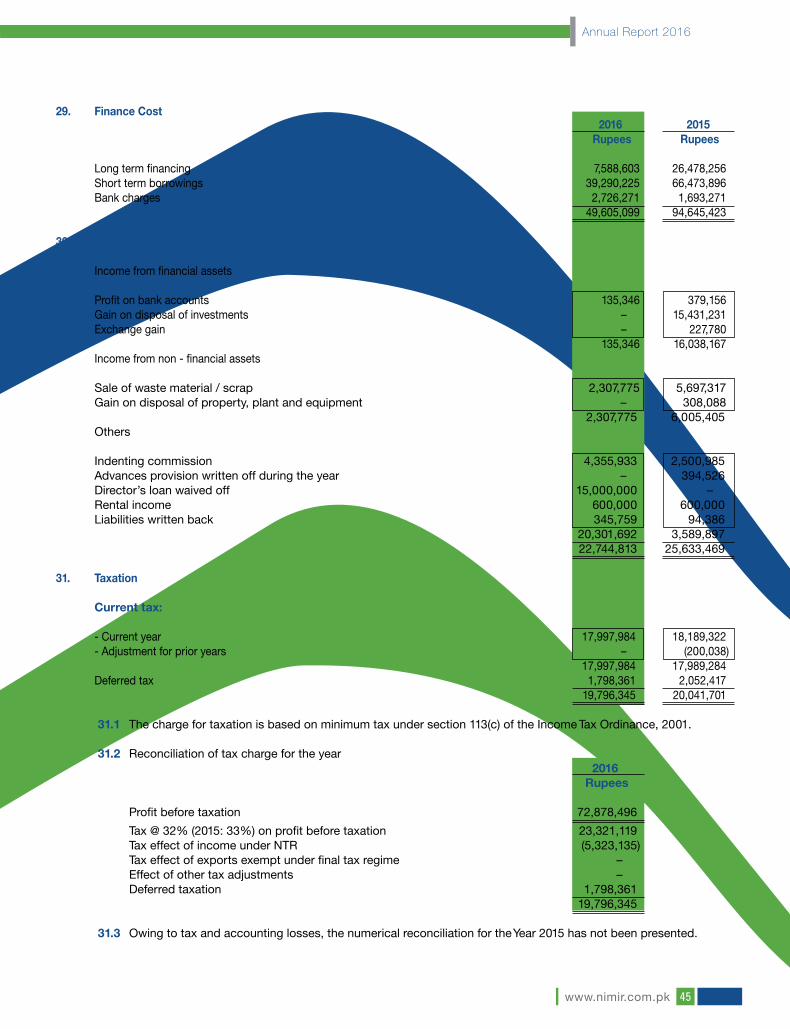
www.nimir.com.pk
Annual Report 2016
45
29. Finance Cost 2016 2015 Rupees Rupees Long term financing 7,588,603 26,478,256 Short term borrowings 39,290,225 66,473,896 Bank charges 2,726,271 1,693,271 49,605,099 94,645,423 30. Other Income Income from financial assets Profit on bank accounts 135,346 379,156 Gain on disposal of investments – 15,431,231 Exchange gain – 227,780 135,346 16,038,167 Income from non - financial assets Sale of waste material / scrap 2,307,775 5,697,317 Gain on disposal of property, plant and equipment – 308,088
2,307,775 6,005,405 Others
Indenting commission 4,355,933 2,500,985 Advances provision written off during the year – 394,526 Director’s loan waived off 15,000,000 – Rental income 600,000 600,000 Liabilities written back 345,759 94,386 20,301,692 3,589,897 22,744,813 25,633,469
31. Taxation Current tax: - Current year 17,997,984 18,189,322 - Adjustment for prior years – (200,038) 17,997,984 17,989,284 Deferred tax 1,798,361 2,052,417 19,796,345 20,041,701
31.1 The charge for taxation is based on minimum tax under section 113(c) of the Income Tax Ordinance, 2001.
31.2 Reconciliation of tax charge for the year
2016 Rupees
Profit before taxation 72,878,496
Tax @ 32% (2015: 33%) on profit before taxation 23,321,119 Tax effect of income under NTR (5,323,135)
Tax effect of exports exempt under final tax regime – Effect of other tax adjustments – Deferred taxation 1,798,361 19,796,345
31.3 Owing to tax and accounting losses, the numerical reconciliation for the Year 2015 has not been presented.
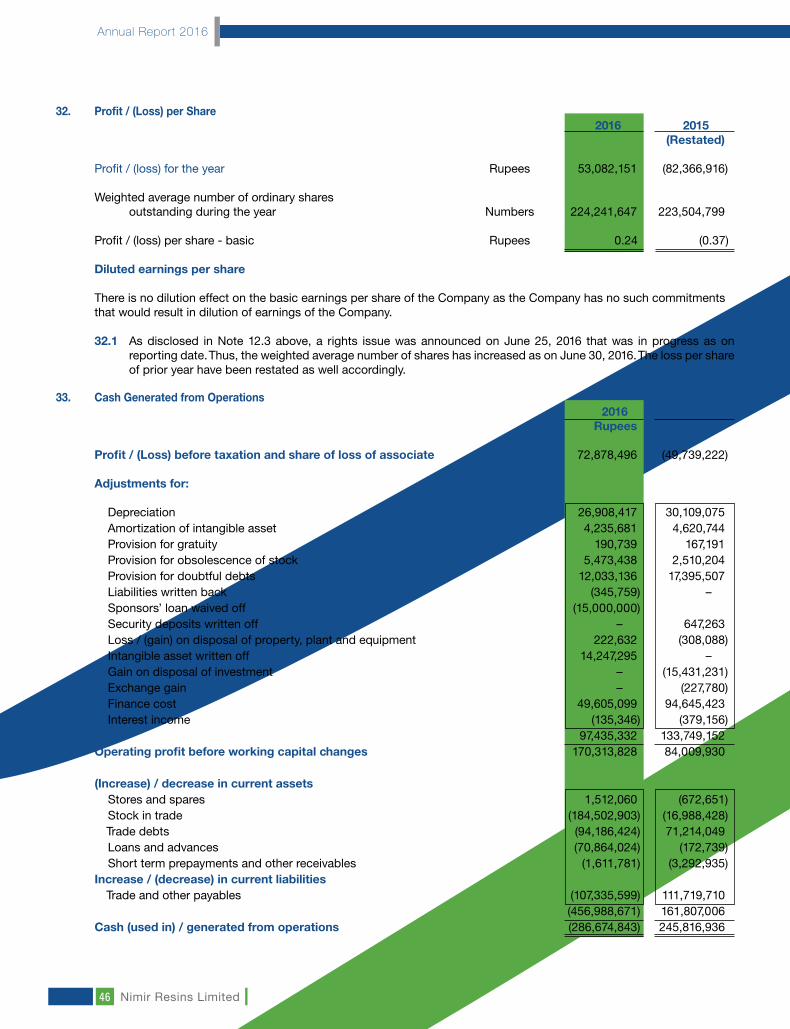
Annual Report 2016
Nimir Resins Limited46
32. Profit / (Loss) per Share 2016 2015
(Restated) Profit / (loss) for the year Rupees 53,082,151 (82,366,916)
Weighted average number of ordinary shares outstanding during the year Numbers 224,241,647 223,504,799
Profit / (loss) per share - basic Rupees 0.24 (0.37) Diluted earnings per share
There is no dilution effect on the basic earnings per share of the Company as the Company has no such commitmentsthat would result in dilution of earnings of the Company.
32.1 As disclosed in Note 12.3 above, a rights issue was announced on June 25, 2016 that was in progress as on
reporting date. Thus, the weighted average number of shares has increased as on June 30, 2016. The loss per share of prior year have been restated as well accordingly.
33. Cash Generated from Operations 2016 2015
Rupees Rupees Profit / (Loss) before taxation and share of loss of associate 72,878,496 (49,739,222)
Adjustments for:
Depreciation 26,908,417 30,109,075 Amortization of intangible asset 4,235,681 4,620,744 Provision for gratuity 190,739 167,191 Provision for obsolescence of stock 5,473,438 2,510,204 Provision for doubtful debts 12,033,136 17,395,507 Liabilities written back (345,759) – Sponsors’ loan waived off (15,000,000) Security deposits written off – 647,263 Loss / (gain) on disposal of property, plant and equipment 222,632 (308,088) Intangible asset written off 14,247,295 – Gain on disposal of investment – (15,431,231) Exchange gain – (227,780) Finance cost 49,605,099 94,645,423 Interest income (135,346) (379,156) 97,435,332 133,749,152 Operating profit before working capital changes 170,313,828 84,009,930 (Increase) / decrease in current assets Stores and spares 1,512,060 (672,651) Stock in trade (184,502,903) (16,988,428) Trade debts (94,186,424) 71,214,049 Loans and advances (70,864,024) (172,739) Short term prepayments and other receivables (1,611,781) (3,292,935)Increase / (decrease) in current liabilities Trade and other payables (107,335,599) 111,719,710 (456,988,671) 161,807,006 Cash (used in) / generated from operations (286,674,843) 245,816,936

www.nimir.com.pk
Annual Report 2016
47
34. Remuneration of Chief Executive, Directors and Executives The aggregate amounts charged in the financial statements for the year as remuneration and benefits to the chief executive, directors and executives of the Company are as follows:
Chief Executive Executive Director Non-Executive Directors Executives 2016 2015 2016 2015 2016 2015 2016 2015 Rupees in (000)
Managerial remuneration 3,341 5,531 1,500 486 – 1,881 10,200 21,899 Meeting fee – – – – 90 – – – Car and other allowances – 279 250 – – – 1,669 2,949 Staff retirement benefits – 212 – – – 76 285 659 3,341 6,022 1,750 486 90 1,957 12,154 25,507 Number of persons 1 1 1 1 5 2 11 16
34.1 An executive is defined as an employee, other than the chief executive and directors, whose basic salary exceeds Rs. 500,000
in a financial year.
34.2 This represents the remuneration of chief executives for the period upto January 05, 2016. The chief executive appointed by new management is not yet taking any remuneration.
34.3 For the period upto the change in management, the chief executive, two directors and certain executives of Company were provided with free use of Company maintained vehicles.
35. Balances and Transaction with Related Parties
Related parties comprise related group companies, associated companies, staff retirement funds, directors and key management personnel. The Company in the normal course of business carries out transactions with various related parties. The Company enters into transactions with related parties on the basis of mutually agreed terms. Significant balances and transactions with related parties are as follows: From July Year ended 35.1 Transactions before change of shareholding 01, 2015 June 30,
To January 2015 Related party Relationship Nature of Transaction 05, 2016 Rupees in (000)
Altern Energy Limited Associate Sale of goods, services provided and reimbursement of expenses 750 1,731 Descon Corporation Associate Sale of goods, services provided and
(Private) Limited reimbursement of expenses 797 47 Rent expense – 1,907 Purchase of goods, services received and reimbursement of expenses 230 – Descon Engineering Associate Sale of goods, services provided and Limited reimbursement of expenses 4,251 7,730 Purchase of goods, services received and reimbursement of expenses 2,534 8,981 Disposal of fixed assets – 168 Descon Oxychem Limited Associate Sale of goods, services provided and reimbursement of expenses 14,653 50,698 Purchase of goods, services received and reimbursement of expenses 5,611 12,852 Descon Power Solutions Associate Sale of goods, services provided and (Private) Limited reimbursement of expenses 3,171 12,501 Descon Training Institute Associate Sale of goods, services provided and reimbursement of expenses 1,309 1,548 Purchase of goods, services received and reimbursement of expenses 953 –
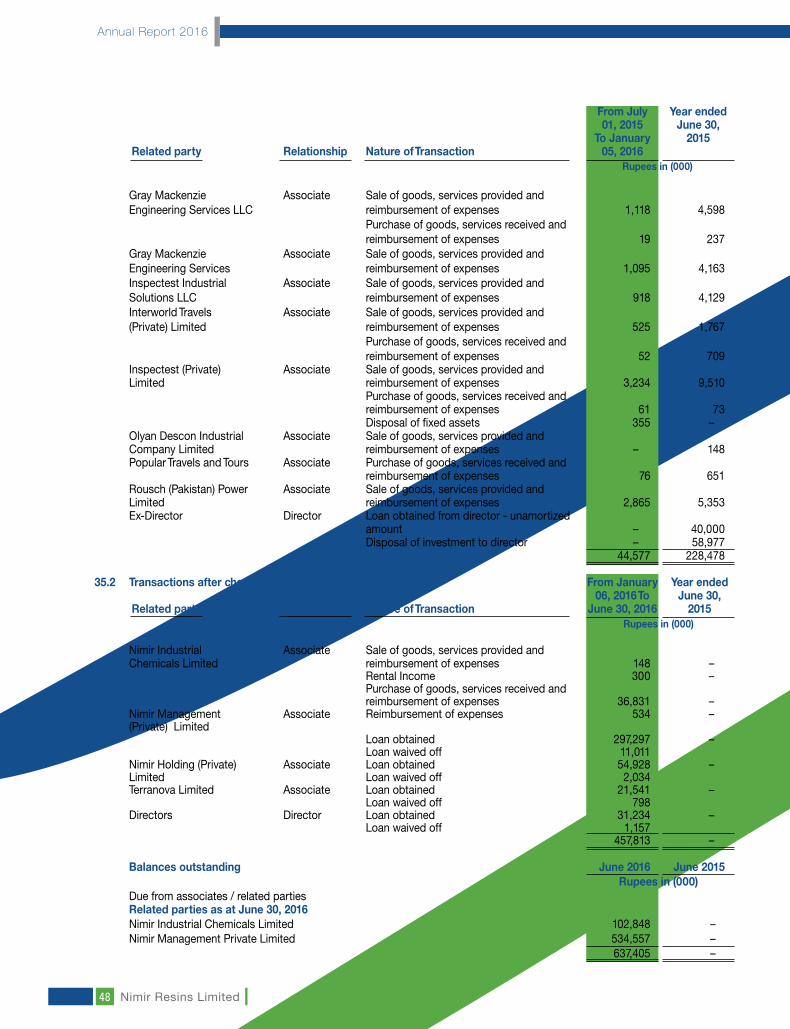
Annual Report 2016
Nimir Resins Limited48
From July Year ended 01, 2015 June 30,
To January 2015 Related party Relationship Nature of Transaction 05, 2016 Rupees in (000)
Gray Mackenzie Associate Sale of goods, services provided and Engineering Services LLC reimbursement of expenses 1,118 4,598 Purchase of goods, services received and reimbursement of expenses 19 237 Gray Mackenzie Associate Sale of goods, services provided and Engineering Services reimbursement of expenses 1,095 4,163 Inspectest Industrial Associate Sale of goods, services provided and Solutions LLC reimbursement of expenses 918 4,129 Interworld Travels Associate Sale of goods, services provided and (Private) Limited reimbursement of expenses 525 1,767 Purchase of goods, services received and reimbursement of expenses 52 709 Inspectest (Private) Associate Sale of goods, services provided and Limited reimbursement of expenses 3,234 9,510 Purchase of goods, services received and reimbursement of expenses 61 73 Disposal of fixed assets 355 – Olyan Descon Industrial Associate Sale of goods, services provided and Company Limited reimbursement of expenses – 148 Popular Travels and Tours Associate Purchase of goods, services received and reimbursement of expenses 76 651 Rousch (Pakistan) Power Associate Sale of goods, services provided and Limited reimbursement of expenses 2,865 5,353 Ex-Director Director Loan obtained from director - unamortized amount – 40,000 Disposal of investment to director – 58,977 44,577 228,478
35.2 Transactions after change of shareholding From January Year ended 06, 2016 To June 30,
Related party Relationship Nature of Transaction June 30, 2016 2015 Rupees in (000)
Nimir Industrial Associate Sale of goods, services provided and Chemicals Limited reimbursement of expenses 148 – Rental Income 300 – Purchase of goods, services received and reimbursement of expenses 36,831 – Nimir Management Associate Reimbursement of expenses 534 –
(Private) Limited Loan obtained 297,297 –
Loan waived off 11,011 Nimir Holding (Private) Associate Loan obtained 54,928 – Limited Loan waived off 2,034 Terranova Limited Associate Loan obtained 21,541 – Loan waived off 798 Directors Director Loan obtained 31,234 – Loan waived off 1,157 457,813 –
Balances outstanding June 2016 June 2015 Rupees in (000) Due from associates / related parties
Related parties as at June 30, 2016 Nimir Industrial Chemicals Limited 102,848 –
Nimir Management Private Limited 534,557 – 637,405 –
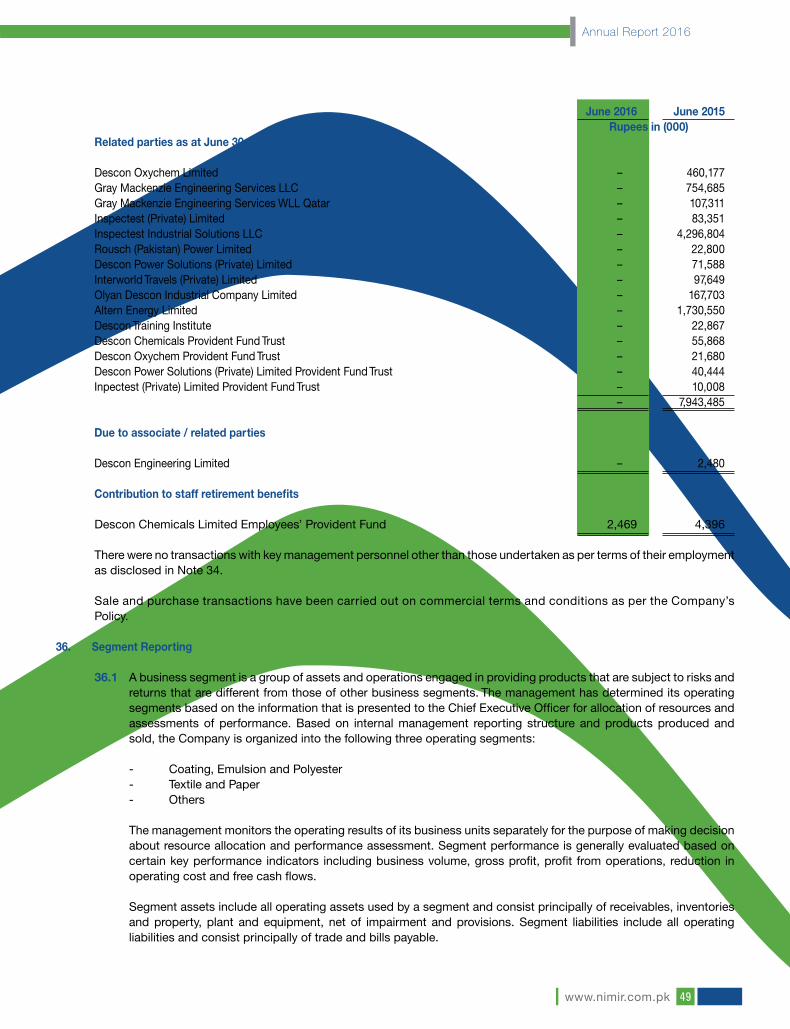
www.nimir.com.pk
Annual Report 2016
49
June 2016 June 2015 Rupees in (000)Related parties as at June 30, 2015
Descon Oxychem Limited – 460,177 Gray Mackenzie Engineering Services LLC – 754,685 Gray Mackenzie Engineering Services WLL Qatar – 107,311 Inspectest (Private) Limited – 83,351 Inspectest Industrial Solutions LLC – 4,296,804 Rousch (Pakistan) Power Limited – 22,800 Descon Power Solutions (Private) Limited – 71,588 Interworld Travels (Private) Limited – 97,649 Olyan Descon Industrial Company Limited – 167,703 Altern Energy Limited – 1,730,550 Descon Training Institute – 22,867 Descon Chemicals Provident Fund Trust – 55,868 Descon Oxychem Provident Fund Trust – 21,680 Descon Power Solutions (Private) Limited Provident Fund Trust – 40,444 Inpectest (Private) Limited Provident Fund Trust – 10,008 – 7,943,485
Due to associate / related parties
Descon Engineering Limited – 2,480
Contribution to staff retirement benefits
Descon Chemicals Limited Employees’ Provident Fund 2,469 4,396
There were no transactions with key management personnel other than those undertaken as per terms of their employmentas disclosed in Note 34.
Sale and purchase transactions have been carried out on commercial terms and conditions as per the Company’sPolicy.
36. Segment Reporting
36.1 A business segment is a group of assets and operations engaged in providing products that are subject to risks and
returns that are different from those of other business segments. The management has determined its operating segments based on the information that is presented to the Chief Executive Officer for allocation of resources and assessments of performance. Based on internal management reporting structure and products produced and sold, the Company is organized into the following three operating segments:
- Coating, Emulsion and Polyester - Textile and Paper
- Others
The management monitors the operating results of its business units separately for the purpose of making decision about resource allocation and performance assessment. Segment performance is generally evaluated based on certain key performance indicators including business volume, gross profit, profit from operations, reduction in operating cost and free cash flows.
Segment assets include all operating assets used by a segment and consist principally of receivables, inventories
and property, plant and equipment, net of impairment and provisions. Segment liabilities include all operating liabilities and consist principally of trade and bills payable.
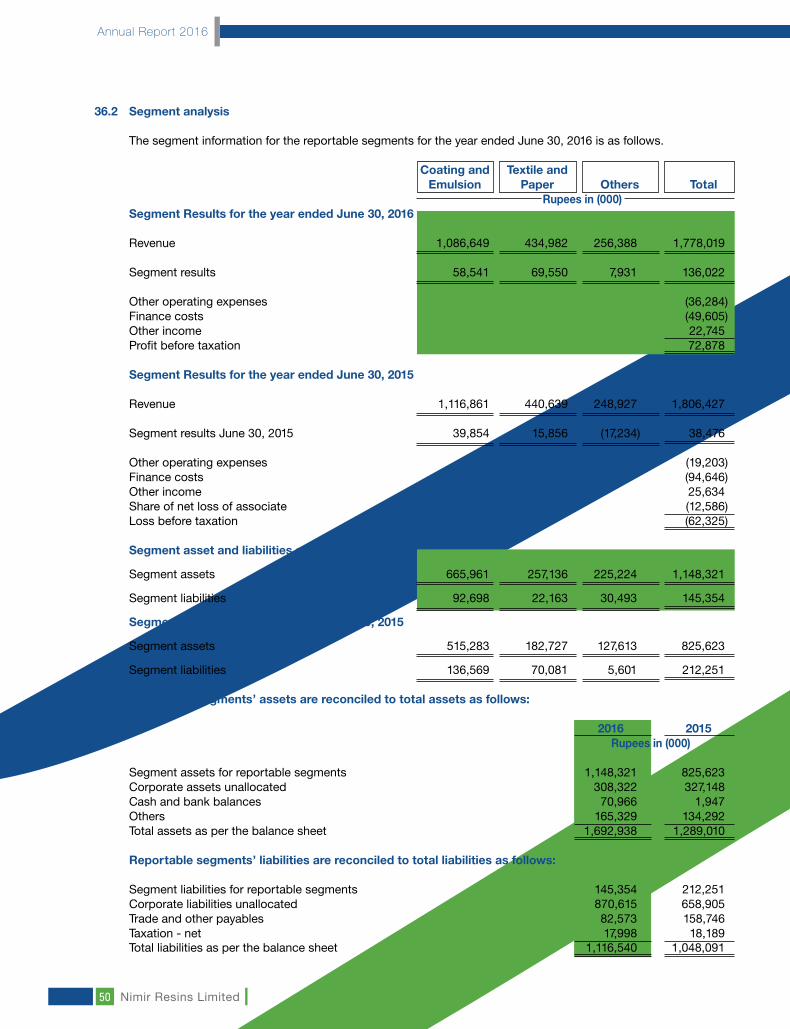
Annual Report 2016
Nimir Resins Limited50
36.2 Segment analysis
The segment information for the reportable segments for the year ended June 30, 2016 is as follows.
Coating and Textile and Emulsion Paper Others Total Rupees in (000)
Segment Results for the year ended June 30, 2016 Revenue 1,086,649 434,982 256,388 1,778,019
Segment results 58,541 69,550 7,931 136,022
Other operating expenses (36,284) Finance costs (49,605) Other income 22,745 Profit before taxation 72,878
Segment Results for the year ended June 30, 2015 Revenue 1,116,861 440,639 248,927 1,806,427
Segment results June 30, 2015 39,854 15,856 (17,234) 38,476
Other operating expenses (19,203)
Finance costs (94,646) Other income 25,634 Share of net loss of associate (12,586) Loss before taxation (62,325)
Segment asset and liabilities as at June 30, 2016
Segment assets 665,961 257,136 225,224 1,148,321
Segment liabilities 92,698 22,163 30,493 145,354
Segment asset and liabilities as at June 30, 2015
Segment assets 515,283 182,727 127,613 825,623
Segment liabilities 136,569 70,081 5,601 212,251
Reportable segments’ assets are reconciled to total assets as follows: 2016 2015
Rupees in (000) Segment assets for reportable segments 1,148,321 825,623 Corporate assets unallocated 308,322 327,148 Cash and bank balances 70,966 1,947 Others 165,329 134,292 Total assets as per the balance sheet 1,692,938 1,289,010
Reportable segments’ liabilities are reconciled to total liabilities as follows: Segment liabilities for reportable segments 145,354 212,251
Corporate liabilities unallocated 870,615 658,905 Trade and other payables 82,573 158,746 Taxation - net 17,998 18,189 Total liabilities as per the balance sheet 1,116,540 1,048,091

www.nimir.com.pk
Annual Report 2016
51
36.3 Entity-wide disclosures regarding reportable segment are as follows:
– Information about products
One product of the Company comprises 14.24% (2015: 12.53%) of total sales for the year.
– Information about major customers
One customer of the Company accounts for 16.45% (2015: 16.97%) of total sales for the year. Revenue from such customer was Rs. 292.42 million (2015: Rs. 355.93 million).
– Information about geographical area
– All non-current assets of the Company are located in Pakistan as at the reporting date.
37. Financial Risk Management 37.1 Financial risk factors
The Company’s activities expose it to a variety of financial risks: market risk (including currency risk, other price risk and interest rate risk), credit risk and liquidity risk. The Company’s overall risk management policies focus on the unpredictability of financial markets and seek to minimize potential adverse effects on the financial performance. Risk management is carried out by the Board of Directors (the Board). The Board provides principles for overall risk management as well as policies covering specific areas such as currency risk, other price risk, interest rate risk, credit risk and liquidity risk.
(a) Market risk Market risk is the risk that the fair value of future cash flows of a financial instrument will fluctuate because of changes in foreign currency, interest rate, commodity price and equity price that will effect the Company’s income or the value of its holdings of financial instruments.
(i) Currency risk Currency risk is the risk that the fair value or future cash flows of a financial instrument will fluctuate because of changes in foreign exchange rates. Currency risk arises mainly from future commercial transactions or receivables and payables that exist due to transactions in foreign currencies. The Company is exposed to currency risk arising from various currency exposures, primarily with respect to foreign receivables and payables. Currently, the Company’s foreign exchange risk exposure is restricted to the amounts payable to foreign entities. The Company is not exposed to currency risk (2015: Rs. 79.023 million).
(ii) Other price risk Other price risk represents the risk that the fair value or future cash flows of a financial instrument will fluctuate because of changes in market prices (other than those arising from interest rate risk or currency risk), whether those changes are caused by factors specific to the individual financial instrument or its issuer, or factors affecting all similar financial instrument traded in the market. The Company is not exposed to equity price risk.
(iii) Interest rate risk
This represents the risk that the fair value or future cash flows of a financial instrument will fluctuate because of changes in market interest rates.
The Company has no significant long-term interest-bearing asset. The Company’s interest rate risk arises from short term borrowings. As the borrowings are obtained at variable rates, these expose the Company to cash flow interest rate risk.
As at the balance sheet date, the interest rate profile of the Company’s interest bearing financial instruments was
as follows:

Annual Report 2016
Nimir Resins Limited52
2016 2015 Floating rate instruments Rupees Rupees
Financial liabilities Long term financing – 179,333,333
Long term financing from director 99,248,678 31,610,558 Short term borrowings 771,366,069 479,571,170
Financial assets
Bank balances - saving accounts 1,312,344 1,880,675
Cash flow sensitivity analysis for variable rate instruments If interest rates at the balance sheet date fluctuate by 1% higher / lower with all other variables held constant, profit before taxation for the year would have been Rs. 7.701 million (2015: Rs. 6.570 million) lower / higher, mainly as a result of higher / lower interest expense on floating rate borrowings. This analysis is prepared assuming that amounts of assets and liabilities outstanding as at the balance sheet date are outstanding for the whole year.
(b) Credit risk Credit risk represents the risk that one party to a financial instrument will cause a financial loss for the other party by failing to discharge an obligation. Carrying amounts of financial assets represent the maximum credit exposure. The maximum exposure to credit risk at the reporting date was as follows: 2016 2015
Rupees in (000) Long term deposits 7,649,956 7,649,956 Trade debts 404,114,867 321,961,579 Other receivables 10,151,623 7,943,485 Bank balances 70,725,887 1,947,185
The aging of trade debts as at balance sheet date is as follows: Past due 1 - 30 days 134,913,341 99,854,596
Past due 31 - 60 days 119,650,249 105,788,975 Past due 61 - 120 days 46,280,566 23,789,489 More than 120 days 103,270,711 92,528,519
404,114,867 321,961,579
The Company believes that it is not exposed to major concentration of credit risk as its exposure is spread over a large number of counter parties and trade debts are subject to specific credit ceilings based on customer credit history. The credit quality of bank balances that are neither past due nor impaired can be assessed by reference to external credit ratings (if available) or to historical information about counterparty default rate:
Rating Rating Short term Long term Agency 2016 2015
Rupees Rupees Habib Metropolitan Bank Limited A1+ AA+ PACRA 18,994,962 192,780 Bank Al-Habib Limited A1+ AA+ PACRA 22,776,717 1,754,405 Habib Bank Limited A1+ AAA JCR-VIS 5,000 The Bank of Punjab A1+ AA- PACRA 3,173,479 – Albaraka Bank (Pakistan) Limited A1 A PACRA 2,989,388 – Meezan Bank Limited A1+ AA JCR-VIS 22,786,341 –
70,725,887 1,947,185

www.nimir.com.pk
Annual Report 2016
53
Due to the Company’s long standing business relationships with these counterparties and after giving due consideration to their strong financial standing, the management does not expect non-performance by these counter parties on their obligations to the Company. Accordingly, the credit risk is minimal.
(c) Liquidity risk Liquidity risk is the risk that an entity will encounter difficulty in meeting obligations associated with financial liabilities. The Company manages liquidity risk by maintaining sufficient cash and the availability of funding through an adequate amount of committed credit facilities. As at the balance sheet date, the Company had Rs. 444 million (2015: Rs. 796 million) worth unutilized short term borrowing limits available from financial institutions and Rs. 70.726 million (2015: Rs. 1.947 million) cash and bank balances. Following are the contractual maturities of financial liabilities, including interest payments.
Contractual maturities of financial liabilities as at June 30, 2016:
Description Carrying Contractual Within 1 1-2 2-5 Above 5 Amount cash flows year Years Years Years
Rupees
Long term financing from director 99,248,678 – – 99,248,678 – – Trade and other payables 158,227,172 158,227,172 158,227,172 – – – Accrued mark up 9,806,364 9,806,364 9,806,364 – – – Short term borrowings 771,366,069 832,876,788 832,876,788 – – – 1,038,648,283 1,000,910,324 1,000,910,324 99,248,678 – – Contractual maturities of financial liabilities as at June 30, 2015:
Description Carrying Contractual Within 1 1-2 2-5 Above 5 Amount cash flows year Years Years Years
Rupees
Long term financing 179,333,333 204,500,226 107,614,509 96,885,717 – – Long term financing from director 31,610,558 – – – 31,610,558 Trade and other payables 144,851,887 144,851,887 144,851,887 – – – Accrued mark up 14,485,877 14,485,877 14,485,877 – – – Short term borrowings 479,571,170 523,253,341 523,253,341 – – – 849,852,825 887,091,331 790,205,614 96,885,717 31,610,558 –
The contractual cash flows relating to the above financial liabilities have been determined on the basis of interest rates / mark up rates effective as at June 30, 2016. The rates of interest / mark up have been disclosed in relevant notes to these financial statements.
(d) Fair value of financial instruments Fair value is an amount for which an asset could be exchanged, or a liability settled, between knowledgeable willing parties in an arm’s length transaction. Consequently, differences may arise between the carrying value and the fair value estimates. As at June 30, 2016 the net fair value of all financial assets and financial liabilities are estimated to approximate their carrying values.
Financial assets which are tradable in an open market are revalued at the market prices prevailing on the balance sheet date. The fair values of all other financial assets and liabilities are not considered to be significantly different from their carrying values.
The Company classifies the financial instruments measured in the balance sheet at fair value in accordance with
the following fair value measurement hierarchy:
Level 1 Quoted market prices Level 2 Valuation techniques (market observable) Level 3 Valuation techniques (non market observable)
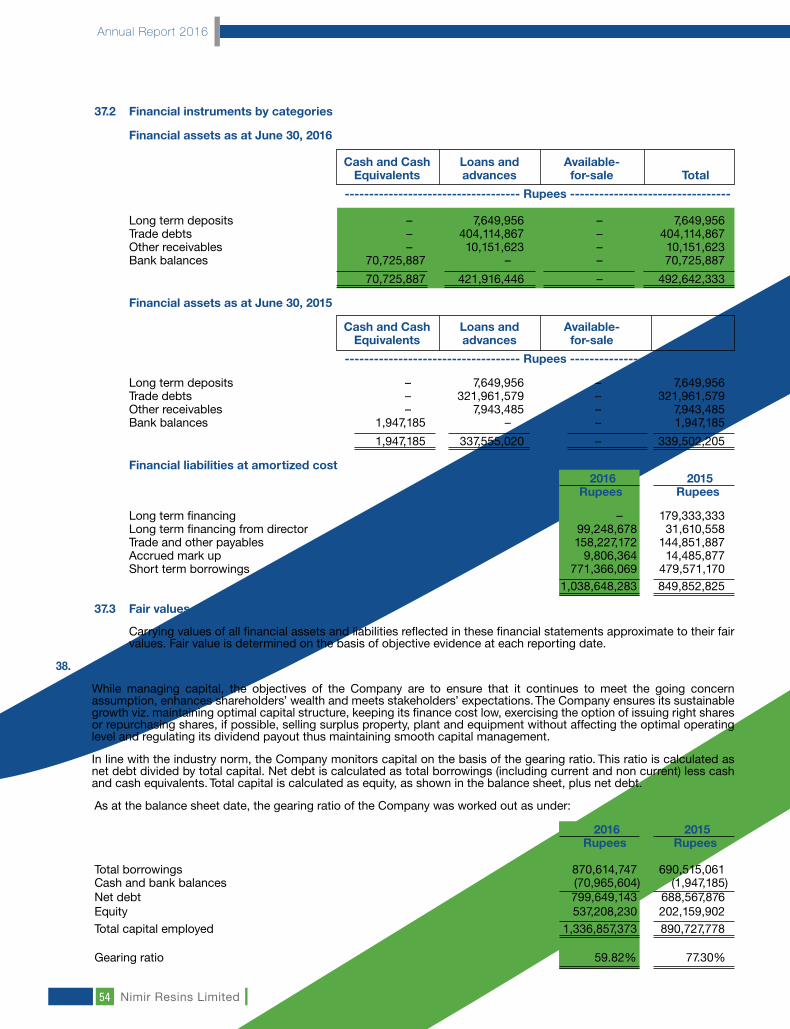
Annual Report 2016
Nimir Resins Limited54
37.2 Financial instruments by categories
Financial assets as at June 30, 2016
Cash and Cash Loans and Available- Equivalents advances for-sale Total ------------------------------------ Rupees ---------------------------------
Long term deposits – 7,649,956 – 7,649,956 Trade debts – 404,114,867 – 404,114,867 Other receivables – 10,151,623 – 10,151,623 Bank balances 70,725,887 – – 70,725,887
70,725,887 421,916,446 – 492,642,333
Financial assets as at June 30, 2015
Cash and Cash Loans and Available- Equivalents advances for-sale Total ------------------------------------ Rupees ---------------------------------
Long term deposits – 7,649,956 – 7,649,956
Trade debts – 321,961,579 – 321,961,579 Other receivables – 7,943,485 – 7,943,485 Bank balances 1,947,185 – – 1,947,185
1,947,185 337,555,020 – 339,502,205
Financial liabilities at amortized cost 2016 2015
Rupees Rupees
Long term financing – 179,333,333 Long term financing from director 99,248,678 31,610,558 Trade and other payables 158,227,172 144,851,887 Accrued mark up 9,806,364 14,485,877 Short term borrowings 771,366,069 479,571,170 1,038,648,283 849,852,825 37.3 Fair values of financial assets and liabilities
Carrying values of all financial assets and liabilities reflected in these financial statements approximate to their fair
values. Fair value is determined on the basis of objective evidence at each reporting date.
38. Capital Risk Management
While managing capital, the objectives of the Company are to ensure that it continues to meet the going concern assumption, enhances shareholders’ wealth and meets stakeholders’ expectations. The Company ensures its sustainable growth viz. maintaining optimal capital structure, keeping its finance cost low, exercising the option of issuing right shares or repurchasing shares, if possible, selling surplus property, plant and equipment without affecting the optimal operating level and regulating its dividend payout thus maintaining smooth capital management.
In line with the industry norm, the Company monitors capital on the basis of the gearing ratio. This ratio is calculated as net debt divided by total capital. Net debt is calculated as total borrowings (including current and non current) less cash and cash equivalents. Total capital is calculated as equity, as shown in the balance sheet, plus net debt. As at the balance sheet date, the gearing ratio of the Company was worked out as under:
2016 2015 Rupees Rupees
Total borrowings 870,614,747 690,515,061 Cash and bank balances (70,965,604) (1,947,185)Net debt 799,649,143 688,567,876 Equity 537,208,230 202,159,902 Total capital employed 1,336,857,373 890,727,778
Gearing ratio 59.82% 77.30%

www.nimir.com.pk
Annual Report 2016
55
39. Plant Capacity and Production 2016 2015
Metric Ton Metric Ton
Actual production 18,861 14,487
The plant production capacity is indeterminable because it is a multi-product plant involving varying processes of manufacturing.
40. Provident Fund Related Disclosures
The Company runs a recognized provident fund (Descon Chemicals Limited Staff Provident Fund Trust) established on April 30, 1987 in which equal contributions are made by the Company and employees. The fund has been formed to accumulate certain sums to the benefit of employees of Nimir Resins Limited (Formerly Descon Chemicals Limited) and their families in the event of employees’ termination of service, retirement or death as provided by the fund rules. Following information is based on un-audited financials of the Fund: Note 2016 2015
Rupees Rupees
Total assets of the fund 39,411,463 52,182,235 Fair value of the investments 40.2 28,086,020 37,753,440
Investments as a percentage of total assets 71.26% 72.35% 40.1 The cost of above investments amount to Rs. 24.686 million (2015: Rs. 33.19 million).
40.2 The break-up of fair value of investments is as follows:
2016 2015 2016 2015 Percentage Percentage Rupees Rupees
- Listed securities 24.57% 26.03% 9,685,566 13,567,917 - GOP Treasury Bills 25.37% 1.91% 10,000,000 993,190 - National Saving Certificates 11.99% 9.07% 4,725,000 4,725,000 - GOP - PIBs 9.33% 35.44% 3,675,454 18,467,332
71.26% 72.45% 28,086,020 37,753,439 40.2.1 These investments have been made in accordance with the provisions of Section 227 of the Companies Ordinance,
1984 and the rules formulated for that purpose.
41. Number of Employees 2016 2015 Number Number Employees as at June 30, - Permanent 104 146 - Contractual 10 20
Average employees during the year - Permanent 125 151 - Contractual 15 22
42. Subsequent Event
The Company is in the process of issuing of 77 million ordinary shares as right shares at a price of Rs. 5 per share (i.e., at par value), subsequent to year ended June 30, 2016 (refer to Note 12.3).
43. Authorization of Financial Statements
These financial statements were authorized for issue on Friday, September 9, 2016 by the Board of Directors of the Company.

Annual Report 2016
Nimir Resins Limited56
44. General
Comparative figures are re-arranged / reclassified, wherever necessary, to facilitate comparison. Following re-arrangements / reclassifications have been made in these financial statements for better presentation: Nature From To Amount (Rupees)
Balance receivable Short Term Prepayments and Short Term Prepayments and from associated Other Receivables (Note-10) Other Receivables (Note-10) companies Due from associates / related parties Other receivables 7,943,485
Oil for generators Cost of Sales (Note-25) Cost of Sales (Note-25) Stores and spares consumed Fuel and power 12,868,505
Issuance of store Cost of Sales (Note-25) Cost of Sales (Note-25) related items i) Chemicals consumed Stores and spares consumed 1,750,726 ii) Packing materials consumed Stores and spares consumed 1,281,095 Amortization of Cost of Sales (Note-25) Administrative Expenses (Note-27) intangible Amortization Amortization 3,493,507
Vehicle running and Administrative Expenses (Note-27) Administrative Expenses (Note-27) entertainment cost i) Vehicles’ running cost Travelling, conveyance and 1,953,086 ii) Entertainment entertainment 257,972
Travelling and Distribution Cost (Note-26) Distribution Cost (Note-26) vehicle running cost i) Vehicles’ running cost Travelling, conveyance and 3,077,283 ii) Entertainment entertainment 119,252
Advertisement Distribution Cost (Note-26) Administrative Expenses (Note-27) expense Advertisement Advertisement 100,560
Water and gas Distribution Cost (Note-26) Distribution Cost (Note-26) charges Water and gas charges Utilities 39,579
Deferred revenue Current portion of deferred revenue Equity portion of sponsors interest (Face of the balance sheet) free loan 7,340,762
Deferred revenue Non current portion of Deferred Equity portion of sponsors interest revenue (Face of the balance sheet) free loan 1,048,680
CHIEF EXECUTIVE OFFICER DIRCETOR

www.nimir.com.pk
Annual Report 2016
57
------Shareholding------ No. of Shareholders From To Total Shares Held 780 1 100 27,083 745 101 500 246,318 711 501 1,000 639,417 1,101 1,001 5,000 3,319,725 375 5,001 10,000 3,214,262 146 10,001 15,000 1,955,556 95 15,001 20,000 1,798,192 81 20,001 25,000 1,941,689 36 25,001 30,000 1,042,420 21 30,001 35,000 714,100 17 35,001 40,000 670,500 16 40,001 45,000 700,195 49 45,001 50,000 2,435,104 11 50,001 55,000 586,500 19 55,001 60,000 1,124,528 10 60,001 65,000 637,500 4 65,001 70,000 274,000 8 70,001 75,000 598,650 6 75,001 80,000 469,000 4 80,001 85,000 326,000 1 85,001 90,000 89,500 2 90,001 95,000 183,000 36 95,001 100,000 3,597,500 1 100,001 105,000 105,000 2 105,001 110,000 220,000 1 110,001 115,000 111,500 4 115,001 120,000 474,000 4 120,001 125,000 496,105 4 125,001 130,000 519,000 1 130,001 135,000 134,000 2 135,001 140,000 278,000 9 145,001 150,000 1,350,000 1 150,001 155,000 155,000 2 155,001 160,000 315,000 2 160,001 165,000 326,500 3 170,001 175,000 523,500 7 195,001 200,000 1,400,000 1 210,001 215,000 211,500 2 220,001 225,000 449,000 1 225,001 230,000 227,000 3 245,001 250,000 750,000 1 295,001 300,000 300,000 1 305,001 310,000 308,097 1 320,001 325,000 325,000 1 370,001 375,000 371,000 1 395,001 400,000 400,000 1 445,001 450,000 450,000 1 465,001 470,000 468,895 1 485,001 490,000 490,000 4 495,001 500,000 2,000,000 1 520,001 525,000 524,000 1 595,001 600,000 600,000 1 615,001 620,000 619,500 1 680,001 685,000 685,000 2 695,001 700,000 1,400,000 1 715,001 720,000 720,000 1 890,001 895,000 894,554 1 990,001 995,000 992,500 2 995,001 1,000,000 2,000,000 1 1,260,001 1,265,000 1,264,000 1 1,595,001 1,600,000 1,600,000 1 2,900,001 2,905,000 2,905,000
PATTERN OF SHAREHOLDINGAS AT JUNE 30, 2016

Annual Report 2016
Nimir Resins Limited58
------Shareholding------ No. of Shareholders From To Total Shares Held
1 3,575,001 3,580,000 3,575,268 1 8,495,001 8,500,000 8,498,219 1 8,945,001 8,950,000 8,945,479 1 22,810,001 22,815,000 22,810,993 1 101,770,001 101,775,000 101,774,507
4,355 199,557,856
CATEGORIES OF SHAREHOLDERS AS AT JUNE 30, 2016
Sr. No. Categories of shareholders Shares held Percentage 1 Directors, Chief Executive Officers and their spouse and minor childern 13,005,646 6.5172 2 Associated Companies, undertakings and related parties. (Parent Company) 124,585,500 62.4308 3 NIT and ICP 9,813 0.0049 4 Banks Development Financial Institutions, Non Banking Financial Institutions. 2,210 0.0011 5 Insurance Companies – 0.0000 6 Modarabas and Mutual Funds 468,953 0.2350 7 General Public
1. Local 48,564,541 24.3361 2. Foreign – 0.0000 8 Others (to be specified)
1. Joint Stock Companies 12,856,123 6.4423 2. Investment Companies 796 0.0004 3. Pension Funds 47,604 0.0239 4. Others 16,670 0.0084
199,557,856 100.0000
SHARE HOLDERS HOLDING 10% OR MORE
Sr. No. Categories of shareholders Shares held Percentage
1 Nimir Management (Pvt.) Limited 101,774,507 51.0000
2 Nimir Holding (Pvt.) Limited 22,810,993 11.4308
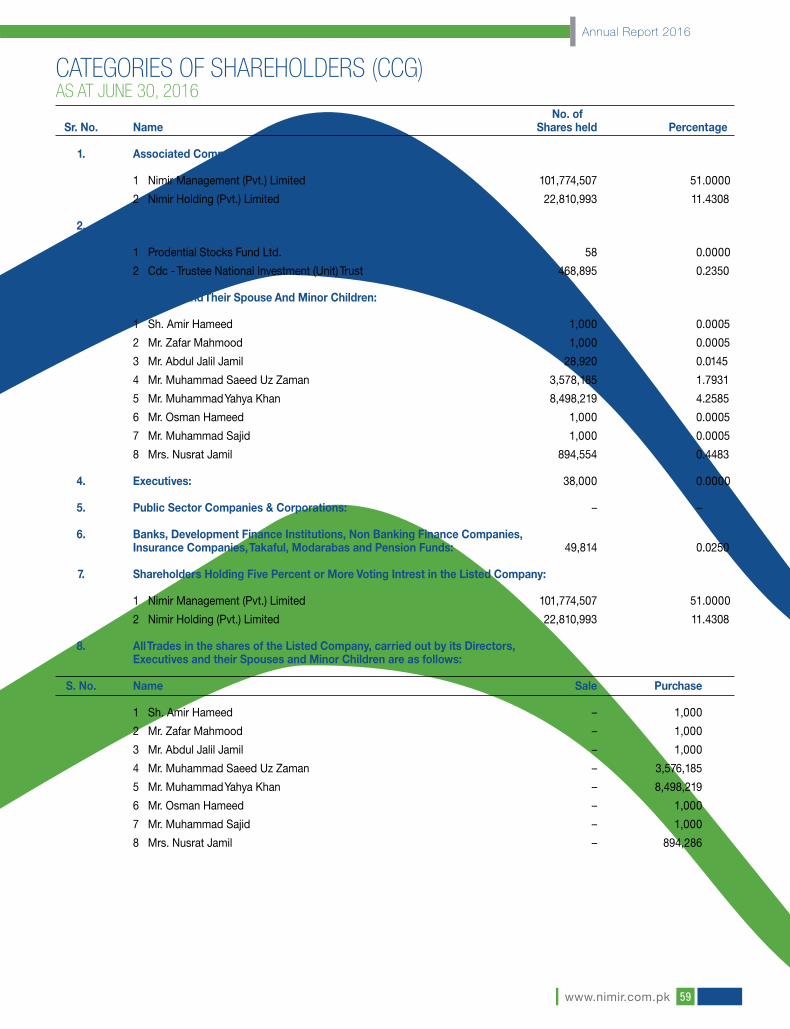
www.nimir.com.pk
Annual Report 2016
59
No. of Sr. No. Name Shares held Percentage 1. Associated Companies, Undertakings and Related Parties:
1 Nimir Management (Pvt.) Limited 101,774,507 51.0000
2 Nimir Holding (Pvt.) Limited 22,810,993 11.4308 2. Mutual Funds:
1 Prodential Stocks Fund Ltd. 58 0.0000
2 Cdc - Trustee National Investment (Unit) Trust 468,895 0.2350 3. Directors And Their Spouse And Minor Children:
1 Sh. Amir Hameed 1,000 0.0005
2 Mr. Zafar Mahmood 1,000 0.0005
3 Mr. Abdul Jalil Jamil 28,920 0.0145
4 Mr. Muhammad Saeed Uz Zaman 3,578,185 1.7931
5 Mr. Muhammad Yahya Khan 8,498,219 4.2585
6 Mr. Osman Hameed 1,000 0.0005
7 Mr. Muhammad Sajid 1,000 0.0005
8 Mrs. Nusrat Jamil 894,554 0.4483 4. Executives: 38,000 0.0000 5. Public Sector Companies & Corporations: – – 6. Banks, Development Finance Institutions, Non Banking Finance Companies, Insurance Companies, Takaful, Modarabas and Pension Funds: 49,814 0.0250 7. Shareholders Holding Five Percent or More Voting Intrest in the Listed Company: 1 Nimir Management (Pvt.) Limited 101,774,507 51.0000
2 Nimir Holding (Pvt.) Limited 22,810,993 11.4308 8. All Trades in the shares of the Listed Company, carried out by its Directors, Executives and their Spouses and Minor Children are as follows: S. No. Name Sale Purchase
1 Sh. Amir Hameed – 1,000
2 Mr. Zafar Mahmood – 1,000
3 Mr. Abdul Jalil Jamil – 1,000
4 Mr. Muhammad Saeed Uz Zaman – 3,576,185
5 Mr. Muhammad Yahya Khan – 8,498,219
6 Mr. Osman Hameed – 1,000
7 Mr. Muhammad Sajid – 1,000
8 Mrs. Nusrat Jamil – 894,286
CATEGORIES OF SHAREHOLDERS (CCG)AS AT JUNE 30, 2016

Annual Report 2016
Nimir Resins Limited60
TO ALL MEMBERS OF THE COMPANY
Dear Sir / Madam,
This is to inform you that the Board of Directors in their meeting held on September 9, 2016 has fixed the remuneration
of Chief Executive Officer (CEO) and Executive Director of the Company. In pursuant of Section 218 of the Companies
Ordinance, 1984, this is to inform you that the terms and conditions of Chief Executive Officer (CEO) and Executive
Director of the Company are in accordance with their terms of service with the Company policy.
The Board of Directors had decided the remuneration of CEO and Executive directors for which the following resolutions
were passed:
Resolved that “to consider and approve the sharing of up to Rs. 1.14 million per annum of the remuneration
of Chief Executive Officer of the Company with associated Company i.e. Nimir Industrial Chemicals Limited, as
approved by the board in addition to the existing, travelling, entertainment and other incidentals relating to his
office in accordance with the Company policy.”
Chief Executive Officer, being interested did not participate in this resolution
Further Resolved “to consider and approve the annual remuneration of Executive Director of the Company to Rs.
3.6 million per annum exclusive of perquisites, bonus, company maintained car and other incidentals relating to
their office in accordance with the Company policy.”
The Executive director being interested did not participate in this resolution.
Yours faithfully,
For Nimir Resins Limited(Formerly Descon Chemicals Ltd.)
Lahore Muhammad Inam-ur-RahimSeptember 9, 2016 Company Secretary
STATEMENT PURSUANT TO SECTION 218COMPANIES ORDINACE, 1984
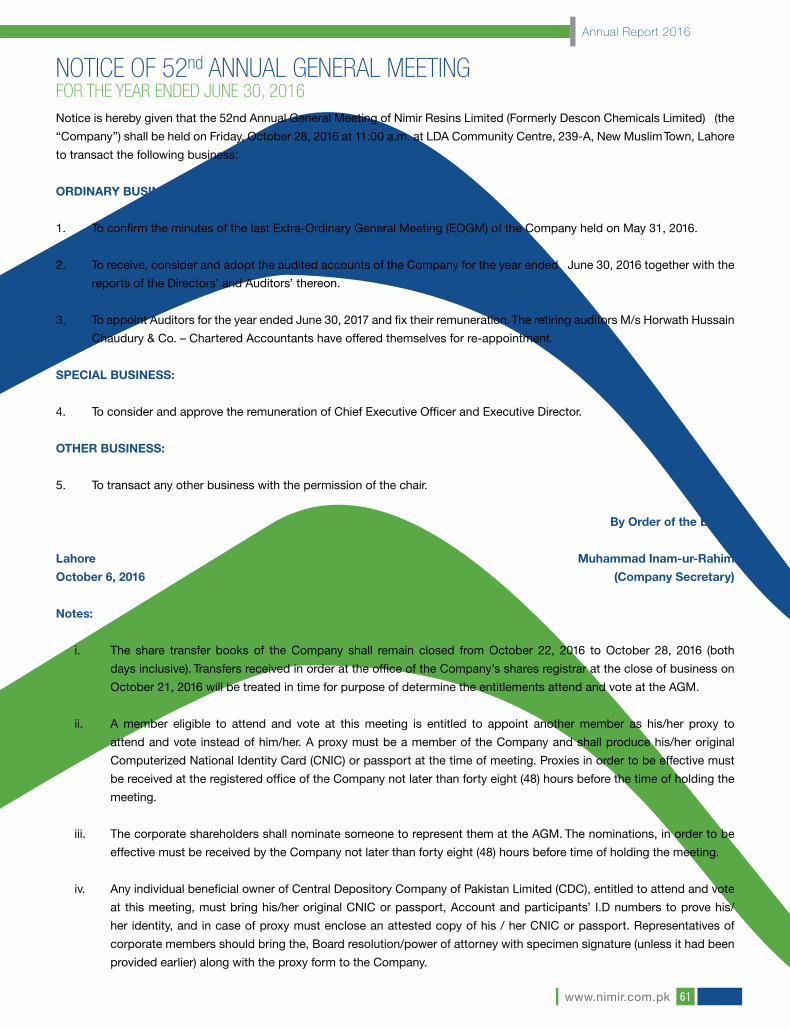
www.nimir.com.pk
Annual Report 2016
61
Notice is hereby given that the 52nd Annual General Meeting of Nimir Resins Limited (Formerly Descon Chemicals Limited) (the
“Company”) shall be held on Friday, October 28, 2016 at 11:00 a.m. at LDA Community Centre, 239-A, New Muslim Town, Lahore
to transact the following business:
ORDINARY BUSINESS:
1. To confirm the minutes of the last Extra-Ordinary General Meeting (EOGM) of the Company held on May 31, 2016.
2. To receive, consider and adopt the audited accounts of the Company for the year ended June 30, 2016 together with the
reports of the Directors’ and Auditors’ thereon.
3. To appoint Auditors for the year ended June 30, 2017 and fix their remuneration. The retiring auditors M/s Horwath Hussain
Chaudury & Co. – Chartered Accountants have offered themselves for re-appointment.
SPECIAL BUSINESS:
4. To consider and approve the remuneration of Chief Executive Officer and Executive Director.
OTHER BUSINESS:
5. To transact any other business with the permission of the chair.
By Order of the Board
Lahore Muhammad Inam-ur-RahimOctober 6, 2016 (Company Secretary)
Notes:
i. The share transfer books of the Company shall remain closed from October 22, 2016 to October 28, 2016 (both
days inclusive). Transfers received in order at the office of the Company’s shares registrar at the close of business on
October 21, 2016 will be treated in time for purpose of determine the entitlements attend and vote at the AGM.
ii. A member eligible to attend and vote at this meeting is entitled to appoint another member as his/her proxy to
attend and vote instead of him/her. A proxy must be a member of the Company and shall produce his/her original
Computerized National Identity Card (CNIC) or passport at the time of meeting. Proxies in order to be effective must
be received at the registered office of the Company not later than forty eight (48) hours before the time of holding the
meeting.
iii. The corporate shareholders shall nominate someone to represent them at the AGM. The nominations, in order to be
effective must be received by the Company not later than forty eight (48) hours before time of holding the meeting.
iv. Any individual beneficial owner of Central Depository Company of Pakistan Limited (CDC), entitled to attend and vote
at this meeting, must bring his/her original CNIC or passport, Account and participants’ I.D numbers to prove his/
her identity, and in case of proxy must enclose an attested copy of his / her CNIC or passport. Representatives of
corporate members should bring the, Board resolution/power of attorney with specimen signature (unless it had been
provided earlier) along with the proxy form to the Company.
NOTICE OF 52nd ANNUAL GENERAL MEETINGFOR THE YEAR ENDED JUNE 30, 2016
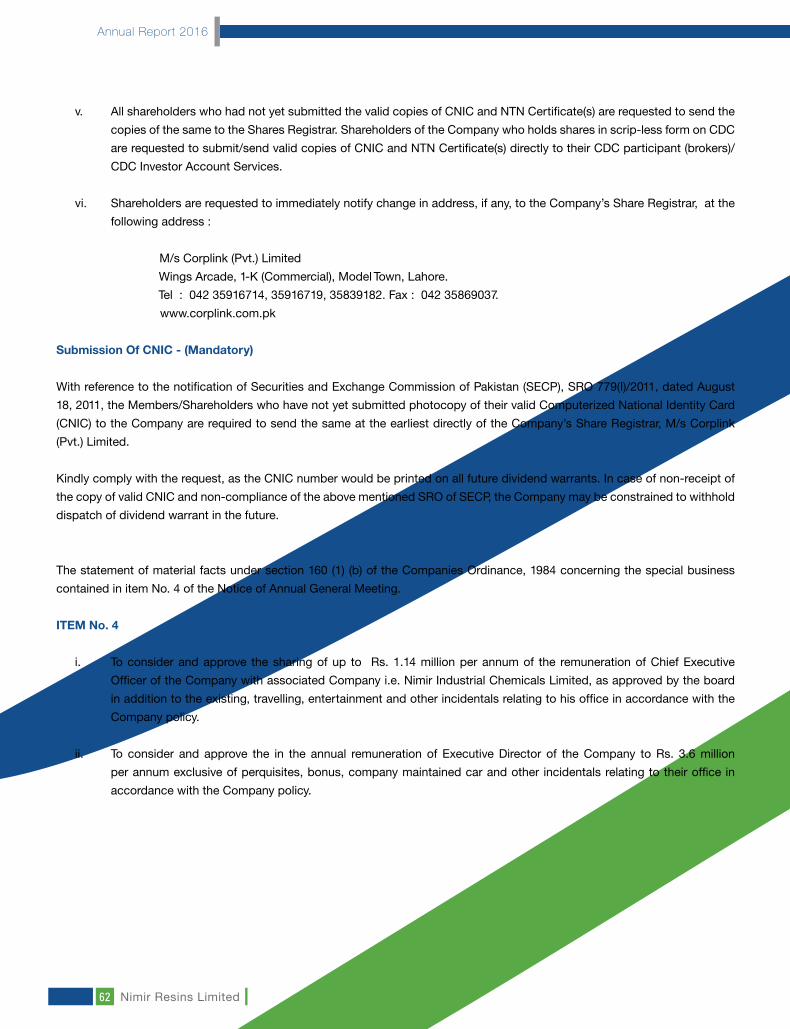
Annual Report 2016
Nimir Resins Limited62
v. All shareholders who had not yet submitted the valid copies of CNIC and NTN Certificate(s) are requested to send the
copies of the same to the Shares Registrar. Shareholders of the Company who holds shares in scrip-less form on CDC
are requested to submit/send valid copies of CNIC and NTN Certificate(s) directly to their CDC participant (brokers)/
CDC Investor Account Services.
vi. Shareholders are requested to immediately notify change in address, if any, to the Company’s Share Registrar, at the
following address :
M/s Corplink (Pvt.) Limited
Wings Arcade, 1-K (Commercial), Model Town, Lahore.
Tel : 042 35916714, 35916719, 35839182. Fax : 042 35869037.
www.corplink.com.pk
Submission Of CNIC - (Mandatory)
With reference to the notification of Securities and Exchange Commission of Pakistan (SECP), SRO 779(I)/2011, dated August
18, 2011, the Members/Shareholders who have not yet submitted photocopy of their valid Computerized National Identity Card
(CNIC) to the Company are required to send the same at the earliest directly of the Company’s Share Registrar, M/s Corplink
(Pvt.) Limited.
Kindly comply with the request, as the CNIC number would be printed on all future dividend warrants. In case of non-receipt of
the copy of valid CNIC and non-compliance of the above mentioned SRO of SECP, the Company may be constrained to withhold
dispatch of dividend warrant in the future.
The statement of material facts under section 160 (1) (b) of the Companies Ordinance, 1984 concerning the special business
contained in item No. 4 of the Notice of Annual General Meeting.
ITEM No. 4
i. To consider and approve the sharing of up to Rs. 1.14 million per annum of the remuneration of Chief Executive
Officer of the Company with associated Company i.e. Nimir Industrial Chemicals Limited, as approved by the board
in addition to the existing, travelling, entertainment and other incidentals relating to his office in accordance with the
Company policy.
ii. To consider and approve the in the annual remuneration of Executive Director of the Company to Rs. 3.6 million
per annum exclusive of perquisites, bonus, company maintained car and other incidentals relating to their office in
accordance with the Company policy.

www.nimir.com.pk
Annual Report 2016
63

Annual Report 2016
Nimir Resins Limited64
Posted Stamp
NIMIR RESINS LIMIETD(Formerly Descon Chemicals Ltd.)
14.5 K.M. Lahore – Sheikhupura Road,Lahore, Pakistan.Tel: 042 379715-12-14www.nimir.com.pk