COMMUNITY SATISFACTION BENCHMARKING RESEARCH REPORT …
235
Douglas Shire Customer Satisfaction Survey 2017 MARKET FACTS (QLD) PTY LTD 1 COMMUNITY SATISFACTION BENCHMARKING RESEARCH REPORT FOR DOUGLAS SHIRE COUNCIL SEPTEMBER 2017
Transcript of COMMUNITY SATISFACTION BENCHMARKING RESEARCH REPORT …

Douglas Shire Customer Satisfaction Survey 2017 MARKET FACTS (QLD) PTY LTD 1
COMMUNITY SATISFACTION BENCHMARKING
RESEARCH REPORT
FOR
DOUGLAS SHIRE COUNCIL
SEPTEMBER 2017
Douglas Shire Customer Satisfaction Survey 2017 MARKET FACTS (QLD) PTY LTD 2
TABLE OF CONTENTS
INTRODUCTION 3 Objectives of Survey 3 Themes of Council Responsibility 4 Structured Sample Survey 9 Briefing Material Supplied to Participants 9 Data Processing and Analysis 9 Reliability of the Findings 10
RESPONDENT PROFILE 11 OVERALL PERFORMANCE RATINGS 14
The Unweighted Overall Performance Rating 14 The Sample as a Whole – Direct Questioning 15 ‘Non-participants’ in the Survey 15 The Weighted Aggregated Total Performance Rating 16 COMPARISON OF PERFORMANCE INDICES 17
ANALYSIS OF KEY POINTS 18 Areas of Lowest Performance Relative to Importance 18 Areas of Highest Performance Relative to Importance 19 Areas of Average Performance 20 Areas of Least Importance 21
EVALUATIONS OF TOTAL PERFORMANCE 22 Weighted Performance Indicators 22 Basic Services & Infrastructure 23 Community Lifestyle Services 24 Managing the Shire 25 Customer Service and Communications 26 Qualities of Council 27
COMMUNITY RATINGS OF COUNCIL RESPONSIBILITY AREAS (THEMES) 28 IMPORTANCE 29
Theme 1: Basic Services & Infrastructure IMPORTANCE 29 Theme 2: Community Lifestyle Services IMPORTANCE 36 Theme 3: Managing the Shire IMPORTANCE 43 Theme 4: Customer Service and Communication IMPORTANCE 48 Theme 5: Quality of Council IMPORTANCE 52
PERFORMANCE 54 Theme 1: Basic Services & Infrastructure PERFORMANCE 56 Theme 2: Community Lifestyle Services PERFORMANCE 63 Theme 3: Managing the Shire PERFORMANCE 70 Theme 4: Customer Service and Communication PERFORMANCE 75 Theme 5: Quality of Council PERFORMANCE 79
PUBLIC OPINION QUESTIONS – KEY FINDINGS 83 SUMMARY 100 APPENDIX 107

Douglas Shire Customer Satisfaction Survey 2017 MARKET FACTS (QLD) PTY LTD 3
INTRODUCTION Market Facts, was commissioned by the Douglas Shire Council in March 2017, and conducted a benchmark survey of community attitudes measuring levels of satisfaction with the services provided by Council, in August 2017. This survey also included ‘supplementary questions’ - public opinion measures of a number of other current issues that the Council requires community feedback on. Objectives of Survey The objectives are to: 1. Survey relevant categories of the members of the Douglas Shire Council community, in order
to:
(i) provide measurements of residents’ attitudes and opinions, and (ii) provide diagnostic information and analyses,
regarding the extent to which the Council’s provision of works, facilities and relevant administrative services meets the community’s perceived priorities.
2. Compare the results against the most recent (July 2017) Provincial LGA ‘norms’ established by
the LGAQ’s biennial surveys. 3. Provide number-based detail which can be used to calculate relative priorities between the 42
primary policy areas for which Council is responsible according to the “weighted averages” of community perceptions, after taking into account both existing Council Performance as well as basic community priorities (i.e. ratings for Importance).

Douglas Shire Customer Satisfaction Survey 2017 MARKET FACTS (QLD) PTY LTD 4
Themes of Council Responsibility At the core of the benchmarking process is the evaluation by residents in the community of the broad array of council responsibilities (services and activities), divided into five Themes. These Themes are: Areas of Council Responsibility
THEME (1) Basic Services and Infrastructure
Function/Responsibility Examples/Clarification
Road Construction Constructing new or upgrading existing roads
Road Maintenance Repairing potholes and damaged road shoulders; street sweeping and verge mowing
Footpaths, Kerbing & Guttering Construction and maintenance of safe footpaths, kerbs and gutters
Street Lighting Funding the provision and upkeep of lights on Council streets/roads
Traffic Management Traffic planning, traffic lights, roundabouts, traffic `calming' and directional signage
Parking Facilities Establishing parking policies, parking control, provision of or assessment of requirement for on and off-street parking
Water Supply Supply of water to meet reasonable standards of Quantity (volume, pressure, continuity) and Quality (colour, odour, taste, softness)
Sewerage Provision of sewerage system with adequate standards of effluent discharge, odour control and operating efficiency
Public Transport Either providing or ensuring the provision of an adequate system of public transport
Drainage & Flood Mitigation Construction and maintenance of open and underground stormwater drains, levee banks, division channels etc
Waste Management Garbage collection and disposal, waste minimisation (recycling and composting), street bins
Community Health Inspection of restaurants/cafés/shops, mosquito/midge spraying, cemeteries

Douglas Shire Customer Satisfaction Survey 2017 MARKET FACTS (QLD) PTY LTD 5
THEME (2) Community Lifestyle Services
Function/Responsibility Examples/Clarification
Parks, Playgrounds & Public Amenities
Development and maintenance of open space areas, parks, children's play-grounds and public toilets
Environmental Controls Enforcement of regulations on air, water and noise
pollution
Environmental Protection & Conservation
Tree planting, bushland acquisition, noxious weeds eradication, foreshore protection, preservation of natural areas.
Heritage Protection Preservation of historic buildings, monuments,
facilities, artefacts, and indigenous & other records
Sporting & Recreational Facilities Public swimming pools, sports-fields, land and/or
support for clubs & their facilities
Cultural & Entertainment Facilities Civic centre, public halls, art gallery/museum,
community arts programs, community festivals
Libraries & Other Information Access
Public library, Internet access, CD ROM's
Community Safety Safety action plans, safety audits, signage, security
patrols & cameras, beach & pool lifeguards, community education & awareness programs
Community Services Programs and facilities that meet the needs of a range of stakeholder groups (such as senior citizens, young people, families, indigenous, disabled, non-English speaking background)
Pet / Animal Control Registration, impounding of strays, control of feral
animals
Shopping Centres Ensuring the provision of adequate shopping
facilities to meet the needs and convenience of local residents
Community Development Working with (& supporting) community
organisations and special-interest groups to develop strong, sustainable & self-reliant communities

Douglas Shire Customer Satisfaction Survey 2017 MARKET FACTS (QLD) PTY LTD 6
THEME (3) Managing the Shire
Function/Responsibility Examples/Clarification
Town Planning Planning and zoning for the purposes of residential, rural, commercial, industrial, recreational, open space & public infrastructure development including urban renewal & CBD redevelopment, rules regarding land usage
Building Control Development and building approvals & controls, building & plumbing inspections, swimming pool fencing
Economic Development & Local Employment
Promoting/supporting increased economic activity and increased local employment opportunities, attracting investment
Development of Tourism Area promotion, tourist information facilities, visitor care programs, caravan parks, promoting/supporting additional tourism activities
Financial Management Responsible, open and accountable management of the Council's finances
Revenue Raising Establishing fair and equitable rating for residential, rural, commercial and other sectors; applying a fair and reasonable balance between income from rates and from user-pays fees and charges
Staff Management Selection of skilled and qualified staff and ongoing training and personal development for Council employees

Douglas Shire Customer Satisfaction Survey 2017 MARKET FACTS (QLD) PTY LTD 7
THEME (4) Customer Services and Communication
Function/Responsibility Examples/Clarification
Customer Service Accessible & adequate facilities for dealing with and
responding to contacts from stakeholders and the general public, handling enquiries / requests / complaints
Information Services Maintaining and updating databases on Council facilities & services including rates & property information, water/sewerage/drainage networks, community services, etc
Informing the Community Keeping the community informed of Council policies,
plans, programs & activities through newsletters & other means, advising of community issues to be debated
Consulting the Community Ensuring community input into Council policies, plans & programs by regularly canvassing residents’ opinions & priorities and by maintaining effective relationships with the broad range of community groups
Responding to the Community Providing feedback on community input, taking action where appropriate to implement community priorities, being accessible to all members of the community including minority groups
Providing Leadership & Advocacy
Representing local community needs & interests to other spheres of government (including government authorities) and to other outside organisations whenever relevant, supporting civic pride & local identity, promoting accountability & best practice

Douglas Shire Customer Satisfaction Survey 2017 MARKET FACTS (QLD) PTY LTD 8
THEME (5) Qualities of Council
Function/Responsibility Examples/Clarification
Elected Council (as a whole) Provides leadership & direction for the community, even-handed, responsive, open & honest
Councillor(s) you deal with Reliable, dedicated, knowledgeable, helpful, readily accessible Managerial & Supervisory
Officers Skilled & capable leaders and managers in control of their responsibilities and their staff
Outdoor Workers Competent, effective, efficient, get things done Indoor Staff Accessible, courteous, helpful, believe in achieving solutions,
effective, efficient, knowledgeable
OVERALL COUNCIL PERFORMANCE
Delivering a level of services and displaying a quality of performance in fulfilling all responsibilities, regarded as ‘value for money’ for the rates and charges you pay

Douglas Shire Customer Satisfaction Survey 2017 MARKET FACTS (QLD) PTY LTD 9
Structured Sample Survey Random telephone calls were made to resident households throughout the Shire, using the Electronic White Pages. These calls identified 300 residents aged 18 years and over who indicated that they were ‘interested in discussing local government issues and expressing an opinion about them’ and who were prepared to participate in the survey. In order to enrol the sample of 300 respondents a total of 3802 attempted and 1592 connected telephone calls were made. Quotas for the telephone survey were taken as follows:
North of Wonga n= 50
Mossman and surrounds
(Including Wonga) n=125
Port Douglas and South n=125 A further 106 respondents were included in the sample who completed the survey online. The total sample size was 406. Of the people we initially actually spoke to 38 were insufficiently interested in local government or were prevented by other constraints from participating but did answer the ratings question. Briefing Material Supplied to Participants After despatching preliminary prompt material to those people who had agreed to participate, follow-up telephone interviews were conducted by appointment. The material sent included the explanation of the ‘Themes of Council Responsibility’ set out on the previous pages, the method of rating for Importance and Performance, and also described the methods of rating. A copy of this questionnaire is included in the Appendix of this report. Data Processing and Analysis The data has not been weighted. As a matter of course the data, after input, was cleaned and logic-checked to ensure error-free detailed tables. All percentages in the tabular output have been rounded to one decimal point. Significance tests have been applied to identify those differences in response among the various subgroups which were highly unlikely to have occurred due to chance. All responses were coded and computer-analysed by the standard breaks of:
Gender
Age Group
Household Situation
Home Ownership
Present Work Status

Douglas Shire Customer Satisfaction Survey 2017 MARKET FACTS (QLD) PTY LTD 10
These breaks were established to enable the identification of significant differences in response patterns among the various community sectors represented by the sub-samples. For all analysis of these standard demographic breaks, and for the local issues tables, we have applied significance tests to the differences between the sub-samples and the total sample. These appear in the tables as:
+++ significantly greater than the sample result at the 99% level of confidence ++ significantly greater than the sample result at the 95% level of confidence + significantly greater than the sample result at the 90% level of confidence - - - significantly lower than the sample result at the 99% level of confidence - - significantly lower than the sample result at the 95% level of confidence - significantly lower than the sample result at the 90% level of confidence
Tables included in this Report only show results for the Total Sample. However, a comprehensive printout of all analyses has been closely examined in compiling the commentary. Average ratings for Importance and Performance were calculated - from which Weighted Performance Indicators were derived for each parameter being rated. These were then combined to provide a Weighted Performance Index for each of the five Themes of Council Responsibility and for Overall Performance on all 42 Areas as a whole. Reliability of the Findings The findings of the survey are obviously subject to Sampling Error. The maximum Probable Error of our total sample is ±3.1% at the 90% level of confidence. Comparisons between categories and subgroups are subject to varying error depending on respondent frequencies and the relative percentages of respondents falling in different response codes. This survey is not designed to deliver definitive findings for individual Council areas. By continuing to use the basic survey instrument and reporting methodology over an extended period of time, data accumulated in the form of ‘norms’ permit ever more accurate and reliable benchmarks to be established.

Douglas Shire Customer Satisfaction Survey 2017 MARKET FACTS (QLD) PTY LTD 11
RESPONDENT PROFILE The following section of the report provides a graphical summary of the demographic profile of the respondents who participated in the survey. The sample averages for the following demographic characteristics are reported, as follows by:
Gender
Age Group
Neighbourhood
Home Ownership
Present Work Status The following profile of the survey respondents in Douglas Shire Council is important as it provides an overview of the community members who have provided their opinion and perceptions about Council in the following sections of this report. In terms of gender, the screened sample of ‘interested’ respondents comprised (47%) males and (53%) females. Of these respondents, only 0.7% identified as Aboriginal or Torres Strait Islanders.
Due to the low incidence of the youngest age group (18-24 age group), it has been added to the 25-34 years’ age group for the analysis in this report. This low response is typical and indicates a much lower interest in local government matters.
45-54 yrs30%
55-64 yrs23%
35-44 yrs23%
65 yrs and over14%
18-3410%
Age Groups
Douglas Shire Customer Satisfaction Survey 2017 MARKET FACTS (QLD) PTY LTD 12
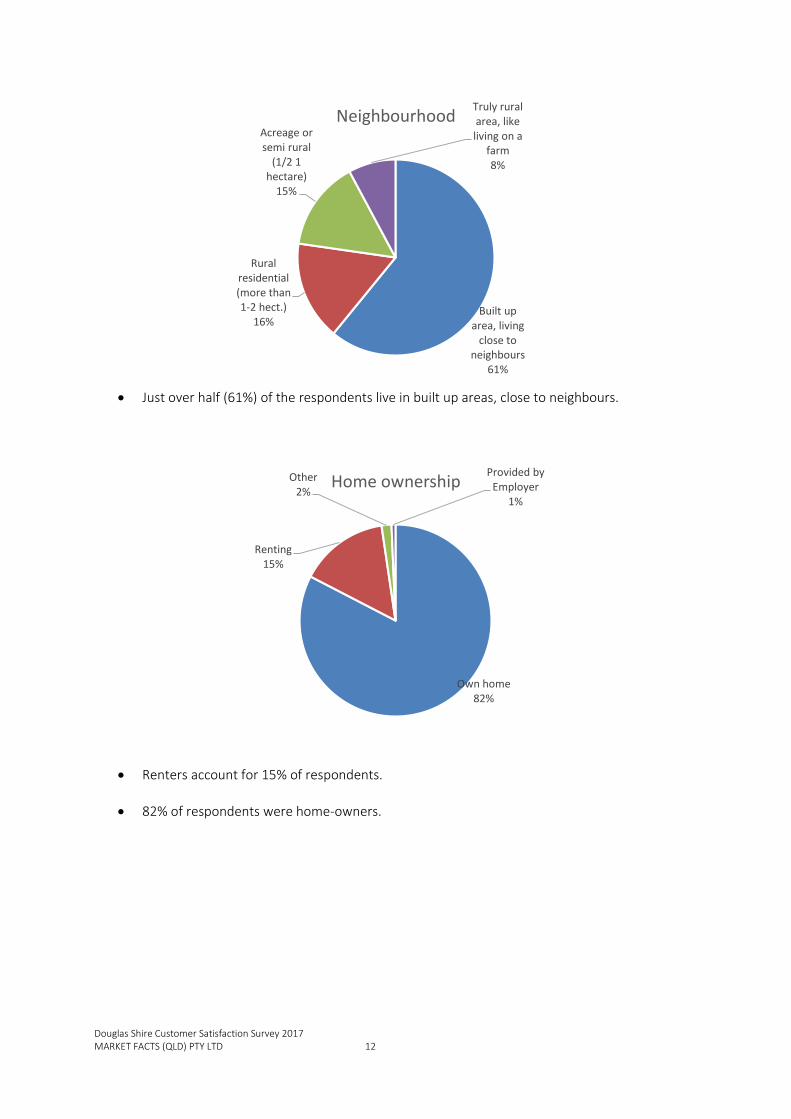
Just over half (61%) of the respondents live in built up areas, close to neighbours.
Renters account for 15% of respondents.
82% of respondents were home-owners.
Built up area, living
close to neighbours
61%
Rural residential (more than 1-2 hect.)
16%
Acreage or semi rural
(1/2 1 hectare)
15%
Truly rural area, like living on a
farm8%
Neighbourhood
Own home82%
Renting15%
Other2%
Provided by Employer
1%
Home ownership

Douglas Shire Customer Satisfaction Survey 2017 MARKET FACTS (QLD) PTY LTD 13
67% of the sample are either working in full or part time employment.
20% of respondents were retired.
Working full-time44%
Working part-time23%
Retired20%
Home duties7%
Unemployed3% Incapacitated
2%
Other1% Student
0%
Work Status

Douglas Shire Customer Satisfaction Survey 2017 MARKET FACTS (QLD) PTY LTD 14
OVERALL PERFORMANCE RATINGS This Survey Method uses two different measurements of community perceptions of their level of satisfaction with current Council performance – ‘direct’ and ‘calculated’. The Unweighted Overall Performance Rating This is obtained from a direct question to all survey participants. This question is the final one in the rating procedure, and comes after having obtained respondents’ ratings for both the Importance of each of the 42 Responsibility Areas the survey is about, and for Council Performance in delivering each one of these Areas In this final question, we ask our survey sample to give a rating of Overall Council Performance, using as a basis for judgement the criterion of whether Council is:
‘delivering a level of services and displaying a quality of performance in fulfilling all responsibilities, regarded as ‘value for money’ for the rates and charges you pay’.
During the initial enrolment process for the survey, we contact a number of residents who - for one reason or another - are not prepared to undertake the main survey. We also ask all these contacts - if we can start a conversation with them, and if they qualify as respondents - to give a similar overall judgement before the contact is terminated. There were 38 of these contacts in the process of enrolling our telephone survey sample of 300 (the remaining sample of n=106 comprising online surveys) The ratings of the two groups are presented together in the table below and then graphically (overleaf) for this benchmark survey. A comparison with LGAQ 2017 survey results is also be provided in the table below.
TOTAL Very Good
Good Fair Only
Poor Very Poor
Don't Know
Not App.
Mean
Total Queensland (LGAQ 2017) 700 3.6% 47.9% 43.3% 3.7% 1.6% 0.0% 0.0% 3.48
FIRST CONTACT Douglas 2017 38 15.8% 55.3% 15.8% 5.3% 5.3% 2.6% 0.0% 3.73
Overall Rating Douglas 2017 406 4.9% 41.1% 40.9% 9.4% 3.4% 0.2% 0.0% 3.35
Provincial (LGAQ 2017) 280 2.9% 50.4% 41.4% 3.9% 1.4% 0.0% 0.0% 3.49

Douglas Shire Customer Satisfaction Survey 2017 MARKET FACTS (QLD) PTY LTD 15
The Sample as a Whole – Direct Questioning The result for this survey is 3.35, which is lower than that for both Queensland - 3.48 and Provincial Councils – 3.49, as measured in the LGAQ 2017 State-wide Survey. A mean score of 3.35, translates to just over three quarters of respondents viewing Council’s performance as ‘good’ (41.1%) and ‘fair only’ (40.9%). It is also 67% of the ‘Optimum’ score of 5 which means that Council is generally viewed as being effective in delivering services to the community.
‘Non-participants’ in the Survey Those not prepared / unable to do the survey, but prepared to give a rating, have given a higher rating of 3.73.
Very Good 5%
Good 41%
Fair Only 41%
Poor 9%
Very Poor 4% Don't Know
0%Not Applicable
0%
Overall Performance - Direct Questioning
Very Good 16%
Good 55%
Fair Only 16%
Poor 5%
Very Poor 5%
Don't Know3%
Ratings - Non-participants in survey

Douglas Shire Customer Satisfaction Survey 2017 MARKET FACTS (QLD) PTY LTD 16
The Weighted Aggregated Total Performance Rating This second measurement of overall satisfaction is calculated by summarising all Performance ratings of each of the 42 Responsibility Areas into one (1) number, weighted by the relative Importance of each Area. It is computed by using all Importance scores, all Performance scores and all weighted Performance Indicators for all 42 Responsibility Areas and then calculating the weighted Total Performance Index from the resultant totals, using the standard formula. It is close to, but not the same as, the average of all Performance means expressed as a share of the Optimum performance score. This ‘summary number’ is called the ‘Average Total Performance Index’ or the Aggregated Overall Performance (Weighted). Despite being calculated from 84 different mean ratings, the resultant Average TPI has a value that is quite close to that obtained from the Direct Question given above. Average Total Performance Index (TPI) for the survey was calculated at 66.72% By comparison, with LGAQ State-wide survey Provincial averages in 2017, TPIs of 69.39% and 69.17% were achieved, so Douglas’ TPI of 66.72% for 2017 is tracking just below both Queensland wide and Provincial TPIs. Such a high degree of correspondence between the two measurements (Direct Questioning and Average TPI) suggests that both methods are successfully measuring the same thing. Total Performance Indexes can be examined from two general perspectives - the composition (i.e. the average scores for the individual Importance and Performance scores for each of the Responsibility Areas in each of the Themes) and a comparison of the overall index scores over time (for future ongoing tracking surveys).

Douglas Shire Customer Satisfaction Survey 2017 MARKET FACTS (QLD) PTY LTD 17
COMPARISON OF PERFORMANCE INDICES The following charts show comparison of the Total Performance Index (TPI) for Douglas 2017 with LGAQ 2017.
The chart above, shows the Douglas TPI (66.72) for 2017 compared to TPI for the 5 key themes. As can be seen from the chart above, Douglas is well below the overall average TPI in 4 out of the 5 areas namely:
Qualities of Council (67.65%)
Customer Service and Communication (63.91%)
Community Lifestyle Services (68.23%)
Basic Services / Infrastructure (67.06%)
For Douglas’s Managing the Shire TPI (65.50%), comes very close to both the Provincial TPI (65.75%) and LGAQ State-wide (65.65%).
67.06%
68.23%
65.50%
63.91%
67.65%
66.72%
69.93%
72.13%
65.75%
65.92%
69.40%
69.17%
70.57%
72.02%
65.65%
66.38%
69.45%
69.39%
56.00% 60.00% 64.00% 68.00% 72.00% 76.00%
Basic Services / Infrastructure
Community Lifestyle Services
Managing the Shire/City
Customer Services and Communications
Qualities of Council
OVERALL WEIGHTED PERFORMANCE INDEX
Summary of Performance Indexes
LGAQ STATEWIDE [2017] LGAQ Provincial [2017] DOUGLAS 2017

Douglas Shire Customer Satisfaction Survey 2017 MARKET FACTS (QLD) PTY LTD 18
ANALYSIS OF KEY POINTS Areas of Lowest Performance Relative to Importance The Table shows the 10 Responsibility Areas where there are the greatest gaps between Performance and Importance - ranked inversely by the level of rated Performance.
Responsibility Area Importance Performance Share of Optimum Mean Rank Mean Rank
Informing the Community 4.28 10 3.22 24= 64.4%
Human Resources Management
3.97 27 3.22 24= 64.4%
Revenue-raising 4.09 21 3.22 24= 64.4%
Quality of Councillor(s) Dealt with
4.27 11= 3.21 25 64.1%
Road Maintenance 4.49 3 3.18 26 63.5%
Providing Leadership & Advocacy
4.18 17 3.10 28= 62.0%
Pet/Animal Control 3.98 26 3.10 28= 62.0%
Economic Development/Local Employment
4.38 7 3.06 29 61.3%
Consulting the community 4.42 6= 2.92 30 58.4%
Responding to the Community
4.44 5= 2.85 31 56.9%
*Responsibility Areas shown in shading were rated in ‘top ten’ in overall importance These 10 Responsibility Areas have been selected on the basis that
their Importance rating is at least 3.96 (on the border-line of ‘4’= ‘Important’), and
their Performance is more than 1.5% below Average (where Average Total Performance Index is 66.72%).
The size of the job to be done can be defined in two ways:
Move the Performance Mean from the current rating up to the Optimum level (‘a score of ‘5’). Current Performance as a share of Optimum is shown in the Share of Optimum column. The difference between ‘Share of Optimum’ and 100.0% shows how actual performance has to improve to achieve a score of ‘5’.
Achieve Equilibrium between Performance and Importance by closing the ‘gap’ between their respective Mean scores. If the gap between the average ratings for Importance and Performance were to close, there would be a significant improvement in community perceptions of Overall Performance.

Douglas Shire Customer Satisfaction Survey 2017 MARKET FACTS (QLD) PTY LTD 19
Areas of Highest Performance Relative to Importance There are 10 Responsibility Areas (out of the total of 42) on which Council performed best in relation to their judged importance. In this case, ‘best’ is defined as having:
an Importance rating of at least 3.96 (on the border-line of ‘4’= ‘Important’), and
Performance more than 1.5% above Average (where Average Performance is 66.72%- the (calculated) Average Total Performance Index).
*Responsibility Areas shown in shading were rated in ‘top ten’ in overall importance
Responsibility Area Importance Performance Share of Optimum Mean Rank Mean Rank
Water Supply 4.46 4 3.76 2= 75.1%
Sewerage 4.36 8 3.76 2= 75.1%
Waste Management 4.50 2 3.66 3= 73.2%
Customer Service 4.21 14 3.66 3= 73.1%
Quality & Performance of Indoor Staff
4.16 18 3.59 4 71.9%
Drainage & Flood Mitigation
4.30 9 3.52 6= 70.5%
Information services 4.10 20 3.47 8= 69.4%
Community Health 4.27 11= 3.47 8= 69.4%
Community Safety 4.20 15 3.44 9 68.8%
Quality & Performance of Outdoor Workers
4.22 13 3.43 10= 68.6%

Douglas Shire Customer Satisfaction Survey 2017 MARKET FACTS (QLD) PTY LTD 20
Areas of Average Performance There are only 10 Responsibility Areas (out of the total of 42) on which Council has received an average score which is defined as having;
an Importance rating of at least 3.96 (on the border-line of ‘4’= ‘Important’), and
Performance not more than 1.5% below or above Average (where Average Performance 66.72% - the (calculated) Average Total Performance Index).
Responsibility Area Importance Performance Share of Optimum Mean Rank Mean Rank
Development of Tourism 4.14 19 3.38 12 67.6%
Financial Management 4.44 5= 3.37 13 67.3%
Quality of Elected Council 4.55 1 3.36 14= 67.3%
Building Control 4.19 16 3.36 14= 67.2%
Community Services 4.07 23 3.35 15 67.1%
Managerial & Supervisory Officers
4.42 6= 3.33 16 66.6%
Environmental Controls 4.05 24 3.32 17 66.4%
Town Planning 4.26 12 3.31 19 66.3%
Road Construction 4.03 25 3.29 21= 65.9%
Environment Protection & Conservation
4.08 22 3.29 21= 65.8%
*Responsibility Areas shown in shading were rated in ‘top ten’ in overall importance

Douglas Shire Customer Satisfaction Survey 2017 MARKET FACTS (QLD) PTY LTD 21
Areas of Least Importance There are 12 of the 42 Responsibility Areas have not been considered in formulating the previous three lists (Highest Performers, Lowest Performers and Average Performers) because they did not have an Importance rating greater than 3.96, or 4 when rounded (i.e.= ‘Important’). Nevertheless, they do exist, and are listed below - ranked by their Performance score, as used in the previous three tables. Despite their Importance rating being regarded as fairly low, by the Community at large, Councils cannot avoid expending resources upon them, as they are very Important to some members of the community (e.g. Community Development is rated as ‘important’ by 45.8% of respondents). Hence, the detailed data on these particular areas has to be examined, to formulate priorities - as these show the proportions of the community who have varying priorities.
Responsibility Area Importance Performance Share of Optimum Mean Rank Mean Rank
Libraries & other Information Access
3.91 28 3.79 1 75.7%
Parking Facilities 3.91 29 3.12 27 62.4%
Traffic Management 3.89 30 3.30 20 65.9%
Street Lighting 3.85 31= 3.32 18 66.4%
Shopping Facilities 3.85 31= 3.56 5 71.2%
Footpaths, Kerbing, Guttering
3.85 31= 3.24 23 64.9%
Parks, Playgrounds & Public Amenities
3.84 32= 3.52 6= 70.3%
Community Development
3.84 32= 3.28 22= 65.7%
Heritage Protection 3.80 33 3.39 11 67.8%
Sporting & Recreational Facilities
3.76 34 3.49 7 69.8%
Cultural & Entertainment Facilities
3.64 35 3.43 10= 68.5%
Public Transport 3.60 36 2.39 32 47.7%
Douglas Shire Customer Satisfaction Survey 2017 MARKET FACTS (QLD) PTY LTD 22
EVALUATIONS OF TOTAL PERFORMANCE The following pages present tables showing performance indices (used to benchmark successive measures of performance). These can be used to guide plans and policies in order to improve the levels of satisfaction of the residents of Douglas Shire Council. Weighted Performance Indicators The tabular calculations give the results for each Responsibility Area within each Theme as a Weighted Performance Indicator (WPI). The table then combines these individual Weighted Performance Indicators to produce an overall Total Performance Index (TPI) for each Theme. Individual Weighted Performance Indicators are produced by multiplying the average Performance Rating awarded to a council for each Responsibility Area within a particular Theme by the average Importance Rating given to it. This ‘weights’ each individual Performance score by the level of community priority for that specific Area. To obtain the Total Performance Index (TPI) for each Theme, the individual Weighted Performance Indicators are summed, as an Achieved Score, and percentaged against a Possible Score - which could be achieved only if all respondents gave their council a ‘5’ rating (‘Very Good’) for Performance on all the Responsibility Areas in that Theme. These TPI’s become a benchmark against which Council can track, over individual and successive surveys, the effectiveness with which they have addressed community expectations. They also provide objective numerical data which can be used to crystallise - from the viewpoint of residents - Objectives set out in council Strategic or Corporate Plans. They describe ‘what is’ - actual performance, adjusted for relative importance priorities.

Douglas Shire Customer Satisfaction Survey 2017 MARKET FACTS (QLD) PTY LTD 23
Basic Services & Infrastructure Weighted Performance Index (in order of Importance)
Theme 1 Basic Services/Infrastructure
2017 Survey
Importance Means
Performance Means
Performance Indexes
Waste Management 4.50 3.66 73.2%
Road Maintenance 4.49 3.18 63.5%
Water Supply 4.46 3.76 75.1%
Sewerage 4.36 3.76 75.1%
Drainage & Flood Mitigation 4.30 3.52 70.5%
Community Health 4.27 3.47 69.4%
Road Construction 4.03 3.29 65.9%
Parking Facilities 3.91 3.12 62.4%
Traffic Management 3.89 3.30 65.9%
Street Lighting 3.85 3.32 66.4%
Means 4.13 3.33
Total Performance Index 67.06%
The weighted Total Performance Index (TPI) for Basic Services & Infrastructure is one number, which sums up the whole interaction between Performance and Priorities for this particular Theme. In 2017, the actuality of the interaction between these two forces gives a result of 67.06% of what might have been achieved if Douglas were to achieve perfect performance for every Responsibility Area. The table shows a comparison of how the community actually judges Council performance, as it makes allowance for the relative Importance of each of the Activity Areas judged. This ‘reality’ is shown in the Weighted Performance Indicator numbers. However, the rank order of these WPIs is clearly at variance with the priorities with which the community wants matters to be handled (the table is formatted in the rank order of Importance scores).

Douglas Shire Customer Satisfaction Survey 2017 MARKET FACTS (QLD) PTY LTD 24
Community Lifestyle Services Weighted Performance Index (in order of Importance)
Theme 2 Community Lifestyle Services
2017 Survey
Importance Means
Performance Means
Performance Indexes
Community Safety 4.20 3.44 68.8%
Environment Protection & Conservation
4.08 3.29 65.8%
Community Services 4.07 3.35 67.1%
Environmental Controls 4.05 3.32 66.4%
Pet/Animal Control 3.98 3.10 62.0%
Libraries & other Information Access
3.91 3.79 75.7%
Shopping Facilities 3.85 3.56 71.2%
Parks, Playgrounds & Public Amenities
3.84 3.52 70.3%
Community Development 3.84 3.28 65.7%
Heritage Protection 3.80 3.39 67.8%
Sporting & Recreational Facilities
3.76 3.49 69.8%
Cultural & Entertainment Facilities
3.64 3.43 68.5%
Means 3.92 3.41
Total Performance Index 68.23%
The weighted Total Performance Index (TPI) for Community Lifestyle Services in 2017 is 68.23% of the Optimum. Weighted Performance Indicator scores vary from survey to survey, as they are affected by changes to Importance scores as well as Performance scores. Therefore, they can be used as a way of ensuring that planning targets for both Importance and Performance are kept within realistic achievable ranges. They also clearly show where the community’s resources should be allocated to achieve planning objectives

Douglas Shire Customer Satisfaction Survey 2017 MARKET FACTS (QLD) PTY LTD 25
Managing the Shire Weighted Performance Index (in order of Importance)
Theme 3 Managing the Shire
2017 Survey
Importance Means
Performance Means
Performance Indexes
Financial Management 4.44 3.37 67.3%
Economic Development/Local Employment
4.38 3.06 61.3%
Town Planning 4.26 3.31 66.3%
Building Control 4.19 3.36 67.2%
Development of Tourism 4.14 3.38 67.6%
Revenue-raising 4.09 3.22 64.4%
Human Resources Management
3.97 3.22 64.4%
Means 4.21 3.28
Total Performance Index 65.50%
The weighted Total Performance Index (TPI) for Managing the Shire in 2017 is 65.50% of the Optimum. The table shows a comparison of how the community actually judges the performance of council as it makes allowance for the relative Importance of each of the Activity Areas judged. This ‘reality’ is shown in the Weighted Performance Indicator numbers.

Douglas Shire Customer Satisfaction Survey 2017 MARKET FACTS (QLD) PTY LTD 26
Customer Service and Communications Weighted Performance Index (in order of Importance)
Theme 4 Customer Service and Communication
2017 Survey
Importance Means
Performance Means
Performance Indexes
Responding to the Community
4.44 2.85 56.9%
Consulting the community 4.42 2.92 58.4%
Informing the Community 4.28 3.22 64.4%
Customer Service 4.21 3.66 73.1%
Providing Leadership & Advocacy
4.18 3.10 62.0%
Information services 4.10 3.47 69.4%
Means 4.27 3.20
Total Performance Index 63.91%
The weighted Total Performance Index (TPI) for Customer Service & Communications for 2017 is 63.91%. The table shows a comparison of how the community actually judges Council performance for this theme, as it makes allowance for the relative Importance of each of the Activity Areas judged. This ‘reality’ is shown in the Weighted Performance Indicator numbers. However, the rank order of these WPIs is clearly at variance with the priorities with which the community wants matters to be handled (shown by the rank order of Importance scores).

Douglas Shire Customer Satisfaction Survey 2017 MARKET FACTS (QLD) PTY LTD 27
Qualities of Council Weighted Performance Index (in order of Importance)
Theme 5 Qualities of Council
2017 Survey
Importance Means
Performance Means
Performance Indexes
Quality & Performance of Indoor Staff 4.16 3.59 71.9%
Quality & Performance of Outdoor Workers
4.22 3.43 68.6%
Quality of Elected Council 4.55 3.36 67.3%
Managerial & Supervisory Officers 4.42 3.33 66.6%
Quality of Councillor(s) Dealt with 4.27 3.21 64.1%
Means 4.32 3.38
Total Performance Index 67.65%
The 2017 weighted Total Performance Index (TPI) for Qualities of Council is 67.65%. The table shows how the community actually judges Council performance, as it makes allowance for the relative Importance of each of the Activity Areas judged. This ‘reality’ is shown in the Weighted Performance Indicator numbers. However, the rank order of these WPIs is again at variance with Importance priorities (shown by the rank order of Importance scores).

Douglas Shire Customer Satisfaction Survey 2017 MARKET FACTS (QLD) PTY LTD 28
COMMUNITY RATINGS OF COUNCIL RESPONSIBILITY AREAS (THEMES) This section comprises two sets of tables and commentary:
the first set of tables deals with the community’s priorities - the IMPORTANCE of each Area of Responsibility/Service;
the second set of tables deals with the community’s perceptions of what is actually the case - the ratings for COUNCIL PERFORMANCE in each Area of Responsibility / Service.
N.B. In the following tables, the Responsibility Areas being rated are presented in the order of consideration by respondents, not in rank order of Importance or Performance. Explanation of Importance & Performance Ratings In the tables, the MEAN column or row is an average of the IMPORTANCE or PERFORMANCE ratings given by all respondents, using 5-point scales with clarifying semantic differentials as follows:
IMPORTANCE PERFORMANCE
Crucial (5) Very Good (5) Important (4) Good (4)
Nice to Have (3) Fair Only (3) Unimportant (2) Poor (2) Quite Unimportant (1) Very Poor (1)
In both measurements, provision was also made for unprompted ‘Don't Know’ or ‘Not Applicable’ responses. These were factored out of the calculations by giving them a value = 0. While the words used in the Performance Scales each have an obvious meaning, those used in the Importance Scales were explained in detail to all respondents by the interviewers:
‘Crucial’ means that it is a service or activity that the community must have and that it is vital for the council either to do or to get involved in to make sure that it is done by someone.
‘Important’ is for something that you certainly expect your council to do, provide or make sure that somebody else provides it.
‘Nice To Have’ means just that, as does ‘Not Very Important’.
‘Quite Unimportant’ means unnecessary - something that in any council cutbacks would be the first to go.
Achieved MEAN scores should thus be considered in relation to the scale being applied. For example:
a MEAN of 4.5 on Importance indicates that the particular responsibility/quality is adjudged mid-way between Important and Crucial.
a MEAN of 3.5 for Performance means that the Council is seen as mid-way between Fair Only and Good in being effective/delivering service on that particular criterion.

Douglas Shire Customer Satisfaction Survey 2017 MARKET FACTS (QLD) PTY LTD 29
IMPORTANCE Theme 1: Basic Services & Infrastructure IMPORTANCE
Sample Size
RANK Crucial Import Nice to
have
Un-import.
Quite Un-
import.
Don't Know
Not App.
Mean 2017
LGAQ Mean 2017
Road Construction
406 7 32.0% 44.1% 17.5% 4.7% 0.7% 0.2% 0.7% 4.03 4.28
Road Maintenance
407 2 55.7% 39.2% 4.2% 0.7% 0.2% 0.0% 0.0% 4.49 4.54
Footpaths, Kerbing & Guttering
406 10= 24.9% 40.9% 22.4% 5.7% 1.7% 0.7% 3.7% 3.85 4.10
Street Lighting 406 10= 26.4% 40.4% 15.8% 8.4% 2.5% 0.7% 5.9% 3.85 4.16
Traffic Management
406 9 28.6% 39.2% 19.5% 7.4% 1.5% 0.5% 3.4% 3.89 4.23
Parking Facilities 406 8 29.1% 39.9% 17.7% 7.1% 2.0% 0.2% 3.9% 3.91 4.22
Public Transport 406 11 27.3% 25.1% 21.2% 8.4% 8.6% 0.7% 8.6% 3.60 3.93
Water Supply 406 3 58.6% 23.6% 4.7% 3.0% 2.0% 0.0% 8.1% 4.46 4.59
Sewerage 406 4 53.2% 22.4% 4.9% 4.4% 2.7% 0.5% 11.8% 4.36 4.61
Drainage & Flood Mitigation
406 5 51.7% 30.5% 8.6% 4.9% 1.5% 0.0% 2.7% 4.30 4.45
Waste Management
406 1 58.9% 31.5% 6.2% 1.7% 0.0% 0.0% 1.7% 4.50 4.46
Community Health
406 6 43.3% 41.1% 12.6% 1.7% 0.2% 0.5% 0.5% 4.27 4.15
AVERAGE FOR THEME AS A WHOLE 4.13 4.31
The average level of Importance for the responsibilities in this Theme is 4.13. 7 out of the 12 responsibility areas judged as ‘important’ (a mean rating of 4.00 or better). The top 2 priorities are:
Waste Management (4.50)
Road Maintenance (4.49)
Those regarded as least important, Public Transport (3.60), Street Lighting (3.85) and Footpaths, Kerning and Guttering (3.85). Significant variances (by location) from the sample averages are also shown, below each graph, for each responsibility area. Full data tables are included in the Appendix of this report.

Douglas Shire Customer Satisfaction Survey 2017 MARKET FACTS (QLD) PTY LTD 30
Significant variances were by: Location & Survey Type
66% of Northern – Crucial
26% of Southern – Nice to Have
10% of online survey - Unimportant
No Significant variances.
Crucial 32%
Important 44%
Nice to have 17%
Unimportant5%
Quite Unimportant
1%
Don't Know0%
Not Applicable1%
Road Construction
Crucial 56%
Important 39%
Nice to have 4%
Unimportant1%
Quite Unimportant
0%Don't Know
0%Not Applicable
0%
Road Maintenance

Douglas Shire Customer Satisfaction Survey 2017 MARKET FACTS (QLD) PTY LTD 31
Significant variances were by: Location & Survey Type
33% of online survey – Nice to Have
Significant variances were by: Location & Survey Type
37% of Middle – Crucial
19% of online survey - Unimportant
Crucial 25%
Important 41%
Nice to have 22%
Unimportant5%
Quite Unimportant
2%
Don't Know1%
Not Applicable4%
Footpaths, Kerbing & Guttering
Crucial 26%
Important 40%
Nice to have 16%
Unimportant8%
Quite Unimportant
3% Don't Know1%
Not Applicable
6%
Street Lighting

Douglas Shire Customer Satisfaction Survey 2017 MARKET FACTS (QLD) PTY LTD 32
Significant variances were by: Location & Survey Type
51% of Middle – Important
13 of online survey - Unimportant
Significant variances were by: Location & Survey Type
51% of Middle – Important
26% of online survey – Nice to have
Crucial 29%
Important 39%
Nice to have 19%
Unimportant7%
Quite Unimportant
2%
Don't Know1%
Not Applicable
3%
Traffic Management
Crucial 29%
Important 40%
Nice to have 18%
Unimportant7%
Quite Unimportant
2%
Don't Know0%
Not Applicable
4%
Parking Facilities

Douglas Shire Customer Satisfaction Survey 2017 MARKET FACTS (QLD) PTY LTD 33
Significant variances were by: Location & Survey Type
40% of Northern – Crucial
37% of online survey – Nice to have
Significant variances were by: Location & Survey Type
9% of online survey – Nice to have
Crucial 27%
Important 25%
Nice to have 21%
Not very Import. 8%
Quite Unimportant
9%
Don't Know1%
Not Applicable
9%
Public Transport
Crucial 54%Important
31%
Nice to have 7%
Unimportant5%
Quite Unimportant 2%
Don't Know
0%
Not Applicable
1%
Water Supply

Douglas Shire Customer Satisfaction Survey 2017 MARKET FACTS (QLD) PTY LTD 34
Significant variances were by: Location & Survey Type
61% of Southern – Crucial
11% of online survey – Nice to have
Significant variances were by: Location & Survey Type
17% of online survey – Nice to have
Crucial 39%
Important 31%
Nice to have 13%
Unimportant12%
Quite Unimportant
3%
Don't Know1%
Not Applicable1%
Sewerage
Crucial 52%
Important 30%
Nice to have 9%
Unimportant5%
Quite Unimportant
1%
Don't Know
0% Not Applicable3%
Drainage & Flood Mitigation

Douglas Shire Customer Satisfaction Survey 2017 MARKET FACTS (QLD) PTY LTD 35
No Significant variances.
No Significant variances.
Crucial 59%
Important 31%
Nice to have 6%
Unimportant2%
Quite Unimportant
0%Don't Know
0%
Not Applicable
2%
Waste Management
Crucial 43%Important
41%
Nice to have 13%
Unimportant2%
Quite Unimportant
0% Don't Know1%
Not Applicable0%
Community Health

Douglas Shire Customer Satisfaction Survey 2017 MARKET FACTS (QLD) PTY LTD 36
Theme 2: Community Lifestyle Services IMPORTANCE
TOTAL RANK Crucial Import Nice
to have
Un-Important
Quite Un-
import.
Don't Know
Not App.
Mean 2017
LGAQ Mean 2017
Parks, Playgrounds & Public Amenities
406 8= 22.7% 43.8% 28.6% 3.4% 1.0% 0.0% 0.5% 3.84 3.92
Environmental Controls
406 4 34.7% 42.4% 15.5% 4.9% 1.5% 0.7% 0.2% 4.05 3.98
Environmental Protection & Conservation
406 2 38.9% 36.7% 17.2% 4.4% 1.7% 0.7% 0.2% 4.08 4.04
Heritage Protection
406 9 26.1% 36.9% 28.3% 5.7% 2.0% 0.5% 0.5% 3.80 3.77
Sporting & Recreational Facilities
406 10 19.2% 45.3% 27.8% 6.7% 0.5% 0.2% 0.2% 3.76 3.87
Cultural & Entertainment Facilities
406 11 16.3% 41.4% 32.3% 7.6% 1.5% 0.2% 0.7% 3.64 3.75
Libraries & other Information Access
406 6 31.0% 36.0% 26.4% 4.7% 1.5% 0.0% 0.5% 3.91 3.99
Community Safety
406 1 39.4% 43.6% 14.5% 1.7% 0.5% 0.0% 0.2% 4.20 4.12
Community Service
406 3 32.5% 44.6% 18.2% 3.0% 0.5% 1.0% 0.2% 4.07 3.99
Pet/Animal Control
406 5 27.6% 46.6% 20.9% 3.0% 1.0% 0.2% 0.7% 3.98 3.94
Shopping Facilities
406 7 23.2% 46.3% 22.7% 5.7% 1.2% 0.2% 0.7% 3.85 3.86
Community Development
406 8= 20.9% 45.8% 27.8% 3.2% 1.0% 0.7% 0.5% 3.84 3.76
AVERAGE FOR THEME AS A WHOLE 3.92 3.92
The average level of Importance for the responsibilities in this Theme is 3.92. The following three responsibility areas were rated most important:
Community Safety (4.12) Environmental Protection & Conservation (4.08) Community Service (4.07)
Cultural and Entertainment Facilities (3.64) was awarded the lowest priority. Significant variances (by location) from the sample averages are also shown, below each graph, for each responsibility area. Full data tables are included in the Appendix of this report.

Douglas Shire Customer Satisfaction Survey 2017 MARKET FACTS (QLD) PTY LTD 37
No Significant variances.
Significant variances were by: Location & Survey Type
4% of Middle – Unimportant
Crucial 23%
Important 44%
Nice to have 29%
Unimportant3%
Quite Unimportant
1% Don't Know0%
Not Applicable
0%
Parks, Playgrounds & Public Amenities
Crucial 35%
Important 42%
Nice to have 16%
Unimportant5%
Quite Unimportant
1% Don't Know1% Not Applicable
0%
Environmental Controls

Douglas Shire Customer Satisfaction Survey 2017 MARKET FACTS (QLD) PTY LTD 38
No Significant variances.
Significant variances were by: Location & Survey Type
42% of Northern – Crucial
Crucial 39%
Important 37%
Nice to have 17%
Unimportant4%
Quite Unimportant
2%
Don't Know1%
Not Applicable0%
Environmental Protection & Conservation
Crucial 26%
Important 37%
Nice to have 28%
Unimportant6%
Quite Unimportant
2%
Don't Know1%
Not Applicable
0%
Heritage Protection

Douglas Shire Customer Satisfaction Survey 2017 MARKET FACTS (QLD) PTY LTD 39
No Significant variances.
No Significant variances.
Crucial 18%
Important 45%
Nice to have 30%
Unimportant6%
Quite Unimportant
1%
Don't Know0%
Not Applicable
0%
Sporting & Recreational Facilities
Crucial 16%
Important 41%
Nice to have 32%
Unimportant8%
Quite Unimportant
2%Don't Know
0%
Not Applicable1%
Cultural & Entertainment Facilities

Douglas Shire Customer Satisfaction Survey 2017 MARKET FACTS (QLD) PTY LTD 40
Significant variances were by: Location & Survey Type
40% of Northern – Crucial
46% of Middle - Important
35% of Southern – Nice to have
5% of online survey – Quiet Unimportant
Significant variances were by: Location & Survey Type
5% of online survey – Unimportant
53% of online survey - Crucial
Crucial 31%
Important 36%
Nice to have 26%
Unimportant5%
Quite Unimportant
1%Don't Know
0% Not Applicable1%
Libraries & Other Information Access
Crucial 39%
Important 44%
Nice to have 15%
Unimportant2%
Quite Unimportant
0%
Don't Know0%
Not Applicable0%
Community Safety

Douglas Shire Customer Satisfaction Survey 2017 MARKET FACTS (QLD) PTY LTD 41
No Significant variances.
Significant variances were by: Location & Survey Type
50% of Northern - Crucial
Crucial 33%
Important 45%
Nice to have 18%
Unimportant3%
Quite Unimportant
0%Don't Know
1%Not Applicable
0%
Community Service
Crucial 28%
Important 46%
Nice to have 21%
Unimportant3%
Quite Unimportant
1% Don't Know0%
Not Applicable1%
Pet/Animal Control

Douglas Shire Customer Satisfaction Survey 2017 MARKET FACTS (QLD) PTY LTD 42
Significant variances were by: Location & Survey Type
42% of Northern – Crucial
12% of online survey - Unimportant
Significant variances were by: Location & Survey Type
38% of Southern – Nice to have
Crucial 23%
Important 46%
Nice to have 23%
Unimportant6%
Quite Unimportant
1%
Don't Know0%
Not Applicable1%
Shopping Facilities
Crucial 21%
Important 46%
Nice to have 28%
Unimportant3%
Quite Unimportant
1%
Don't Know1%
Not Applicable0%
Community Development

Douglas Shire Customer Satisfaction Survey 2017 MARKET FACTS (QLD) PTY LTD 43
Theme 3: Managing the Shire IMPORTANCE
TOTAL RANK Crucial Import Nice to
have
Un- import.
Quite Un-
import
Don't Know
Not App.
Mean 2017
LGAQ Mean 2017
Town Planning
406 3 41.1% 46.1% 10.1% 2.0% 0.2% 0.2% 0.2% 4.26 4.31
Building Control
406 4 36.7% 48.0% 9.6% 3.7% 0.5% 1.5% 0.0% 4.19 4.21
Economic Development & Local Employment
406 2 50.5% 38.7% 7.6% 1.7% 0.5% 0.7% 0.2% 4.38 4.32
Development of Tourism
405 5 38.7% 41.4% 14.5% 4.2% 0.7% 0.0% 0.2% 4.14 3.92
Financial Management
406 1 53.9% 36.9% 5.7% 1.7% 0.5% 1.0% 0.2% 4.44 4.48
Revenue-raising
406 6 31.0% 49.3% 13.8% 2.2% 1.2% 1.7% 0.7% 4.09 4.23
Staff Management
406 7 23.6% 51.0% 19.5% 3.0% 0.5% 2.0% 0.5% 3.97 3.96
AVERAGE FOR THEME AS A WHOLE 4.21 4.20
The average level of Importance for the responsibilities in this Theme is 4.21. Financial Management (4.44) was accorded the highest priority Economic Development and Local Employment second highest (4.38). Staff Management was the lowest priority (3.97). Significant variances (by location) from the sample averages are also shown, below each graph, for each responsibility area. Full data tables are included in the Appendix of this report.

Douglas Shire Customer Satisfaction Survey 2017 MARKET FACTS (QLD) PTY LTD 44
No Significant variances.
Significant variances were by: Location & Survey Type
46% of Southern - Crucial
Crucial 41%
Important 46%
Nice to have 10%
Unimportant2%
Quite Unimportant
1%Don't Know
0%
Not Applicable
0%
Town Planning
Crucial 37%
Important 48%
Nice to have 10%
Unimportant4%
Quite Unimportant
0%
Don't Know1% Not Applicable
0%
Building Control

Douglas Shire Customer Satisfaction Survey 2017 MARKET FACTS (QLD) PTY LTD 45
No Significant variances.
Significant variances were by: Location & Survey Type
60% of Northern – Crucial
Crucial 50%Important
39%
Nice to have 8%
Unimportant2%
Quite Unimportant
0%
Don't Know1% Not Applicable
0%
Economic Development & Local Employment
Crucial 39%
Important 41%
Nice to have 15%
Unimportant4%
Quite Unimportant
1%Don't Know
0%
Not Applicable0%
Development of Tourism

Douglas Shire Customer Satisfaction Survey 2017 MARKET FACTS (QLD) PTY LTD 46
Significant variances were by: Location & Survey Type
6% of online survey - Unimportant
No Significant variances.
Crucial 31%
Important 49%
Nice to have 14%
Unimportant2%
Quite Unimportant
1%
Don't Know2%
Not Applicable1%
Revenue-raising
Crucial 54%
Important 37%
Nice to have 6%
Unimportant2%
Quite Unimportant
0%
Don't Know
1%Not
Applicable0%
Financial Management

Douglas Shire Customer Satisfaction Survey 2017 MARKET FACTS (QLD) PTY LTD 47
Significant variances were by: Location & Survey Type
70% of Northern – Important
Crucial 24%
Important 51%
Nice to have 19%
Unimportant3%
Quite Unimportant
1%
Don't Know2%
Not Applicable0%
Staff Management

Douglas Shire Customer Satisfaction Survey 2017 MARKET FACTS (QLD) PTY LTD 48
Theme 4: Customer Service and Communication IMPORTANCE
TOTAL RANK Crucial Import Nice to
have
Not very
Import.
Quite Un-
import.
Don't Know
Not App.
Mean 2017
LGAQ Mean 2017
Customer Service
406 4 36.2% 50.0% 11.6% 1.7% 0.0% 0.2% 0.2% 4.21 4.25
Information Services
406 6 28.3% 55.2% 14.5% 1.5% 0.2% 0.2% 0.0% 4.10 4.10
Informing the Community
406 3 42.6% 44.6% 11.1% 1.2% 0.2% 0.0% 0.2% 4.28 4.23
Consulting the Community
406 2 52.2% 38.4% 7.1% 1.2% 0.2% 0.5% 0.2% 4.42 4.28
Responding to the Community
406 1 53.4% 37.7% 6.9% 1.2% 0.2% 0.5% 0.0% 4.44 4.31
Providing Leadership & Advocacy
406 5 35.5% 45.8% 13.5% 2.2% 0.0% 2.7% 0.2% 4.18 4.15
AVERAGE FOR THEME AS A WHOLE 4.27 4.22
The average level of Importance for the responsibilities in this Theme is 4.27. The equal top scores were: Responding to the Community (4.44)
Consulting the Community (4.42) Information Services (4.10) was given lowest priority. However, all responsibility areas were judged as high, with a mean of 4 or more. Significant variances (by location) from the sample averages are also shown, below each graph, for each responsibility area. Full data tables are included in the Appendix of this report.

Douglas Shire Customer Satisfaction Survey 2017 MARKET FACTS (QLD) PTY LTD 49
Significant variances were by: Location & Survey Type
72% of Northern – Important
50% of Southern - Crucial
No Significant variances.
Crucial 36%
Important 50%
Nice to have 12%
Unimportant2%
Quite Unimportant
0% Don't Know0%
Not Applicable0%
Customer Service
Crucial 28%
Important 55%
Nice to have 15%
Unimportant2%
Quite Unimportant
0%Don't Know
0%Not Applicable
0%
Information Services

Douglas Shire Customer Satisfaction Survey 2017 MARKET FACTS (QLD) PTY LTD 50
Significant variances were by: Location & Survey Type
58% of Middle – Important
53% of Southern – Crucial
Significant variances were by: Location & Survey Type
50% of Middle – Important
64% of online survey – Crucial
Crucial 43%
Important 45%
Nice to have 11%
Unimportant1%
Quite Unimportant
0%Don't Know0%
Informing the Community
Crucial 52%
Important 39%
Nice to have 7%
Unimportant1%
Quite Unimportant
0%
Don't Know
1% Not Applicable0%
Consulting the Community

Douglas Shire Customer Satisfaction Survey 2017 MARKET FACTS (QLD) PTY LTD 51
Significant variances were by: Location & Survey Type
48% of Middle – Important
12% of Middle – Nice to have
64% of Southern - Crucial
65% of online survey - Crucial
Significant variances were by: Location & Survey Type
56% of Middle – Important
47% of online surveys – Crucial
6% of online survey – Unimportant
Crucial 53%
Important 38%
Nice to have 7%
Unimportant1%
Quite Unimportant
0% Don't Know1%
Not Applicable0%
Responding to the Community
Crucial 35%
Important 46%
Nice to have 14%
Unimportant2%Quite
Unimportant 0%
Don't Know3% Not Applicable
0%
Providing Leadership & Advocacy

Douglas Shire Customer Satisfaction Survey 2017 MARKET FACTS (QLD) PTY LTD 52
Theme 5: Quality of Council IMPORTANCE
TOTAL RANK Crucial Import Nice to
have
Un- import.
Quite Un-
import.
Don't Know
Not App.
Mean 2017
LGAQ Mean 2017
Quality of Elected Council
406 1 60.3% 32.5% 6.2% 0.0% 0.0% 0.7% 0.2% 4.55 4.50
Quality of Councillor(s) Dealt with
406 2 48.0% 38.7% 6.7% 0.7% 0.0% 2.5% 3.4% 4.42 4.38
Managerial & Supervisory Officers
406 3 37.9% 46.3% 10.1% 0.7% 0.2% 3.9% 0.7% 4.27 4.16
Quality/Performance of Outdoor Workers
406 4 33.5% 53.7% 9.1% 1.2% 0.2% 1.7% 0.5% 4.22 4.17
Quality/Performance of Indoor Staff
406 5 31.3% 53.7% 10.8% 1.5% 0.5% 1.7% 0.5% 4.16 4.14
AVERAGE FOR THEME AS A WHOLE 4.32 4.27
The average level of Importance for the responsibilities in this Theme is 4.32. Quality of Elected Council (4.55) was accorded the highest priority. The Quality and Performance of Indoor Staff (4.16) and Quality and Performance of Outdoor Staff (4.22) were given equal lowest priority. However, all responsibility areas rated between important and crucial for this theme. Significant variances (by location) from the sample averages are also shown, below each graph, for each responsibility area. Full data tables are included in the Appendix of this report.

Douglas Shire Customer Satisfaction Survey 2017 MARKET FACTS (QLD) PTY LTD 53
Significant variances were by: Location & Survey Type
74% of Southern – Crucial
11% of Middle – Nice to have
No Significant variances.
Crucial 60%
Important 33%
Nice to have 6%
Unimportant0%
Quite Unimportant
0%
Don't Know
1%
Not Applicable0%
Quality of Elected Council
Crucial 48%
Important 39%
Nice to have 7%
Unimportant1%
Quite Unimportant
0%Don't Know
2% Not Applicable3%
Quality of Councillors

Douglas Shire Customer Satisfaction Survey 2017 MARKET FACTS (QLD) PTY LTD 54
No Significant variances.
No Significant variances.
Crucial 38%
Important 46%
Nice to have 10%
Unimportant1%
Quite Unimportant
0%
Don't Know4%
Not Applicable1%
Managerial & Supervisory Officers
Crucial 34%
Important 54%
Nice to have 9%
Unimportant1%
Quite Unimportant
0%
Don't Know2%
Not Applicable0%
Quality/Performance of Outdoor Workers

Douglas Shire Customer Satisfaction Survey 2017 MARKET FACTS (QLD) PTY LTD 55
No Significant variances.
Crucial 31%
Important 54%
Nice to have 11%
Unimportant1%Quite
Unimportant 1%
Don't Know
2%
Not Applicable0%
Quality/Performance of Indoor Staff

Douglas Shire Customer Satisfaction Survey 2017 MARKET FACTS (QLD) PTY LTD 56
PERFORMANCE
Theme 1: Basic Services & Infrastructure PERFORMANCE
Sample
Size RANK Very
Good Good Fair
Only Poor Very
Poor Don't Know
Not App.
Mean 2017
LGAQ Mean 2017
Road Construction
406 7 3.0% 41.9% 36.9% 9.1% 5.2% 3.4% 0.5% 3.29 3.40
Road Maintenance
406 9 4.7% 38.7% 33.7% 14.3% 8.1% 0.2% 0.2% 3.18 3.28
Footpaths, Kerbing & Guttering
406 8 3.7% 36.2% 29.8% 14.3% 3.9% 3.0% 9.1% 3.24 3.32
Street Lighting
406 5 4.4% 35.0% 31.5% 8.1% 4.4% 3.4% 13.1% 3.32 3.59
Traffic Management
405 6 5.9% 37.4% 31.5% 9.6% 6.4% 2.5% 6.4% 3.30 3.45
Parking Facilities
406 10 4.4% 30.0% 31.8% 16.7% 5.7% 3.7% 7.6% 3.12 3.02
Public Transport
406 11 1.0% 18.0% 15.3% 15.0% 25.4% 9.1% 16.3% 2.39 3.03
Water Supply 406 1= 15.0% 46.1% 10.8% 5.4% 4.4% 3.0% 15.3% 3.76 3.84
Sewerage 406 1= 15.0% 46.1% 10.8% 5.4% 4.4% 3.0% 15.3% 3.76 3.95
Drainage & Flood Mitigation
406 3 8.4% 45.6% 23.2% 7.9% 3.9% 5.4% 5.7% 3.52 3.49
Waste Management
406 2 16.3% 50.2% 17.2% 5.4% 6.9% 1.5% 2.5% 3.66 3.90
Community Health
406 4 6.7% 44.3% 25.9% 9.4% 3.2% 8.9% 1.7% 3.47 3.57
AVERAGE FOR THEME AS A WHOLE
3.33 3.49
The average performance rating for this Theme is 3.33. The equal top performers were:
Sewerage (3.76)
Water Supply (3.76) The poorest performing area was Public Transport (2.39). Significant variances (by location) from the sample averages are also shown, below each graph, for each responsibility area. Full data tables are included in the Appendix of this report.

Douglas Shire Customer Satisfaction Survey 2017 MARKET FACTS (QLD) PTY LTD 57
Significant variances were by: Location & Survey Type
20% of Northern – Poor
Significant variances were by: Location & Survey Type
30% of Northern – Poor
20% of Northern – Very Poor
Very Good
3%
Good 42%
Fair Only 37%
Poor 9%
Very Poor 5%
Don't Know3%
Not Applicable1% Road Construction
Very Good
5%
Good 39%
Fair Only 34%
Poor 14%
Very Poor 8%
Don't Know0% Not Applicable
0%
Road Maintenance

Douglas Shire Customer Satisfaction Survey 2017 MARKET FACTS (QLD) PTY LTD 58
Significant variances were by: Location & Survey Type
48% of Southern – Good
42% of Middle – Fair only
Significant variances were by: Location & Survey Type
50% of Middle – Good
14% of online surveys – Poor
Very Good 4%
Good 36%
Fair Only 30%
Poor 14%
Very Poor 4%
Don't Know3% Not Applicable
9%
Footpaths, Kerbing & Guttering
Very Good 4%
Good 35%
Fair Only 32%
Poor 8%
Very Poor 4%
Don't Know4%
Not Applicable13%
Street Lighting

Douglas Shire Customer Satisfaction Survey 2017 MARKET FACTS (QLD) PTY LTD 59
Significant variances were by: Location & Survey Type
47% of Southern – Good
16% of online surveys – Poor
No Significant variances.
Very Good 6%
Good 38%
Fair Only 32%
Poor 10%
Very Poor 6%
Don't Know2%
Not Applicable
6%
Traffic Management
Very Good 4%
Good 30%
Fair Only 32%
Poor 17%
Very Poor 6%
Don't Know4%
Not Applicable7%
Parking Facilities

Douglas Shire Customer Satisfaction Survey 2017 MARKET FACTS (QLD) PTY LTD 60
Significant variances were by: Location & Survey Type
27% of Southern – Good
22% of Southern – Fair only
36% of online surveys – Very poor
Significant variances were by: Location & Survey Type
68% of Southern - Good
Very Good 1%
Good 18%
Fair Only 15%
Poor 15%
Very Poor 26%
Don't Know9%
Not Applicable16%
Public Transport
Very Good 15%
Good 46%
Fair Only 11%
Poor 5%
Very Poor 5%
Don't Know3%
Not Applic -able15%
Water Supply

Douglas Shire Customer Satisfaction Survey 2017 MARKET FACTS (QLD) PTY LTD 61
Significant variances were by: Location & Survey Type
62% of Southern – Good
No Significant variances.
Very Good 15%
Good 46%
Fair Only 11%
Poor 5%
Very Poor 5%
Don't Know3%
Not Applicable15%
Sewerage
Very Good 8%
Good 44%
Fair Only 22%
Poor 7%
Very Poor 5%
Don't Know6%
Not Applicable8%
Drainage & Flood Mitigation

Douglas Shire Customer Satisfaction Survey 2017 MARKET FACTS (QLD) PTY LTD 62
Significant variances were by: Location & Survey Type
26% of Middle – Very good
62% of Southern – Good
16% of online surveys – Very poor
Significant variances were by: Location & Survey Type
26% of Northern – Poor
Very Good 16%
Good 50%
Fair Only 17%
Poor 5%
Very Poor 7%
Don't Know2%
Not Applicable3%
Waste Management
Very Good 7%
Good 44%
Fair Only 26%
Poor 9%
Very Poor 3%
Don't Know9%
Not Applicable2%
Community Health

Douglas Shire Customer Satisfaction Survey 2017 MARKET FACTS (QLD) PTY LTD 63
Theme 2: Community Lifestyle Services PERFORMANCE
TOTAL RANK Very Good
Good Fair Only
Poor Very Poor
Don't Know
Not App.
Mean 2017
LGAQ Mean 2017
Parks, Playgrounds & Public Amenities
406 3 9.1% 44.8% 32.5% 6.4% 3.4% 3.2% 0.5% 3.52 3.85
Environmental Controls
406 9 5.7% 38.4% 33.5% 10.1% 4.9% 7.1% 0.2% 3.32 3.40
Environmental Protection & Conservation
406 10 6.7% 38.4% 29.8% 13.5% 5.4% 6.2% 0.0% 3.29 3.30
Heritage Protection 406 7 3.9% 38.9% 32.5% 6.2% 3.7% 13.5% 1.2% 3.39 3.47
Sporting & Recreational Facilities
406 4 7.4% 45.6% 29.8% 6.7% 3.9% 5.7% 1.0% 3.49 3.78
Cultural & Entertainment Facilities
406 6 7.6% 39.4% 35.0% 7.1% 3.9% 5.9% 1.0% 3.43 3.71
Libraries & other Information Access
406 1 15.8% 50.7% 22.4% 3.4% 2.2% 4.4% 1.0% 3.79 4.02
Community Safety 406 5 6.2% 44.6% 31.0% 6.9% 4.4% 6.2% 0.7% 3.44 3.55
Community Service 406 8 4.2% 39.7% 32.8% 9.1% 3.7% 10.1% 0.5% 3.35 3.50
Pet/Animal Control 406 12 4.4% 35.7% 29.8% 14.0% 10.6% 4.2% 1.2% 3.10 3.42
Shopping Facilities 406 2 7.6% 52.7% 23.4% 7.1% 3.9% 2.0% 3.2% 3.56 3.79
Community Development
406 11 3.2% 38.7% 32.8% 8.1% 5.9% 9.4% 2.0% 3.28 3.50
AVERAGE FOR THEME AS A WHOLE 3.41 3.61
The average performance rating for this Theme is 3.41. The top performers were:
Libraries & Other Information Access (3.79)
Shopping Facilities (3.56) The poorest performing area was Pet and Animal Control (3.10). Significant variances (by location) from the sample averages are also shown, below each graph, for each responsibility area. Full data tables are included in the Appendix of this report.

Douglas Shire Customer Satisfaction Survey 2017 MARKET FACTS (QLD) PTY LTD 64
Significant variances were by: Location & Survey Type
10% of online survey – Very poor
No Significant variances.
Very Good 9%
Good 45%
Fair Only 33%
Poor 6%
Very Poor 3%
Don't Know3%
Not Applicable1%
Parks, Playgrounds & Public Amenities
Very Good 6%
Good 38%
Fair Only 34%
Poor 10%
Very Poor 5%
Don't Know7%
Not Applicable0%Environmental Controls

Douglas Shire Customer Satisfaction Survey 2017 MARKET FACTS (QLD) PTY LTD 65
Significant variances were by: Location & Survey Type
10% of online survey – Very poor
Significant variances were by: Location & Survey Type
9% of online survey – Very poor
Very Good 7%
Good 38%
Fair Only 30%
Poor 14%
Very Poor 5%
Don't Know6%
Not Applicable0%
Environmental Protection & Conservation
Very Good
4%
Good 39%
Fair Only 32%
Poor 6%
Very Poor 4%
Don't Know14%
Not Applicable1% Heritage Protection

Douglas Shire Customer Satisfaction Survey 2017 MARKET FACTS (QLD) PTY LTD 66
No Significant variances.
Significant variances were by: Location & Survey Type
56% of Northern – Fair only
49% of Middle - Good
Very Good 7%
Good 45%
Fair Only 30%
Poor 7%
Very Poor 4%
Don't Know6%
Not Applicable1%
Sporting & Recreational Facilities
Very Good 8%
Good 39%
Fair Only 35%
Poor 7%
Very Poor 4%
Don't Know6%
Not Applicable
1%
Cultural & Entertainment Facilities
Douglas Shire Customer Satisfaction Survey 2017 MARKET FACTS (QLD) PTY LTD 67
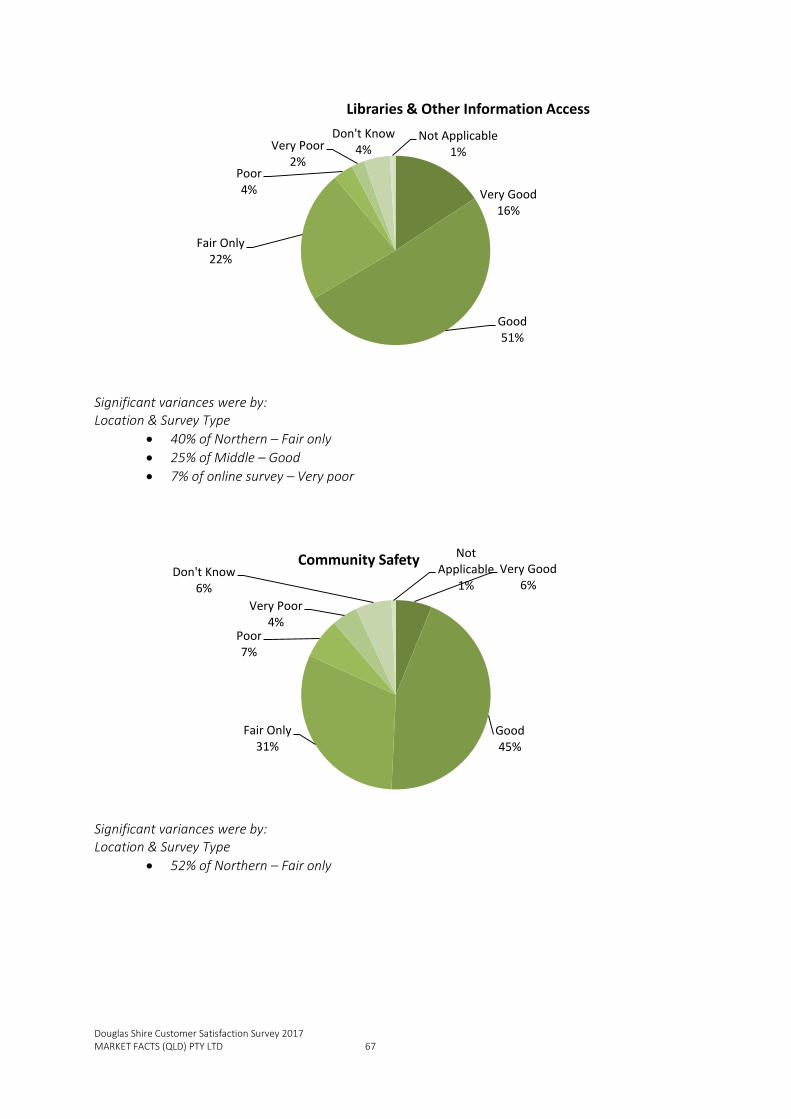
Significant variances were by: Location & Survey Type
40% of Northern – Fair only
25% of Middle – Good
7% of online survey – Very poor
Significant variances were by: Location & Survey Type
52% of Northern – Fair only
Very Good 16%
Good 51%
Fair Only 22%
Poor 4%
Very Poor 2%
Don't Know4%
Not Applicable1%
Libraries & Other Information Access
Very Good 6%
Good 45%
Fair Only 31%
Poor 7%
Very Poor 4%
Don't Know6%
Not Applicable
1%
Community Safety

Douglas Shire Customer Satisfaction Survey 2017 MARKET FACTS (QLD) PTY LTD 68
Significant variances were by: Location & Survey Type
20% of Northern – Poor
Significant variances were by: Location & Survey Type
50% of Northern – Fair only
50% of Southern – Good
18% of online survey – Very poor
Very Good 4%
Good 40%
Fair Only 33%
Poor 9%
Very Poor 4%
Don't Know10%
Not Applicable0%
Community Service
Very Good 4%
Good 36%
Fair Only 30%
Poor 14%
Very Poor 11%
Don't Know4%
Not Applicable
1%
Pet/Animal Control

Douglas Shire Customer Satisfaction Survey 2017 MARKET FACTS (QLD) PTY LTD 69
Significant variances were by: Location & Survey Type
22% of Northern – Poor
63% of Middle – Good
65% of Southern – Good
Significant variances were by: Location & Survey Type
20% of Northern – Poor
16% of Northern – Very poor
Very Good 8%
Good 53%
Fair Only 23%
Poor 7%
Very Poor 4%
Don't Know
2%
Not Applicabl
e3%
Shopping Facilities
Very Good 3%
Good 39%
Fair Only 33%
Poor 8%
Very Poor 6%
Don't Know9%
Not Applicable
2%
Community Development

Douglas Shire Customer Satisfaction Survey 2017 MARKET FACTS (QLD) PTY LTD 70
Theme 3: Managing the Shire PERFORMANCE
TOTAL RANK Very Good
Good Fair Only
Poor Very Poor
Don't Know
Not App.
Mean 2017
LGAQ Mean 2017
Town Planning 406 4 6.4% 37.9% 34.5% 8.9% 6.2% 5.9% 0.2% 3.31 3.40
Building Control 406 3 5.2% 40.6% 33.7% 8.6% 4.4% 7.1% 0.2% 3.36 3.45
Economic Development & Local Employment
406 6 3.0% 31.5% 33.5% 18.2% 6.7% 6.4% 0.7% 3.06 3.01
Development of Tourism
406 1 9.1% 39.4% 31.5% 10.3% 5.4% 3.2% 1.0% 3.38 3.39
Financial Management
406 2 8.4% 33.5% 25.6% 8.4% 5.9% 17.2% 1.0% 3.37 3.25
Revenue-raising 406 5= 5.2% 32.0% 31.3% 11.3% 6.2% 13.1% 1.0% 3.22 3.14
Staff Management 406 5= 3.4% 28.3% 25.9% 9.1% 5.2% 27.1% 1.0% 3.22 3.39
AVERAGE FOR THEME AS A WHOLE
3.28 3.29
The average performance rating for this Theme is 3.28. The top performers were:
Development of Tourism (3.38)
Financial Management (3.37) The poorest performing area was Staff Management (3.22). Significant variances (by location) from the sample averages are also shown, below each graph, for each responsibility area. Full data tables are included in the Appendix of this report.

Douglas Shire Customer Satisfaction Survey 2017 MARKET FACTS (QLD) PTY LTD 71
Significant variances were by: Location & Survey Type
50% of Southern – Good
Significant variances were by: Location & Survey Type
56% of Northern – Fair only
Very Good 6%
Good 38%
Fair Only 35%
Poor 9%
Very Poor 6%
Don't Know
6%
Not Applicable0%
Town Planning
Very Good 5%
Good 41%
Fair Only 34%
Poor 9%
Very Poor 4%
Don't Know
7%
Not Applicable
0%
Building Control

Douglas Shire Customer Satisfaction Survey 2017 MARKET FACTS (QLD) PTY LTD 72
Significant variances were by: Location & Survey Type
12% of online surveys – Very poor
Significant variances were by: Location & Survey Type
22% of Northern – Poor
Very Good 3%
Good 32%
Fair Only 33%
Poor 18%
Very Poor 7%
Don't Know6%
Not Applicable1%
Economic Development & Local Employment
Very Good 9%
Good 39%
Fair Only 32%
Poor 10%
Very Poor 6%
Don't Know
3%
Not Applicable1%
Development of Tourism
Douglas Shire Customer Satisfaction Survey 2017 MARKET FACTS (QLD) PTY LTD 73
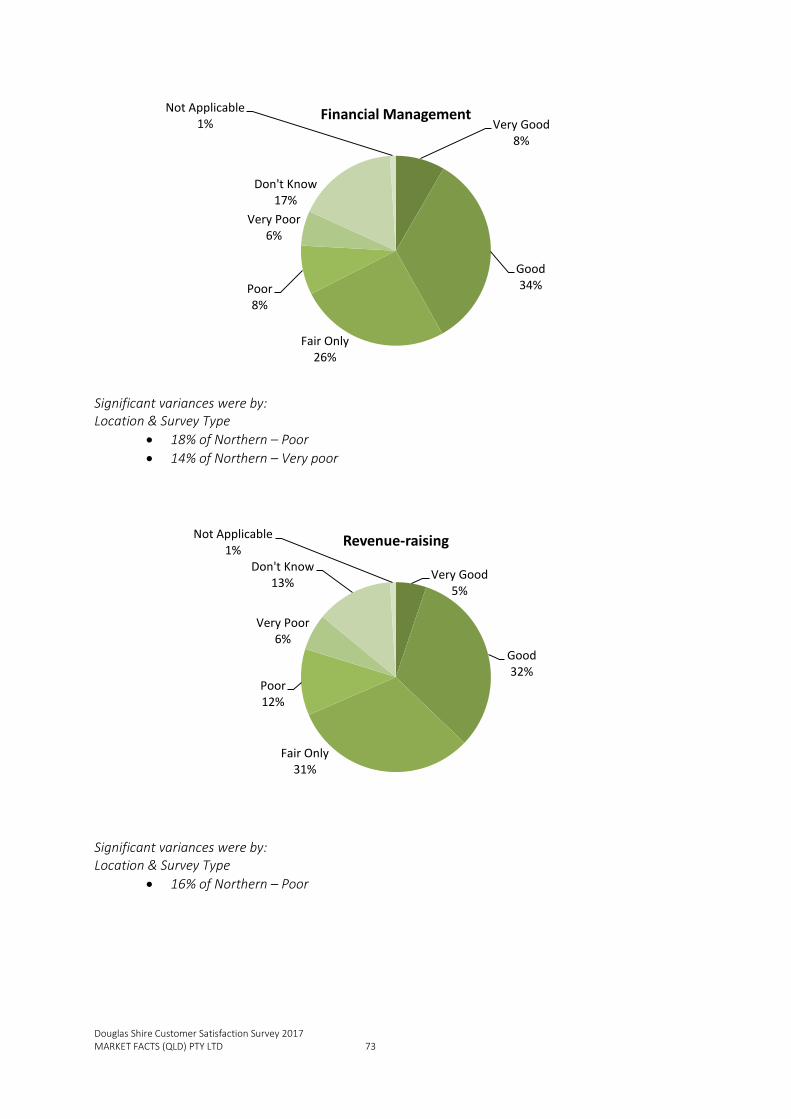
Significant variances were by: Location & Survey Type
18% of Northern – Poor
14% of Northern – Very poor
Significant variances were by: Location & Survey Type
16% of Northern – Poor
Very Good 8%
Good 34%
Fair Only 26%
Poor 8%
Very Poor 6%
Don't Know17%
Not Applicable1%
Financial Management
Very Good 5%
Good 32%
Fair Only 31%
Poor 12%
Very Poor 6%
Don't Know13%
Not Applicable1%
Revenue-raising

Douglas Shire Customer Satisfaction Survey 2017 MARKET FACTS (QLD) PTY LTD 74
Significant variances were by: Location & Survey Type
24% of Northern – Poor
16% of Northern – Very poor
Very Good
4%
Good 28%
Fair Only 26%
Poor 9%
Very Poor 5%
Don't Know27%
Not Applicable1%
Staff Management
Douglas Shire Customer Satisfaction Survey 2017 MARKET FACTS (QLD) PTY LTD 75
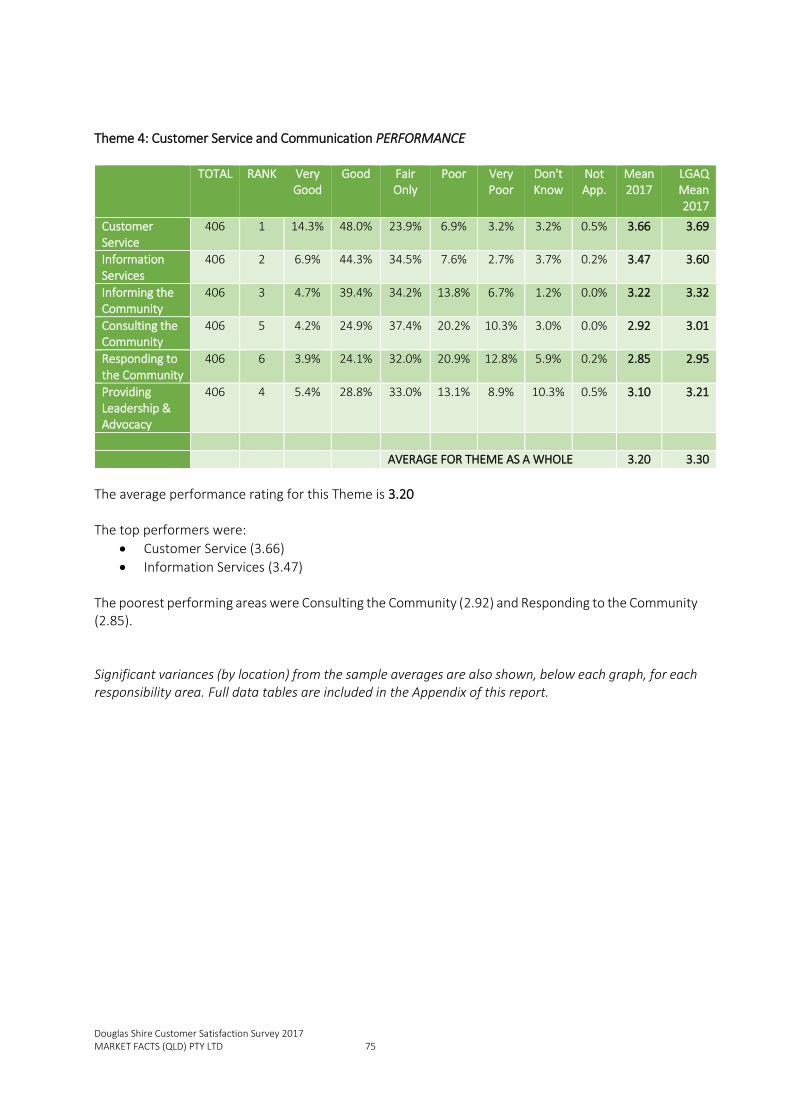
Theme 4: Customer Service and Communication PERFORMANCE
TOTAL RANK Very Good
Good Fair Only
Poor Very Poor
Don't Know
Not App.
Mean 2017
LGAQ Mean 2017
Customer Service
406 1 14.3% 48.0% 23.9% 6.9% 3.2% 3.2% 0.5% 3.66 3.69
Information Services
406 2 6.9% 44.3% 34.5% 7.6% 2.7% 3.7% 0.2% 3.47 3.60
Informing the Community
406 3 4.7% 39.4% 34.2% 13.8% 6.7% 1.2% 0.0% 3.22 3.32
Consulting the Community
406 5 4.2% 24.9% 37.4% 20.2% 10.3% 3.0% 0.0% 2.92 3.01
Responding to the Community
406 6 3.9% 24.1% 32.0% 20.9% 12.8% 5.9% 0.2% 2.85 2.95
Providing Leadership & Advocacy
406 4 5.4% 28.8% 33.0% 13.1% 8.9% 10.3% 0.5% 3.10 3.21
AVERAGE FOR THEME AS A WHOLE 3.20 3.30
The average performance rating for this Theme is 3.20 The top performers were:
Customer Service (3.66)
Information Services (3.47) The poorest performing areas were Consulting the Community (2.92) and Responding to the Community (2.85). Significant variances (by location) from the sample averages are also shown, below each graph, for each responsibility area. Full data tables are included in the Appendix of this report.

Douglas Shire Customer Satisfaction Survey 2017 MARKET FACTS (QLD) PTY LTD 76
No Significant variances.
Significant variances were by: Location & Survey Type
56% of Northern – Fair only
55% of Middle – Good
Very Good 14%
Good 48%
Fair Only 24%
Poor 7%
Very Poor 3%
Don't Know3%
Not Applicable1%
Customer Service
Very Good 7%
Good 44%
Fair Only 34%
Poor 8%
Very Poor 3%
Don't Know
4%
Not Applicable0%
Information Services

Douglas Shire Customer Satisfaction Survey 2017 MARKET FACTS (QLD) PTY LTD 77
No Significant variances.
Significant variances were by: Location & Survey Type
56% of Northern – Fair only
55% of Middle - Good
Very Good 5%
Good 39%
Fair Only 34%
Poor 14%
Very Poor 7%
Don't Know
1%Not Applicable
0%
Informing the Community
Very Good 7%
Good 44%
Fair Only 34%
Poor 8%
Very Poor 3%
Don't Know4%
Not Applicabl
e0%
Information Services

Douglas Shire Customer Satisfaction Survey 2017 MARKET FACTS (QLD) PTY LTD 78
Significant variances were by: Location & Survey Type
22% of online survey – Very poor
Significant variances were by: Location & Survey Type
30% of Northern – Poor
38% of Middle – Good
18% of online survey – Very poor
Very Good 4%
Good 24%
Fair Only 32%
Poor 21%
Very Poor 13%
Don't Know6%
Not Applicable
0%
Responding to the Community
Very Good 5%
Good 29%
Fair Only 33%
Poor 13%
Very Poor 9%
Don't Know10%
Not Applicable1%
Providing Leadership & Advocacy

Douglas Shire Customer Satisfaction Survey 2017 MARKET FACTS (QLD) PTY LTD 79
Theme 5: Quality of Council PERFORMANCE
TOTAL RANK Very
Good Good Fair
Only Poor Very
Poor Don't Know
Not App.
Mean 2017
LGAQ Mean 2017
Quality of Elected Council
406 3 7.9% 39.7% 31.3% 9.4% 5.9% 5.4% 0.5% 3.36 3.39
Quality of Councillor(s) Dealt with
406 4 7.9% 31.8% 27.1% 9.4% 5.7% 9.4% 8.9% 3.33 3.34
Managerial & Supervisory Officers
406 5 3.4% 31.0% 26.1% 8.9% 6.7% 22.7% 1.2% 3.21 3.36
Quality/Performance of Outdoor Workers
406 2 6.9% 42.6% 29.8% 6.4% 5.4% 8.6% 0.2% 3.43 3.68
Quality/Performance of Indoor Staff
406 1 7.6% 46.6% 24.9% 4.2% 3.2% 12.8% 0.7% 3.59 3.59
AVERAGE FOR THEME AS A WHOLE 3.38 3.47
The average performance rating for this Theme is 3.38. The top performers were Quality/Performance of Outdoor Staff and Indoor Staff with 3.59 and 3.43 respectively. The poorest performing area for this theme was the Managerial & Supervisory Officers (3.21). Significant variances (by location) from the sample averages are also shown, below each graph, for each responsibility area. Full data tables are included in the Appendix of this report.

Douglas Shire Customer Satisfaction Survey 2017 MARKET FACTS (QLD) PTY LTD 80
No Significant variances.
Significant variances were by: Location & Survey Type
32% of Northern – Poor
Very Good 8%
Good 40%
Fair Only 31%
Poor 9%
Very Poor 6%
Don't Know5%
Not Applicable1%
Quality of Elected Council
Very Good 8%
Good 32%
Fair Only 27%
Poor 9%
Very Poor 6%
Don't Know9%
Not Applicable9%
Quality of Councillor(s) Dealt with

Douglas Shire Customer Satisfaction Survey 2017 MARKET FACTS (QLD) PTY LTD 81
Significant variances were by: Location & Survey Type
26% of Northern – Poor
16% of Northern – Very poor
Significant variances were by: Location & Survey Type
16% of Northern - Poor
54% of online surveys - Good
Very Good
3%
Good 31%
Fair Only 26%
Poor 9%
Very Poor 7%
Don't Know23%
Not Applicable
1%
Managerial & Supervisory Officers
Very Good 7%
Good 43%Fair Only
30%
Poor 6%
Very Poor 5%
Don't Know9%
Not Applicable0%
Quality/Performance of Outdoor Workers

Douglas Shire Customer Satisfaction Survey 2017 MARKET FACTS (QLD) PTY LTD 82
Significant variances were by: Location & Survey Type
44% of Northern – Fair only
18% of Northern – Poor
Very Good 8%
Good 46%
Fair Only 25%
Poor 4%
Very Poor 3%
Don't Know13%
Not Applicable1%
Quality/Performance of Indoor Staff

Douglas Shire Customer Satisfaction Survey 2017 MARKET FACTS (QLD) PTY LTD 83
PUBLIC OPINION QUESTIONS – KEY FINDINGS This section of the report presents the key findings of the two public opinion questions. They were asked as ‘open ended questions’ in the survey. However, in order to give a snapshot summary, they are also graphically presented. In this survey, all questions were included in the briefing mail-out sent to each respondent prior to the main telephone interview. Consequently, respondents had time to think about the question, and give a ‘considered’ opinion. They were requested to do just this – even discuss the question with friends and relations – in the briefing letter. 1. Council consistently strives to strike the right balance between providing the best possible
services and operating within its financial means. Would you prefer that Council…
Almost two thirds (67%) of respondents would prefer to leave things as they are in terms of current service levels and rates.
Only 9% of respondents would prefer to reduce service to lower cost to ratepayers.
16% of respondents would prefer Council provided increases services at higher cost to ratepayers.
Neither a) not b) - leave things
as they are67%
Provided improved or
increased services, at a higher cost to
ratepayers16%
Don't know8%
Reduce services and lowered the
cost to ratepayers
9%
Striving for a balance between providing the best possible services and operating within
its financial means

Douglas Shire Customer Satisfaction Survey 2017 MARKET FACTS (QLD) PTY LTD 84
2. In your opinion, what is the Douglas Shire’s greatest strength?
A quarter (24.6%) of respondents believe the natural environment, which includes the Great Barrier Reef (GBR), the Daintree and general climate as the Shire’s greatest strength.
Lifestyle and friendly atmosphere of the Shire rated second – 20.4%.
Tourism (12.6%) was rated as the third greatest strength.
Local agriculture/sugar cane industry was the lowest rating strength.
24.6
20.4
12.8 12.6
9.4 8.4 7.6
4.2
0
5
10
15
20
25
30
Douglas Shire's greatest strengths

Douglas Shire Customer Satisfaction Survey 2017 MARKET FACTS (QLD) PTY LTD 85
2. In your opinion, what is the Douglas Shire’s greatest weakness? A third (35.2%) of respondents believe the Shire’s limited financial resources, was its greatest weakness. A further 17.5% of respondent nominated roads and drainage, and lacking community infrastructure (17%) , as the greatest weaknesses of the Shire.
35.2
18.5 17.515.5 15.5 15.5 15
13.1
0
5
10
15
20
25
30
35
40
Douglas Shire's Greatest weakness

Douglas Shire Customer Satisfaction Survey 2017 MARKET FACTS (QLD) PTY LTD 86
3. There are many things that people use to judge their lifestyle and the quality of their neighbourhood and communities. Please tell me three things that are important to you.
The top three most important things to Douglas Shire residents and used as an indication of the quality of their neighborhoods and communities were:
Friendly, quiet and safe atmosphere
Maintaining ‘clean’ and green environment
Better community facilities First, second and third response to this question are shown graphically below.
31.8
14.312.8
7.66.2
4.9 4.2 3.9 3.2
11.6
13.312.6
8.6
4.4
11.1
3.7 3.72.2
7.6 7.9
5.2 4.93
18.2
4.9 4.2
1.7
0
5
10
15
20
25
30
35
Friendly,quiet, safe
atmosphere
Maintain"Green" and
cleanenvironment
Bettercommunity
facilities
Climate /weather
Improvesafety and
crimereduction
Don't know /No response
Better roadaccess /
maintenance
Increasedemploymentand businessopportunities
Improvebeach
maintenance
3 Most important things to you...
FIRST SECOND THIRD

Douglas Shire Customer Satisfaction Survey 2017 MARKET FACTS (QLD) PTY LTD 87
4. Council is constantly striving to communicate well with residents. What would be the method/s you
would choose to receive information about council?
With almost two thirds (62.8%) of respondent nominating the local newspaper, this is clearly the preferred method for Council to communicate with the community.
Emails were least preferred method for Council to communicate with the community.
62.8
30 29.325.9
21.7
13.19.6
0
10
20
30
40
50
60
70
Best method for communicating with residents

Douglas Shire Customer Satisfaction Survey 2017 MARKET FACTS (QLD) PTY LTD 88
5.a Thinking back to the last Council election, how did you source information on the candidates?
66% of respondents nominated the local newspaper as their key source of information on candidates for local Council elections.
5.b (If family or friends mentioned as a source in 5a, ask…) How do you think they sourced the
information?
For the 27.8% of respondents that mentioned they received information from family and friends about the local Council election, just over half (54.9%) nominated local newspapers as their source of information.
66
27.823.6
20.7
14.511.6
0
10
20
30
40
50
60
70
Sources of infromation - last Council election
54.9
32.7
25.7
12.4 12.46.2
3.5
0
10
20
30
40
50
60
Family/friends - sources of infromation on Council last election
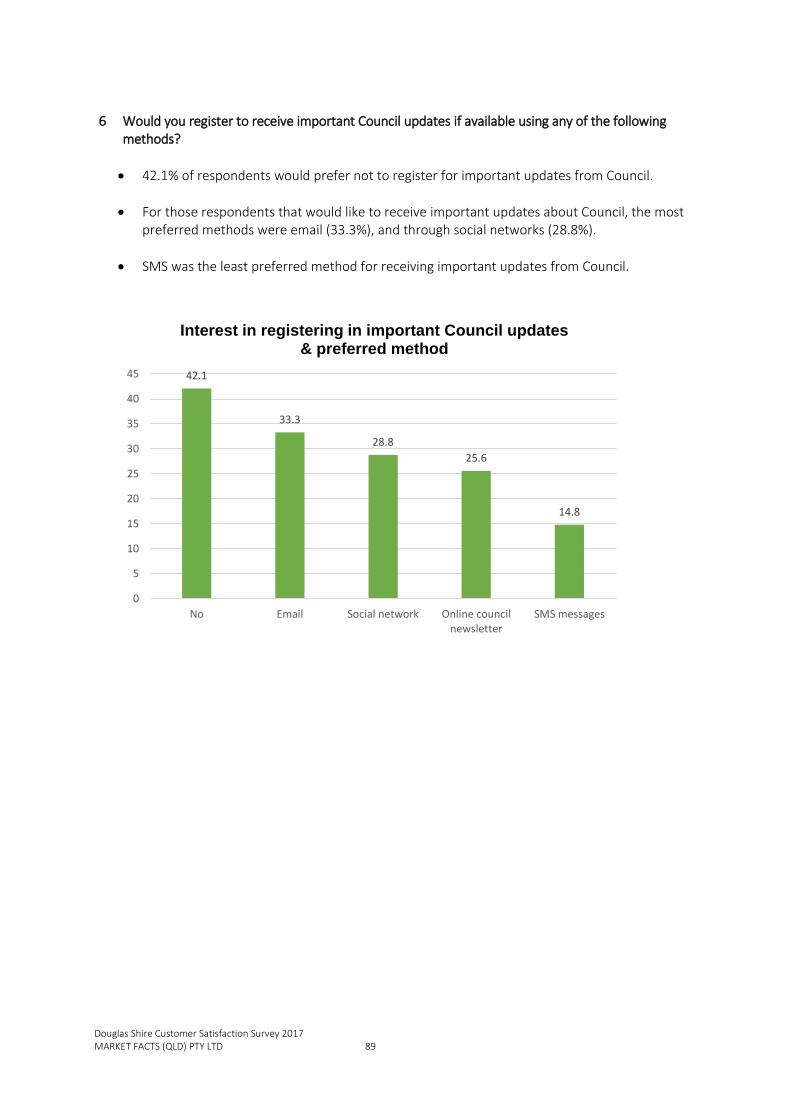
Douglas Shire Customer Satisfaction Survey 2017 MARKET FACTS (QLD) PTY LTD 89
6 Would you register to receive important Council updates if available using any of the following
methods?
42.1% of respondents would prefer not to register for important updates from Council.
For those respondents that would like to receive important updates about Council, the most preferred methods were email (33.3%), and through social networks (28.8%).
SMS was the least preferred method for receiving important updates from Council.
42.1
33.3
28.8
25.6
14.8
0
5
10
15
20
25
30
35
40
45
No Email Social network Online councilnewsletter
SMS messages
Interest in registering in important Council updates & preferred method

Douglas Shire Customer Satisfaction Survey 2017 MARKET FACTS (QLD) PTY LTD 90
7. And finally, we would like to know what you would like to see the Douglas Shire become in the
year 2030. In your opinion, what one thing does the Douglas community have to do if the area is to develop in a way that meets your expectations of the future?
The verbatim responses provided are outlined below and sorted into key themes. Environment
A place where people behave themselves. It's not a camp site.
Maintain small country town atmosphere.
Maintain the environment.
Higher density development to protect the land - urban sprawl
We have to put a greater afford into preservation and protecting the very unique fragile and
precious environment we live in. We need better croc management, not random removal, we
need to pay more attention to our backyard the rainforest and the reef and we really should
look into better recycling. Europe is way ahead of us in these things. Plastic bottle returns and
a plastic bag ban. Let's protect what we got. Oh and bring back that animal shelter for Christ
sake!! Give them a place to stay
Move towards sustainable farming which does impact on environment eg reef promotion for
more tourism and new sustainable industries
No high rise development
Keeping a small town atmosphere at a lower cost
100% renewable energy for the entire shire and reinstatement of our bio filtration water
supply.
Before a more environmentally aware and sustainable community
Mossman tourism/beautification
Botanical gardens.
Environmentally sustainable infrastructure development so we can utilise and enjoy the most
amazing environmental playground in Australia.
Less Plastic bags in landfill
Have good crocodile management
Also more efforts to get everyone involved in the preservation of the Great Barrier Reef
Plastic bag free,
Play a more proactive role, manage wildlife better
Be progressive and have sustainable development
Control development - don't want it to change from what it currently is
Clean-up all the rubble in the area
Maintenance of natural surroundings
Keep the small town atmosphere
Good town planning - places for aged care. Be harmonious with developers but don't let
developers take over
Good town planning. Keep the developers out or work harmoniously with the environment.
People are here to stay away from all the trappings
Clean and tidy town/low crime. Cap on high density holiday development
A lot more thought about what over development will do to the place
Expand sustainability - keep lifestyle - no development on beach areas. Rates aren't
everything.

Douglas Shire Customer Satisfaction Survey 2017 MARKET FACTS (QLD) PTY LTD 91
Have tourist industry consider the environmental area. They come to enjoy but are killing it.
Clean tidy town/ low crime/ cap high density holiday development
Over development
I would like to see the Shire to continue as a Safe, Clean, and Pleasant place to live, without
the necessity for things like costly metered parking, and closed circuit TV cameras
everywhere, with a low crime/Drug Problems.
Economic Development
Small town but with economic sustainability.
An economically growing town without losing the small town ambience.
Put decision making back in the hands of residents, not developers.
Develop Daintree township better.....there's no disability parking! The township has lots of
cars drive there but they turn around and think is that it? Daintree township doesn't even
need marketing as it's known already worldwide,,, use that free fame and somehow offer
more to people....make it into a little hub.... arty hub/ like Kuranda or a little Nimbin or
crocodile theme park? More trees in main drag.
Economic development to ensure that if the mill ever went bust, Mossman doesn't turn into a
ghost town.
Look beyond port Douglas and improve communities North such as Mossman and Wonga
Beach.
More employment in the area. Encourage more businesses to the area.
Encourage business growth.
Keep agriculture going - ensure employment opportunities for people.
Try to end barriers to development. Waste facilities will fit with environmental expectations.
Plan for local waster facility - not a transfer station.
Employment opportunities.
Population is aging and not many young people are coming into the area. Need job
opportunities.
Employment diversification.
More positive development to create jobs. Don't just develop for the immediate money for
developers.
Generate a new revenue stream from a local industry that is not tourism based.
Support the Cape Tribulation and north of the river area better. This area is the jewel in the
crown here. Port Douglas has the accommodation - we have the rainforest and the reef. Be
more supportive of the communities north of the river.
Creating jobs which are not seasonally dependent. We need the opportunity to be able to
earn on a capacity as other fellow Australian's so we can afford to buy our own homes or at
least stay within them. There are not enough fulltime (or professional) job opportunities for
long term locals in comparison to casual employment that leave us going broke in off seasons.
More local employment for school leavers.
A shire with low youth unemployment - council employing local young people where possible
and training them as necessary.
Increase development. More sewerage in outer areas.
Encourage growth with restriction on numbers.
Development of both rural & commercial development.
Greater opportunity for local employment.

Douglas Shire Customer Satisfaction Survey 2017 MARKET FACTS (QLD) PTY LTD 92
More development.
Limit development - resist development.
Keep a balance between agriculture, environment, and tourism & be economically
sustainable.
Allow farmers to develop their properties, re-zoning.
More employment.
Run more efficiently & increase business development.
Employment creation.
Prevent development in general eg on the inlet.
Douglas Shire needs to recognize that is the regions away from Port and Mossman are to be
treated in every other way like an urban society, that some of the trappings of urbanity need
also to flow there, whether it means subsidies or not. Having a 'green shire' is simply bullshit,
if these areas have no effective waste disposal, no dog control, slippery, dangerous roads, no
line marking, and no effective way across the river. (Despite the ferry making a mint). There is
more.
Play a leading role in removing barriers to and facilitating economic development north of the
River.
Douglas Shire needs to be always working strategically and always develop and innovate with
world leading and world's best developments.
A shire that realises local agriculture is as important as the reef.
Continue growth - allow more development.
Allow growth and development in the area.
Not too much subdivision.
Not listen to outsiders re development.
Economic development creating jobs for the area but don't want the environment spoilt.
Develop the esplanade. Keep town very neat and tide.
Less development.
Marina development completed on foreshore hotel.
Bit more diverse in Economic development.
Have development but at a slow pace so that infrastructure supports growth. Limit building
heights.
Develop the waterfront and build a 'natural' environment style pool 8n the vicinity of Rex Seal
Park.
Stop developing and start maintaining.
Be more diverse with businesses.
Singular focus on developing the shire as Queensland’s top tourist destination whilst
maintaining our unique upmarket niche.
Start small business eg coconuts industry only costs 20.000 to start if Solomon Islands can do
it so can we, and the chocolate/cocoa industry growing and manufacturing to bring tourists to
the area.
NO to develop this area.
Allow more development for job growth without over doing it.
No more development especially holiday accommodation.
Protect agriculture and primary production as an employment option.
Tourism

Douglas Shire Customer Satisfaction Survey 2017 MARKET FACTS (QLD) PTY LTD 93
Think more about the needs of the locals - not the tourists.
Keep it family friendly. Tourists come and go but look after the locals.
Retain present mixture of agriculture and tourism.
The best tourist area in Qld.
This is tourist destination, build the right infrastructure and attract the right people to provide
the associated tourism services.
Focus on tourism and development to offset decline in sugar industry.
More diversity in tourism and agriculture / more planning and council community consultation
and general consultation.
Stop relying on tourism.
An excellent tourist destination with limited development.
Improve family service like lagoons because of jelly fish & crocodiles bring more tourists in
because of this.
Keep doing what they are in the community re developing tourism.
Promote tourism.
Promote our region more.
More tourism industry - community will have to accept need for more tourism development.
Ensure that we do not become solely a community town with tourism accommodation. We
need permanent residents renting and owning, affordable, so the community grows and
becomes more stable.
Tourism, but not at the expense of locals. Retain Conservation as the main priority.
More development of tourism and tourism businesses.
Upgrade tourist attractions & be friendlier towards tourists.
Promote reef as a sustainable resource for tourism - which it is not dying/dead.
Community Facilities/Services
Fishing co-op.
Facilities for employment training & encouraging business development in the area.
Open botanical gardens in Mossman.
More development - sporting facilities for children.
More and higher standard of community health services for substance abuse and domestic
violence. This includes domestic violence education of police officers to ensure ALL AVO
breaches are taken seriously by the police and victims feel assisted instead of further
victimised. Education of youth about what abusive relationships look like in all forms.
Greater control of feral animals - dogs, cats, pigs.
Local pool.
More is needed for young families. Upgraded and impressive playgrounds, water play park
similar to muddies. Impressive landscaping in the town, future residential town planning.
Better support for crucial community services ensure our future leaders have support and
advocacy. Strong foundations help for a strong future.
Put in some facilities for young people.
Provision of a major shopping centre in the area.
Provision of better maintenance of Mossman.
Get transport service for locals.
More things for young families.
Need a Lagoon pool.

Douglas Shire Customer Satisfaction Survey 2017 MARKET FACTS (QLD) PTY LTD 94
Maintain playgrounds and footpaths.
I also would like to see the Council institute a Home Gardening Programme based on
household needs for weekly Fruit and Veg @ based on simple Organic principles, and have a
practical common sense gardener/horticulturalist appointed to Council to help @ encourage.
We are becoming an aging population. I would like to see Douglas Shire looking after our
elderly and aging residents better. The retirement village in Port Douglas should have been
given the go ahead in my opinion.
Shift the focus from tourism to community. Support locally grown and produced goods, put
more information out there regarding community support/volunteering, set up a public
transport service connecting our community.
I would like to see local council members using the facilities in our local community. Local
cafes, shopping centres and schools.
More services to our area.
Aged care facilities and/or Retirement Village.
24 hr medical centre for afterhours which is bulked billed rather than hospital.
Better serviced communities.
Better services out our way.
Broaden their minds & allow shops other than cafes in the area.
Facilities to encourage young families to live in the area.
Public transport to outlying areas.
The provision of a high school & aged care facilities.
Keep services maintained and up-to-date.
Facilities for families.
More sporting facilities - things for children to do.
A robust economical transport service.
Growth, retirement villages for the aging population, more areas of land released for
development.
More public toilets, better TV reception, keep the towns tidy.
Provide more elderly housing options.
Cater for the needs of older people, including at least one retirement village.
Bring more community functions back eg dances.
An area promoting inclusion of seniors as part of the community. Facilitate more
development for seniors - thinking ahead.
Continuing to provide facilities & services for elderly.
Better public transport. Law and order.
More aged care facilities.
That the Douglas Shire Council buys back for public and community use the block of land in
Mowbray Street Port Douglas.
Community services.

Douglas Shire Customer Satisfaction Survey 2017 MARKET FACTS (QLD) PTY LTD 95
Finance
Keeping rates down.
Amalgamate with state government to lower costs.
Spend more money on the outer communities and not just Port Douglas itself, the Daintree
has a lack of services like rubbish pick up, electricity and a bridge for the Daintree River as the
ferry isn't working with long line-ups.
Don’t forget the local keep it simple n keep rates down. Don’t overspend on infrastructure you
cannot afford. Cater to majority of residents not tourists or seasonal residents.
Use funds for other communities not just yet.
More money - better budget.
To be better funded in order to keep promises made to residents.
That Port Douglas not be the main focus of Rate Payers Money.
Stop taking all the financial gain from the Daintree area and not reinvesting it there. Sort the
roads out over the river and sort the ferry out, it becomes more of a disaster as each season
gets busier. Pop up there now and see how much you enjoy sitting in your hot car for 45mins.
Clean up the Shire, the sugar industry has to go, hemp would be better.
Continue maintaining our shire as is within its financial limits & Budget.
More equality of rates i.e. the people who cost the Council more should pay more.
Keep rates low as possible - support anyway to increase employment opportunities - need a
public link between Mossman and Port Douglas.
Infrastructure
Make sure we have adequate water supply.
The provision of public transport for those who can’t drive.
Seal as many roads as possible.
Lagoon pool.
More clever town planning, a sporting precinct, and communication on the plan for the town
planning, so we can see what we are looking to achieve i.e. botanical gardens.
To have the power north of the river and at reasonable prices.
National broad band.
Improve public transport Port Douglas to Cairns.
Supply more tourist facilities / cull crocs support growth of population - more infrastructure
and commercial development.
Bridge between top ends of Port Douglas to Mossman, connecting ring road to Bruce
Highway.
Bicycle friendly connections between all areas in the shire.
We need to encourage families to stay here longer than 'the season' by providing more
things/facilities for those people with children to do. Often people new to the area will move
on as 'there is nothing to do here'. More park facilities, need to be built where the families
actually live - not in town. Council needs to place greater conditions on future housing
development to cater for this - a vacant block with nothing on it does not denote a 'park'.
Good schools so kids don't feel it's necessary to travel to Cairns and a TAFE facility up here
again. Health services. Affordable public transport.
Have all communities with power and water.

Douglas Shire Customer Satisfaction Survey 2017 MARKET FACTS (QLD) PTY LTD 96
Have reliable internet and mobile phone access.
Small airport for tourists.
Better roads, lower rate prices.
Sort out the ferry problems.
More walking tracks in the mountains.
Invest in botanical gardens at Mossman. Fix up intersection in front of hardware store at
Mossman.
Ensure provision of facilities, animal shelter, fishing bridge.
Cooyar beach turnoff from highway very dangerous needs improving.
Develop an esplanade along the coast with Water Park.
Lack of infrastructure and maintenance.
Good roads and support services.
Grid power north of the Daintree.
An electric train service to Cairns taking in the northern beaches and airport. Would be an
attraction in itself, one of the best train rides of the world. Take a lot of traffic off the roads
and give access when roads are closed due to accidents. Maybe even get the sugar trucks off
the road. Would be expensive but so is an upgrade to the Captain Cook why and the road
closures to our reputation and businesses.
Improve and manage infrastructure to provide a well-managed and visually attractive area to
accommodate continuing rise in tourism and ensuring a safe and attractive place to reside.
Roads.
Construct venues and support the many artists in the shire to give a boost to the tourism in
the whole shire not just certain areas.
For all areas to have sealed roads and services.
Electricity across the river.
Maintain their existing facilities.
Sewerage for Wonga - promised 11 years ago.
Ensure adequate water supply.
More street lighting.
Fix the traffic congestion at the Daintree Ferry. Resolve power issues north of the ferry.
Public transport.
Finish the waterside walkway, then develop the old Havana site as an aquatic/adventure park
for all ages. Tear down that dreadful fence, please.
Second ferry or a bridge for locals. Community health facility for across the river. Public
affordable transport for all communities.
Governance
Better led council / more competent council staff.
Stop ignoring the rest of your constituency in favour of only looking after port Douglas.
Maintain roads and facilities in your regional areas.
Provide equal provision of maintenance of facilities in all areas.
Resisting State Government pressures for inappropriate levels of changes to planning
legislation. I fear developers will prevail - money talks.
Listen to ratepayers and stop the blatant abuse of power- Shannon vale development in flood
zone is a prime example.
Better managed.

Douglas Shire Customer Satisfaction Survey 2017 MARKET FACTS (QLD) PTY LTD 97
Diversify the area - amalgamate with Cairns.
Empowerment of the people to be responsible of their local area.
Maintaining current building controls.
Amalgamate with Cairns and services and tourism will work for everyone and there will be
work.
Keep control of building and planning - don't let developers sneak in.
A council that listens to ratepayers - approval of development applications when majority of
ratepayers say No will result in council and mayoral discord........
The tranquillity not disturbed by too much government intervention.
Continue to support town planning and don't give into developer’s money.
Stick to town planning and get it right.
Controlled development and expansion.
Provide clear leadership to the residents across the river. By this I mean, not ignore the trolls
and haters (Even though it may be easier to take this strategy) but have more community
face-to-face meetings. The people across the river love meeting our councillors.
Improve the quality of its Councillors and senior management.
Controlled development.
Feels very strongly about seeing council work harder for their money.
Amalgamate with Cairns - more things will get done.
Put more effort into the smaller areas instead of spending it all on port Douglas.
Protect itself from outside influences - resist pressures from outside.
Bi-Monthly communication meetings with Locals in their area. No matter how hard we try to
communicate with Council, our wants and needs rarely get your attention. The establishment
of power to the land north of the Daintree River is essential - whether RAPS etc. Support for
our nurse and clinic and a Police presence now and then would help.
Other
A shire with affordable options for older people - not sure what action is needed.
Don’t want too much change it is wonderful the way it is.
Getting rid of the portal that has been on the North side of the Daintree River for already a
very long time.
This survey is way too long.
Community needs to be more involved and inform themselves as opposed to inaccurate word
of mouth. Support the local community groups and engage/support Council in
adopting/changing policy.
Create more affordable housing for hospitality staff coming into the area.
Focus on community priorities first not the whinging Facebook wheel.
Consultation.
Fully functional in all areas in the district.
Leave it as is.
Be careful about some of the 'progress' pressures from outside.
Anything that would change the composition of population, a lot of Muslims coming into the
area.
Impossible to do but I like to see them keep out people who want to change the place or
make trouble for the people living here.
Offer something for tourist, locals, families that doesn't cost anything to use.

Douglas Shire Customer Satisfaction Survey 2017 MARKET FACTS (QLD) PTY LTD 98
Improve communications from council / activities / festivals / bulletin board for what's on.
A big ask... as we do not have a clue what is likely to develop in the next 13 years. We have to
significantly 'power-down' (that probably will be forced upon us) - we don't know what
changes climate change will bring (GBR??) - I would expect a serious reduction in tourism
numbers (GHG contributions from travel - and I suspect an economic/financial depression) - If
we don't start planning for these eventualities we will be in trouble. Prediction, especially
about the future, is always difficult!
Drive crocodiles back up the creeks, build community public spaces for residents outside of
Port Douglas. Increase rates for non-resident owners to subsidise residents living in the shire.
Improve the ferry service at the Daintree. Take a more active role in promoting power and
telecommunications in the Daintree. Just leaving it in the 'too hard' basket is not good
enough.
Solar rebates North do the River, more facilities for our kids North of the River i.e. workshops
sporting clinics, Continued medical services.
Have morals & be proud to stand for this community. Support your community & listen to &
support longstanding members of this shire. Look after the Eco systems & make every resort
be countable & install rain water tanks etc & remind yourselves where you live & be grateful.
Look after the reef & rainforest & want to be congratulated for your Eco friendly systems in
place not another Gold Coast fossil fuel burning pollution party.
By 2030 the Douglas Shire should be a greener shire than what it is now. Half the shire
currently pollutes 24 hours a day with diesel generators roaring like it is central Africa. Council
should be pro-active pursuing a normal electricity supply, instead of doing nothing and only
focussing on paws and claws. Council should stop ignoring the crisis of pollution and energy
poverty in the northern half of their shire. If they keep doing nothing then in 2030 the
generators will still roar.
Stay involved with the outer communities.
Listen to the broader community instead of minority groups.
They are well organised - hope they keep up the good work.
The shire should be united port Douglas and Mossman should be able to be accessed by
public transport, bike lanes, and council should encourage business to update their store
front. More employment opportunities for people with disabilities and youth. Council to
contribute. Ore to community events.
Provide significantly more free parking and cajoling. Pressure council to make visitors more
welcome.
Keep the sugar mill.
More independent of electricity companies.
Bring area north of Daintree River up to the same standard as Port Douglas.
No high rise - no KFC.
High-rise - no KFC.
Don't put tourist’s needs before locals. Stop development of resorts/developers/more
recycling/upgrade road to Cairns.
No high-rise.
Allow individual freedoms.
Stop sitting on your hands.
Provide a safe community for all residents - ensure infrastructure increases with the
population - taking into account the influx of travellers - cars, buses, caravans that congest our
town during the crush season, safety on our streets and in our homes.

Douglas Shire Customer Satisfaction Survey 2017 MARKET FACTS (QLD) PTY LTD 99
Pay some attention to the residents north of the river. Become a leader in sustainable
development. Provide information and support to people that want to live an environmentally
sustainable lifestyle. DSC has an opportunity to become a leading Council - stop following &
start leading!
Go back to grass roots. Focus on events that unite community and are affordable. Rotate the
yearly street party. Take advantage of venues like AME (Daintree Station) and hire them out
for co.mu it events beyond pt D and Mossman. Reclaim and develop the pub land at Wonga
for Community use and events. Integrate all areas of the Shire and let the smaller suburbs
have some identity with strategic development that isn't on the main road.
More diverse.
No change - we'll accept whatever comes.
Quite happy with the shire currently.
More inclusiveness of all members of the community.
Keep promoting Moss & Port Douglas.
Don’t change much.
Steps taken to control the drunken vandals who graffiti, fight and commit crimes.
If Wonka Beach keeps getting more building then they should stop use of concrete slabs -
footpaths - then there is nowhere for water to go. Nowhere to sink in for the water.
Keep on caring about the shire.
Stop visitors from camping everywhere.
That's a long way off. Anything can happen but it certainly won't look like it does now. Don't
make it the dumping ground for refugees.
Everyone should have tank water. No high-rise development.
Keep small.
Between the Clink theatre and the Neighbourhood Centre. This is land that could have
significant use for future.
The issues with the ferry being addressed and residents not being 'punished' for choosing to
live over there.

Douglas Shire Customer Satisfaction Survey 2017 MARKET FACTS (QLD) PTY LTD 100
SUMMARY This 2017 benchmark study for Douglas Shire Council clearly shows the extent to which Council is currently performing and is perceived to be meeting expectations of the community it serves. While this study can be used as a stand-alone report on the situation in Douglas Shire Council, as the community sees it, it can also be compared against an external standard - the 2017 LGAQ State-wide Report of results for Queensland, and Provincial Councils. Obviously, for reviewing performance, up-dating the Corporate Plan, and determining priorities, the most important information is the actual detail in Douglas’ own study. However, taking account of an external measurement criterion is important, as it provides Council with a relative comparison measure of its performance. Overall Performance An assessment of the overall performance of Council, is obtained at the end of the survey, after all the ratings for Importance and Performance for the 42 individual Areas of Council Responsibility have been obtained – a process which gives respondents plenty of time to review and assess just how well its Council has actually performed, on the ‘things that matter’. In this final question, respondents are asked to provide ratings for ‘Overall Council Performance’. The average of these ratings provides a single number which sums up their attitudes on the whole subject. The result for this survey is 3.35, which is lower than that for both Queensland - 3.48 and Provincial Councils – 3.49, as measured in the LGAQ 2017 State-wide Survey. A mean score of 3.35, translates to just over three quarters of respondents viewing Council’s performance as ‘good’ (41.1%) and ‘fair only’ (40.9%). It is also 67% of the ‘Optimum’ score of 5 which means that Council is generally viewed as being effective in delivering services to the community. A second way of measuring “Overall Performance” is to take the individual Performance ratings for each of the 42 Council Responsibility Areas, add them up after allowing for the relative “perceived Importance” of each of the Areas, and then calculate the result as a percentage of the possible optimum. On this basis (called the Average Total Performance Index), Douglas Shire Council is rated as achieving 66.72%.

Douglas Shire Customer Satisfaction Survey 2017 MARKET FACTS (QLD) PTY LTD 101
COMPARISON OF PERFORMANCE INDICES The following charts show comparison of the Total Performance Index (TPI) for Douglas 2017 with LGAQ 2017.
The chart above, shows the Douglas TPI (66.72) for 2017 compared to TPI for the 5 key themes. As can be seen from the chart above, Douglas is well below the overall average TPI in 4 out of the 5 areas namely:
Qualities of Council (67.65%)
Customer Service and Communication (63.91%)
Community Lifestyle Services (68.23%)
Basic Services / Infrastructure (67.06%)
For Douglas’s Managing the Shire TPI (65.50%), comes very close to both the Provincial TPI (65.75%) and LGAQ State-wide (65.65%).
67.06%
68.23%
65.50%
63.91%
67.65%
66.72%
69.93%
72.13%
65.75%
65.92%
69.40%
69.17%
70.57%
72.02%
65.65%
66.38%
69.45%
69.39%
56.00% 60.00% 64.00% 68.00% 72.00% 76.00%
Basic Services / Infrastructure
Community Lifestyle Services
Managing the Shire/City
Customer Services and Communications
Qualities of Council
OVERALL WEIGHTED PERFORMANCE INDEX
Summary of Performance Indexes
LGAQ STATEWIDE [2017] LGAQ Provincial [2017] DOUGLAS 2017

Douglas Shire Customer Satisfaction Survey 2017 MARKET FACTS (QLD) PTY LTD 102
Areas Rated as Being ‘Poor’ on Performance Market Facts believes that Corporate Planning and Continuous Improvement initiatives in Douglas Shire Council should focus on and prioritise those areas of responsibility, which are more important to residents and where Council is seen as being further away from fulfilling expectations (performance ratings). The objective should be to ‘close those gaps’. This can be done by closing the gap between actual Performance and what it would be if it achieved the Optimum Score of ‘5’ (which is not the same as the Importance score) These 10 Responsibility Areas have been selected on the basis that
their Importance rating is at least 3.96 (on the border-line of ‘4’= ‘Important’), and
their Performance is more than 1.5% below Average (where Average Total Performance Index is 66.72%).
These are shown graphically below.
64.4%
64.4%
64.4%
64.1%
63.5%
62.0%
62.0%
61.3%
58.4%
56.9%
48.0% 53.0% 58.0% 63.0% 68.0%
Informing the Community
Human Resources Management
Revenue-raising
Qualitiy of Councillor(s) Dealt with
Road Maintenance
Providing Leadership & Advocacy
Pet/Animal Control
Economic Development/Local Employment
Consulting the community
Responding to the Community
Lowest Performers

Douglas Shire Customer Satisfaction Survey 2017 MARKET FACTS (QLD) PTY LTD 103
Areas Rated as Being ‘High’ on Performance There are 10 Responsibility Areas (out of the total of 42) on which Council performed best in relation to their judged importance. In this case, ‘best’ is defined as having an Importance rating of at least 3.96, and Performance more than 1.5% above Average (66.72%). This list does not include all the Areas where the “gaps are smallest”, as most of these do not have an Importance score above ‘4’ (the border-line between ‘Important’ and ‘Nice to Have’).
75.1%
75.1%
73.2%
73.1%
71.9%
70.5%
69.4%
69.4%
68.8%
68.6%
64.0% 68.0% 72.0% 76.0%
Water Supply
Sewerage
Waste Management
Customer Service
Quality & Performance of Indoor Staff
Drainage & Flood Mitigation
Information services
Community Health
Community Safety
Quality & Performance of Outdoor Workers
Highest Performers

Douglas Shire Customer Satisfaction Survey 2017 MARKET FACTS (QLD) PTY LTD 104
Areas of Average Performance 10 Responsibility Areas (out of the total of 42) on which Council has received an average score which is defined as having:
an Importance rating of at least 3.96 (on the border-line of ‘4’= ‘Important’), and
Performance not more than 1.5% below or above Average (where Average Performance 66.72% - the (calculated) Average Total Performance Index).
67.6%
67.3%
67.3%
67.2%
67.1%
66.6%
66.4%
66.3%
65.9%
65.8%
63.0% 66.0% 69.0%
Development of Tourism
Financial Management
Quality of Elected Council
Building Control
Community Services
Managerial & Supervisory Officers
Environmental Controls
Town Planning
Road Construction
Evironment Protection & Conservation
Average Performers

Douglas Shire Customer Satisfaction Survey 2017 MARKET FACTS (QLD) PTY LTD 105
Areas of Least Importance 12 of the 42 Responsibility Areas have not been considered in formulating the previous three lists (Highest Performers, Lowest Performers and Average Performers) because they did not have an Importance rating greater than 3.96, or 4 when rounded (i.e.= ‘Important’). Nevertheless they do exist, and are listed below - ranked by their Performance score, as used in the previous three tables. Despite their Importance rating being regarded as fairly low, by the Community at large, Councils cannot avoid expending resources upon them, as they are very Important to some members of the community (e.g. Community Development is rated as ‘important’ by 45.8% of respondents). Hence, the detailed data on these particular areas has to be examined, to formulate priorities - as these show the proportions of the community who have varying priorities.
3.91
3.91
3.89
3.85
3.85
3.85
3.84
3.84
3.80
3.76
3.64
3.60
3.4 3.5 3.6 3.7 3.8 3.9 4.0
Libraries & other Information Access
Parking Facilities
Traffic Management
Street Lighting
Shopping Facilities
Footpaths, Kerbing, Guttering
Parks, Playgrounds & Public Amenities
Community Development
Heritage Protection
Sporting & Recreational Facilities
Cultural & Entertainment Facilities
Public Transport
Least Important [Mean<3.96]

Douglas Shire Customer Satisfaction Survey 2017 MARKET FACTS (QLD) PTY LTD 106
The High Priority Areas The Responsibility Areas, that have the largest ‘gaps’ between their scores for Performance and their scores for Importance, also appear near the top of the Importance ranking and at the bottom of the Performance ranking. These are the Areas where residents are expressing high levels of dissatisfaction with Performance levels and are awarding strong ‘should try harder’ scores. Performance Improvement Targets The chart overleaf shows a list of targets for improvement where elements have performance ratings 1.5% or more below the average performance assessment of 66.72%, but which also have relatively high (=/>4) levels of importance. There are others close to the cut-off not shown in this figure, although these are noted in the detailed findings.
These elements can be considered as priorities for enhancement of overall performance. Attention to these elements will lead to the greatest overall increase in the weighted performance indices. This 2017 benchmark customer satisfaction survey provides a solid foundation for Douglas Shire Council to review its targets for improving its performance ratings. The results show that Douglas Shire Council is tracking just below its Provincial counterparts, and also for Queensland, in term of overall performance when compared with LGAQ 2017 survey results. However, this research will enable future ongoing tracking studies to be undertaken by Douglas Shire Council, to monitor the degree of success it is having in reaching their performance improvement targets.
64.4%
64.4%
64.4%
64.1%
63.5%
62.0%
62.0%
61.3%
58.4%
56.9%
66.72%
48.0%50.0%52.0%54.0%56.0%58.0%60.0%62.0%64.0%66.0%68.0%
Informing the Community
Human Resources Management
Revenue-raising
Qualitiy of Councillor(s) Dealt with
Road Maintenance
Providing Leadership & Advocacy
Pet/Animal Control
Economic Development/Local Employment
Consulting the community
Responding to the Community
OVERALL WEIGHTED PERFORMANCE INDEX
Performance Improvement Targets

Douglas Shire Customer Satisfaction Survey 2017 MARKET FACTS (QLD) PTY LTD 107
APPENDIX
Survey Questionnaire Data Tables

DOUGLAS SHIRE COUNCIL
COMMUNITY SATISFACTION & ATTITUDES SURVEY
2017
Interviewers' Instructions
&
Respondent Contact Quotas
North of Wonga 50 Mossman and surrounds (Including Wonga) 125 Port Douglas and South 125
Market Facts Ref J2405 Sample Size: 300 respondents

Stage I FIRST CONTACT
Good morning/ afternoon/ evening, my name is ............ from Market Facts, the Queensland Market Research Company, and I'm ringing on behalf of the Douglas Shire Council. We're conducting a survey about the sorts of services people expect from their local council and how well they feel the council is doing its job... Are you a permanent resident of your local area, aged 18 years or over? (IF NO, ASK FOR SOMEONE ELSE WHO IS) 1(a) Are you normally fairly interested in discussing local government issues and expressing an opinion about
them? Yes 1 [GO TO 2] No 2 [GO TO 1(b)]
Maybe / Don’t Know/ Not Sure 3 [GO TO 1(b)]
Refuses interview (TERMINATE, TALLY BELOW AND RECORD ON CALL SHEET):
(b) Would you be prepared to express an opinion about the sorts of services you expect from your local council? Yes 1 [GO TO 2] No 2 [GO TO 4] 2(a) Are you an employee of your local council?
Yes 1 No 2 [GO TO 4] (b) Do you feel able to judge how well the local council is doing its job?
Yes 1 No 2 [GO TO 4] (c) Have you been living in this area for at least a year?
Yes 1 No 2 [GO TO 5] Well, we'd be grateful if you would take part in our survey... It involves our posting to you some information on the different types of Council services and then ringing you again to get your opinions of your Council's performance. 3 Are you prepared to take part?
Yes 1 [GO TO Page 2 of this Questionnaire]
No 2 [GO TO 5] 4 Have you been living in this area for at least a year?
Yes 1 No 2 5 Well if you were asked to give your local council a rating on how well they are carrying out their responsibilities
and delivering the services they are supposed to, would you give them a 5 for ‘very good’, a 4 for ‘good’, a 3 for ‘fair only’, a 2 for ‘poor’ or a 1 for ‘very poor’? (TALLY STROKE THE RATING IN THE RELEVANT BOX) THANK AND TERMINATE CONTACT
5
4
3
2
1
Cannot Judge
THANK, AND TERMINATE CONTACT
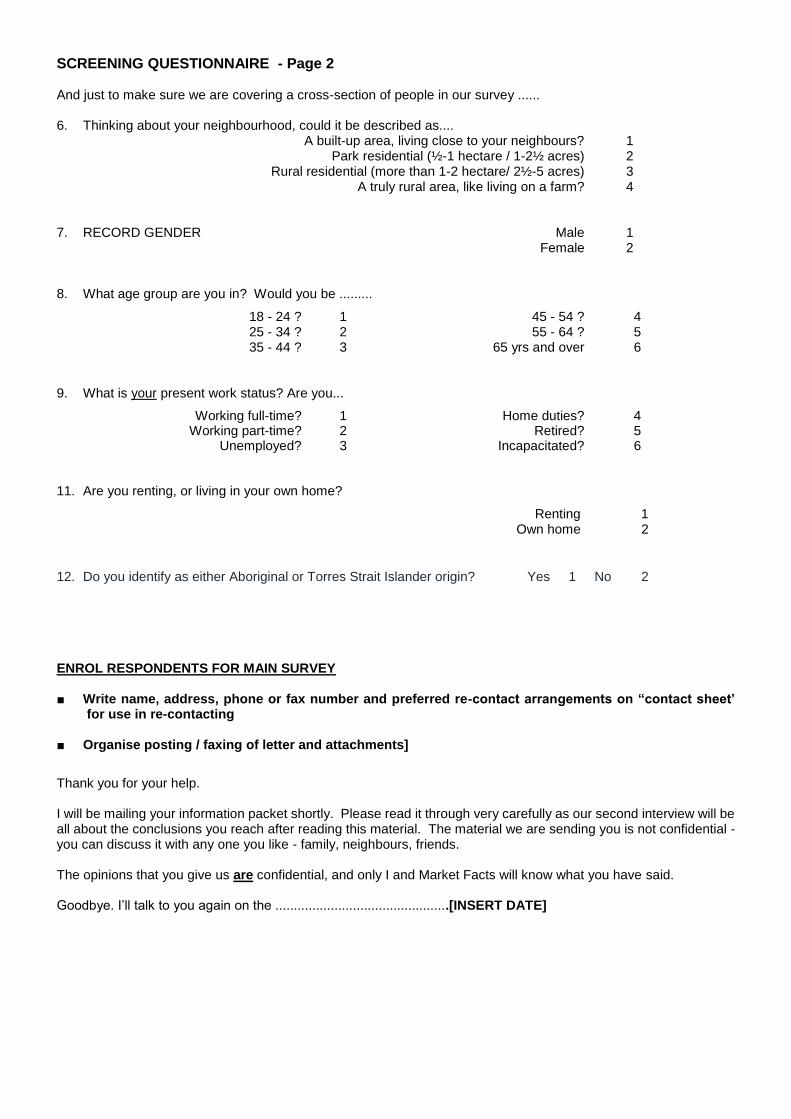
SCREENING QUESTIONNAIRE - Page 2 And just to make sure we are covering a cross-section of people in our survey ...... 6. Thinking about your neighbourhood, could it be described as.... A built-up area, living close to your neighbours? 1 Park residential (½-1 hectare / 1-2½ acres) 2 Rural residential (more than 1-2 hectare/ 2½-5 acres) 3 A truly rural area, like living on a farm? 4 7. RECORD GENDER Male 1 Female 2 8. What age group are you in? Would you be .........
18 - 24 ? 1 45 - 54 ? 4 25 - 34 ? 2 55 - 64 ? 5 35 - 44 ? 3 65 yrs and over 6 9. What is your present work status? Are you...
Working full-time? 1 Home duties? 4 Working part-time? 2 Retired? 5 Unemployed? 3 Incapacitated? 6 11. Are you renting, or living in your own home?
Renting 1 Own home 2
12. Do you identify as either Aboriginal or Torres Strait Islander origin? Yes 1 No 2 ENROL RESPONDENTS FOR MAIN SURVEY ■ Write name, address, phone or fax number and preferred re-contact arrangements on “contact sheet’
for use in re-contacting ■ Organise posting / faxing of letter and attachments]
Thank you for your help. I will be mailing your information packet shortly. Please read it through very carefully as our second interview will be all about the conclusions you reach after reading this material. The material we are sending you is not confidential - you can discuss it with any one you like - family, neighbours, friends. The opinions that you give us are confidential, and only I and Market Facts will know what you have said. Goodbye. I’ll talk to you again on the ...............................................[INSERT DATE]

August 2017
Dear
Thank you for taking part in our survey on behalf of the Douglas Shire Council. It is expected to provide valuable
input to local councils as they review their Corporate Plans, and revise their long term Corporate Goals. The primary
aim of the survey is to provide information to assist in improving their delivery of services to your local community.
The first two attached sheets list the various Areas of Council Responsibility for you to read and consider - even
discuss with family or friends - in preparation for a further phone contact, in which our interviewer will ask you to
rate the Importance and the Council's Performance on all areas where you feel able to form a judgement. Don't worry
if there are some areas you are not familiar with - the interviewer will clarify things further if necessary. There may
be some functions such as water and sewerage which are delivered through a separate council owned business. These
will be treated as an area of Council responsibility in this survey.
In the interview, we will cover:
1 How important you consider each of those services or responsibilities to be - using a five-point scale, with the
ratings being: Crucial (5), Important (4), Nice to Have (3), Not Very Important (2), Quite Unimportant (1)
[For some of the Areas or Services, Council shares responsibility with State and/or Federal Governments (e.g. Roads) or private operators (e.g. Public Transport). You need to decide how important it is for your Council to get involved to some extent to ensure the service is provided, whether it does the job itself, or organises and/or pressures other levels of government or private enterprise to do it.]
2 How well you believe your Council is performing in those aspects - the five-point scale being:
Very Good (5), Good (4), Fair Only (3), Poor (2), Very Poor (1)
If you were to put your own Importance and Performance ratings for each area in the margins before we phone you,
it might save some time.
3 The third page of the attachment provides details of the final questions we will ask you, right at the end of the
interview. It would be helpful if you would have a think about them, so that you can give us your opinions and
feelings about them.
Thank you for your interest and we look forward to receiving your input at the forthcoming telephone interview,
which I understand has been tentatively arranged for...
...................day, the............ of August at .......... am/pm.
Interviewer’s Name & Phone Number ____________________________________________________________
If you have any queries, please feel free to contact me personally.
Yours sincerely
LESLEY GIBBS
General Manager

Please fill out your ranking for Importance and Performance to save time with the Interviewer calls back
AREAS OF COUNCIL RESPONSIBILITY THEME (1) Basic Services and Infrastructure
THEME (2) Community Lifestyle Services
Importance Function/Responsibility Examples/Clarification
Performance
Road Construction Constructing new OR upgrading existing roads
Road Maintenance
Repairing potholes and damaged road shoulders; street sweeping and
verge mowing
Footpaths, Kerbing & Guttering Construction and maintenance of safe footpaths, kerbs and gutters
Street Lighting Funding the provision and upkeep of lights on Council streets/roads
Traffic Management
Traffic planning, traffic lights, roundabouts, traffic `calming' and
directional signage
Parking Facilities
Establishing parking policies, parking control, provision of or
assessment of requirement for on and off-street parking
Public Transport
Either providing or ensuring the provision of an adequate system of
public transport
Water Supply (may be a separate
council business)
Supply of water to meet reasonable standards of Quantity (volume,
pressure, continuity) and Quality (colour, odour, taste, softness)
Sewerage (may be a separate
council business)
Provision of sewerage system with adequate standards of effluent
discharge, odour control and operating efficiency
Drainage & Flood Mitigation
Construction and maintenance of open and underground stormwater
drains, levee banks, division channels etc
Waste Management
Garbage collection and disposal, waste minimisation (recycling and
composting), street bins
Community Health
Immunisation, inspection of restaurants/cafés/shops, mosquito/midge
spraying, cemeteries
Importance
Function/Responsibility Examples/Clarification Performance
Parks, Playgrounds & Public
Amenities
Development and maintenance of open space areas, parks,
children's play-grounds and public toilets
Environmental Controls Enforcement of regulations on air, water and noise pollution
Environmental Protection &
Conservation
Tree planting, bushland acquisition, noxious weeds eradication,
foreshore protection, preservation of natural areas
Heritage Protection Preservation of historic buildings, monuments, facilities, artefacts,
and indigenous & other records
Sporting & Recreational Facilities Public swimming pools, sports-fields, land and/or support for clubs
& their facilities
Cultural & Entertainment
Facilities
Civic centre, public halls, art gallery/museum, sound shell,
community arts programs, community festivals
Libraries & Other Information
Access Public libraries (incl. mobiles), Internet access, CD ROM's
Community Safety
Safety action plans, safety audits, signage, security patrols &
cameras, beach & pool lifeguards, community education &
awareness programs
Community Services
Programs and facilities which meet the needs of a range of
stakeholder groups (such as senior citizens, young people, families,
indigenous, disabled, non-English speaking background)
Pet / Animal Control Registration, impounding of strays, control of feral animals
Shopping Centres Ensuring the provision of adequate shopping facilities to meet the
needs and convenience of local residents
Community Development
Working with (& supporting) community organisations and
special-interest groups to develop strong, sustainable & self-reliant
communities
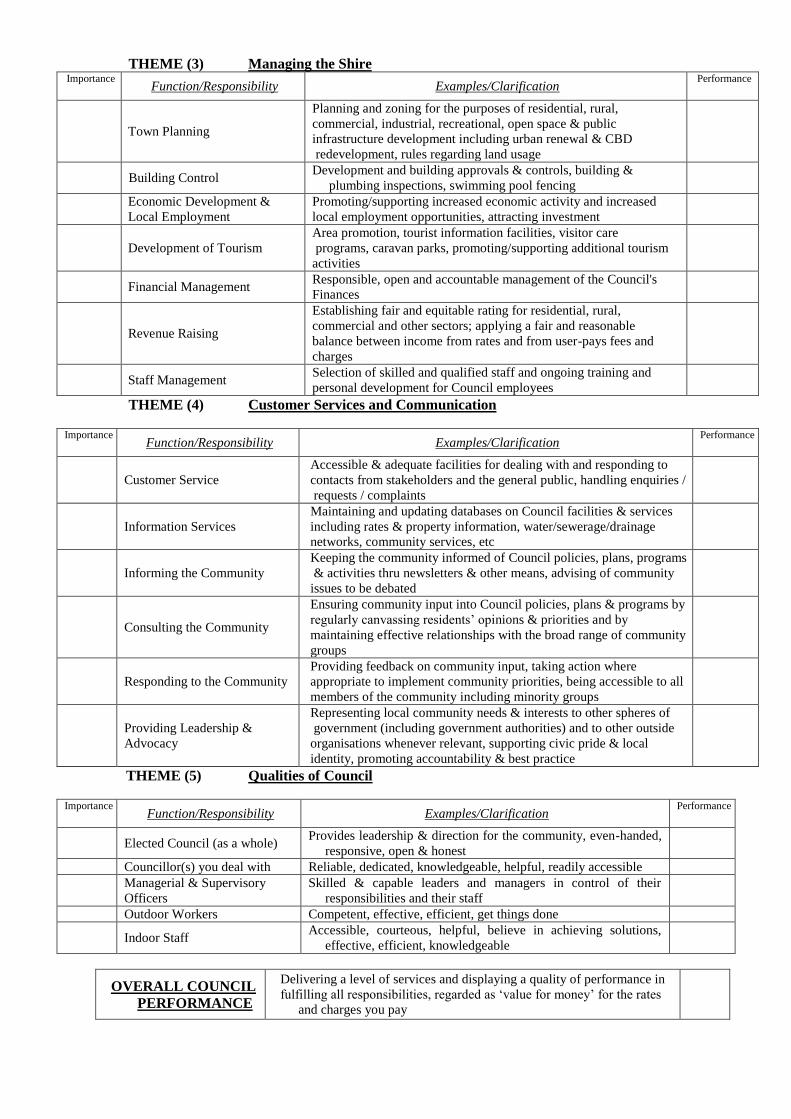
THEME (3) Managing the Shire Importance
Function/Responsibility Examples/Clarification
Performance
Town Planning
Planning and zoning for the purposes of residential, rural,
commercial, industrial, recreational, open space & public
infrastructure development including urban renewal & CBD
redevelopment, rules regarding land usage
Building Control
Development and building approvals & controls, building &
plumbing inspections, swimming pool fencing
Economic Development &
Local Employment
Promoting/supporting increased economic activity and increased
local employment opportunities, attracting investment
Development of Tourism
Area promotion, tourist information facilities, visitor care
programs, caravan parks, promoting/supporting additional tourism
activities
Financial Management
Responsible, open and accountable management of the Council's
Finances
Revenue Raising
Establishing fair and equitable rating for residential, rural,
commercial and other sectors; applying a fair and reasonable
balance between income from rates and from user-pays fees and
charges
Staff Management
Selection of skilled and qualified staff and ongoing training and
personal development for Council employees
THEME (4) Customer Services and Communication
THEME (5) Qualities of Council
Importance
Function/Responsibility Examples/Clarification
Performance
Customer Service
Accessible & adequate facilities for dealing with and responding to
contacts from stakeholders and the general public, handling enquiries /
requests / complaints
Information Services
Maintaining and updating databases on Council facilities & services
including rates & property information, water/sewerage/drainage
networks, community services, etc
Informing the Community
Keeping the community informed of Council policies, plans, programs
& activities thru newsletters & other means, advising of community
issues to be debated
Consulting the Community
Ensuring community input into Council policies, plans & programs by
regularly canvassing residents’ opinions & priorities and by
maintaining effective relationships with the broad range of community
groups
Responding to the Community
Providing feedback on community input, taking action where
appropriate to implement community priorities, being accessible to all
members of the community including minority groups
Providing Leadership &
Advocacy
Representing local community needs & interests to other spheres of
government (including government authorities) and to other outside
organisations whenever relevant, supporting civic pride & local
identity, promoting accountability & best practice
Importance
Function/Responsibility Examples/Clarification
Performance
Elected Council (as a whole)
Provides leadership & direction for the community, even-handed,
responsive, open & honest
Councillor(s) you deal with Reliable, dedicated, knowledgeable, helpful, readily accessible
Managerial & Supervisory
Officers
Skilled & capable leaders and managers in control of their
responsibilities and their staff
Outdoor Workers Competent, effective, efficient, get things done
Indoor Staff
Accessible, courteous, helpful, believe in achieving solutions,
effective, efficient, knowledgeable
OVERALL COUNCIL
PERFORMANCE
Delivering a level of services and displaying a quality of performance in
fulfilling all responsibilities, regarded as ‘value for money’ for the rates
and charges you pay

SUPPLEMENTARY QUESTIONS
3. Council consistently strives to strike the right balance between providing the best possible services and
operating within its financial means. Would you prefer that Council…
Provided improved or increased services, at a higher cost to ratepayers
(that is, funded through an increase in rates).
1
Reduced services and lowered the cost to ratepayers. 2
Neither a) nor b) - leave things as they are. 3
2a. In your opinion, what is the Douglas Shire’s greatest strength?
__________________________________________________________________________
2b. In your opinion, what is the Douglas Shire’s greatest weakness?
__________________________________________________________________________
3. There are many things that people use to judge their lifestyle and the quality of their neighbourhood and
communities. Please tell me three things that are important to you.
__________________________________________________________________________
__________________________________________________________________________
__________________________________________________________________________
4. Council is constantly striving to communicate well with residents. What would be the method/s you would choose
to receive information about council?
Local newspaper 01
Council’s website 02
Social media (Facebook/Twitter etc) 03
Council’s customer service staff 04
Newsletters from Mayor/Councillors 05
Letterbox drops 06
Other *
______________________________
5.a Thinking back to the last Council election, how did you source information on the candidates?
5.b (If family or friends) How do you think they sourced the information?
(a) (b)
Local newspaper 01 01
Council’s website 02 02
Social media (Facebook/Twitter etc) 03 03
Council’s customer service staff 04 04
Newsletters from Mayor/Councillors 05 05
Letterbox drops 06 06
Family /friends 07 -
Other * *
_____________________________
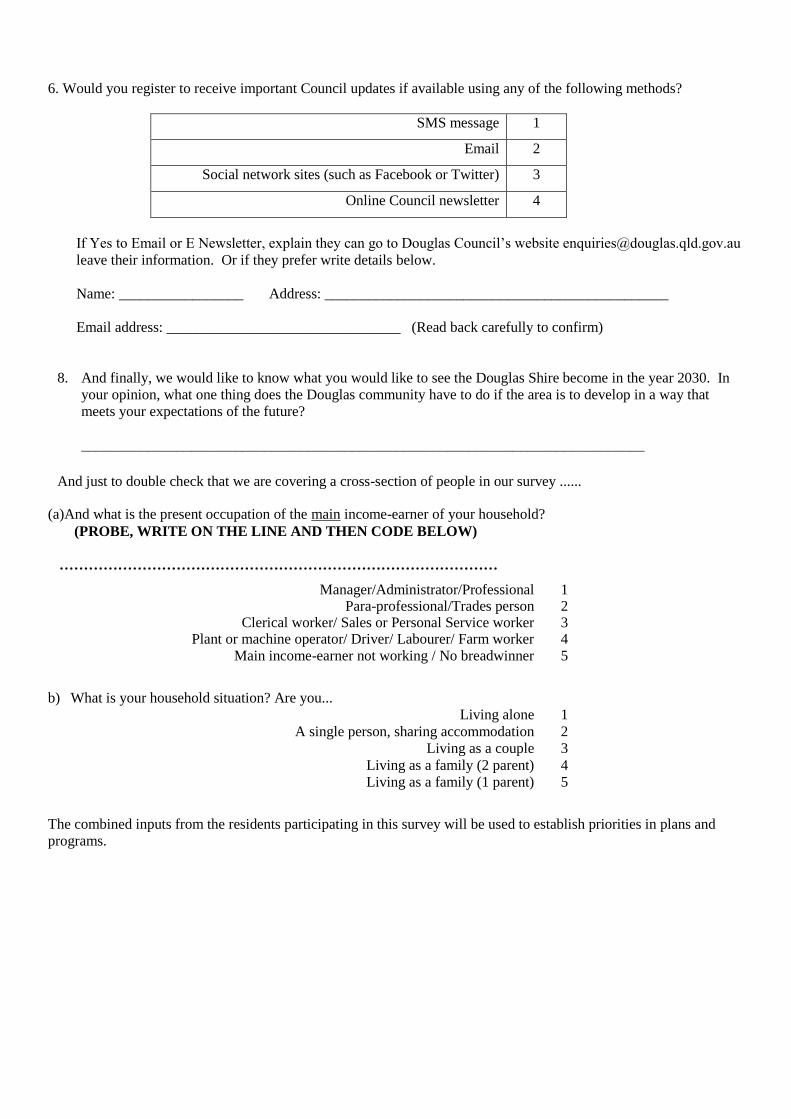
6. Would you register to receive important Council updates if available using any of the following methods?
SMS message 1
Email 2
Social network sites (such as Facebook or Twitter) 3
Online Council newsletter 4
If Yes to Email or E Newsletter, explain they can go to Douglas Council’s website [email protected]
leave their information. Or if they prefer write details below.
Name: _________________ Address: _______________________________________________
Email address: ________________________________ (Read back carefully to confirm)
8. And finally, we would like to know what you would like to see the Douglas Shire become in the year 2030. In
your opinion, what one thing does the Douglas community have to do if the area is to develop in a way that
meets your expectations of the future?
_____________________________________________________________________________
And just to double check that we are covering a cross-section of people in our survey ...... (a)And what is the present occupation of the main income-earner of your household?
(PROBE, WRITE ON THE LINE AND THEN CODE BELOW)
………………………………………………………………………………
Manager/Administrator/Professional 1 Para-professional/Trades person 2 Clerical worker/ Sales or Personal Service worker 3 Plant or machine operator/ Driver/ Labourer/ Farm worker 4
Main income-earner not working / No breadwinner 5
b) What is your household situation? Are you...
Living alone 1
A single person, sharing accommodation 2
Living as a couple 3
Living as a family (2 parent) 4
Living as a family (1 parent) 5
The combined inputs from the residents participating in this survey will be used to establish priorities in plans and
programs.

(NOTE: EACH SUCCESSIVE QUESTIONNAIRE IS TO START THE INTERVIEW SEQUENCE WITH A
DIFFERENT THEME. THEN
■ ROTATE THROUGH ALL THEMES IN SEQUENCE.
■ MARK THEME START POINT ON CONTACT SHEET.
■ USE SAME PRESENTATION, BUT ADAPT THE FUNCTION NAMES AND DESCRIPTIONS
ACCORDINGLY.)
Stage III - INTERVIEW
INTRODUCTION AND PRESENTATION DOCUMENT FOR USE WITH QUESTIONNAIRE Good morning/ afternoon/ evening, my name is ............ , of Market Facts, the Queensland market research company,
ringing on behalf of the LOCAL GOVERNMENT ASSOCIATION OF QUEENSLAND. Could I please speak to
..............? [RE-INTRODUCE] I want to ask you some questions now, based on the material we sent you... Have you
got it handy? [WAIT OR RING BACK AS APPROPRIATE. IF MATERIAL NOT READ, STILL PROCEED. IF NOT
RECEIVED, CONFIRM CORRECT ADDRESS/FAX, MAKE NOTATION IN CALL SHEET AND SAY] Alright, my
Supervisor will no doubt be in touch with you about that. [THANK AND TERMINATE]
Importance Rankings The first task is to decide how important are the various responsibilities we listed in the
material we posted or faxed to you. Would you mind looking at the sheet headed AREAS OF COUNCIL
RESPONSIBILITY? There may be some functions such as water and sewerage which are delivered through a
separate council owned business. These will be treated as an area of Council responsibility in this survey.
Now, in some cases, the Council will have a shared responsibility with State and/or Federal Governments - like for
Roads; or you may think something should be left to Private Enterprise - for example, Public Transport. What you
have to decide, however, is how important it is for your council to get involved to some extent to ensure the service is
provided, whether it does the job itself or arranges that some other level of government or private enterprise does it.
Should the council at least be taking the initiative in that area, if necessary, to see that the service is provided?
To explain the levels of Importance which we've shown in the letter we sent you, ‘crucial’ means that it is a service or
activity that the community must have and that it is vital for the council either to do or to get involved in to make sure
that it is done by someone. ‘Important’ is for something that you certainly expect your council to do or provide, or
else make sure that somebody else provides it. ‘Nice to have’ means just that, as does ‘not very important’. ‘Quite
unimportant’ means unnecessary - something that in any council cut-backs would be the first to go.
Why we say that is because, as you would appreciate, a council, like other forms of government, doesn't have enough
money to do everything that everybody would like it to do. It has to set priorities; so please spread your importance
rankings across the range, having regard to resource limitations.
[START THEME HERE] Now let's take the first group of responsibilities on your list – BASIC SERVICES AND
INFRASTRUCTURE. How important is it for the Council to be involved here? First of all, ‘Road Construction’...
Just looking again at the explanation alongside that on your sheet - ‘Constructing new or upgrading existing roads’ -
just give me its level of importance in your view... Is it ‘crucial’, ‘important’, ‘nice to have’, ‘not very important’ or
‘quite unimportant’?
[WORK THROUGH ALL ITEMS UNDER ‘Basic Services and Infrastructure’, READING OUT THE
‘Examples/Clarification’ TO THE RIGHT OF EACH RESPONSIBILITY, THEN CIRCLING THE LEVEL OF IMPORTANCE FROM 5 TO 1 FOR EACH ON THE QUESTIONNAIRE.]
Now let's move on to COMMUNITY LIFESTYLE SERVICES... first of all, ‘Parks, Playgrounds and Public
Amenities’ - how important is it for your Council to accept responsibility for that area? Would it be ‘crucial’,
‘important’, ‘nice to have’, ‘not very important’ or ‘quite unimportant’?
[WORK THROUGH ALL ITEMS UNDER ‘Community Lifestyle Services’, READING OUT THE
‘Examples/Clarification’ TO THE RIGHT OF EACH RESPONSIBILITY, THEN CIRCLING THE LEVEL OF IMPORTANCE FROM 5 TO 1 FOR EACH ON THE QUESTIONNAIRE.]
Now, moving on to MANAGING THE SHIRE... first of all, ‘Town Planning’ - how important is it for your Council
to accept responsibility for that area? Would it be ‘crucial’, ‘important’, ‘nice to have’, ‘not very important’ or ‘quite
unimportant’?

[WORK THROUGH ALL ITEMS UNDER ‘Managing the Shire’, READING OUT THE ‘Examples/ Clarification’ TO
THE RIGHT OF EACH RESPONSIBILITY, THEN CIRCLING THE LEVEL OF IMPORTANCE FROM 5 TO 1 FOR EACH ON THE QUESTIONNAIRE.] The next aspect of Council Responsibilities relates to its CUSTOMER SERVICES and its COMMUNICATION with
the community... first of all, the responsibility area of ‘Customer Service’ itself - how important is it for your
Council to have accessible & adequate facilities for dealing with and responding to contacts from stakeholders and
the general public, for handling enquiries, requests or complaints? Would it be ‘crucial’, ‘important’, ‘nice to have’,
‘not very important’ or ‘quite unimportant’?
[WORK THROUGH ALL ITEMS UNDER ‘Customer Services and Communication’, READING OUT THE
‘Examples/Clarification’ TO THE RIGHT OF EACH RESPONSIBILITY, THEN CIRCLING THE LEVEL OF IMPORTANCE FROM 5 TO 1 ON THE QUESTIONNAIRE.]
Now when it comes to the QUALITIES OF COUNCIL, you should decide how important it is that the Council has
those qualities or adopts that approach... first of all, the ‘Quality of the Elected Council (as a whole)’ - how important
is it that they provide leadership & direction for the community, be even-handed, responsive, open and honest?
Would it be ‘crucial’, ‘important’, ‘nice to have’, ‘not very important’ or ‘quite unimportant’?
[WORK THROUGH ALL ITEMS UNDER ‘Qualities of Council’, READING OUT THE ‘Examples/Clarification’ TO
THE RIGHT OF EACH RESPONSIBILITY, THEN CIRCLING THE LEVEL OF IMPORTANCE FROM 5 TO 1 FOR EACH ON THE QUESTIONNAIRE.]
Performance Ratings Now we come to the important task of rating your council on its Performance of the
responsibilities, which you've just considered from the point of view of their Importance.
To explain the Rating Points which we've shown in the letter we sent you, please rate the Council on each area of
performance by giving them a ‘very good’ or a ‘good’ or a ‘fair only’ or a ‘poor’ or a ‘very poor’. If you have no idea
of how they are performing in a particular area - either from your own experience or from what you've heard about
them - just say ‘don't know’.
It doesn't matter how important you felt each responsibility was. Now we're thinking about how good a job you think
they're doing in that area.
[NOTE TO INTERVIEWER:
■ START WITH SAME THEME AS YOU USED FOR ‘Importance’ AND THEN ROTATE THROUGH ALL
THEMES IN SEQUENCE. ■ USE SAME PRESENTATION, BUT ADAPT THE FUNCTION NAMES AND DESCRIPTIONS ACCORDINGLY.]
Now let's start with the BASIC SERVICES AND INFRASTRUCTURE, taking first of all, ‘Road Construction’. Just
looking again at the sheet we sent you headed ‘AREAS OF COUNCIL RESPONSIBILITY’, how good a job do you
think the Council is doing in constructing new roads and streets or upgrading existing ones - say, by sealing them?
Just give them a rating from ‘very good’ to ‘very poor’.
[WORK THROUGH ALL ITEMS UNDER ‘Basic Services and Infrastructure’, ONLY READING OUT THE
‘Examples/Clarification’ FOR EACH IF NECESSARY, GETTING RATINGS AND CIRCLING FROM 5 TO 1 FOR
EACH ON THE QUESTIONNAIRE. FOR A ‘Don't Know’ RATING CIRCLE A ‘nought / zero’.
[THEN DO THE SAME FOR EACH OF THE RESPONSIBILITY AREAS IN EACH ONE OF THE OTHER THEMES.]
OVERALL PERFORMANCE Now we need to make an ‘OVERALL PERFORMANCE’ rating... Just looking at the bottom of the second sheet we
sent you and considering the Council as a whole - both the elected councillors and the employed staff - how would
you rate them for delivering a level of services and displaying a quality of performance in fulfilling all
responsibilities, which you would regard as ‘value for money’ - would you give them a ‘Very Good’, ‘Good’, ‘Fair
only’, ‘Poor’ or ‘Very Poor’ for their Overall Performance? [CIRCLE THE QUESTIONNAIRE FROM 5 TO 1.]
DEMOGRAPHICS & SUPPLEMENTARY QUESTIONS [FINALLY, MOVE TO PAGE #17 OF THE QUESTIONNAIRE AND ASK THE REMAINING QUESTIONS DIRECTLY FROM THAT DOCUMENT. CIRCLE / WRITE IN THE RELEVANT ANSWERS.]

DOUGLAS SHIRE COUNCIL SATISFACTION & ATTITUDES SURVEY J2405 August 2017
CONTACT SHEET - RESPONDENT IDENTIFICATION PAGE
NAME: ______________________________________________
NUMBER, STREET:___________________________________________________
SUBURB: _________________________________________________ POST CODE: ____________
EMAIL: ____________________________________________________
PHONE NO: ______________________________
AREA: Northern 1 Middle 2 Southern 3
DATE FIRST CONTACTED: _________________________
RE-CONTACT ARRANGEMENTS: _____________________________________________
DATE INTERVIEWED: ________________________________________
THEME START [circle] 1 2 3 4 5
Field Manager (checked):
(validated):
Data Manager (checked):
(entered):

LGAQ COMMUNITY SATISFACTION & ATTITUDES SURVEY QUESTIONNAIRE
RATING SHEET- IMPORTANCE OF SERVICES
RANKING
Crucial Important Nice
to Have
Un- important
Quite Un- important
Don’t Know
Not App.
1. Basic Services & Infrastructure
Road Construction 5 4 3 2 1 9 7
Road Maintenance 5 4 3 2 1 9 7
Footpaths, Kerbing and Guttering 5 4 3 2 1 9 7
Street Lighting 5 4 3 2 1 9 7
Traffic Management 5 4 3 2 1 9 7
Parking Facilities 5 4 3 2 1 9 7
Public Transport 5 4 3 2 1 9 7
Water Supply 5 4 3 2 1 9 7
Sewerage 5 4 3 2 1 9 7
Drainage and Flood Mitigation 5 4 3 2 1 9 7
Waste Management 5 4 3 2 1 9 7
Community Health 5 4 3 2 1 9 7
2. Community Lifestyle Services
Parks, Playgrounds and Public Amenities 5 4 3 2 1 9 7
Environmental Controls 5 4 3 2 1 9 7
Environmental Protection and Conservation 5 4 3 2 1 9 7
Heritage Protection 5 4 3 2 1 9 7
Sporting and Recreational Facilities 5 4 3 2 1 9 7
Cultural and Entertainment Facilities 5 4 3 2 1 9 7
Libraries and other Information Access 5 4 3 2 1 9 7
Community Safety 5 4 3 2 1 9 7
Community Service 5 4 3 2 1 9 7
Pet/Animal Control 5 4 3 2 1 9 7
Shopping Facilities 5 4 3 2 1 9 7
Community Development 5 4 3 2 1 9 7

RATING SHEET- IMPORTANCE OF SERVICES
RANKING
Crucial Important Nice to Have
Un- important
Quite Un- important
Don’t Know
Not App.
3. Managing the City
Town Planning 5 4 3 2 1 9 7
Building Control 5 4 3 2 1 9 7
Economic Development/Local Employment 5 4 3 2 1 9 7
Development of Tourism 5 4 3 2 1 9 7
Financial Management 5 4 3 2 1 9 7
Revenue Raising 5 4 3 2 1 9 7
Staff Management 5 4 3 2 1 9 7
4. Customer Services and Communication
Customer Service 5 4 3 2 1 9 7
Information Services 5 4 3 2 1 9 7
Informing the Community 5 4 3 2 1 9 7
Consulting the Community 5 4 3 2 1 9 7
Responding to the Community 5 4 3 2 1 9 7
Providing Leadership & Advocacy 5 4 3 2 1 9 7
5. Qualities of Council
Quality of Elected Council (as a whole) 5 4 3 2 1 9 7
Quality of Councillor(s) Dealt with 5 4 3 2 1 9 7
Managerial and Supervisory Efficiency 5 4 3 2 1 9 7
Quality and Performance of Outdoor Workers 5 4 3 2 1 9 7
Quality and Performance of Indoor Staff 5 4 3 2 1 9 7

RATING SHEET - COUNCIL PERFORMANCE
RATING Very Fair Very Don’t Not
1.Basic Services & Infrastructure Good Good Only Poor Poor Know Applic.
Road Construction 5 4 3 2 1 9 7
Road Maintenance 5 4 3 2 1 9 7
Footpaths, Kerbing and Guttering 5 4 3 2 1 9 7
Street Lighting 5 4 3 2 1 9 7
Traffic Management 5 4 3 2 1 9 7
Parking Facilities 5 4 3 2 1 9 7
Public Transport 5 4 3 2 1 9 7
Water Supply 5 4 3 2 1 9 7
Sewerage 5 4 3 2 1 9 7
Drainage and Flood Mitigation 5 4 3 2 1 9 7
Waste Management 5 4 3 2 1 9 7
Community Health 5 4 3 2 1 9 7
2. Community Lifestyle Services Parks, Playgrounds and Public Amenities 5 4 3 2 1 9 7
Environmental Controls 5 4 3 2 1 9 7
Environmental Protection and Conservation 5 4 3 2 1 9 7
Heritage Protection 5 4 3 2 1 9 7
Sporting and Recreational Facilities 5 4 3 2 1 9 7
Cultural and Entertainment Facilities 5 4 3 2 1 9 7
Libraries and other Information Access 5 4 3 2 1 9 7
Community Safety 5 4 3 2 1 9 7
Community Service 5 4 3 2 1 9 7
Pet/Animal Control 5 4 3 2 1 9 7
Shopping Facilities 5 4 3 2 1 9 7
Community Development 5 4 3 2 1 9 7

RATING SHEET - COUNCIL PERFORMANCE
RATING Very Fair Very Don’t Not
Good Good Only Poor Poor Know Applic.
3. Managing the City
Town Planning 5 4 3 2 1 9 7
Building Control 5 4 3 2 1 9 7
Economic Development/Local Employment 5 4 3 2 1 9 7
Development of Tourism 5 4 3 2 1 9 7
Financial Management 5 4 3 2 1 9 7
Revenue Raising 5 4 3 2 1 9 7
Staff Management 5 4 3 2 1 9 7
4. Customer Services and Communication
Customer Service 5 4 3 2 1 9 7
Information Services 5 4 3 2 1 9 7
Informing the Community 5 4 3 2 1 9 7
Consulting the Community 5 4 3 2 1 9 7
Responding to the Community 5 4 3 2 1 9 7
Providing Leadership & Advocacy 5 4 3 2 1 9 7
5. Qualities of Council
Quality of Elected Council (as a whole) 5 4 3 2 1 9 7
Quality of Councillor(s) Dealt with 5 4 3 2 1 9 7
Managerial and Supervisory Efficiency 5 4 3 2 1 9 7
Quality and Performance of Outdoor Workers 5 4 3 2 1 9 7
Quality and Performance of Indoor Staff 5 4 3 2 1 9 7
OVERALL PERFORMANCE RATING 5 4 3 2 1 9 7

SUPPLEMENTARY QUESTIONS
4. Council consistently strives to strike the right balance between providing the best possible services
and operating within its financial means. Would you prefer that Council…
Provided improved or increased services, at a higher cost to ratepayers
(that is, funded through an increase in rates).
1
Reduced services and lowered the cost to ratepayers. 2
Neither a) nor b) - leave things as they are. 3
2a. In your opinion, what is the Douglas Shire’s greatest strength?
__________________________________________________________________________ 2b. In your opinion, what is the Douglas Shire’s greatest weakness?
__________________________________________________________________________ 4. There are many things that people use to judge their lifestyle and the quality of their
neighbourhood and communities. Please tell me three things that are important to you.
__________________________________________________________________________
__________________________________________________________________________
__________________________________________________________________________ 5. Council is constantly striving to communicate well with residents. What would be the method/s you
would choose to receive information about council?
Local newspaper 01 Council’s website 02 Social media (Facebook/Twitter etc) 03 Council’s customer service staff 04 Newsletters from Mayor/Councillors 05 Letterbox drops 06
Other * ______________________________

5.a Thinking back to the last Council election, how did you source information on the
candidates? 5.b (If family or friends mentioned as a source in 5a, ask…) How do you think they
sourced the information?
(a) (b) Local newspaper 01 01 Council’s website 02 02 Social media (Facebook/Twitter etc) 03 03 Council’s customer service staff 04 04 Newsletters from Mayor/Councillors 05 05 Letterbox drops 06 06
Family /friends 07 - Other * * _____________________________
6. Would you register to receive important Council updates if available using any of the following methods?
SMS message 1
Email 2
Social network sites (such as Facebook or Twitter) 3
Online Council newsletter 4
If Yes to Email or E Newsletter, explain they can go to Douglas Council’s website [email protected] leave their information. Or if they prefer write details below. Name: _________________ Address: _______________________________________________ Email address: ________________________________ (Read back carefully to confirm)
9. And finally, we would like to know what you would like to see the Douglas Shire become
in the year 2030. In your opinion, what one thing does the Douglas community have to do if the area is to develop in a way that meets your expectations of the future?
______________________________________________________________________

And just to double check that we are covering a cross-section of people in our survey ...... (a)And what is the present occupation of the main income-earner of your household?
(PROBE, WRITE ON THE LINE AND THEN CODE BELOW) ………………………………………………………………………………
Manager/Administrator/Professional 1 Para-professional/Trades person 2 Clerical worker/ Sales or Personal Service worker 3 Plant or machine operator/ Driver/ Labourer/ Farm worker 4 Main income-earner not working / No breadwinner 5
b) What is your household situation? Are you... Living alone 1 A single person, sharing accommodation 2 Living as a couple 3 Living as a family (2 parent) 4 Living as a family (1 parent) 5
The combined inputs from the residents participating in this survey will be used to establish priorities in plans and programs. My name again is _________ from Market Facts, thank you for your assistance.


Table 1: Neighbourhood...
Total
Gender Age Group Home ownership Location
Male
Fe-
male
18-24
yrs
25-34
yrs
35-44
yrs
45-54
yrs
55-64
yrs
65 yrs
and
over
Rent
ing
Own
home Other Nth. Mid. Sth.
On-
line
Unweighted Base 406
100.0
191
47.0 100.0
215
53.0 100.0
5
1.2 100.0
37
9.1 100.0
93
22.9 100.0
123
30.3 100.0
93
22.9 100.0
55
13.5 100.0
61
15.0 100.0
335
82.5 100.0
10
2.5 100.0
50
12.3 100.0
125
30.8 100.0
125
30.8 100.0
106
26.1 100.0
Built up area,
living close to
neighbours
248
61.1
110
57.6 44.4
138
64.2 55.6
4
80.0 1.6
27
73.0 10.9
58
62.4 23.4
68
55.3 27.4
56
60.2 22.6
35
63.6 14.1
47
77.0 19.0
+++
197
58.8 79.4
--
4
40.0 1.6
9
18.0 3.6
---
86
68.8 34.7
++
100
80.0 40.3
+++
53
50.0 21.4
---
Rural residential
(more than 1-2
hect.)
66 16.3
34 17.8
51.5
32 14.9
48.5
- -
-
3 8.1
4.5
16 17.2
24.2
19 15.4
28.8
20 21.5
30.3
8 14.5
12.1
4 6.6
6.1
--
59 17.6
89.4
3 30.0
4.5
19 38.0
28.8
+++
7 5.6
10.6
---
9 7.2
13.6
---
31 29.2
47.0
+++
Acreage or semi
rural (1/2 1
hectare)
60
14.8
34
17.8
56.7
26
12.1
43.3
1
20.0
1.7
2
5.4
3.3 -
16
17.2
26.7
21
17.1
35.0
12
12.9
20.0
8
14.5
13.3
7
11.5
11.7
52
15.5
86.7
1
10.0
1.7
17
34.0
28.3 +++
22
17.6
36.7
9
7.2
15.0 ---
12
11.3
20.0
Truly rural area,
like living on a
farm
32
7.9
13
6.8 40.6
19
8.8 59.4
-
- -
5
13.5 15.6
3
3.2 9.4
-
15
12.2 46.9
++
5
5.4 15.6
4
7.3 12.5
3
4.9 9.4
27
8.1 84.4
2
20.0 6.3
5
10.0 15.6
10
8.0 31.3
7
5.6 21.9
10
9.4 31.3

Table 2: Gender
Total
Gender Age Group Home ownership Location
Male
Fe-
male
18-24
yrs
25-34
yrs
35-44
yrs
45-54
yrs
55-64
yrs
65 yrs
and
over
Rent
ing
Own
home Other Nth. Mid. Sth.
On-
line
Unweighted Base 406
100.0
191
47.0
100.0
215
53.0
100.0
5
1.2
100.0
37
9.1
100.0
93
22.9
100.0
123
30.3
100.0
93
22.9
100.0
55
13.5
100.0
61
15.0
100.0
335
82.5
100.0
10
2.5
100.0
50
12.3
100.0
125
30.8
100.0
125
30.8
100.0
106
26.1
100.0
Female
215
53.0
-
- -
215
100.0 100.0
+++
2
40.0 0.9
28
75.7 13.0
+++
46
49.5 21.4
51
41.5 23.7
---
51
54.8 23.7
37
67.3 17.2
++
30
49.2 14.0
180
53.7 83.7
5
50.0 2.3
25
50.0 11.6
58
46.4 27.0
-
61
48.8 28.4
71
67.0 33.0
+++
Male
191
47.0
191
100.0
100.0 +++
-
-
-
3
60.0
1.6
9
24.3
4.7 ---
47
50.5
24.6
72
58.5
37.7 +++
42
45.2
22.0
18
32.7
9.4 --
31
50.8
16.2
155
46.3
81.2
5
50.0
2.6
25
50.0
13.1
67
53.6
35.1 +
64
51.2
33.5
35
33.0
18.3 ---
Table 3: Age Group
Total
Gender Age Group Home ownership Location
Male
Fe-
male
18-24
yrs
25-34
yrs
35-44
yrs
45-54
yrs
55-64
yrs
65 yrs
and
over
Rent
ing
Own
home Other Nth. Mid. Sth.
On-
line
Unweighted Base 406
100.0
191
47.0 100.0
215
53.0 100.0
5
1.2 100.0
37
9.1 100.0
93
22.9 100.0
123
30.3 100.0
93
22.9 100.0
55
13.5 100.0
61
15.0 100.0
335
82.5 100.0
10
2.5 100.0
50
12.3 100.0
125
30.8 100.0
125
30.8 100.0
106
26.1 100.0
45-54 yrs
123 30.3
72 37.7
58.5
+++
51 23.7
41.5
---
- -
-
- -
-
- -
-
123 100.0
100.0
+++
- -
-
- -
-
21 34.4
17.1
99 29.6
80.5
3 30.0
2.4
18 36.0
14.6
43 34.4
35.0
33 26.4
26.8
29 27.4
23.6
35-44 yrs
93
22.9
47
24.6 50.5
46
21.4 49.5
-
- -
-
- -
93
100.0 100.0
+++
-
- -
-
- -
-
- -
18
29.5 19.4
70
20.9 75.3
--
5
50.0 5.4
10
20.0 10.8
28
22.4 30.1
29
23.2 31.2
26
24.5 28.0
55-64 yrs
93
22.9
42
22.0
45.2
51
23.7
54.8
-
-
-
-
-
-
-
-
-
-
-
-
93
100.0
100.0 +++
-
-
-
8
13.1
8.6 --
85
25.4
91.4 ++
-
-
-
10
20.0
10.8
24
19.2
25.8
32
25.6
34.4
27
25.5
29.0
65 yrs and over
55 13.5
18 9.4
32.7
--
37 17.2
67.3
++
- -
-
- -
-
- -
-
- -
-
- -
-
55 100.0
100.0
+++
4 6.6
7.3
-
51 15.2
92.7
++
- -
-
8 16.0
14.5
23 18.4
41.8
+
15 12.0
27.3
9 8.5
16.4
-
25-34 yrs
37
9.1
9
4.7 24.3
---
28
13.0 75.7
+++
-
- -
37
100.0 100.0
+++
-
- -
-
- -
-
- -
-
- -
8
13.1 21.6
28
8.4 75.7
1
10.0 2.7
3
6.0 8.1
7
5.6 18.9
14
11.2 37.8
13
12.3 35.1
18-24 yrs
5 1.2
3 1.6
60.0
2 0.9
40.0
5 100.0
100.0
- -
-
- -
-
- -
-
- -
-
- -
-
2 3.3
40.0
2 0.6
40.0
--
1 10.0
20.0
1 2.0
20.0
- -
-
2 1.6
40.0
2 1.9
40.0

Table 4: Present work status
Total
Gender Age Group Home ownership Location
Male
Fe-
male
18-24
yrs
25-34
yrs
35-44
yrs
45-54
yrs
55-64
yrs
65 yrs
and
over
Rent
ing
Own
home Other Nth. Mid. Sth.
On-
line
Unweighted Base 406
100.0
191
47.0
100.0
215
53.0
100.0
5
1.2
100.0
37
9.1
100.0
93
22.9
100.0
123
30.3
100.0
93
22.9
100.0
55
13.5
100.0
61
15.0
100.0
335
82.5
100.0
10
2.5
100.0
50
12.3
100.0
125
30.8
100.0
125
30.8
100.0
106
26.1
100.0
Working full-time
177
43.6
100
52.4 56.5
+++
77
35.8 43.5
---
2
40.0 1.1
16
43.2 9.0
54
58.1 30.5
+++
68
55.3 38.4
+++
34
36.6 19.2
3
5.5 1.7
---
34
55.7 19.2
++
137
40.9 77.4
--
6
60.0 3.4
13
26.0 7.3
---
54
43.2 30.5
49
39.2 27.7
61
57.5 34.5
+++
Working part-time
94
23.2
39
20.4
41.5
55
25.6
58.5
3
60.0
3.2
12
32.4
12.8
26
28.0
27.7
28
22.8
29.8
25
26.9
26.6
-
-
-
16
26.2
17.0
76
22.7
80.9
2
20.0
2.1
14
28.0
14.9
23
18.4
24.5
35
28.0
37.2
22
20.8
23.4
Retired
81 20.0
35 18.3
43.2
46 21.4
56.8
- -
-
- -
-
- -
-
6 4.9
7.4
---
24 25.8
29.6
51 92.7
63.0
+++
4 6.6
4.9
---
77 23.0
95.1
+++
- -
-
12 24.0
14.8
32 25.6
39.5
+
26 20.8
32.1
11 10.4
13.6
---
Home duties
28
6.9
2
1.0
7.1 ---
26
12.1
92.9 +++
-
-
-
5
13.5
17.9 +
6
6.5
21.4
13
10.6
46.4 +
3
3.2
10.7
1
1.8
3.6
3
4.9
10.7
23
6.9
82.1
2
20.0
7.1
9
18.0
32.1 +++
8
6.4
28.6
9
7.2
32.1
2
1.9
7.1 --
Unemployed
12 3.0
9 4.7
75.0
++
3 1.4
25.0
--
- -
-
- -
-
5 5.4
41.7
5 4.1
41.7
2 2.2
16.7
- -
-
1 1.6
8.3
11 3.3
91.7
- -
-
1 2.0
8.3
5 4.0
41.7
3 2.4
25.0
3 2.8
25.0
Incapacitated
7
1.7
5
2.6
71.4
2
0.9
28.6
-
-
-
2
5.4
28.6
+
1
1.1
14.3
2
1.6
28.6
2
2.2
28.6
-
-
-
3
4.9
42.9
++
4
1.2
57.1
-
-
-
-
1
2.0
14.3
2
1.6
28.6
3
2.4
42.9
1
0.9
14.3
Other
6
1.5
1
0.5
16.7
5
2.3
83.3
-
-
-
1
2.7
16.7
1
1.1
16.7
1
0.8
16.7
3
3.2
50.0
-
-
-
-
-
-
6
1.8
100.0
-
-
-
-
-
-
1
0.8
16.7
-
-
-
5
4.7
83.3 +++
Student
1 0.2
- -
-
1 0.5
100.0
- -
-
1 2.7
100.0
+++
- -
-
- -
-
- -
-
- -
-
- -
-
1 0.3
100.0
- -
-
- -
-
- -
-
- -
-
1 0.9
100.0
+

Table 5: Home ownership
Total
Gender Age Group Home ownership Location
Male
Fe-
male
18-24
yrs
25-34
yrs
35-44
yrs
45-54
yrs
55-64
yrs
65 yrs
and
over
Rent
ing
Own
home Other Nth. Mid. Sth.
On-
line
Unweighted Base 406
100.0
191
47.0
100.0
215
53.0
100.0
5
1.2
100.0
37
9.1
100.0
93
22.9
100.0
123
30.3
100.0
93
22.9
100.0
55
13.5
100.0
61
15.0
100.0
335
82.5
100.0
10
2.5
100.0
50
12.3
100.0
125
30.8
100.0
125
30.8
100.0
106
26.1
100.0
Own home
335
82.5
155
81.2 46.3
180
83.7 53.7
2
40.0 0.6
28
75.7 8.4
70
75.3 20.9
--
99
80.5 29.6
85
91.4 25.4
++
51
92.7 15.2
++
-
- -
335
100.0 100.0
+++
-
- -
36
72.0 10.7
--
112
89.6 33.4
++
105
84.0 31.3
82
77.4 24.5
Renting
61
15.0
31
16.2
50.8
30
14.0
49.2
2
40.0
3.3
8
21.6
13.1
18
19.4
29.5
21
17.1
34.4
8
8.6
13.1 --
4
7.3
6.6 -
61
100.0
100.0 +++
-
-
-
-
-
-
12
24.0
19.7 +
12
9.6
19.7 --
20
16.0
32.8
17
16.0
27.9
Other
7 1.7
4 2.1
57.1
3 1.4
42.9
1 20.0
14.3
- -
-
4 4.3
57.1
++
2 1.6
28.6
- -
-
- -
-
- -
-
- -
-
7 70.0
100.0
1 2.0
14.3
1 0.8
14.3
- -
-
5 4.7
71.4
+++
Provided by
Employer
3
0.7
1
0.5
33.3
2
0.9
66.7
-
-
-
1
2.7
33.3
1
1.1
33.3
1
0.8
33.3
-
-
-
-
-
-
-
-
-
-
-
-
3
30.0
100.0
1
2.0
33.3
-
-
-
-
-
-
2
1.9
66.7
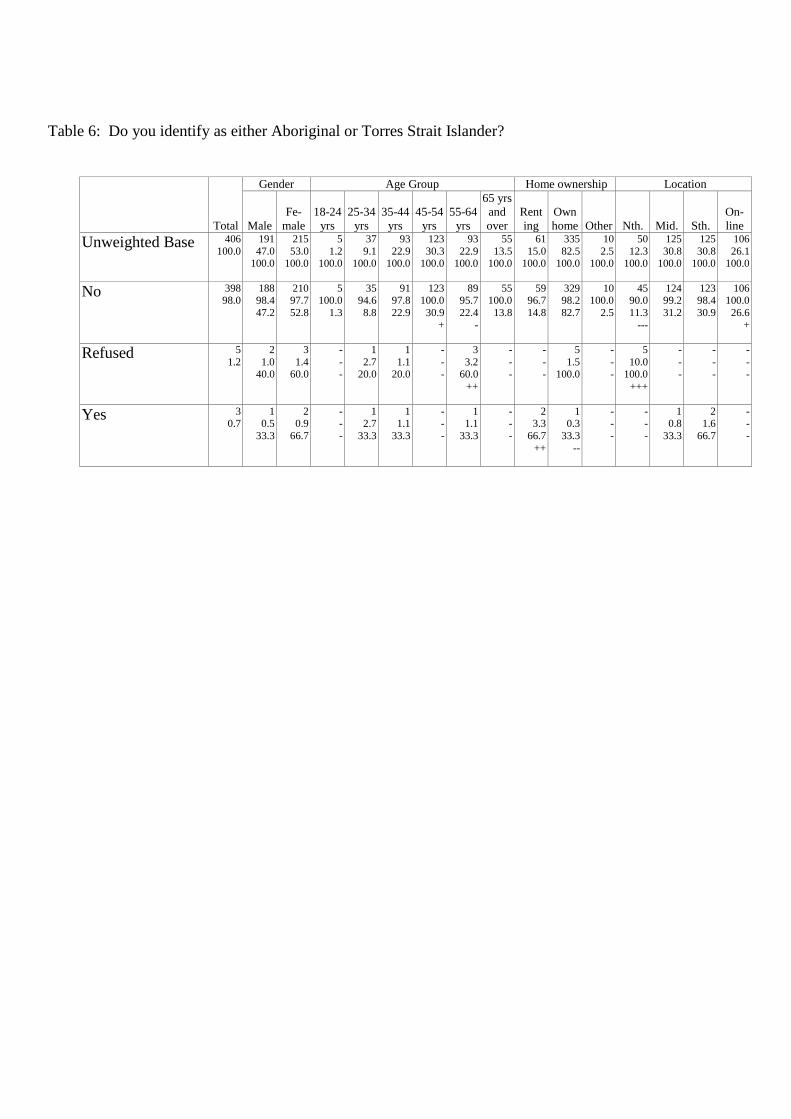
Table 6: Do you identify as either Aboriginal or Torres Strait Islander?
Total
Gender Age Group Home ownership Location
Male
Fe-
male
18-24
yrs
25-34
yrs
35-44
yrs
45-54
yrs
55-64
yrs
65 yrs
and
over
Rent
ing
Own
home Other Nth. Mid. Sth.
On-
line
Unweighted Base 406
100.0
191
47.0 100.0
215
53.0 100.0
5
1.2 100.0
37
9.1 100.0
93
22.9 100.0
123
30.3 100.0
93
22.9 100.0
55
13.5 100.0
61
15.0 100.0
335
82.5 100.0
10
2.5 100.0
50
12.3 100.0
125
30.8 100.0
125
30.8 100.0
106
26.1 100.0
No
398 98.0
188 98.4
47.2
210 97.7
52.8
5 100.0
1.3
35 94.6
8.8
91 97.8
22.9
123 100.0
30.9
+
89 95.7
22.4
-
55 100.0
13.8
59 96.7
14.8
329 98.2
82.7
10 100.0
2.5
45 90.0
11.3
---
124 99.2
31.2
123 98.4
30.9
106 100.0
26.6
+
Refused
5
1.2
2
1.0
40.0
3
1.4
60.0
-
-
-
1
2.7
20.0
1
1.1
20.0
-
-
-
3
3.2
60.0
++
-
-
-
-
-
-
5
1.5
100.0
-
-
-
5
10.0
100.0
+++
-
-
-
-
-
-
-
-
-
Yes
3 0.7
1 0.5
33.3
2 0.9
66.7
- -
-
1 2.7
33.3
1 1.1
33.3
- -
-
1 1.1
33.3
- -
-
2 3.3
66.7
++
1 0.3
33.3
--
- -
-
- -
-
1 0.8
33.3
2 1.6
66.7
- -
-

Table 7.1: How do you rate the IMPORTANCE to you of the following services or responsibilities?
Basic Services / Infrastructure Importance of Service
Road Construction
Total
Gender Age Group Home ownership Location
Male
Fe-
male
18-24
yrs
25-34
yrs
35-44
yrs
45-54
yrs
55-64
yrs
65 yrs
and
over
Rent
ing
Own
home Other Nth. Mid. Sth.
On-
line
Unweighted Base 406
100.0
191
47.0 100.0
215
53.0 100.0
5
1.2 100.0
37
9.1 100.0
93
22.9 100.0
123
30.3 100.0
93
22.9 100.0
55
13.5 100.0
61
15.0 100.0
335
82.5 100.0
10
2.5 100.0
50
12.3 100.0
125
30.8 100.0
125
30.8 100.0
106
26.1 100.0
Crucial
130 32.0
77 40.3
59.2
+++
53 24.7
40.8
---
1 20.0
0.8
11 29.7
8.5
29 31.2
22.3
45 36.6
34.6
27 29.0
20.8
17 30.9
13.1
16 26.2
12.3
113 33.7
86.9
1 10.0
0.8
33 66.0
25.4
+++
42 33.6
32.3
33 26.4
25.4
22 20.8
16.9
---
Important
179
44.1
74
38.7
41.3 --
105
48.8
58.7 ++
2
40.0
1.1
16
43.2
8.9
41
44.1
22.9
51
41.5
28.5
43
46.2
24.0
26
47.3
14.5
30
49.2
16.8
144
43.0
80.4
5
50.0
2.8
15
30.0
8.4 --
61
48.8
34.1
55
44.0
30.7
48
45.3
26.8
Nice to have
71 17.5
28 14.7
39.4
43 20.0
60.6
1 20.0
1.4
6 16.2
8.5
17 18.3
23.9
20 16.3
28.2
17 18.3
23.9
10 18.2
14.1
11 18.0
15.5
57 17.0
80.3
3 30.0
4.2
2 4.0
2.8
---
16 12.8
22.5
-
32 25.6
45.1
+++
21 19.8
29.6
Unimportant
19
4.7
8
4.2 42.1
11
5.1 57.9
1
20.0 5.3
4
10.8 21.1
+
5
5.4 26.3
3
2.4 15.8
5
5.4 26.3
1
1.8 5.3
4
6.6 21.1
14
4.2 73.7
1
10.0 5.3
-
- -
5
4.0 26.3
3
2.4 15.8
11
10.4 57.9
+++
Quite unimportant
3
0.7
2
1.0
66.7
1
0.5
33.3
-
-
-
-
-
-
-
-
-
1
0.8
33.3
1
1.1
33.3
1
1.8
33.3
-
-
-
3
0.9
100.0
-
-
-
-
-
-
1
0.8
33.3
1
0.8
33.3
1
0.9
33.3
Don't know
1 0.2
- -
-
1 0.5
100.0
- -
-
- -
-
1 1.1
100.0
+
- -
-
- -
-
- -
-
- -
-
1 0.3
100.0
- -
-
- -
-
- -
-
- -
-
1 0.9
100.0
+
Not applicable
3
0.7
2
1.0 66.7
1
0.5 33.3
-
- -
-
- -
-
- -
3
2.4 100.0
+++
-
- -
-
- -
-
- -
3
0.9 100.0
-
- -
-
- -
-
- -
1
0.8 33.3
2
1.9 66.7
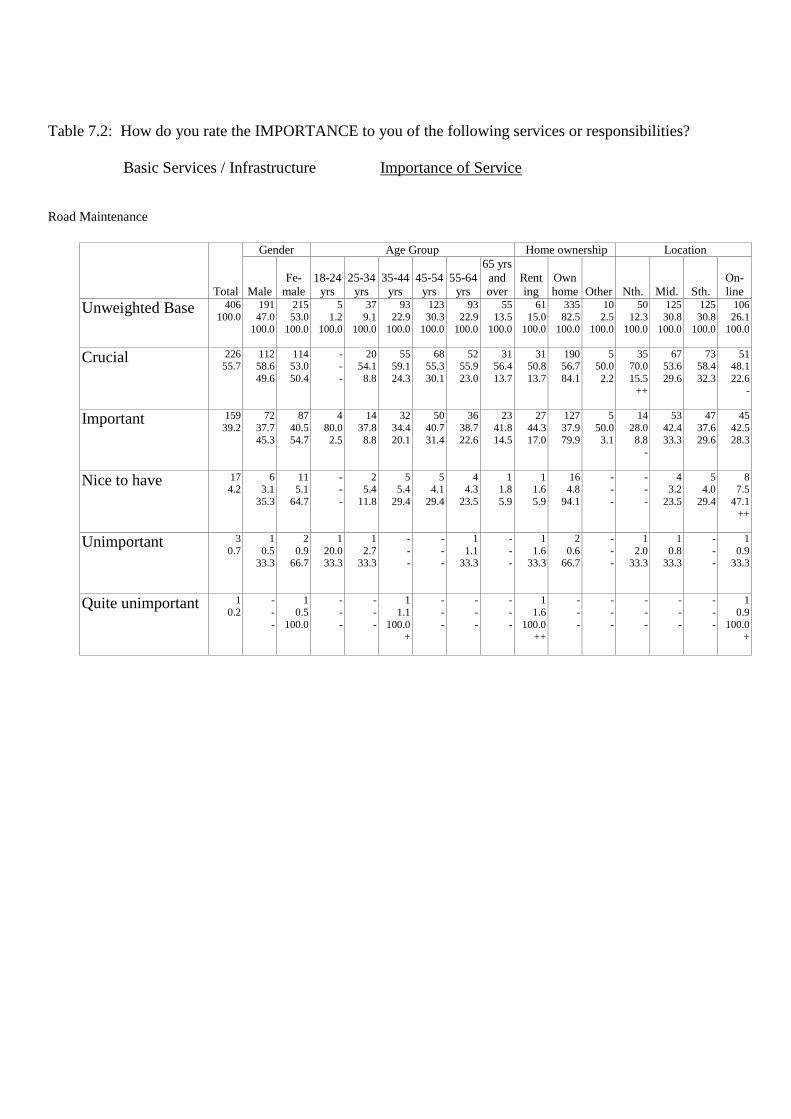
Table 7.2: How do you rate the IMPORTANCE to you of the following services or responsibilities?
Basic Services / Infrastructure Importance of Service
Road Maintenance
Total
Gender Age Group Home ownership Location
Male
Fe-
male
18-24
yrs
25-34
yrs
35-44
yrs
45-54
yrs
55-64
yrs
65 yrs
and
over
Rent
ing
Own
home Other Nth. Mid. Sth.
On-
line
Unweighted Base 406
100.0
191
47.0 100.0
215
53.0 100.0
5
1.2 100.0
37
9.1 100.0
93
22.9 100.0
123
30.3 100.0
93
22.9 100.0
55
13.5 100.0
61
15.0 100.0
335
82.5 100.0
10
2.5 100.0
50
12.3 100.0
125
30.8 100.0
125
30.8 100.0
106
26.1 100.0
Crucial
226 55.7
112 58.6
49.6
114 53.0
50.4
- -
-
20 54.1
8.8
55 59.1
24.3
68 55.3
30.1
52 55.9
23.0
31 56.4
13.7
31 50.8
13.7
190 56.7
84.1
5 50.0
2.2
35 70.0
15.5
++
67 53.6
29.6
73 58.4
32.3
51 48.1
22.6
-
Important
159
39.2
72
37.7
45.3
87
40.5
54.7
4
80.0
2.5
14
37.8
8.8
32
34.4
20.1
50
40.7
31.4
36
38.7
22.6
23
41.8
14.5
27
44.3
17.0
127
37.9
79.9
5
50.0
3.1
14
28.0
8.8 -
53
42.4
33.3
47
37.6
29.6
45
42.5
28.3
Nice to have
17 4.2
6 3.1
35.3
11 5.1
64.7
- -
-
2 5.4
11.8
5 5.4
29.4
5 4.1
29.4
4 4.3
23.5
1 1.8
5.9
1 1.6
5.9
16 4.8
94.1
- -
-
- -
-
4 3.2
23.5
5 4.0
29.4
8 7.5
47.1
++
Unimportant
3
0.7
1
0.5 33.3
2
0.9 66.7
1
20.0 33.3
1
2.7 33.3
-
- -
-
- -
1
1.1 33.3
-
- -
1
1.6 33.3
2
0.6 66.7
-
- -
1
2.0 33.3
1
0.8 33.3
-
- -
1
0.9 33.3
Quite unimportant
1
0.2
-
-
-
1
0.5
100.0
-
-
-
-
-
-
1
1.1
100.0 +
-
-
-
-
-
-
-
-
-
1
1.6
100.0 ++
-
-
-
-
-
-
-
-
-
-
-
-
-
-
-
1
0.9
100.0 +

Table 7.3: How do you rate the IMPORTANCE to you of the following services or responsibilities?
Basic Services / Infrastructure Importance of Service
Footpaths, Kerbing and Guttering
Total
Gender Age Group Home ownership Location
Male
Fe-
male
18-24
yrs
25-34
yrs
35-44
yrs
45-54
yrs
55-64
yrs
65 yrs
and
over
Rent
ing
Own
home Other Nth. Mid. Sth.
On-
line
Unweighted Base 406
100.0
191
47.0 100.0
215
53.0 100.0
5
1.2 100.0
37
9.1 100.0
93
22.9 100.0
123
30.3 100.0
93
22.9 100.0
55
13.5 100.0
61
15.0 100.0
335
82.5 100.0
10
2.5 100.0
50
12.3 100.0
125
30.8 100.0
125
30.8 100.0
106
26.1 100.0
Crucial
101 24.9
49 25.7
48.5
52 24.2
51.5
- -
-
12 32.4
11.9
27 29.0
26.7
30 24.4
29.7
18 19.4
17.8
14 25.5
13.9
15 24.6
14.9
85 25.4
84.2
1 10.0
1.0
8 16.0
7.9
35 28.0
34.7
41 32.8
40.6
++
17 16.0
16.8
--
Important
166
40.9
73
38.2
44.0
93
43.3
56.0
4
80.0
2.4
16
43.2
9.6
40
43.0
24.1
47
38.2
28.3
42
45.2
25.3
17
30.9
10.2
29
47.5
17.5
132
39.4
79.5
5
50.0
3.0
12
24.0
7.2 ---
62
49.6
37.3 ++
52
41.6
31.3
40
37.7
24.1
Nice to have
91 22.4
42 22.0
46.2
49 22.8
53.8
1 20.0
1.1
9 24.3
9.9
16 17.2
17.6
29 23.6
31.9
20 21.5
22.0
16 29.1
17.6
10 16.4
11.0
79 23.6
86.8
2 20.0
2.2
13 26.0
14.3
19 15.2
20.9
--
24 19.2
26.4
35 33.0
38.5
+++
Unimportant
23
5.7
14
7.3 60.9
9
4.2 39.1
-
- -
-
- -
5
5.4 21.7
10
8.1 43.5
7
7.5 30.4
1
1.8 4.3
2
3.3 8.7
19
5.7 82.6
2
20.0 8.7
5
10.0 21.7
6
4.8 26.1
3
2.4 13.0
-
9
8.5 39.1
Quite unimportant
7
1.7
3
1.6
42.9
4
1.9
57.1
-
-
-
-
-
-
2
2.2
28.6
1
0.8
14.3
2
2.2
28.6
2
3.6
28.6
2
3.3
28.6
5
1.5
71.4
-
-
-
2
4.0
28.6
-
-
-
2
1.6
28.6
3
2.8
42.9
Don't know
3 0.7
1 0.5
33.3
2 0.9
66.7
- -
-
- -
-
- -
-
- -
-
3 3.2
100.0
+++
- -
-
- -
-
3 0.9
100.0
- -
-
- -
-
1 0.8
33.3
2 1.6
66.7
- -
-
Not applicable
15
3.7
9
4.7 60.0
6
2.8 40.0
-
- -
-
- -
3
3.2 20.0
6
4.9 40.0
1
1.1 6.7
5
9.1 33.3
++
3
4.9 20.0
12
3.6 80.0
-
- -
10
20.0 66.7
+++
2
1.6 13.3
1
0.8 6.7
--
2
1.9 13.3

Table 7.4: How do you rate the IMPORTANCE to you of the following services or responsibilities?
Basic Services / Infrastructure Importance of Service
Street Lighting
Total
Gender Age Group Home ownership Location
Male
Fe-
male
18-24
yrs
25-34
yrs
35-44
yrs
45-54
yrs
55-64
yrs
65 yrs
and
over
Rent
ing
Own
home Other Nth. Mid. Sth.
On-
line
Unweighted Base 406
100.0
191
47.0 100.0
215
53.0 100.0
5
1.2 100.0
37
9.1 100.0
93
22.9 100.0
123
30.3 100.0
93
22.9 100.0
55
13.5 100.0
61
15.0 100.0
335
82.5 100.0
10
2.5 100.0
50
12.3 100.0
125
30.8 100.0
125
30.8 100.0
106
26.1 100.0
Crucial
107 26.4
49 25.7
45.8
58 27.0
54.2
1 20.0
0.9
8 21.6
7.5
28 30.1
26.2
35 28.5
32.7
20 21.5
18.7
15 27.3
14.0
18 29.5
16.8
88 26.3
82.2
1 10.0
0.9
6 12.0
5.6
--
46 36.8
43.0
+++
36 28.8
33.6
19 17.9
17.8
--
Important
164
40.4
78
40.8
47.6
86
40.0
52.4
4
80.0
2.4
19
51.4
11.6
36
38.7
22.0
47
38.2
28.7
38
40.9
23.2
20
36.4
12.2
23
37.7
14.0
138
41.2
84.1
3
30.0
1.8
15
30.0
9.1
57
45.6
34.8
58
46.4
35.4
34
32.1
20.7 --
Nice to have
64 15.8
28 14.7
43.8
36 16.7
56.3
- -
-
7 18.9
10.9
10 10.8
15.6
15 12.2
23.4
21 22.6
32.8
++
11 20.0
17.2
11 18.0
17.2
50 14.9
78.1
3 30.0
4.7
10 20.0
15.6
14 11.2
21.9
-
22 17.6
34.4
18 17.0
28.1
Unimportant
34
8.4
17
8.9 50.0
17
7.9 50.0
-
- -
1
2.7 2.9
10
10.8 29.4
11
8.9 32.4
8
8.6 23.5
4
7.3 11.8
4
6.6 11.8
28
8.4 82.4
2
20.0 5.9
6
12.0 17.6
5
4.0 14.7
--
3
2.4 8.8
---
20
18.9 58.8
+++
Quite unimportant
10
2.5
6
3.1
60.0
4
1.9
40.0
-
-
-
1
2.7
10.0
3
3.2
30.0
4
3.3
40.0
-
-
-
2
3.6
20.0
1
1.6
10.0
9
2.7
90.0
-
-
-
2
4.0
20.0
1
0.8
10.0
3
2.4
30.0
4
3.8
40.0
Don't know
3 0.7
- -
-
3 1.4
100.0
- -
-
- -
-
1 1.1
33.3
- -
-
2 2.2
66.7
+
- -
-
1 1.6
33.3
2 0.6
66.7
- -
-
- -
-
1 0.8
33.3
1 0.8
33.3
1 0.9
33.3
Not applicable
24
5.9
13
6.8 54.2
11
5.1 45.8
-
- -
1
2.7 4.2
5
5.4 20.8
11
8.9 45.8
+
4
4.3 16.7
3
5.5 12.5
3
4.9 12.5
20
6.0 83.3
1
10.0 4.2
11
22.0 45.8
+++
1
0.8 4.2
---
2
1.6 8.3
--
10
9.4 41.7
+

Table 7.5: How do you rate the IMPORTANCE to you of the following services or responsibilities?
Basic Services / Infrastructure Importance of Service
Traffic Management
Total
Gender Age Group Home ownership Location
Male
Fe-
male
18-24
yrs
25-34
yrs
35-44
yrs
45-54
yrs
55-64
yrs
65 yrs
and
over
Rent
ing
Own
home Other Nth. Mid. Sth.
On-
line
Unweighted Base 406
100.0
191
47.0 100.0
215
53.0 100.0
5
1.2 100.0
37
9.1 100.0
93
22.9 100.0
123
30.3 100.0
93
22.9 100.0
55
13.5 100.0
61
15.0 100.0
335
82.5 100.0
10
2.5 100.0
50
12.3 100.0
125
30.8 100.0
125
30.8 100.0
106
26.1 100.0
Crucial
116 28.6
62 32.5
53.4
54 25.1
46.6
1 20.0
0.9
8 21.6
6.9
27 29.0
23.3
39 31.7
33.6
27 29.0
23.3
14 25.5
12.1
16 26.2
13.8
99 29.6
85.3
1 10.0
0.9
7 14.0
6.0
--
43 34.4
37.1
+
48 38.4
41.4
+++
18 17.0
15.5
---
Important
159
39.2
65
34.0
40.9 --
94
43.7
59.1 ++
2
40.0
1.3
17
45.9
10.7
37
39.8
23.3
46
37.4
28.9
31
33.3
19.5
26
47.3
16.4
21
34.4
13.2
133
39.7
83.6
5
50.0
3.1
15
30.0
9.4
64
51.2
40.3 +++
40
32.0
25.2 --
40
37.7
25.2
Nice to have
79 19.5
40 20.9
50.6
39 18.1
49.4
1 20.0
1.3
10 27.0
12.7
18 19.4
22.8
21 17.1
26.6
21 22.6
26.6
8 14.5
10.1
16 26.2
20.3
60 17.9
75.9
-
3 30.0
3.8
14 28.0
17.7
10 8.0
12.7
---
30 24.0
38.0
25 23.6
31.6
Unimportant
30
7.4
14
7.3 46.7
16
7.4 53.3
1
20.0 3.3
1
2.7 3.3
6
6.5 20.0
7
5.7 23.3
10
10.8 33.3
5
9.1 16.7
5
8.2 16.7
24
7.2 80.0
1
10.0 3.3
6
12.0 20.0
5
4.0 16.7
-
5
4.0 16.7
-
14
13.2 46.7
+++
Quite unimportant
6
1.5
4
2.1
66.7
2
0.9
33.3
-
-
-
-
-
-
3
3.2
50.0
1
0.8
16.7
2
2.2
33.3
-
-
-
1
1.6
16.7
5
1.5
83.3
-
-
-
1
2.0
16.7
1
0.8
16.7
1
0.8
16.7
3
2.8
50.0
Don't know
2 0.5
- -
-
2 0.9
100.0
- -
-
- -
-
- -
-
- -
-
2 2.2
100.0
+++
- -
-
- -
-
2 0.6
100.0
- -
-
- -
-
1 0.8
50.0
1 0.8
50.0
- -
-
Not applicable
14
3.4
6
3.1 42.9
8
3.7 57.1
-
- -
1
2.7 7.1
2
2.2 14.3
9
7.3 64.3
+++
-
- -
2
3.6 14.3
2
3.3 14.3
12
3.6 85.7
-
- -
7
14.0 50.0
+++
1
0.8 7.1
-
-
- -
6
5.7 42.9

Table 7.6: How do you rate the IMPORTANCE to you of the following services or responsibilities?
Basic Services / Infrastructure Importance of Service
Parking Facilities
Total
Gender Age Group Home ownership Location
Male
Fe-
male
18-24
yrs
25-34
yrs
35-44
yrs
45-54
yrs
55-64
yrs
65 yrs
and
over
Rent
ing
Own
home Other Nth. Mid. Sth.
On-
line
Unweighted Base 406
100.0
191
47.0 100.0
215
53.0 100.0
5
1.2 100.0
37
9.1 100.0
93
22.9 100.0
123
30.3 100.0
93
22.9 100.0
55
13.5 100.0
61
15.0 100.0
335
82.5 100.0
10
2.5 100.0
50
12.3 100.0
125
30.8 100.0
125
30.8 100.0
106
26.1 100.0
Crucial
118 29.1
59 30.9
50.0
59 27.4
50.0
- -
-
14 37.8
11.9
26 28.0
22.0
41 33.3
34.7
21 22.6
17.8
16 29.1
13.6
22 36.1
18.6
96 28.7
81.4
- -
-
6 12.0
5.1
---
41 32.8
34.7
53 42.4
44.9
+++
18 17.0
15.3
---
Important
162
39.9
71
37.2
43.8
91
42.3
56.2
1
20.0
0.6
15
40.5
9.3
39
41.9
24.1
45
36.6
27.8
37
39.8
22.8
25
45.5
15.4
18
29.5
11.1 -
140
41.8
86.4 +
4
40.0
2.5
17
34.0
10.5
63
50.4
38.9 +++
46
36.8
28.4
36
34.0
22.2
Nice to have
72 17.7
32 16.8
44.4
40 18.6
55.6
2 40.0
2.8
5 13.5
6.9
20 21.5
27.8
17 13.8
23.6
23 24.7
31.9
++
5 9.1
6.9
-
16 26.2
22.2
+
53 15.8
73.6
--
3 30.0
4.2
13 26.0
18.1
14 11.2
19.4
--
17 13.6
23.6
28 26.4
38.9
+++
Unimportant
29
7.1
14
7.3 48.3
15
7.0 51.7
1
20.0 3.4
2
5.4 6.9
6
6.5 20.7
9
7.3 31.0
7
7.5 24.1
4
7.3 13.8
4
6.6 13.8
24
7.2 82.8
1
10.0 3.4
6
12.0 20.7
4
3.2 13.8
--
7
5.6 24.1
12
11.3 41.4
+
Quite unimportant
8
2.0
4
2.1
50.0
4
1.9
50.0
-
-
-
1
2.7
12.5
1
1.1
12.5
1
0.8
12.5
3
3.2
37.5
2
3.6
25.0
-
-
-
8
2.4
100.0
-
-
-
3
6.0
37.5 ++
-
-
-
1
0.8
12.5
4
3.8
50.0
Don't know
1 0.2
1 0.5
100.0
- -
-
- -
-
- -
-
1 1.1
100.0
+
- -
-
- -
-
- -
-
- -
-
- -
-
1 10.0
100.0
- -
-
- -
-
- -
-
1 0.9
100.0
+
Not applicable
16
3.9
10
5.2 62.5
6
2.8 37.5
1
20.0 6.3
-
- -
-
- -
10
8.1 62.5
+++
2
2.2 12.5
3
5.5 18.8
1
1.6 6.3
14
4.2 87.5
1
10.0 6.3
5
10.0 31.3
++
3
2.4 18.8
1
0.8 6.3
--
7
6.6 43.8

Table 7.7: How do you rate the IMPORTANCE to you of the following services or responsibilities?
Basic Services / Infrastructure Importance of Service
Public Transport
Total
Gender Age Group Home ownership Location
Male
Fe-
male
18-24
yrs
25-34
yrs
35-44
yrs
45-54
yrs
55-64
yrs
65 yrs
and
over
Rent
ing
Own
home Other Nth. Mid. Sth.
On-
line
Unweighted Base 406
100.0
191
47.0 100.0
215
53.0 100.0
5
1.2 100.0
37
9.1 100.0
93
22.9 100.0
123
30.3 100.0
93
22.9 100.0
55
13.5 100.0
61
15.0 100.0
335
82.5 100.0
10
2.5 100.0
50
12.3 100.0
125
30.8 100.0
125
30.8 100.0
106
26.1 100.0
Crucial
111 27.3
55 28.8
49.5
56 26.0
50.5
3 60.0
2.7
12 32.4
10.8
30 32.3
27.0
32 26.0
28.8
22 23.7
19.8
12 21.8
10.8
21 34.4
18.9
88 26.3
79.3
2 20.0
1.8
20 40.0
18.0
++
30 24.0
27.0
37 29.6
33.3
24 22.6
21.6
Important
102
25.1
41
21.5
40.2
61
28.4
59.8
2
40.0
2.0
9
24.3
8.8
18
19.4
17.6
28
22.8
27.5
25
26.9
24.5
20
36.4
19.6 ++
19
31.1
18.6
80
23.9
78.4
3
30.0
2.9
14
28.0
13.7
26
20.8
25.5
39
31.2
38.2 +
23
21.7
22.5
Nice to have
86 21.2
36 18.8
41.9
50 23.3
58.1
- -
-
8 21.6
9.3
21 22.6
24.4
25 20.3
29.1
24 25.8
27.9
8 14.5
9.3
13 21.3
15.1
71 21.2
82.6
2 20.0
2.3
7 14.0
8.1
20 16.0
23.3
-
20 16.0
23.3
-
39 36.8
45.3
+++
Unimportant
34
8.4
20
10.5 58.8
14
6.5 41.2
-
- -
3
8.1 8.8
8
8.6 23.5
11
8.9 32.4
9
9.7 26.5
3
5.5 8.8
1
1.6 2.9
--
32
9.6 94.1
+
1
10.0 2.9
-
- -
16
12.8 47.1
++
7
5.6 20.6
11
10.4 32.4
Quite unimportant
35
8.6
18
9.4
51.4
17
7.9
48.6
-
-
-
2
5.4
5.7
11
11.8
31.4
10
8.1
28.6
7
7.5
20.0
5
9.1
14.3
6
9.8
17.1
28
8.4
80.0
1
10.0
2.9
2
4.0
5.7
12
9.6
34.3
18
14.4
51.4 +++
3
2.8
8.6 --
Don't know
3 0.7
2 1.0
66.7
1 0.5
33.3
- -
-
- -
-
1 1.1
33.3
1 0.8
33.3
1 1.1
33.3
- -
-
- -
-
2 0.6
66.7
1 10.0
33.3
- -
-
1 0.8
33.3
1 0.8
33.3
1 0.9
33.3
Not applicable
35
8.6
19
9.9 54.3
16
7.4 45.7
-
- -
3
8.1 8.6
4
4.3 11.4
-
16
13.0 45.7
++
5
5.4 14.3
7
12.7 20.0
1
1.6 2.9
--
34
10.1 97.1
++
-
- -
7
14.0 20.0
20
16.0 57.1
+++
3
2.4 8.6
---
5
4.7 14.3
-

Table 7.8: How do you rate the IMPORTANCE to you of the following services or responsibilities?
Basic Services / Infrastructure Importance of Service
Water Supply
Total
Gender Age Group Home ownership Location
Male
Fe-
male
18-24
yrs
25-34
yrs
35-44
yrs
45-54
yrs
55-64
yrs
65 yrs
and
over
Rent
ing
Own
home Other Nth. Mid. Sth.
On-
line
Unweighted Base 406
100.0
191
47.0 100.0
215
53.0 100.0
5
1.2 100.0
37
9.1 100.0
93
22.9 100.0
123
30.3 100.0
93
22.9 100.0
55
13.5 100.0
61
15.0 100.0
335
82.5 100.0
10
2.5 100.0
50
12.3 100.0
125
30.8 100.0
125
30.8 100.0
106
26.1 100.0
Crucial
238 58.6
112 58.6
47.1
126 58.6
52.9
3 60.0
1.3
22 59.5
9.2
56 60.2
23.5
73 59.3
30.7
50 53.8
21.0
34 61.8
14.3
37 60.7
15.5
195 58.2
81.9
6 60.0
2.5
23 46.0
9.7
-
82 65.6
34.5
+
79 63.2
33.2
54 50.9
22.7
-
Important
96
23.6
41
21.5
42.7
55
25.6
57.3
2
40.0
2.1
11
29.7
11.5
20
21.5
20.8
23
18.7
24.0
26
28.0
27.1
14
25.5
14.6
14
23.0
14.6
80
23.9
83.3
2
20.0
2.1
11
22.0
11.5
36
28.8
37.5
29
23.2
30.2
20
18.9
20.8
Nice to have
19 4.7
8 4.2
42.1
11 5.1
57.9
- -
-
3 8.1
15.8
4 4.3
21.1
9 7.3
47.4
+
1 1.1
5.3
-
2 3.6
10.5
2 3.3
10.5
17 5.1
89.5
- -
-
3 6.0
15.8
2 1.6
10.5
-
4 3.2
21.1
10 9.4
52.6
+++
Unimportant
12
3.0
5
2.6 41.7
7
3.3 58.3
-
- -
1
2.7 8.3
2
2.2 16.7
3
2.4 25.0
6
6.5 50.0
++
-
- -
1
1.6 8.3
11
3.3 91.7
-
- -
1
2.0 8.3
-
- -
3
2.4 25.0
8
7.5 66.7
+++
Quite unimportant
8
2.0
6
3.1
75.0
2
0.9
25.0
-
-
-
-
-
-
2
2.2
25.0
3
2.4
37.5
3
3.2
37.5
-
-
-
1
1.6
12.5
7
2.1
87.5
-
-
-
-
-
-
-
-
-
5
4.0
62.5 ++
3
2.8
37.5
Not applicable
33 8.1
19 9.9
57.6
14 6.5
42.4
- -
-
- -
-
9 9.7
27.3
12 9.8
36.4
7 7.5
21.2
5 9.1
15.2
6 9.8
18.2
25 7.5
75.8
2 20.0
6.1
12 24.0
36.4
+++
5 4.0
15.2
--
5 4.0
15.2
--
11 10.4
33.3

Table 7.9: How do you rate the IMPORTANCE to you of the following services or responsibilities?
Basic Services / Infrastructure Importance of Service
Sewerage
Total
Gender Age Group Home ownership Location
Male
Fe-
male
18-24
yrs
25-34
yrs
35-44
yrs
45-54
yrs
55-64
yrs
65 yrs
and
over
Rent
ing
Own
home Other Nth. Mid. Sth.
On-
line
Unweighted Base 406
100.0
191
47.0 100.0
215
53.0 100.0
5
1.2 100.0
37
9.1 100.0
93
22.9 100.0
123
30.3 100.0
93
22.9 100.0
55
13.5 100.0
61
15.0 100.0
335
82.5 100.0
10
2.5 100.0
50
12.3 100.0
125
30.8 100.0
125
30.8 100.0
106
26.1 100.0
Crucial
216 53.2
99 51.8
45.8
117 54.4
54.2
2 40.0
0.9
23 62.2
10.6
55 59.1
25.5
64 52.0
29.6
44 47.3
20.4
28 50.9
13.0
39 63.9
18.1
+
173 51.6
80.1
4 40.0
1.9
20 40.0
9.3
--
72 57.6
33.3
77 61.6
35.6
++
47 44.3
21.8
--
Important
91
22.4
37
19.4
40.7
54
25.1
59.3
3
60.0
3.3
11
29.7
12.1
18
19.4
19.8
22
17.9
24.2
21
22.6
23.1
16
29.1
17.6
12
19.7
13.2
75
22.4
82.4
4
40.0
4.4
14
28.0
15.4
25
20.0
27.5
29
23.2
31.9
23
21.7
25.3
Nice to have
20 4.9
11 5.8
55.0
9 4.2
45.0
- -
-
1 2.7
5.0
6 6.5
30.0
7 5.7
35.0
4 4.3
20.0
2 3.6
10.0
2 3.3
10.0
18 5.4
90.0
- -
-
2 4.0
10.0
2 1.6
10.0
--
4 3.2
20.0
12 11.3
60.0
+++
Unimportant
18
4.4
8
4.2 44.4
10
4.7 55.6
-
- -
1
2.7 5.6
2
2.2 11.1
5
4.1 27.8
9
9.7 50.0
+++
1
1.8 5.6
2
3.3 11.1
16
4.8 88.9
-
- -
-
- -
4
3.2 22.2
4
3.2 22.2
10
9.4 55.6
+++
Quite unimportant
11
2.7
9
4.7
81.8 ++
2
0.9
18.2 --
-
-
-
-
-
-
3
3.2
27.3
4
3.3
36.4
4
4.3
36.4
-
-
-
1
1.6
9.1
10
3.0
90.9
-
-
-
-
-
-
3
2.4
27.3
5
4.0
45.5
3
2.8
27.3
Don't know
2 0.5
1 0.5
50.0
1 0.5
50.0
- -
-
- -
-
- -
-
- -
-
2 2.2
100.0
+++
- -
-
- -
-
2 0.6
100.0
- -
-
- -
-
1 0.8
50.0
1 0.8
50.0
- -
-
Not applicable
48
11.8
26
13.6 54.2
22
10.2 45.8
-
- -
1
2.7 2.1
-
9
9.7 18.8
21
17.1 43.8
++
9
9.7 18.8
8
14.5 16.7
5
8.2 10.4
41
12.2 85.4
2
20.0 4.2
14
28.0 29.2
+++
18
14.4 37.5
5
4.0 10.4
---
11
10.4 22.9

Table 7.10: How do you rate the IMPORTANCE to you of the following services or responsibilities?
Basic Services / Infrastructure Importance of Service
Drainage and Flood Mitigation
Total
Gender Age Group Home ownership Location
Male
Fe-
male
18-24
yrs
25-34
yrs
35-44
yrs
45-54
yrs
55-64
yrs
65 yrs
and
over
Rent
ing
Own
home Other Nth. Mid. Sth.
On-
line
Unweighted Base 406
100.0
191
47.0 100.0
215
53.0 100.0
5
1.2 100.0
37
9.1 100.0
93
22.9 100.0
123
30.3 100.0
93
22.9 100.0
55
13.5 100.0
61
15.0 100.0
335
82.5 100.0
10
2.5 100.0
50
12.3 100.0
125
30.8 100.0
125
30.8 100.0
106
26.1 100.0
Crucial
210 51.7
98 51.3
46.7
112 52.1
53.3
1 20.0
0.5
21 56.8
10.0
51 54.8
24.3
72 58.5
34.3
+
42 45.2
20.0
23 41.8
11.0
32 52.5
15.2
174 51.9
82.9
4 40.0
1.9
26 52.0
12.4
75 60.0
35.7
++
73 58.4
34.8
+
36 34.0
17.1
---
Important
124
30.5
60
31.4
48.4
64
29.8
51.6
3
60.0
2.4
12
32.4
9.7
24
25.8
19.4
29
23.6
23.4 --
34
36.6
27.4
22
40.0
17.7
15
24.6
12.1
106
31.6
85.5
3
30.0
2.4
14
28.0
11.3
37
29.6
29.8
39
31.2
31.5
34
32.1
27.4
Nice to have
35 8.6
16 8.4
45.7
19 8.8
54.3
- -
-
3 8.1
8.6
6 6.5
17.1
12 9.8
34.3
11 11.8
31.4
3 5.5
8.6
9 14.8
25.7
+
24 7.2
68.6
--
2 20.0
5.7
5 10.0
14.3
6 4.8
17.1
-
6 4.8
17.1
-
18 17.0
51.4
+++
Unimportant
20
4.9
9
4.7 45.0
11
5.1 55.0
1
20.0 5.0
-
- -
7
7.5 35.0
5
4.1 25.0
4
4.3 20.0
3
5.5 15.0
2
3.3 10.0
18
5.4 90.0
-
- -
-
- -
6
4.8 30.0
4
3.2 20.0
10
9.4 50.0
++
Quite unimportant
6
1.5
5
2.6
83.3 +
1
0.5
16.7 -
-
-
-
1
2.7
16.7
1
1.1
16.7
3
2.4
50.0
-
-
-
1
1.8
16.7
1
1.6
16.7
5
1.5
83.3
-
-
-
-
-
-
1
0.8
16.7
3
2.4
50.0
2
1.9
33.3
Not applicable
11 2.7
3 1.6
27.3
8 3.7
72.7
- -
-
- -
-
4 4.3
36.4
2 1.6
18.2
2 2.2
18.2
3 5.5
27.3
2 3.3
18.2
8 2.4
72.7
1 10.0
9.1
5 10.0
45.5
+++
- -
-
- -
-
6 5.7
54.5
++

Table 7.11: How do you rate the IMPORTANCE to you of the following services or responsibilities?
Basic Services / Infrastructure Importance of Service
Waste Management
Total
Gender Age Group Home ownership Location
Male
Fe-
male
18-24
yrs
25-34
yrs
35-44
yrs
45-54
yrs
55-64
yrs
65 yrs
and
over
Rent
ing
Own
home Other Nth. Mid. Sth.
On-
line
Unweighted Base 406
100.0
191
47.0 100.0
215
53.0 100.0
5
1.2 100.0
37
9.1 100.0
93
22.9 100.0
123
30.3 100.0
93
22.9 100.0
55
13.5 100.0
61
15.0 100.0
335
82.5 100.0
10
2.5 100.0
50
12.3 100.0
125
30.8 100.0
125
30.8 100.0
106
26.1 100.0
Crucial
239 58.9
117 61.3
49.0
122 56.7
51.0
2 40.0
0.8
24 64.9
10.0
58 62.4
24.3
81 65.9
33.9
+
45 48.4
18.8
--
29 52.7
12.1
38 62.3
15.9
196 58.5
82.0
5 50.0
2.1
30 60.0
12.6
80 64.0
33.5
77 61.6
32.2
52 49.1
21.8
--
Important
128
31.5
54
28.3
42.2
74
34.4
57.8
2
40.0
1.6
12
32.4
9.4
25
26.9
19.5
30
24.4
23.4 --
37
39.8
28.9 +
22
40.0
17.2
14
23.0
10.9
111
33.1
86.7
3
30.0
2.3
12
24.0
9.4
41
32.8
32.0
38
30.4
29.7
37
34.9
28.9
Nice to have
25 6.2
12 6.3
48.0
13 6.0
52.0
1 20.0
4.0
- -
-
2 2.2
8.0
-
9 7.3
36.0
9 9.7
36.0
4 7.3
16.0
4 6.6
16.0
21 6.3
84.0
- -
-
3 6.0
12.0
3 2.4
12.0
--
7 5.6
28.0
12 11.3
48.0
++
Unimportant
7
1.7
4
2.1 57.1
3
1.4 42.9
-
- -
1
2.7 14.3
4
4.3 57.1
++
-
- -
2
2.2 28.6
-
- -
4
6.6 57.1
+++
2
0.6 28.6
---
1
10.0 14.3
1
2.0 14.3
-
- -
3
2.4 42.9
3
2.8 42.9
Not applicable
7
1.7
4
2.1
57.1
3
1.4
42.9
-
-
-
-
-
-
4
4.3
57.1 ++
3
2.4
42.9
-
-
-
-
-
-
1
1.6
14.3
5
1.5
71.4
1
10.0
14.3
4
8.0
57.1 +++
1
0.8
14.3
-
-
-
2
1.9
28.6

Table 7.12: How do you rate the IMPORTANCE to you of the following services or responsibilities?
Basic Services / Infrastructure Importance of Service
Community Health
Total
Gender Age Group Home ownership Location
Male
Fe-
male
18-24
yrs
25-34
yrs
35-44
yrs
45-54
yrs
55-64
yrs
65 yrs
and
over
Rent
ing
Own
home Other Nth. Mid. Sth.
On-
line
Unweighted Base 406
100.0
191
47.0 100.0
215
53.0 100.0
5
1.2 100.0
37
9.1 100.0
93
22.9 100.0
123
30.3 100.0
93
22.9 100.0
55
13.5 100.0
61
15.0 100.0
335
82.5 100.0
10
2.5 100.0
50
12.3 100.0
125
30.8 100.0
125
30.8 100.0
106
26.1 100.0
Crucial
176 43.3
73 38.2
41.5
--
103 47.9
58.5
++
2 40.0
1.1
20 54.1
11.4
35 37.6
19.9
58 47.2
33.0
39 41.9
22.2
22 40.0
12.5
24 39.3
13.6
148 44.2
84.1
4 40.0
2.3
22 44.0
12.5
49 39.2
27.8
51 40.8
29.0
54 50.9
30.7
+
Important
167
41.1
85
44.5
50.9
82
38.1
49.1
2
40.0
1.2
12
32.4
7.2
46
49.5
27.5 +
47
38.2
28.1
38
40.9
22.8
22
40.0
13.2
24
39.3
14.4
140
41.8
83.8
3
30.0
1.8
21
42.0
12.6
61
48.8
36.5 ++
53
42.4
31.7
32
30.2
19.2 ---
Nice to have
51 12.6
25 13.1
49.0
26 12.1
51.0
1 20.0
2.0
5 13.5
9.8
7 7.5
13.7
-
15 12.2
29.4
14 15.1
27.5
9 16.4
17.6
11 18.0
21.6
39 11.6
76.5
1 10.0
2.0
6 12.0
11.8
13 10.4
25.5
18 14.4
35.3
14 13.2
27.5
Unimportant
7
1.7
6
3.1 85.7
++
1
0.5 14.3
--
-
- -
-
- -
2
2.2 28.6
1
0.8 14.3
2
2.2 28.6
2
3.6 28.6
-
- -
6
1.8 85.7
1
10.0 14.3
-
- -
2
1.6 28.6
2
1.6 28.6
3
2.8 42.9
Quite unimportant
1
0.2
1
0.5
100.0
-
-
-
-
-
-
-
-
-
1
1.1
100.0 +
-
-
-
-
-
-
-
-
-
-
-
-
-
-
-
1
10.0
100.0
-
-
-
-
-
-
-
-
-
1
0.9
100.0 +
Don't know
2 0.5
- -
-
2 0.9
100.0
- -
-
- -
-
1 1.1
50.0
1 0.8
50.0
- -
-
- -
-
1 1.6
50.0
1 0.3
50.0
- -
-
- -
-
- -
-
1 0.8
50.0
1 0.9
50.0
Not applicable
2
0.5
1
0.5 50.0
1
0.5 50.0
-
- -
-
- -
1
1.1 50.0
1
0.8 50.0
-
- -
-
- -
1
1.6 50.0
1
0.3 50.0
-
- -
1
2.0 50.0
-
- -
-
- -
1
0.9 50.0

Table 8.1: Community Lifestyle Services Importance of Service
Parks, Playgrounds and Public Amenities
Total
Gender Age Group Home ownership Location
Male
Fe-
male
18-24
yrs
25-34
yrs
35-44
yrs
45-54
yrs
55-64
yrs
65 yrs
and
over
Rent
ing
Own
home Other Nth. Mid. Sth.
On-
line
Unweighted Base 406
100.0
191
47.0 100.0
215
53.0 100.0
5
1.2 100.0
37
9.1 100.0
93
22.9 100.0
123
30.3 100.0
93
22.9 100.0
55
13.5 100.0
61
15.0 100.0
335
82.5 100.0
10
2.5 100.0
50
12.3 100.0
125
30.8 100.0
125
30.8 100.0
106
26.1 100.0
Crucial
92
22.7
36
18.8 39.1
-
56
26.0 60.9
+
1
20.0 1.1
9
24.3 9.8
23
24.7 25.0
30
24.4 32.6
23
24.7 25.0
6
10.9 6.5
--
9
14.8 9.8
79
23.6 85.9
4
40.0 4.3
5
10.0 5.4
--
26
20.8 28.3
31
24.8 33.7
30
28.3 32.6
Important
178
43.8
91
47.6
51.1
87
40.5
48.9
3
60.0
1.7
19
51.4
10.7
45
48.4
25.3
51
41.5
28.7
37
39.8
20.8
23
41.8
12.9
27
44.3
15.2
148
44.2
83.1
3
30.0
1.7
27
54.0
15.2
62
49.6
34.8
47
37.6
26.4 -
42
39.6
23.6
Nice to have
116 28.6
50 26.2
43.1
66 30.7
56.9
1 20.0
0.9
9 24.3
7.8
23 24.7
19.8
37 30.1
31.9
28 30.1
24.1
18 32.7
15.5
24 39.3
20.7
++
89 26.6
76.7
-
3 30.0
2.6
16 32.0
13.8
27 21.6
23.3
--
43 34.4
37.1
+
30 28.3
25.9
Unimportant
14
3.4
9
4.7 64.3
5
2.3 35.7
-
- -
-
- -
1
1.1 7.1
3
2.4 21.4
3
3.2 21.4
7
12.7 50.0
+++
1
1.6 7.1
13
3.9 92.9
-
- -
1
2.0 7.1
7
5.6 50.0
4
3.2 28.6
2
1.9 14.3
Quite unimportant
4
1.0
3
1.6
75.0
1
0.5
25.0
-
-
-
-
-
-
-
-
-
1
0.8
25.0
2
2.2
50.0
1
1.8
25.0
-
-
-
4
1.2
100.0
-
-
-
-
-
-
3
2.4
75.0 +
-
-
-
1
0.9
25.0
Not applicable
2 0.5
2 1.0
100.0
- -
-
- -
-
- -
-
1 1.1
50.0
1 0.8
50.0
- -
-
- -
-
- -
-
2 0.6
100.0
- -
-
1 2.0
50.0
- -
-
- -
-
1 0.9
50.0

Table 8.2: Community Lifestyle Services Importance of Service
Environmental Controls
Total
Gender Age Group Home ownership Location
Male
Fe-
male
18-24
yrs
25-34
yrs
35-44
yrs
45-54
yrs
55-64
yrs
65 yrs
and
over
Rent
ing
Own
home Other Nth. Mid. Sth.
On-
line
Unweighted Base 406
100.0
191
47.0 100.0
215
53.0 100.0
5
1.2 100.0
37
9.1 100.0
93
22.9 100.0
123
30.3 100.0
93
22.9 100.0
55
13.5 100.0
61
15.0 100.0
335
82.5 100.0
10
2.5 100.0
50
12.3 100.0
125
30.8 100.0
125
30.8 100.0
106
26.1 100.0
Crucial
141
34.7
67
35.1 47.5
74
34.4 52.5
1
20.0 0.7
18
48.6 12.8
+
27
29.0 19.1
50
40.7 35.5
+
36
38.7 25.5
9
16.4 6.4
---
21
34.4 14.9
120
35.8 85.1
-
- -
19
38.0 13.5
33
26.4 23.4
--
53
42.4 37.6
++
36
34.0 25.5
Important
172
42.4
82
42.9
47.7
90
41.9
52.3
2
40.0
1.2
12
32.4
7.0
46
49.5
26.7
51
41.5
29.7
32
34.4
18.6 -
29
52.7
16.9 +
26
42.6
15.1
141
42.1
82.0
5
50.0
2.9
20
40.0
11.6
59
47.2
34.3
44
35.2
25.6 -
49
46.2
28.5
Nice to have
63 15.5
26 13.6
41.3
37 17.2
58.7
2 40.0
3.2
5 13.5
7.9
14 15.1
22.2
16 13.0
25.4
18 19.4
28.6
8 14.5
12.7
13 21.3
20.6
45 13.4
71.4
--
5 50.0
7.9
8 16.0
12.7
19 15.2
30.2
23 18.4
36.5
13 12.3
20.6
Unimportant
20
4.9
9
4.7 45.0
11
5.1 55.0
-
- -
1
2.7 5.0
4
4.3 20.0
5
4.1 25.0
5
5.4 25.0
5
9.1 25.0
1
1.6 5.0
19
5.7 95.0
-
- -
3
6.0 15.0
7
5.6 35.0
5
4.0 25.0
5
4.7 25.0
Quite unimportant
6
1.5
5
2.6
83.3 +
1
0.5
16.7 -
-
-
-
-
-
-
1
1.1
16.7
1
0.8
16.7
1
1.1
16.7
3
5.5
50.0 +++
-
-
-
6
1.8
100.0
-
-
-
-
-
-
5
4.0
83.3 +++
-
-
-
1
0.9
16.7
Don't know
3 0.7
2 1.0
66.7
1 0.5
33.3
- -
-
- -
-
1 1.1
33.3
- -
-
1 1.1
33.3
1 1.8
33.3
- -
-
3 0.9
100.0
- -
-
- -
-
2 1.6
66.7
- -
-
1 0.9
33.3
Not applicable
1
0.2
-
- -
1
0.5 100.0
-
- -
1
2.7 100.0
+++
-
- -
-
- -
-
- -
-
- -
-
- -
1
0.3 100.0
-
- -
-
- -
-
- -
-
- -
1
0.9 100.0
+

Table 8.3: Community Lifestyle Services Importance of Service
Environmental Protection/ Conserv.
Total
Gender Age Group Home ownership Location
Male
Fe-
male
18-24
yrs
25-34
yrs
35-44
yrs
45-54
yrs
55-64
yrs
65 yrs
and
over
Rent
ing
Own
home Other Nth. Mid. Sth.
On-
line
Unweighted Base 406
100.0
191
47.0 100.0
215
53.0 100.0
5
1.2 100.0
37
9.1 100.0
93
22.9 100.0
123
30.3 100.0
93
22.9 100.0
55
13.5 100.0
61
15.0 100.0
335
82.5 100.0
10
2.5 100.0
50
12.3 100.0
125
30.8 100.0
125
30.8 100.0
106
26.1 100.0
Crucial
158
38.9
71
37.2 44.9
87
40.5 55.1
2
40.0 1.3
19
51.4 12.0
36
38.7 22.8
51
41.5 32.3
41
44.1 25.9
9
16.4 5.7
---
22
36.1 13.9
135
40.3 85.4
1
10.0 0.6
21
42.0 13.3
33
26.4 20.9
---
58
46.4 36.7
++
46
43.4 29.1
Important
149
36.7
69
36.1
46.3
80
37.2
53.7
2
40.0
1.3
11
29.7
7.4
36
38.7
24.2
45
36.6
30.2
24
25.8
16.1 --
31
56.4
20.8 +++
26
42.6
17.4
118
35.2
79.2
5
50.0
3.4
18
36.0
12.1
55
44.0
36.9 ++
40
32.0
26.8
36
34.0
24.2
Nice to have
70 17.2
35 18.3
50.0
35 16.3
50.0
1 20.0
1.4
5 13.5
7.1
15 16.1
21.4
21 17.1
30.0
21 22.6
30.0
7 12.7
10.0
11 18.0
15.7
55 16.4
78.6
4 40.0
5.7
9 18.0
12.9
25 20.0
35.7
21 16.8
30.0
15 14.2
21.4
Unimportant
18
4.4
9
4.7 50.0
9
4.2 50.0
-
- -
1
2.7 5.6
3
3.2 16.7
6
4.9 33.3
4
4.3 22.2
4
7.3 22.2
2
3.3 11.1
16
4.8 88.9
-
- -
2
4.0 11.1
6
4.8 33.3
4
3.2 22.2
6
5.7 33.3
Quite unimportant
7
1.7
5
2.6
71.4
2
0.9
28.6
-
-
-
-
-
-
2
2.2
28.6
-
-
-
2
2.2
28.6
3
5.5
42.9 ++
-
-
-
7
2.1
100.0
-
-
-
-
-
-
4
3.2
57.1
2
1.6
28.6
1
0.9
14.3
Don't know
3 0.7
2 1.0
66.7
1 0.5
33.3
- -
-
- -
-
1 1.1
33.3
- -
-
1 1.1
33.3
1 1.8
33.3
- -
-
3 0.9
100.0
- -
-
- -
-
2 1.6
66.7
- -
-
1 0.9
33.3
Not applicable
1
0.2
-
- -
1
0.5 100.0
-
- -
1
2.7 100.0
+++
-
- -
-
- -
-
- -
-
- -
-
- -
1
0.3 100.0
-
- -
-
- -
-
- -
-
- -
1
0.9 100.0
+

Table 8.4: Community Lifestyle Services Importance of Service
Heritage Protection
Total
Gender Age Group Home ownership Location
Male
Fe-
male
18-24
yrs
25-34
yrs
35-44
yrs
45-54
yrs
55-64
yrs
65 yrs
and
over
Rent
ing
Own
home Other Nth. Mid. Sth.
On-
line
Unweighted Base 406
100.0
191
47.0 100.0
215
53.0 100.0
5
1.2 100.0
37
9.1 100.0
93
22.9 100.0
123
30.3 100.0
93
22.9 100.0
55
13.5 100.0
61
15.0 100.0
335
82.5 100.0
10
2.5 100.0
50
12.3 100.0
125
30.8 100.0
125
30.8 100.0
106
26.1 100.0
Crucial
106
26.1
40
20.9 37.7
--
66
30.7 62.3
++
-
- -
11
29.7 10.4
30
32.3 28.3
35
28.5 33.0
25
26.9 23.6
5
9.1 4.7
---
16
26.2 15.1
90
26.9 84.9
-
- -
21
42.0 19.8
+++
18
14.4 17.0
---
37
29.6 34.9
30
28.3 28.3
Important
150
36.9
73
38.2
48.7
77
35.8
51.3
3
60.0
2.0
15
40.5
10.0
27
29.0
18.0 -
47
38.2
31.3
31
33.3
20.7
27
49.1
18.0 ++
23
37.7
15.3
122
36.4
81.3
5
50.0
3.3
20
40.0
13.3
47
37.6
31.3
36
28.8
24.0 --
47
44.3
31.3 +
Nice to have
115 28.3
51 26.7
44.3
64 29.8
55.7
2 40.0
1.7
9 24.3
7.8
26 28.0
22.6
34 27.6
29.6
27 29.0
23.5
17 30.9
14.8
19 31.1
16.5
92 27.5
80.0
4 40.0
3.5
8 16.0
7.0
--
45 36.0
39.1
++
41 32.8
35.7
21 19.8
18.3
--
Unimportant
23
5.7
18
9.4 78.3
+++
5
2.3 21.7
---
-
- -
1
2.7 4.3
6
6.5 26.1
6
4.9 26.1
6
6.5 26.1
4
7.3 17.4
3
4.9 13.0
20
6.0 87.0
-
- -
1
2.0 4.3
11
8.8 47.8
+
8
6.4 34.8
3
2.8 13.0
Quite unimportant
8
2.0
6
3.1
75.0
2
0.9
25.0
-
-
-
-
-
-
3
3.2
37.5
1
0.8
12.5
3
3.2
37.5
1
1.8
12.5
-
-
-
7
2.1
87.5
1
10.0
12.5
-
-
-
3
2.4
37.5
2
1.6
25.0
3
2.8
37.5
Don't know
2 0.5
2 1.0
100.0
- -
-
- -
-
- -
-
1 1.1
50.0
- -
-
- -
-
1 1.8
50.0
- -
-
2 0.6
100.0
- -
-
- -
-
1 0.8
50.0
1 0.8
50.0
- -
-
Not applicable
2
0.5
1
0.5 50.0
1
0.5 50.0
-
- -
1
2.7 50.0
++
-
- -
-
- -
1
1.1 50.0
-
- -
-
- -
2
0.6 100.0
-
- -
-
- -
-
- -
-
- -
2
1.9 100.0
++

Table 8.5: Community Lifestyle Services Importance of Service
Sporting and Recreational Facilities
Total
Gender Age Group Home ownership Location
Male
Fe-
male
18-24
yrs
25-34
yrs
35-44
yrs
45-54
yrs
55-64
yrs
65 yrs
and
over
Rent
ing
Own
home Other Nth. Mid. Sth.
On-
line
Unweighted Base 406
100.0
191
47.0 100.0
215
53.0 100.0
5
1.2 100.0
37
9.1 100.0
93
22.9 100.0
123
30.3 100.0
93
22.9 100.0
55
13.5 100.0
61
15.0 100.0
335
82.5 100.0
10
2.5 100.0
50
12.3 100.0
125
30.8 100.0
125
30.8 100.0
106
26.1 100.0
Crucial
78
19.2
32
16.8 41.0
46
21.4 59.0
-
- -
11
29.7 14.1
+
22
23.7 28.2
25
20.3 32.1
14
15.1 17.9
6
10.9 7.7
-
10
16.4 12.8
65
19.4 83.3
3
30.0 3.8
4
8.0 5.1
--
22
17.6 28.2
28
22.4 35.9
24
22.6 30.8
Important
184
45.3
87
45.5
47.3
97
45.1
52.7
1
20.0
0.5
14
37.8
7.6
41
44.1
22.3
60
48.8
32.6
41
44.1
22.3
27
49.1
14.7
28
45.9
15.2
152
45.4
82.6
4
40.0
2.2
30
60.0
16.3 ++
64
51.2
34.8
51
40.8
27.7
39
36.8
21.2 --
Nice to have
113 27.8
55 28.8
48.7
58 27.0
51.3
4 80.0
3.5
10 27.0
8.8
25 26.9
22.1
30 24.4
26.5
27 29.0
23.9
17 30.9
15.0
22 36.1
19.5
89 26.6
78.8
2 20.0
1.8
15 30.0
13.3
27 21.6
23.9
-
39 31.2
34.5
32 30.2
28.3
Unimportant
27
6.7
15
7.9 55.6
12
5.6 44.4
-
- -
1
2.7 3.7
4
4.3 14.8
8
6.5 29.6
9
9.7 33.3
5
9.1 18.5
1
1.6 3.7
-
26
7.8 96.3
+
-
- -
1
2.0 3.7
11
8.8 40.7
7
5.6 25.9
8
7.5 29.6
Quite unimportant
2
0.5
2
1.0
100.0
-
-
-
-
-
-
-
-
-
1
1.1
50.0
-
-
-
1
1.1
50.0
-
-
-
-
-
-
1
0.3
50.0
1
10.0
50.0
-
-
-
-
-
-
-
-
-
2
1.9
100.0 ++
Don't know
1 0.2
- -
-
1 0.5
100.0
- -
-
- -
-
- -
-
- -
-
1 1.1
100.0
+
- -
-
- -
-
1 0.3
100.0
- -
-
- -
-
1 0.8
100.0
- -
-
- -
-
Not applicable
1
0.2
-
- -
1
0.5 100.0
-
- -
1
2.7 100.0
+++
-
- -
-
- -
-
- -
-
- -
-
- -
1
0.3 100.0
-
- -
-
- -
-
- -
-
- -
1
0.9 100.0
+

Table 8.6: Community Lifestyle Services Importance of Service
Cultural and Entertainment Facilities
Total
Gender Age Group Home ownership Location
Male
Fe-
male
18-24
yrs
25-34
yrs
35-44
yrs
45-54
yrs
55-64
yrs
65 yrs
and
over
Rent
ing
Own
home Other Nth. Mid. Sth.
On-
line
Unweighted Base 406
100.0
191
47.0 100.0
215
53.0 100.0
5
1.2 100.0
37
9.1 100.0
93
22.9 100.0
123
30.3 100.0
93
22.9 100.0
55
13.5 100.0
61
15.0 100.0
335
82.5 100.0
10
2.5 100.0
50
12.3 100.0
125
30.8 100.0
125
30.8 100.0
106
26.1 100.0
Crucial
66
16.3
25
13.1 37.9
41
19.1 62.1
-
- -
9
24.3 13.6
14
15.1 21.2
21
17.1 31.8
19
20.4 28.8
3
5.5 4.5
--
13
21.3 19.7
52
15.5 78.8
1
10.0 1.5
3
6.0 4.5
--
18
14.4 27.3
26
20.8 39.4
+
19
17.9 28.8
Important
168
41.4
74
38.7
44.0
94
43.7
56.0
1
20.0
0.6
15
40.5
8.9
40
43.0
23.8
53
43.1
31.5
33
35.5
19.6
26
47.3
15.5
25
41.0
14.9
138
41.2
82.1
5
50.0
3.0
29
58.0
17.3 ++
53
42.4
31.5
50
40.0
29.8
36
34.0
21.4 -
Nice to have
131 32.3
68 35.6
51.9
63 29.3
48.1
4 80.0
3.1
12 32.4
9.2
30 32.3
22.9
38 30.9
29.0
29 31.2
22.1
18 32.7
13.7
21 34.4
16.0
108 32.2
82.4
2 20.0
1.5
16 32.0
12.2
39 31.2
29.8
38 30.4
29.0
38 35.8
29.0
Unimportant
31
7.6
18
9.4 58.1
13
6.0 41.9
-
- -
-
- -
7
7.5 22.6
9
7.3 29.0
9
9.7 29.0
6
10.9 19.4
2
3.3 6.5
28
8.4 90.3
1
10.0 3.2
2
4.0 6.5
13
10.4 41.9
8
6.4 25.8
8
7.5 25.8
Quite unimportant
6
1.5
4
2.1
66.7
2
0.9
33.3
-
-
-
-
-
-
2
2.2
33.3
1
0.8
16.7
2
2.2
33.3
1
1.8
16.7
-
-
-
5
1.5
83.3
1
10.0
16.7
-
-
-
1
0.8
16.7
3
2.4
50.0
2
1.9
33.3
Don't know
1 0.2
- -
-
1 0.5
100.0
- -
-
- -
-
- -
-
- -
-
- -
-
1 1.8
100.0
++
- -
-
1 0.3
100.0
- -
-
- -
-
1 0.8
100.0
- -
-
- -
-
Not applicable
3
0.7
2
1.0 66.7
1
0.5 33.3
-
- -
1
2.7 33.3
-
- -
1
0.8 33.3
1
1.1 33.3
-
- -
-
- -
3
0.9 100.0
-
- -
-
- -
-
- -
-
- -
3
2.8 100.0
+++
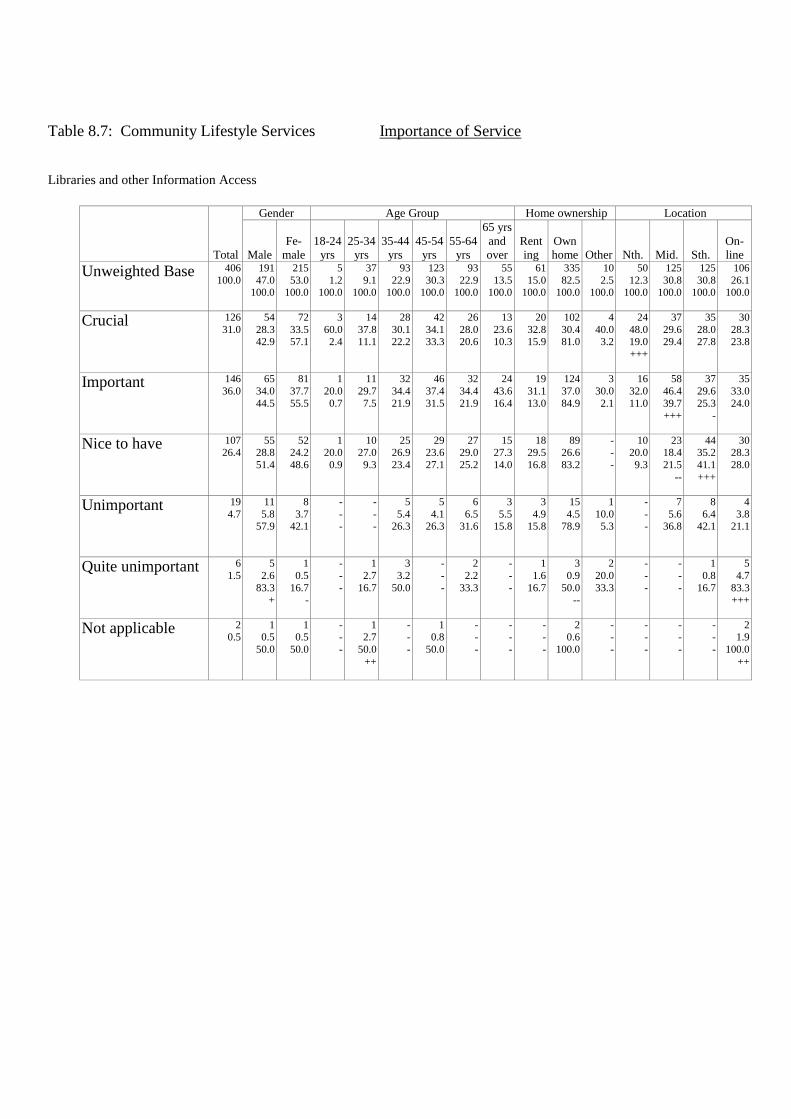
Table 8.7: Community Lifestyle Services Importance of Service
Libraries and other Information Access
Total
Gender Age Group Home ownership Location
Male
Fe-
male
18-24
yrs
25-34
yrs
35-44
yrs
45-54
yrs
55-64
yrs
65 yrs
and
over
Rent
ing
Own
home Other Nth. Mid. Sth.
On-
line
Unweighted Base 406
100.0
191
47.0 100.0
215
53.0 100.0
5
1.2 100.0
37
9.1 100.0
93
22.9 100.0
123
30.3 100.0
93
22.9 100.0
55
13.5 100.0
61
15.0 100.0
335
82.5 100.0
10
2.5 100.0
50
12.3 100.0
125
30.8 100.0
125
30.8 100.0
106
26.1 100.0
Crucial
126
31.0
54
28.3 42.9
72
33.5 57.1
3
60.0 2.4
14
37.8 11.1
28
30.1 22.2
42
34.1 33.3
26
28.0 20.6
13
23.6 10.3
20
32.8 15.9
102
30.4 81.0
4
40.0 3.2
24
48.0 19.0
+++
37
29.6 29.4
35
28.0 27.8
30
28.3 23.8
Important
146
36.0
65
34.0
44.5
81
37.7
55.5
1
20.0
0.7
11
29.7
7.5
32
34.4
21.9
46
37.4
31.5
32
34.4
21.9
24
43.6
16.4
19
31.1
13.0
124
37.0
84.9
3
30.0
2.1
16
32.0
11.0
58
46.4
39.7 +++
37
29.6
25.3 -
35
33.0
24.0
Nice to have
107 26.4
55 28.8
51.4
52 24.2
48.6
1 20.0
0.9
10 27.0
9.3
25 26.9
23.4
29 23.6
27.1
27 29.0
25.2
15 27.3
14.0
18 29.5
16.8
89 26.6
83.2
- -
-
10 20.0
9.3
23 18.4
21.5
--
44 35.2
41.1
+++
30 28.3
28.0
Unimportant
19
4.7
11
5.8 57.9
8
3.7 42.1
-
- -
-
- -
5
5.4 26.3
5
4.1 26.3
6
6.5 31.6
3
5.5 15.8
3
4.9 15.8
15
4.5 78.9
1
10.0 5.3
-
- -
7
5.6 36.8
8
6.4 42.1
4
3.8 21.1
Quite unimportant
6
1.5
5
2.6
83.3 +
1
0.5
16.7 -
-
-
-
1
2.7
16.7
3
3.2
50.0
-
-
-
2
2.2
33.3
-
-
-
1
1.6
16.7
3
0.9
50.0 --
2
20.0
33.3
-
-
-
-
-
-
1
0.8
16.7
5
4.7
83.3 +++
Not applicable
2 0.5
1 0.5
50.0
1 0.5
50.0
- -
-
1 2.7
50.0
++
- -
-
1 0.8
50.0
- -
-
- -
-
- -
-
2 0.6
100.0
- -
-
- -
-
- -
-
- -
-
2 1.9
100.0
++

Table 8.8: Community Lifestyle Services Importance of Service
Community Safety
Total
Gender Age Group Home ownership Location
Male
Fe-
male
18-24
yrs
25-34
yrs
35-44
yrs
45-54
yrs
55-64
yrs
65 yrs
and
over
Rent
ing
Own
home Other Nth. Mid. Sth.
On-
line
Unweighted Base 406
100.0
191
47.0 100.0
215
53.0 100.0
5
1.2 100.0
37
9.1 100.0
93
22.9 100.0
123
30.3 100.0
93
22.9 100.0
55
13.5 100.0
61
15.0 100.0
335
82.5 100.0
10
2.5 100.0
50
12.3 100.0
125
30.8 100.0
125
30.8 100.0
106
26.1 100.0
Crucial
160
39.4
61
31.9 38.1
---
99
46.0 61.9
+++
2
40.0 1.3
19
51.4 11.9
31
33.3 19.4
55
44.7 34.4
38
40.9 23.8
15
27.3 9.4
--
24
39.3 15.0
136
40.6 85.0
-
- -
14
28.0 8.8
-
49
39.2 30.6
41
32.8 25.6
-
56
52.8 35.0
+++
Important
177
43.6
87
45.5
49.2
90
41.9
50.8
3
60.0
1.7
16
43.2
9.0
45
48.4
25.4
53
43.1
29.9
34
36.6
19.2
26
47.3
14.7
24
39.3
13.6
148
44.2
83.6
5
50.0
2.8
26
52.0
14.7
58
46.4
32.8
62
49.6
35.0
31
29.2
17.5 ---
Nice to have
59 14.5
35 18.3
59.3
++
24 11.2
40.7
--
- -
-
2 5.4
3.4
-
14 15.1
23.7
13 10.6
22.0
19 20.4
32.2
+
11 20.0
18.6
12 19.7
20.3
42 12.5
71.2
--
5 50.0
8.5
9 18.0
15.3
16 12.8
27.1
21 16.8
35.6
13 12.3
22.0
Unimportant
7
1.7
5
2.6 71.4
2
0.9 28.6
-
- -
-
- -
3
3.2 42.9
2
1.6 28.6
1
1.1 14.3
1
1.8 14.3
1
1.6 14.3
6
1.8 85.7
-
- -
1
2.0 14.3
1
0.8 14.3
-
- -
5
4.7 71.4
+++
Quite unimportant
2
0.5
2
1.0
100.0
-
-
-
-
-
-
-
-
-
-
-
-
-
-
-
1
1.1
50.0
1
1.8
50.0
-
-
-
2
0.6
100.0
-
-
-
-
-
-
-
-
-
1
0.8
50.0
1
0.9
50.0
Not applicable
1 0.2
1 0.5
100.0
- -
-
- -
-
- -
-
- -
-
- -
-
- -
-
1 1.8
100.0
++
- -
-
1 0.3
100.0
- -
-
- -
-
1 0.8
100.0
- -
-
- -
-

Table 8.9: Community Lifestyle Services Importance of Service
Community Service
Total
Gender Age Group Home ownership Location
Male
Fe-
male
18-24
yrs
25-34
yrs
35-44
yrs
45-54
yrs
55-64
yrs
65 yrs
and
over
Rent
ing
Own
home Other Nth. Mid. Sth.
On-
line
Unweighted Base 406
100.0
191
47.0 100.0
215
53.0 100.0
5
1.2 100.0
37
9.1 100.0
93
22.9 100.0
123
30.3 100.0
93
22.9 100.0
55
13.5 100.0
61
15.0 100.0
335
82.5 100.0
10
2.5 100.0
50
12.3 100.0
125
30.8 100.0
125
30.8 100.0
106
26.1 100.0
Crucial
130
32.0
52
27.2 40.0
-
78
36.3 60.0
+
1
20.0 0.8
15
40.5 11.5
32
34.4 24.6
42
34.1 32.3
29
31.2 22.3
11
20.0 8.5
--
20
32.8 15.4
109
32.5 83.8
1
10.0 0.8
10
20.0 7.7
-
38
30.4 29.2
47
37.6 36.2
35
33.0 26.9
Important
175
43.1
83
43.5
47.4
92
42.8
52.6
3
60.0
1.7
13
35.1
7.4
39
41.9
22.3
52
42.3
29.7
40
43.0
22.9
28
50.9
16.0
25
41.0
14.3
147
43.9
84.0
3
30.0
1.7
30
60.0
17.1 ++
64
51.2
36.6 ++
43
34.4
24.6 --
38
35.8
21.7 -
Nice to have
81 20.0
42 22.0
51.9
39 18.1
48.1
- -
-
8 21.6
9.9
16 17.2
19.8
23 18.7
28.4
22 23.7
27.2
12 21.8
14.8
15 24.6
18.5
62 18.5
76.5
4 40.0
4.9
8 16.0
9.9
18 14.4
22.2
-
31 24.8
38.3
24 22.6
29.6
Unimportant
12
3.0
11
5.8 91.7
+++
1
0.5 8.3
---
-
- -
-
- -
5
5.4 41.7
4
3.3 33.3
-
- -
3
5.5 25.0
-
- -
11
3.3 91.7
1
10.0 8.3
1
2.0 8.3
3
2.4 25.0
2
1.6 16.7
6
5.7 50.0
+
Quite unimportant
2
0.5
-
-
-
2
0.9
100.0
-
-
-
-
-
-
1
1.1
50.0
-
-
-
1
1.1
50.0
-
-
-
1
1.6
50.0
1
0.3
50.0
-
-
-
1
2.0
50.0
-
-
-
1
0.8
50.0
-
-
-
Don't know
5 1.2
3 1.6
60.0
2 0.9
40.0
1 20.0
20.0
- -
-
- -
-
2 1.6
40.0
1 1.1
20.0
1 1.8
20.0
- -
-
4 1.2
80.0
1 10.0
20.0
- -
-
2 1.6
40.0
1 0.8
20.0
2 1.9
40.0
Not applicable
1
0.2
-
- -
1
0.5 100.0
-
- -
1
2.7 100.0
+++
-
- -
-
- -
-
- -
-
- -
-
- -
1
0.3 100.0
-
- -
-
- -
-
- -
-
- -
1
0.9 100.0
+

Table 8.10: Community Lifestyle Services Importance of Service
Pet/Animal Control
Total
Gender Age Group Home ownership Location
Male
Fe-
male
18-24
yrs
25-34
yrs
35-44
yrs
45-54
yrs
55-64
yrs
65 yrs
and
over
Rent
ing
Own
home Other Nth. Mid. Sth.
On-
line
Unweighted Base 406
100.0
191
47.0 100.0
215
53.0 100.0
5
1.2 100.0
37
9.1 100.0
93
22.9 100.0
123
30.3 100.0
93
22.9 100.0
55
13.5 100.0
61
15.0 100.0
335
82.5 100.0
10
2.5 100.0
50
12.3 100.0
125
30.8 100.0
125
30.8 100.0
106
26.1 100.0
Crucial
112
27.6
54
28.3 48.2
58
27.0 51.8
-
- -
7
18.9 6.3
27
29.0 24.1
43
35.0 38.4
++
22
23.7 19.6
13
23.6 11.6
14
23.0 12.5
95
28.4 84.8
3
30.0 2.7
25
50.0 22.3
+++
33
26.4 29.5
27
21.6 24.1
-
27
25.5 24.1
Important
189
46.6
81
42.4
42.9
108
50.2
57.1
-
-
-
20
54.1
10.6
43
46.2
22.8
54
43.9
28.6
45
48.4
23.8
27
49.1
14.3
24
39.3
12.7
162
48.4
85.7
3
30.0
1.6
17
34.0
9.0 -
58
46.4
30.7
63
50.4
33.3
51
48.1
27.0
Nice to have
85 20.9
44 23.0
51.8
41 19.1
48.2
4 80.0
4.7
8 21.6
9.4
16 17.2
18.8
21 17.1
24.7
24 25.8
28.2
12 21.8
14.1
21 34.4
24.7
+++
63 18.8
74.1
--
1 10.0
1.2
8 16.0
9.4
27 21.6
31.8
30 24.0
35.3
20 18.9
23.5
Unimportant
12
3.0
8
4.2 66.7
4
1.9 33.3
-
- -
1
2.7 8.3
6
6.5 50.0
++
3
2.4 25.0
1
1.1 8.3
1
1.8 8.3
2
3.3 16.7
8
2.4 66.7
2
20.0 16.7
-
- -
4
3.2 33.3
3
2.4 25.0
5
4.7 41.7
Quite unimportant
4
1.0
3
1.6
75.0
1
0.5
25.0
-
-
-
-
-
-
1
1.1
25.0
1
0.8
25.0
1
1.1
25.0
1
1.8
25.0
-
-
-
4
1.2
100.0
-
-
-
-
-
-
1
0.8
25.0
2
1.6
50.0
1
0.9
25.0
Don't know
1 0.2
- -
-
1 0.5
100.0
- -
-
- -
-
- -
-
1 0.8
100.0
- -
-
- -
-
- -
-
1 0.3
100.0
- -
-
- -
-
1 0.8
100.0
- -
-
- -
-
Not applicable
3
0.7
1
0.5 33.3
2
0.9 66.7
1
20.0 33.3
1
2.7 33.3
-
- -
-
- -
-
- -
1
1.8 33.3
-
- -
2
0.6 66.7
1
10.0 33.3
-
- -
1
0.8 33.3
-
- -
2
1.9 66.7

Table 8.11: Community Lifestyle Services Importance of Service
Shopping Facilities
Total
Gender Age Group Home ownership Location
Male
Fe-
male
18-24
yrs
25-34
yrs
35-44
yrs
45-54
yrs
55-64
yrs
65 yrs
and
over
Rent
ing
Own
home Other Nth. Mid. Sth.
On-
line
Unweighted Base 406
100.0
191
47.0 100.0
215
53.0 100.0
5
1.2 100.0
37
9.1 100.0
93
22.9 100.0
123
30.3 100.0
93
22.9 100.0
55
13.5 100.0
61
15.0 100.0
335
82.5 100.0
10
2.5 100.0
50
12.3 100.0
125
30.8 100.0
125
30.8 100.0
106
26.1 100.0
Crucial
94
23.2
45
23.6 47.9
49
22.8 52.1
-
- -
8
21.6 8.5
19
20.4 20.2
34
27.6 36.2
23
24.7 24.5
10
18.2 10.6
10
16.4 10.6
82
24.5 87.2
2
20.0 2.1
21
42.0 22.3
+++
33
26.4 35.1
24
19.2 25.5
16
15.1 17.0
--
Important
188
46.3
85
44.5
45.2
103
47.9
54.8
2
40.0
1.1
20
54.1
10.6
41
44.1
21.8
58
47.2
30.9
37
39.8
19.7
30
54.5
16.0
30
49.2
16.0
156
46.6
83.0
2
20.0
1.1
21
42.0
11.2
63
50.4
33.5
59
47.2
31.4
45
42.5
23.9
Nice to have
92 22.7
43 22.5
46.7
49 22.8
53.3
3 60.0
3.3
8 21.6
8.7
24 25.8
26.1
21 17.1
22.8
-
25 26.9
27.2
11 20.0
12.0
17 27.9
18.5
72 21.5
78.3
3 30.0
3.3
7 14.0
7.6
23 18.4
25.0
33 26.4
35.9
29 27.4
31.5
Unimportant
23
5.7
12
6.3 52.2
11
5.1 47.8
-
- -
-
- -
7
7.5 30.4
8
6.5 34.8
7
7.5 30.4
1
1.8 4.3
4
6.6 17.4
18
5.4 78.3
1
10.0 4.3
1
2.0 4.3
2
1.6 8.7
--
7
5.6 30.4
13
12.3 56.5
+++
Quite unimportant
5
1.2
3
1.6
60.0
2
0.9
40.0
-
-
-
-
-
-
2
2.2
40.0
-
-
-
1
1.1
20.0
2
3.6
40.0 +
-
-
-
3
0.9
60.0
2
20.0
40.0
-
-
-
2
1.6
40.0
2
1.6
40.0
1
0.9
20.0
Don't know
1 0.2
1 0.5
100.0
- -
-
- -
-
- -
-
- -
-
- -
-
- -
-
1 1.8
100.0
++
- -
-
1 0.3
100.0
- -
-
- -
-
1 0.8
100.0
- -
-
- -
-
Not applicable
3
0.7
2
1.0 66.7
1
0.5 33.3
-
- -
1
2.7 33.3
-
- -
2
1.6 66.7
-
- -
-
- -
-
- -
3
0.9 100.0
-
- -
-
- -
1
0.8 33.3
-
- -
2
1.9 66.7

Table 8.12: Community Lifestyle Services Importance of Service
Community Development
Total
Gender Age Group Home ownership Location
Male
Fe-
male
18-24
yrs
25-34
yrs
35-44
yrs
45-54
yrs
55-64
yrs
65 yrs
and
over
Rent
ing
Own
home Other Nth. Mid. Sth.
On-
line
Unweighted Base 406
100.0
191
47.0 100.0
215
53.0 100.0
5
1.2 100.0
37
9.1 100.0
93
22.9 100.0
123
30.3 100.0
93
22.9 100.0
55
13.5 100.0
61
15.0 100.0
335
82.5 100.0
10
2.5 100.0
50
12.3 100.0
125
30.8 100.0
125
30.8 100.0
106
26.1 100.0
Crucial
85
20.9
35
18.3 41.2
50
23.3 58.8
1
20.0 1.2
7
18.9 8.2
17
18.3 20.0
27
22.0 31.8
25
26.9 29.4
8
14.5 9.4
11
18.0 12.9
72
21.5 84.7
2
20.0 2.4
13
26.0 15.3
22
17.6 25.9
22
17.6 25.9
28
26.4 32.9
Important
186
45.8
87
45.5
46.8
99
46.0
53.2
1
20.0
0.5
19
51.4
10.2
42
45.2
22.6
60
48.8
32.3
39
41.9
21.0
25
45.5
13.4
26
42.6
14.0
157
46.9
84.4
3
30.0
1.6
29
58.0
15.6 +
64
51.2
34.4
51
40.8
27.4
42
39.6
22.6
Nice to have
113 27.8
59 30.9
52.2
54 25.1
47.8
2 40.0
1.8
10 27.0
8.8
30 32.3
26.5
29 23.6
25.7
25 26.9
22.1
17 30.9
15.0
19 31.1
16.8
91 27.2
80.5
3 30.0
2.7
7 14.0
6.2
--
32 25.6
28.3
47 37.6
41.6
+++
27 25.5
23.9
Unimportant
13
3.2
6
3.1 46.2
7
3.3 53.8
-
- -
-
- -
2
2.2 15.4
5
4.1 38.5
3
3.2 23.1
3
5.5 23.1
2
3.3 15.4
11
3.3 84.6
-
- -
-
- -
5
4.0 38.5
2
1.6 15.4
6
5.7 46.2
+
Quite unimportant
4
1.0
2
1.0
50.0
2
0.9
50.0
-
-
-
-
-
-
2
2.2
50.0
1
0.8
25.0
-
-
-
1
1.8
25.0
2
3.3
50.0 ++
1
0.3
25.0 ---
1
10.0
25.0
1
2.0
25.0
2
1.6
50.0
1
0.8
25.0
-
-
-
Don't know
3 0.7
1 0.5
33.3
2 0.9
66.7
1 20.0
33.3
- -
-
- -
-
- -
-
1 1.1
33.3
1 1.8
33.3
1 1.6
33.3
1 0.3
33.3
--
1 10.0
33.3
- -
-
- -
-
2 1.6
66.7
1 0.9
33.3
Not applicable
2
0.5
1
0.5 50.0
1
0.5 50.0
-
- -
1
2.7 50.0
++
-
- -
1
0.8 50.0
-
- -
-
- -
-
- -
2
0.6 100.0
-
- -
-
- -
-
- -
-
- -
2
1.9 100.0
++

Table 9.1: Managing the Shire/City Importance of Service
Town Planning
Total
Gender Age Group Home ownership Location
Male
Fe-
male
18-24
yrs
25-34
yrs
35-44
yrs
45-54
yrs
55-64
yrs
65 yrs
and
over
Rent
ing
Own
home Other Nth. Mid. Sth.
On-
line
Unweighted Base 406
100.0
191
47.0 100.0
215
53.0 100.0
5
1.2 100.0
37
9.1 100.0
93
22.9 100.0
123
30.3 100.0
93
22.9 100.0
55
13.5 100.0
61
15.0 100.0
335
82.5 100.0
10
2.5 100.0
50
12.3 100.0
125
30.8 100.0
125
30.8 100.0
106
26.1 100.0
Crucial
167
41.1
78
40.8 46.7
89
41.4 53.3
1
20.0 0.6
15
40.5 9.0
38
40.9 22.8
50
40.7 29.9
48
51.6 28.7
++
15
27.3 9.0
--
17
27.9 10.2
--
147
43.9 88.0
++
3
30.0 1.8
9
18.0 5.4
---
54
43.2 32.3
61
48.8 36.5
++
43
40.6 25.7
Important
187
46.1
89
46.6
47.6
98
45.6
52.4
-
-
-
17
45.9
9.1
42
45.2
22.5
61
49.6
32.6
35
37.6
18.7 -
32
58.2
17.1 +
30
49.2
16.0
153
45.7
81.8
4
40.0
2.1
31
62.0
16.6 ++
56
44.8
29.9
55
44.0
29.4
45
42.5
24.1
Nice to have
41 10.1
18 9.4
43.9
23 10.7
56.1
2 40.0
4.9
3 8.1
7.3
11 11.8
26.8
10 8.1
24.4
8 8.6
19.5
7 12.7
17.1
11 18.0
26.8
++
28 8.4
68.3
--
2 20.0
4.9
8 16.0
19.5
12 9.6
29.3
8 6.4
19.5
-
13 12.3
31.7
Unimportant
8
2.0
3
1.6 37.5
5
2.3 62.5
1
20.0 12.5
2
5.4 25.0
1
1.1 12.5
1
0.8 12.5
2
2.2 25.0
1
1.8 12.5
3
4.9 37.5
+
5
1.5 62.5
-
- -
2
4.0 25.0
2
1.6 25.0
1
0.8 12.5
3
2.8 37.5
Quite unimportant
1
0.2
1
0.5
100.0
-
-
-
-
-
-
-
-
-
1
1.1
100.0 +
-
-
-
-
-
-
-
-
-
-
-
-
1
0.3
100.0
-
-
-
-
-
-
1
0.8
100.0
-
-
-
-
-
-
Don't know
1 0.2
1 0.5
100.0
- -
-
1 20.0
100.0
- -
-
- -
-
- -
-
- -
-
- -
-
- -
-
- -
-
1 10.0
100.0
- -
-
- -
-
- -
-
1 0.9
100.0
+
Not applicable
1
0.2
1
0.5 100.0
-
- -
-
- -
-
- -
-
- -
1
0.8 100.0
-
- -
-
- -
-
- -
1
0.3 100.0
-
- -
-
- -
-
- -
-
- -
1
0.9 100.0
+
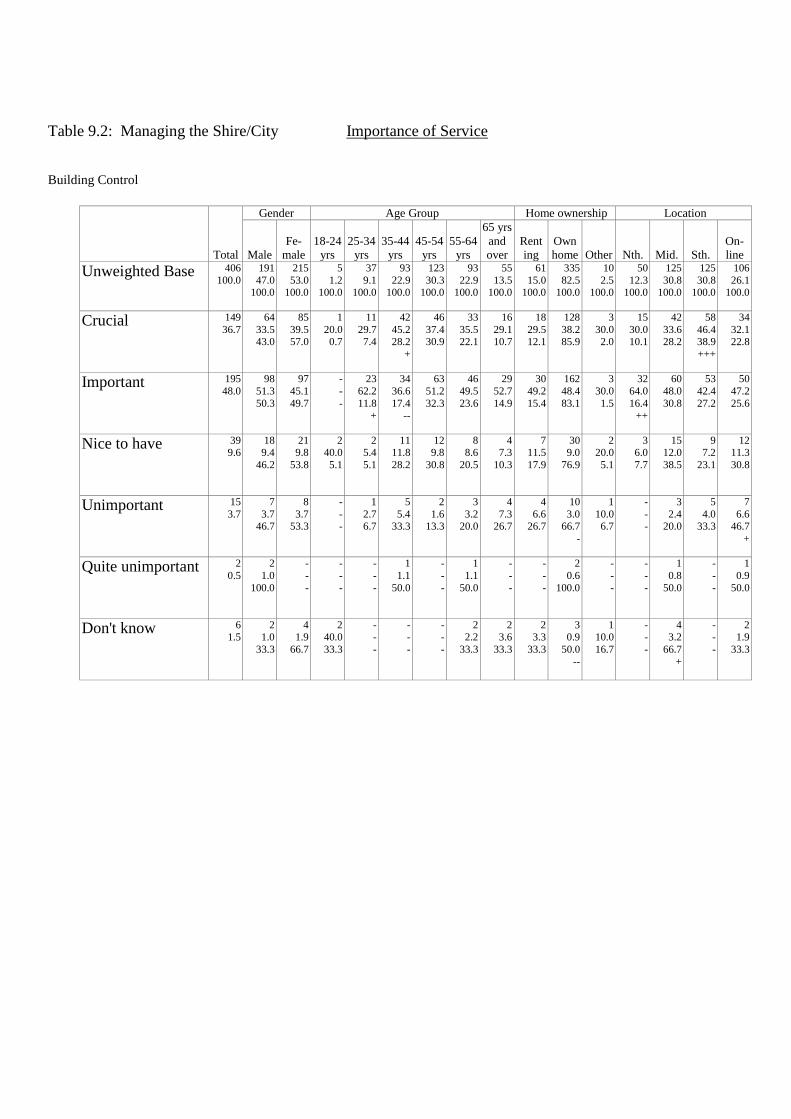
Table 9.2: Managing the Shire/City Importance of Service
Building Control
Total
Gender Age Group Home ownership Location
Male
Fe-
male
18-24
yrs
25-34
yrs
35-44
yrs
45-54
yrs
55-64
yrs
65 yrs
and
over
Rent
ing
Own
home Other Nth. Mid. Sth.
On-
line
Unweighted Base 406
100.0
191
47.0 100.0
215
53.0 100.0
5
1.2 100.0
37
9.1 100.0
93
22.9 100.0
123
30.3 100.0
93
22.9 100.0
55
13.5 100.0
61
15.0 100.0
335
82.5 100.0
10
2.5 100.0
50
12.3 100.0
125
30.8 100.0
125
30.8 100.0
106
26.1 100.0
Crucial
149
36.7
64
33.5 43.0
85
39.5 57.0
1
20.0 0.7
11
29.7 7.4
42
45.2 28.2
+
46
37.4 30.9
33
35.5 22.1
16
29.1 10.7
18
29.5 12.1
128
38.2 85.9
3
30.0 2.0
15
30.0 10.1
42
33.6 28.2
58
46.4 38.9
+++
34
32.1 22.8
Important
195
48.0
98
51.3
50.3
97
45.1
49.7
-
-
-
23
62.2
11.8 +
34
36.6
17.4 --
63
51.2
32.3
46
49.5
23.6
29
52.7
14.9
30
49.2
15.4
162
48.4
83.1
3
30.0
1.5
32
64.0
16.4 ++
60
48.0
30.8
53
42.4
27.2
50
47.2
25.6
Nice to have
39 9.6
18 9.4
46.2
21 9.8
53.8
2 40.0
5.1
2 5.4
5.1
11 11.8
28.2
12 9.8
30.8
8 8.6
20.5
4 7.3
10.3
7 11.5
17.9
30 9.0
76.9
2 20.0
5.1
3 6.0
7.7
15 12.0
38.5
9 7.2
23.1
12 11.3
30.8
Unimportant
15
3.7
7
3.7 46.7
8
3.7 53.3
-
- -
1
2.7 6.7
5
5.4 33.3
2
1.6 13.3
3
3.2 20.0
4
7.3 26.7
4
6.6 26.7
10
3.0 66.7
-
1
10.0 6.7
-
- -
3
2.4 20.0
5
4.0 33.3
7
6.6 46.7
+
Quite unimportant
2
0.5
2
1.0
100.0
-
-
-
-
-
-
-
-
-
1
1.1
50.0
-
-
-
1
1.1
50.0
-
-
-
-
-
-
2
0.6
100.0
-
-
-
-
-
-
1
0.8
50.0
-
-
-
1
0.9
50.0
Don't know
6 1.5
2 1.0
33.3
4 1.9
66.7
2 40.0
33.3
- -
-
- -
-
- -
-
2 2.2
33.3
2 3.6
33.3
2 3.3
33.3
3 0.9
50.0
--
1 10.0
16.7
- -
-
4 3.2
66.7
+
- -
-
2 1.9
33.3

Table 9.3: Managing the Shire/City Importance of Service
Economic Development /Local Employment
Total
Gender Age Group Home ownership Location
Male
Fe-
male
18-24
yrs
25-34
yrs
35-44
yrs
45-54
yrs
55-64
yrs
65 yrs
and
over
Rent
ing
Own
home Other Nth. Mid. Sth.
On-
line
Unweighted Base 406
100.0
191
47.0 100.0
215
53.0 100.0
5
1.2 100.0
37
9.1 100.0
93
22.9 100.0
123
30.3 100.0
93
22.9 100.0
55
13.5 100.0
61
15.0 100.0
335
82.5 100.0
10
2.5 100.0
50
12.3 100.0
125
30.8 100.0
125
30.8 100.0
106
26.1 100.0
Crucial
205
50.5
96
50.3 46.8
109
50.7 53.2
2
40.0 1.0
20
54.1 9.8
51
54.8 24.9
64
52.0 31.2
47
50.5 22.9
21
38.2 10.2
--
31
50.8 15.1
169
50.4 82.4
5
50.0 2.4
30
60.0 14.6
62
49.6 30.2
65
52.0 31.7
48
45.3 23.4
Important
157
38.7
74
38.7
47.1
83
38.6
52.9
2
40.0
1.3
13
35.1
8.3
32
34.4
20.4
48
39.0
30.6
35
37.6
22.3
27
49.1
17.2 +
24
39.3
15.3
130
38.8
82.8
3
30.0
1.9
17
34.0
10.8
49
39.2
31.2
50
40.0
31.8
41
38.7
26.1
Nice to have
31 7.6
14 7.3
45.2
17 7.9
54.8
1 20.0
3.2
4 10.8
12.9
7 7.5
22.6
7 5.7
22.6
7 7.5
22.6
5 9.1
16.1
6 9.8
19.4
23 6.9
74.2
2 20.0
6.5
3 6.0
9.7
9 7.2
29.0
6 4.8
19.4
13 12.3
41.9
++
Unimportant
7
1.7
4
2.1 57.1
3
1.4 42.9
-
- -
-
- -
2
2.2 28.6
2
1.6 28.6
2
2.2 28.6
1
1.8 14.3
-
- -
7
2.1 100.0
-
- -
-
- -
2
1.6 28.6
3
2.4 42.9
2
1.9 28.6
Quite unimportant
2
0.5
2
1.0
100.0
-
-
-
-
-
-
-
-
-
1
1.1
50.0
-
-
-
1
1.1
50.0
-
-
-
-
-
-
2
0.6
100.0
-
-
-
-
-
-
1
0.8
50.0
-
-
-
1
0.9
50.0
Don't know
3 0.7
- -
-
3 1.4
100.0
- -
-
- -
-
- -
-
1 0.8
33.3
1 1.1
33.3
1 1.8
33.3
- -
-
3 0.9
100.0
- -
-
- -
-
2 1.6
66.7
1 0.8
33.3
- -
-
Not applicable
1
0.2
1
0.5 100.0
-
- -
-
- -
-
- -
-
- -
1
0.8 100.0
-
- -
-
- -
-
- -
1
0.3 100.0
-
- -
-
- -
-
- -
-
- -
1
0.9 100.0
+

Table 9.4: Managing the Shire/City Importance of Service
Development of Tourism
Total
Gender Age Group Home ownership Location
Male
Fe-
male
18-24
yrs
25-34
yrs
35-44
yrs
45-54
yrs
55-64
yrs
65 yrs
and
over
Rent
ing
Own
home Other Nth. Mid. Sth.
On-
line
Unweighted Base 406
100.0
191
47.0 100.0
215
53.0 100.0
5
1.2 100.0
37
9.1 100.0
93
22.9 100.0
123
30.3 100.0
93
22.9 100.0
55
13.5 100.0
61
15.0 100.0
335
82.5 100.0
10
2.5 100.0
50
12.3 100.0
125
30.8 100.0
125
30.8 100.0
106
26.1 100.0
Crucial
157
38.7
71
37.2 45.2
86
40.0 54.8
1
20.0 0.6
12
32.4 7.6
43
46.2 27.4
+
46
37.4 29.3
37
39.8 23.6
18
32.7 11.5
23
37.7 14.6
130
38.8 82.8
4
40.0 2.5
30
60.0 19.1
+++
42
33.6 26.8
41
32.8 26.1
44
41.5 28.0
Important
168
41.4
80
41.9
47.6
88
40.9
52.4
2
40.0
1.2
17
45.9
10.1
29
31.2
17.3 --
56
45.5
33.3
35
37.6
20.8
29
52.7
17.3 +
25
41.0
14.9
142
42.4
84.5
1
10.0
0.6
17
34.0
10.1
56
44.8
33.3
60
48.0
35.7 +
35
33.0
20.8 --
Nice to have
59 14.5
29 15.2
49.2
30 14.0
50.8
2 40.0
3.4
7 18.9
11.9
13 14.0
22.0
16 13.0
27.1
16 17.2
27.1
5 9.1
8.5
10 16.4
16.9
46 13.7
78.0
3 30.0
5.1
3 6.0
5.1
-
18 14.4
30.5
22 17.6
37.3
16 15.1
27.1
Unimportant
17
4.2
9
4.7 52.9
8
3.7 47.1
-
- -
-
- -
6
6.5 35.3
4
3.3 23.5
4
4.3 23.5
3
5.5 17.6
3
4.9 17.6
12
3.6 70.6
2
20.0 11.8
-
- -
7
5.6 41.2
2
1.6 11.8
-
8
7.5 47.1
++
Quite unimportant
3
0.7
1
0.5
33.3
2
0.9
66.7
-
-
-
1
2.7
33.3
2
2.2
66.7 +
-
-
-
-
-
-
-
-
-
-
-
-
3
0.9
100.0
-
-
-
-
-
-
1
0.8
33.3
-
-
-
2
1.9
66.7
Not applicable
1 0.2
1 0.5
100.0
- -
-
- -
-
- -
-
- -
-
1 0.8
100.0
- -
-
- -
-
- -
-
1 0.3
100.0
- -
-
- -
-
- -
-
- -
-
1 0.9
100.0
+

Table 9.5: Managing the Shire/City Importance of Service
Financial Management
Total
Gender Age Group Home ownership Location
Male
Fe-
male
18-24
yrs
25-34
yrs
35-44
yrs
45-54
yrs
55-64
yrs
65 yrs
and
over
Rent
ing
Own
home Other Nth. Mid. Sth.
On-
line
Unweighted Base 406
100.0
191
47.0 100.0
215
53.0 100.0
5
1.2 100.0
37
9.1 100.0
93
22.9 100.0
123
30.3 100.0
93
22.9 100.0
55
13.5 100.0
61
15.0 100.0
335
82.5 100.0
10
2.5 100.0
50
12.3 100.0
125
30.8 100.0
125
30.8 100.0
106
26.1 100.0
Crucial
219
53.9
107
56.0 48.9
112
52.1 51.1
2
40.0 0.9
19
51.4 8.7
55
59.1 25.1
62
50.4 28.3
51
54.8 23.3
30
54.5 13.7
30
49.2 13.7
183
54.6 83.6
6
60.0 2.7
23
46.0 10.5
66
52.8 30.1
78
62.4 35.6
++
52
49.1 23.7
Important
150
36.9
72
37.7
48.0
78
36.3
52.0
2
40.0
1.3
13
35.1
8.7
29
31.2
19.3
55
44.7
36.7 ++
32
34.4
21.3
19
34.5
12.7
22
36.1
14.7
126
37.6
84.0
2
20.0
1.3
20
40.0
13.3
49
39.2
32.7
38
30.4
25.3 -
43
40.6
28.7
Nice to have
23 5.7
8 4.2
34.8
15 7.0
65.2
1 20.0
4.3
4 10.8
17.4
6 6.5
26.1
2 1.6
8.7
--
6 6.5
26.1
4 7.3
17.4
6 9.8
26.1
15 4.5
65.2
--
2 20.0
8.7
6 12.0
26.1
++
5 4.0
21.7
8 6.4
34.8
4 3.8
17.4
Unimportant
7
1.7
2
1.0 28.6
5
2.3 71.4
-
- -
1
2.7 14.3
-
- -
2
1.6 28.6
3
3.2 42.9
1
1.8 14.3
2
3.3 28.6
5
1.5 71.4
-
- -
1
2.0 14.3
1
0.8 14.3
1
0.8 14.3
4
3.8 57.1
+
Quite unimportant
2
0.5
1
0.5
50.0
1
0.5
50.0
-
-
-
-
-
-
2
2.2
100.0 +++
-
-
-
-
-
-
-
-
-
-
-
-
2
0.6
100.0
-
-
-
-
-
-
1
0.8
50.0
-
-
-
1
0.9
50.0
Don't know
4 1.0
- -
-
4 1.9
100.0
+
- -
-
- -
-
1 1.1
25.0
1 0.8
25.0
1 1.1
25.0
1 1.8
25.0
1 1.6
25.0
3 0.9
75.0
- -
-
- -
-
3 2.4
75.0
+
- -
-
1 0.9
25.0
Not applicable
1
0.2
1
0.5 100.0
-
- -
-
- -
-
- -
-
- -
1
0.8 100.0
-
- -
-
- -
-
- -
1
0.3 100.0
-
- -
-
- -
-
- -
-
- -
1
0.9 100.0
+

Table 9.6: Managing the Shire/City Importance of Service
Revenue-raising
Total
Gender Age Group Home ownership Location
Male
Fe-
male
18-24
yrs
25-34
yrs
35-44
yrs
45-54
yrs
55-64
yrs
65 yrs
and
over
Rent
ing
Own
home Other Nth. Mid. Sth.
On-
line
Unweighted Base 406
100.0
191
47.0 100.0
215
53.0 100.0
5
1.2 100.0
37
9.1 100.0
93
22.9 100.0
123
30.3 100.0
93
22.9 100.0
55
13.5 100.0
61
15.0 100.0
335
82.5 100.0
10
2.5 100.0
50
12.3 100.0
125
30.8 100.0
125
30.8 100.0
106
26.1 100.0
Crucial
126
31.0
58
30.4 46.0
68
31.6 54.0
-
- -
13
35.1 10.3
30
32.3 23.8
42
34.1 33.3
27
29.0 21.4
14
25.5 11.1
12
19.7 9.5
--
110
32.8 87.3
+
4
40.0 3.2
14
28.0 11.1
46
36.8 36.5
+
42
33.6 33.3
24
22.6 19.0
--
Important
200
49.3
100
52.4
50.0
100
46.5
50.0
2
40.0
1.0
16
43.2
8.0
41
44.1
20.5
63
51.2
31.5
50
53.8
25.0
28
50.9
14.0
33
54.1
16.5
164
49.0
82.0
3
30.0
1.5
27
54.0
13.5
63
50.4
31.5
59
47.2
29.5
51
48.1
25.5
Nice to have
56 13.8
25 13.1
44.6
31 14.4
55.4
2 40.0
3.6
5 13.5
8.9
16 17.2
28.6
12 9.8
21.4
11 11.8
19.6
10 18.2
17.9
12 19.7
21.4
42 12.5
75.0
2 20.0
3.6
9 18.0
16.1
11 8.8
19.6
-
19 15.2
33.9
17 16.0
30.4
Unimportant
9
2.2
3
1.6 33.3
6
2.8 66.7
-
- -
1
2.7 11.1
1
1.1 11.1
4
3.3 44.4
2
2.2 22.2
1
1.8 11.1
2
3.3 22.2
7
2.1 77.8
-
- -
-
- -
-
- -
3
2.4 33.3
6
5.7 66.7
+++
Quite unimportant
5
1.2
3
1.6
60.0
2
0.9
40.0
-
-
-
1
2.7
20.0
3
3.2
60.0 ++
-
-
-
1
1.1
20.0
-
-
-
-
-
-
5
1.5
100.0
-
-
-
-
-
-
2
1.6
40.0
-
-
-
3
2.8
60.0 +
Don't know
7 1.7
1 0.5
14.3
-
6 2.8
85.7
+
1 20.0
14.3
- -
-
2 2.2
28.6
- -
-
2 2.2
28.6
2 3.6
28.6
2 3.3
28.6
4 1.2
57.1
-
1 10.0
14.3
- -
-
3 2.4
42.9
2 1.6
28.6
2 1.9
28.6
Not applicable
3
0.7
1
0.5 33.3
2
0.9 66.7
-
- -
1
2.7 33.3
-
- -
2
1.6 66.7
-
- -
-
- -
-
- -
3
0.9 100.0
-
- -
-
- -
-
- -
-
- -
3
2.8 100.0
+++

Table 9.7: Managing the Shire/City Importance of Service
Staff Management
Total
Gender Age Group Home ownership Location
Male
Fe-
male
18-24
yrs
25-34
yrs
35-44
yrs
45-54
yrs
55-64
yrs
65 yrs
and
over
Rent
ing
Own
home Other Nth. Mid. Sth.
On-
line
Unweighted Base 406
100.0
191
47.0 100.0
215
53.0 100.0
5
1.2 100.0
37
9.1 100.0
93
22.9 100.0
123
30.3 100.0
93
22.9 100.0
55
13.5 100.0
61
15.0 100.0
335
82.5 100.0
10
2.5 100.0
50
12.3 100.0
125
30.8 100.0
125
30.8 100.0
106
26.1 100.0
Crucial
96
23.6
50
26.2 52.1
46
21.4 47.9
1
20.0 1.0
7
18.9 7.3
27
29.0 28.1
28
22.8 29.2
24
25.8 25.0
9
16.4 9.4
11
18.0 11.5
84
25.1 87.5
1
10.0 1.0
8
16.0 8.3
26
20.8 27.1
36
28.8 37.5
26
24.5 27.1
Important
207
51.0
94
49.2
45.4
113
52.6
54.6
1
20.0
0.5
19
51.4
9.2
40
43.0
19.3 -
72
58.5
34.8 ++
46
49.5
22.2
29
52.7
14.0
33
54.1
15.9
170
50.7
82.1
4
40.0
1.9
35
70.0
16.9 +++
65
52.0
31.4
58
46.4
28.0
49
46.2
23.7
Nice to have
79 19.5
35 18.3
44.3
44 20.5
55.7
3 60.0
3.8
7 18.9
8.9
22 23.7
27.8
17 13.8
21.5
-
15 16.1
19.0
15 27.3
19.0
14 23.0
17.7
60 17.9
75.9
-
5 50.0
6.3
7 14.0
8.9
26 20.8
32.9
27 21.6
34.2
19 17.9
24.1
Unimportant
12
3.0
7
3.7 58.3
5
2.3 41.7
-
- -
3
8.1 25.0
+
2
2.2 16.7
3
2.4 25.0
3
3.2 25.0
1
1.8 8.3
2
3.3 16.7
10
3.0 83.3
-
- -
-
- -
3
2.4 25.0
4
3.2 33.3
5
4.7 41.7
Quite unimportant
2
0.5
2
1.0
100.0
-
-
-
-
-
-
-
-
-
1
1.1
50.0
-
-
-
1
1.1
50.0
-
-
-
-
-
-
2
0.6
100.0
-
-
-
-
-
-
1
0.8
50.0
-
-
-
1
0.9
50.0
Don't know
8 2.0
2 1.0
25.0
6 2.8
75.0
- -
-
- -
-
1 1.1
12.5
2 1.6
25.0
4 4.3
50.0
+
1 1.8
12.5
1 1.6
12.5
7 2.1
87.5
- -
-
- -
-
4 3.2
50.0
- -
-
4 3.8
50.0
Not applicable
2
0.5
1
0.5 50.0
1
0.5 50.0
-
- -
1
2.7 50.0
++
-
- -
1
0.8 50.0
-
- -
-
- -
-
- -
2
0.6 100.0
-
- -
-
- -
-
- -
-
- -
2
1.9 100.0
++

Table 10.1: Customer Services and Communication Importance of Services
Customer Service
Total
Gender Age Group Home ownership Location
Male
Fe-
male
18-24
yrs
25-34
yrs
35-44
yrs
45-54
yrs
55-64
yrs
65 yrs
and
over
Rent
ing
Own
home Other Nth. Mid. Sth.
On-
line
Unweighted Base 406
100.0
191
47.0 100.0
215
53.0 100.0
5
1.2 100.0
37
9.1 100.0
93
22.9 100.0
123
30.3 100.0
93
22.9 100.0
55
13.5 100.0
61
15.0 100.0
335
82.5 100.0
10
2.5 100.0
50
12.3 100.0
125
30.8 100.0
125
30.8 100.0
106
26.1 100.0
Crucial
147
36.2
65
34.0 44.2
82
38.1 55.8
1
20.0 0.7
17
45.9 11.6
32
34.4 21.8
38
30.9 25.9
43
46.2 29.3
++
16
29.1 10.9
18
29.5 12.2
127
37.9 86.4
2
20.0 1.4
11
22.0 7.5
--
37
29.6 25.2
-
63
50.4 42.9
+++
36
34.0 24.5
Important
203
50.0
98
51.3
48.3
105
48.8
51.7
3
60.0
1.5
16
43.2
7.9
46
49.5
22.7
67
54.5
33.0
40
43.0
19.7
31
56.4
15.3
35
57.4
17.2
163
48.7
80.3
5
50.0
2.5
36
72.0
17.7 +++
74
59.2
36.5 ++
45
36.0
22.2 ---
48
45.3
23.6
Nice to have
47 11.6
21 11.0
44.7
26 12.1
55.3
- -
-
3 8.1
6.4
11 11.8
23.4
16 13.0
34.0
9 9.7
19.1
8 14.5
17.0
7 11.5
14.9
37 11.0
78.7
3 30.0
6.4
3 6.0
6.4
11 8.8
23.4
15 12.0
31.9
18 17.0
38.3
++
Unimportant
7
1.7
6
3.1 85.7
++
1
0.5 14.3
--
1
20.0 14.3
-
- -
3
3.2 42.9
2
1.6 28.6
1
1.1 14.3
-
- -
1
1.6 14.3
6
1.8 85.7
-
- -
-
- -
2
1.6 28.6
2
1.6 28.6
3
2.8 42.9
Don't know
1
0.2
1
0.5
100.0
-
-
-
-
-
-
-
-
-
1
1.1
100.0 +
-
-
-
-
-
-
-
-
-
-
-
-
1
0.3
100.0
-
-
-
-
-
-
1
0.8
100.0
-
-
-
-
-
-
Not applicable
1 0.2
- -
-
1 0.5
100.0
- -
-
1 2.7
100.0
+++
- -
-
- -
-
- -
-
- -
-
- -
-
1 0.3
100.0
- -
-
- -
-
- -
-
- -
-
1 0.9
100.0
+

Table 10.2: Customer Services and Communication Importance of Services
Information Services
Total
Gender Age Group Home ownership Location
Male
Fe-
male
18-24
yrs
25-34
yrs
35-44
yrs
45-54
yrs
55-64
yrs
65 yrs
and
over
Rent
ing
Own
home Other Nth. Mid. Sth.
On-
line
Unweighted Base 406
100.0
191
47.0 100.0
215
53.0 100.0
5
1.2 100.0
37
9.1 100.0
93
22.9 100.0
123
30.3 100.0
93
22.9 100.0
55
13.5 100.0
61
15.0 100.0
335
82.5 100.0
10
2.5 100.0
50
12.3 100.0
125
30.8 100.0
125
30.8 100.0
106
26.1 100.0
Crucial
115
28.3
49
25.7 42.6
66
30.7 57.4
2
40.0 1.7
15
40.5 13.0
+
28
30.1 24.3
32
26.0 27.8
27
29.0 23.5
11
20.0 9.6
16
26.2 13.9
98
29.3 85.2
1
10.0 0.9
18
36.0 15.7
25
20.0 21.7
--
42
33.6 36.5
30
28.3 26.1
Important
224
55.2
106
55.5
47.3
118
54.9
52.7
1
20.0
0.4
17
45.9
7.6
51
54.8
22.8
74
60.2
33.0
51
54.8
22.8
30
54.5
13.4
35
57.4
15.6
181
54.0
80.8
8
80.0
3.6
28
56.0
12.5
80
64.0
35.7 ++
64
51.2
28.6
52
49.1
23.2
Nice to have
59 14.5
31 16.2
52.5
28 13.0
47.5
1 20.0
1.7
5 13.5
8.5
12 12.9
20.3
16 13.0
27.1
12 12.9
20.3
13 23.6
22.0
++
8 13.1
13.6
50 14.9
84.7
1 10.0
1.7
4 8.0
6.8
18 14.4
30.5
18 14.4
30.5
19 17.9
32.2
Unimportant
6
1.5
3
1.6 50.0
3
1.4 50.0
1
20.0 16.7
-
- -
2
2.2 33.3
-
- -
2
2.2 33.3
1
1.8 16.7
2
3.3 33.3
4
1.2 66.7
-
- -
-
- -
2
1.6 33.3
1
0.8 16.7
3
2.8 50.0
Quite unimportant
1
0.2
1
0.5
100.0
-
-
-
-
-
-
-
-
-
-
-
-
1
0.8
100.0
-
-
-
-
-
-
-
-
-
1
0.3
100.0
-
-
-
-
-
-
-
-
-
-
-
-
1
0.9
100.0 +
Don't know
1 0.2
1 0.5
100.0
- -
-
- -
-
- -
-
- -
-
- -
-
1 1.1
100.0
+
- -
-
- -
-
1 0.3
100.0
- -
-
- -
-
- -
-
- -
-
1 0.9
100.0
+

Table 10.3: Customer Services and Communication Importance of Services
Informing the Community
Total
Gender Age Group Home ownership Location
Male
Fe-
male
18-24
yrs
25-34
yrs
35-44
yrs
45-54
yrs
55-64
yrs
65 yrs
and
over
Rent
ing
Own
home Other Nth. Mid. Sth.
On-
line
Unweighted Base 406
100.0
191
47.0 100.0
215
53.0 100.0
5
1.2 100.0
37
9.1 100.0
93
22.9 100.0
123
30.3 100.0
93
22.9 100.0
55
13.5 100.0
61
15.0 100.0
335
82.5 100.0
10
2.5 100.0
50
12.3 100.0
125
30.8 100.0
125
30.8 100.0
106
26.1 100.0
Crucial
173
42.6
78
40.8 45.1
95
44.2 54.9
2
40.0 1.2
20
54.1 11.6
44
47.3 25.4
46
37.4 26.6
44
47.3 25.4
17
30.9 9.8
-
23
37.7 13.3
146
43.6 84.4
4
40.0 2.3
18
36.0 10.4
34
27.2 19.7
---
66
52.8 38.2
+++
55
51.9 31.8
++
Important
181
44.6
85
44.5
47.0
96
44.7
53.0
2
40.0
1.1
14
37.8
7.7
37
39.8
20.4
62
50.4
34.3
39
41.9
21.5
27
49.1
14.9
30
49.2
16.6
148
44.2
81.8
3
30.0
1.7
30
60.0
16.6 ++
72
57.6
39.8 +++
49
39.2
27.1
30
28.3
16.6 ---
Nice to have
45 11.1
24 12.6
53.3
21 9.8
46.7
- -
-
2 5.4
4.4
9 9.7
20.0
14 11.4
31.1
10 10.8
22.2
10 18.2
22.2
+
7 11.5
15.6
36 10.7
80.0
2 20.0
4.4
2 4.0
4.4
-
17 13.6
37.8
10 8.0
22.2
16 15.1
35.6
Unimportant
5
1.2
3
1.6 60.0
2
0.9 40.0
1
20.0 20.0
-
- -
3
3.2 60.0
++
-
- -
-
- -
1
1.8 20.0
1
1.6 20.0
3
0.9 60.0
1
10.0 20.0
-
- -
2
1.6 40.0
-
- -
3
2.8 60.0
+
Quite unimportant
1
0.2
1
0.5
100.0
-
-
-
-
-
-
-
-
-
-
-
-
1
0.8
100.0
-
-
-
-
-
-
-
-
-
1
0.3
100.0
-
-
-
-
-
-
-
-
-
-
-
-
1
0.9
100.0 +
Not applicable
1 0.2
- -
-
1 0.5
100.0
- -
-
1 2.7
100.0
+++
- -
-
- -
-
- -
-
- -
-
- -
-
1 0.3
100.0
- -
-
- -
-
- -
-
- -
-
1 0.9
100.0
+

Table 10.4: Customer Services and Communication Importance of Services
Consulting the Community
Total
Gender Age Group Home ownership Location
Male
Fe-
male
18-24
yrs
25-34
yrs
35-44
yrs
45-54
yrs
55-64
yrs
65 yrs
and
over
Rent
ing
Own
home Other Nth. Mid. Sth.
On-
line
Unweighted Base 406
100.0
191
47.0 100.0
215
53.0 100.0
5
1.2 100.0
37
9.1 100.0
93
22.9 100.0
123
30.3 100.0
93
22.9 100.0
55
13.5 100.0
61
15.0 100.0
335
82.5 100.0
10
2.5 100.0
50
12.3 100.0
125
30.8 100.0
125
30.8 100.0
106
26.1 100.0
Crucial
212
52.2
99
51.8 46.7
113
52.6 53.3
3
60.0 1.4
22
59.5 10.4
52
55.9 24.5
63
51.2 29.7
50
53.8 23.6
22
40.0 10.4
-
29
47.5 13.7
178
53.1 84.0
5
50.0 2.4
23
46.0 10.8
45
36.0 21.2
---
76
60.8 35.8
++
68
64.2 32.1
+++
Important
156
38.4
71
37.2
45.5
85
39.5
54.5
1
20.0
0.6
12
32.4
7.7
33
35.5
21.2
49
39.8
31.4
37
39.8
23.7
24
43.6
15.4
25
41.0
16.0
129
38.5
82.7
2
20.0
1.3
24
48.0
15.4
63
50.4
40.4 +++
44
35.2
28.2
25
23.6
16.0 ---
Nice to have
29 7.1
15 7.9
51.7
14 6.5
48.3
- -
-
2 5.4
6.9
7 7.5
24.1
9 7.3
31.0
5 5.4
17.2
6 10.9
20.7
6 9.8
20.7
20 6.0
69.0
--
3 30.0
10.3
3 6.0
10.3
14 11.2
48.3
++
3 2.4
10.3
--
9 8.5
31.0
Unimportant
5
1.2
4
2.1 80.0
1
0.5 20.0
1
20.0 20.0
-
- -
1
1.1 20.0
1
0.8 20.0
-
- -
2
3.6 40.0
+
1
1.6 20.0
4
1.2 80.0
-
- -
-
- -
2
1.6 40.0
1
0.8 20.0
2
1.9 40.0
Quite unimportant
1
0.2
1
0.5
100.0
-
-
-
-
-
-
-
-
-
-
-
-
1
0.8
100.0
-
-
-
-
-
-
-
-
-
1
0.3
100.0
-
-
-
-
-
-
-
-
-
-
-
-
1
0.9
100.0 +
Don't know
2 0.5
1 0.5
50.0
1 0.5
50.0
- -
-
- -
-
- -
-
- -
-
1 1.1
50.0
1 1.8
50.0
- -
-
2 0.6
100.0
- -
-
- -
-
1 0.8
50.0
1 0.8
50.0
- -
-
Not applicable
1
0.2
-
- -
1
0.5 100.0
-
- -
1
2.7 100.0
+++
-
- -
-
- -
-
- -
-
- -
-
- -
1
0.3 100.0
-
- -
-
- -
-
- -
-
- -
1
0.9 100.0
+

Table 10.5: Customer Services and Communication Importance of Services
Responding to the Community
Total
Gender Age Group Home ownership Location
Male
Fe-
male
18-24
yrs
25-34
yrs
35-44
yrs
45-54
yrs
55-64
yrs
65 yrs
and
over
Rent
ing
Own
home Other Nth. Mid. Sth.
On-
line
Unweighted Base 406
100.0
191
47.0 100.0
215
53.0 100.0
5
1.2 100.0
37
9.1 100.0
93
22.9 100.0
123
30.3 100.0
93
22.9 100.0
55
13.5 100.0
61
15.0 100.0
335
82.5 100.0
10
2.5 100.0
50
12.3 100.0
125
30.8 100.0
125
30.8 100.0
106
26.1 100.0
Crucial
217
53.4
101
52.9 46.5
116
54.0 53.5
3
60.0 1.4
24
64.9 11.1
49
52.7 22.6
65
52.8 30.0
52
55.9 24.0
24
43.6 11.1
32
52.5 14.7
181
54.0 83.4
4
40.0 1.8
22
44.0 10.1
46
36.8 21.2
---
80
64.0 36.9
+++
69
65.1 31.8
+++
Important
153
37.7
72
37.7
47.1
81
37.7
52.9
1
20.0
0.7
13
35.1
8.5
34
36.6
22.2
49
39.8
32.0
35
37.6
22.9
21
38.2
13.7
23
37.7
15.0
126
37.6
82.4
4
40.0
2.6
25
50.0
16.3 +
60
48.0
39.2 +++
40
32.0
26.1
28
26.4
18.3 ---
Nice to have
28 6.9
13 6.8
46.4
15 7.0
53.6
- -
-
- -
-
8 8.6
28.6
7 5.7
25.0
6 6.5
21.4
7 12.7
25.0
+
4 6.6
14.3
23 6.9
82.1
1 10.0
3.6
3 6.0
10.7
15 12.0
53.6
+++
3 2.4
10.7
--
7 6.6
25.0
Unimportant
5
1.2
3
1.6 60.0
2
0.9 40.0
1
20.0 20.0
-
- -
2
2.2 40.0
1
0.8 20.0
-
- -
1
1.8 20.0
2
3.3 40.0
2
0.6 40.0
--
1
10.0 20.0
-
- -
4
3.2 80.0
++
-
- -
1
0.9 20.0
Quite unimportant
1
0.2
1
0.5
100.0
-
-
-
-
-
-
-
-
-
-
-
-
1
0.8
100.0
-
-
-
-
-
-
-
-
-
1
0.3
100.0
-
-
-
-
-
-
-
-
-
-
-
-
1
0.9
100.0 +
Don't know
2 0.5
1 0.5
50.0
1 0.5
50.0
- -
-
- -
-
- -
-
- -
-
- -
-
2 3.6
100.0
+++
- -
-
2 0.6
100.0
- -
-
- -
-
- -
-
2 1.6
100.0
++
- -
-

Table 10.6: Customer Services and Communication Importance of Services
Providing Leadership & Advocacy
Total
Gender Age Group Home ownership Location
Male
Fe-
male
18-24
yrs
25-34
yrs
35-44
yrs
45-54
yrs
55-64
yrs
65 yrs
and
over
Rent
ing
Own
home Other Nth. Mid. Sth.
On-
line
Unweighted Base 406
100.0
191
47.0 100.0
215
53.0 100.0
5
1.2 100.0
37
9.1 100.0
93
22.9 100.0
123
30.3 100.0
93
22.9 100.0
55
13.5 100.0
61
15.0 100.0
335
82.5 100.0
10
2.5 100.0
50
12.3 100.0
125
30.8 100.0
125
30.8 100.0
106
26.1 100.0
Crucial
144
35.5
65
34.0 45.1
79
36.7 54.9
3
60.0 2.1
15
40.5 10.4
34
36.6 23.6
47
38.2 32.6
34
36.6 23.6
11
20.0 7.6
--
18
29.5 12.5
121
36.1 84.0
5
50.0 3.5
18
36.0 12.5
32
25.6 22.2
---
44
35.2 30.6
50
47.2 34.7
+++
Important
186
45.8
85
44.5
45.7
101
47.0
54.3
1
20.0
0.5
16
43.2
8.6
40
43.0
21.5
55
44.7
29.6
42
45.2
22.6
32
58.2
17.2 ++
26
42.6
14.0
158
47.2
84.9
2
20.0
1.1
29
58.0
15.6 +
70
56.0
37.6 +++
50
40.0
26.9
37
34.9
19.9 ---
Nice to have
55 13.5
25 13.1
45.5
30 14.0
54.5
- -
-
5 13.5
9.1
11 11.8
20.0
15 12.2
27.3
15 16.1
27.3
9 16.4
16.4
9 14.8
16.4
44 13.1
80.0
2 20.0
3.6
2 4.0
3.6
--
19 15.2
34.5
22 17.6
40.0
12 11.3
21.8
Unimportant
9
2.2
7
3.7 77.8
+
2
0.9 22.2
-
1
20.0 11.1
-
- -
4
4.3 44.4
1
0.8 11.1
1
1.1 11.1
2
3.6 22.2
2
3.3 22.2
6
1.8 66.7
1
10.0 11.1
1
2.0 11.1
1
0.8 11.1
1
0.8 11.1
6
5.7 66.7
+++
Don't know
11
2.7
9
4.7
81.8 ++
2
0.9
18.2 --
-
-
-
-
-
-
4
4.3
36.4
5
4.1
45.5
1
1.1
9.1
1
1.8
9.1
6
9.8
54.5 +++
5
1.5
45.5 ---
-
-
-
-
-
-
3
2.4
27.3
8
6.4
72.7 +++
-
-
-
Not applicable
1 0.2
- -
-
1 0.5
100.0
- -
-
1 2.7
100.0
+++
- -
-
- -
-
- -
-
- -
-
- -
-
1 0.3
100.0
- -
-
- -
-
- -
-
- -
-
1 0.9
100.0
+

Table 11.1: Quality of Council Importance of Services
Qualities of Elected Council
Total
Gender Age Group Home ownership Location
Male
Fe-
male
18-24
yrs
25-34
yrs
35-44
yrs
45-54
yrs
55-64
yrs
65 yrs
and
over
Rent
ing
Own
home Other Nth. Mid. Sth.
On-
line
Unweighted Base 406
100.0
191
47.0 100.0
215
53.0 100.0
5
1.2 100.0
37
9.1 100.0
93
22.9 100.0
123
30.3 100.0
93
22.9 100.0
55
13.5 100.0
61
15.0 100.0
335
82.5 100.0
10
2.5 100.0
50
12.3 100.0
125
30.8 100.0
125
30.8 100.0
106
26.1 100.0
Crucial
245
60.3
116
60.7 47.3
129
60.0 52.7
4
80.0 1.6
25
67.6 10.2
57
61.3 23.3
73
59.3 29.8
58
62.4 23.7
28
50.9 11.4
30
49.2 12.2
-
212
63.3 86.5
+++
3
30.0 1.2
30
60.0 12.2
64
51.2 26.1
--
93
74.4 38.0
+++
58
54.7 23.7
Important
132
32.5
63
33.0
47.7
69
32.1
52.3
-
-
-
11
29.7
8.3
28
30.1
21.2
43
35.0
32.6
28
30.1
21.2
22
40.0
16.7
27
44.3
20.5 ++
100
29.9
75.8 --
5
50.0
3.8
20
40.0
15.2
47
37.6
35.6
28
22.4
21.2 ---
37
34.9
28.0
Nice to have
25 6.2
11 5.8
44.0
14 6.5
56.0
1 20.0
4.0
1 2.7
4.0
6 6.5
24.0
7 5.7
28.0
5 5.4
20.0
5 9.1
20.0
3 4.9
12.0
20 6.0
80.0
2 20.0
8.0
- -
-
14 11.2
56.0
+++
4 3.2
16.0
-
7 6.6
28.0
Don't know
3
0.7
-
- -
3
1.4 100.0
-
- -
-
- -
1
1.1 33.3
-
- -
2
2.2 66.7
+
-
- -
1
1.6 33.3
2
0.6 66.7
-
- -
-
- -
-
- -
-
- -
3
2.8 100.0
+++
Not applicable
1
0.2
1
0.5
100.0
-
-
-
-
-
-
-
-
-
1
1.1
100.0 +
-
-
-
-
-
-
-
-
-
-
-
-
1
0.3
100.0
-
-
-
-
-
-
-
-
-
-
-
-
1
0.9
100.0 +

Table 11.2: Quality of Council Importance of Services
Qualities of Councillor(s) Dealt with
Total
Gender Age Group Home ownership Location
Male
Fe-
male
18-24
yrs
25-34
yrs
35-44
yrs
45-54
yrs
55-64
yrs
65 yrs
and
over
Rent
ing
Own
home Other Nth. Mid. Sth.
On-
line
Unweighted Base 406
100.0
191
47.0 100.0
215
53.0 100.0
5
1.2 100.0
37
9.1 100.0
93
22.9 100.0
123
30.3 100.0
93
22.9 100.0
55
13.5 100.0
61
15.0 100.0
335
82.5 100.0
10
2.5 100.0
50
12.3 100.0
125
30.8 100.0
125
30.8 100.0
106
26.1 100.0
Crucial
195
48.0
95
49.7 48.7
100
46.5 51.3
2
40.0 1.0
16
43.2 8.2
47
50.5 24.1
60
48.8 30.8
46
49.5 23.6
24
43.6 12.3
24
39.3 12.3
171
51.0 87.7
+++
-
- -
24
48.0 12.3
55
44.0 28.2
70
56.0 35.9
++
46
43.4 23.6
Important
157
38.7
71
37.2
45.2
86
40.0
54.8
1
20.0
0.6
17
45.9
10.8
34
36.6
21.7
46
37.4
29.3
38
40.9
24.2
21
38.2
13.4
29
47.5
18.5
121
36.1
77.1 --
7
70.0
4.5
24
48.0
15.3
46
36.8
29.3
45
36.0
28.7
42
39.6
26.8
Nice to have
27 6.7
13 6.8
48.1
14 6.5
51.9
1 20.0
3.7
2 5.4
7.4
7 7.5
25.9
7 5.7
25.9
6 6.5
22.2
4 7.3
14.8
5 8.2
18.5
21 6.3
77.8
1 10.0
3.7
1 2.0
3.7
13 10.4
48.1
++
3 2.4
11.1
--
10 9.4
37.0
Unimportant
3
0.7
2
1.0 66.7
1
0.5 33.3
-
- -
1
2.7 33.3
1
1.1 33.3
-
- -
-
- -
1
1.8 33.3
-
- -
2
0.6 66.7
1
10.0 33.3
1
2.0 33.3
1
0.8 33.3
-
- -
1
0.9 33.3
Don't know
10
2.5
4
2.1
40.0
6
2.8
60.0
1
20.0
10.0
-
-
-
2
2.2
20.0
2
1.6
20.0
3
3.2
30.0
2
3.6
20.0
1
1.6
10.0
8
2.4
80.0
1
10.0
10.0
-
-
-
1
0.8
10.0
5
4.0
50.0
4
3.8
40.0
Not applicable
14 3.4
6 3.1
42.9
8 3.7
57.1
- -
-
1 2.7
7.1
2 2.2
14.3
8 6.5
57.1
++
- -
-
3 5.5
21.4
2 3.3
14.3
12 3.6
85.7
- -
-
- -
-
9 7.2
64.3
+++
2 1.6
14.3
3 2.8
21.4

Table 11.3: Quality of Council Importance of Services
Managerial/Supervisory Officers
Total
Gender Age Group Home ownership Location
Male
Fe-
male
18-24
yrs
25-34
yrs
35-44
yrs
45-54
yrs
55-64
yrs
65 yrs
and
over
Rent
ing
Own
home Other Nth. Mid. Sth.
On-
line
Unweighted Base 406
100.0
191
47.0 100.0
215
53.0 100.0
5
1.2 100.0
37
9.1 100.0
93
22.9 100.0
123
30.3 100.0
93
22.9 100.0
55
13.5 100.0
61
15.0 100.0
335
82.5 100.0
10
2.5 100.0
50
12.3 100.0
125
30.8 100.0
125
30.8 100.0
106
26.1 100.0
Crucial
154
37.9
75
39.3 48.7
79
36.7 51.3
-
- -
11
29.7 7.1
36
38.7 23.4
47
38.2 30.5
43
46.2 27.9
+
17
30.9 11.0
19
31.1 12.3
135
40.3 87.7
++
-
- -
24
48.0 15.6
43
34.4 27.9
54
43.2 35.1
33
31.1 21.4
-
Important
188
46.3
88
46.1
46.8
100
46.5
53.2
4
80.0
2.1
17
45.9
9.0
42
45.2
22.3
58
47.2
30.9
39
41.9
20.7
28
50.9
14.9
29
47.5
15.4
152
45.4
80.9
7
70.0
3.7
23
46.0
12.2
55
44.0
29.3
59
47.2
31.4
51
48.1
27.1
Nice to have
41 10.1
17 8.9
41.5
24 11.2
58.5
1 20.0
2.4
7 18.9
17.1
+
8 8.6
19.5
12 9.8
29.3
6 6.5
14.6
7 12.7
17.1
10 16.4
24.4
+
28 8.4
68.3
--
3 30.0
7.3
3 6.0
7.3
17 13.6
41.5
8 6.4
19.5
-
13 12.3
31.7
Unimportant
3
0.7
1
0.5 33.3
2
0.9 66.7
-
- -
-
- -
1
1.1 33.3
-
- -
1
1.1 33.3
1
1.8 33.3
-
- -
3
0.9 100.0
-
- -
-
- -
1
0.8 33.3
-
- -
2
1.9 66.7
Quite unimportant
1
0.2
1
0.5
100.0
-
-
-
-
-
-
-
-
-
-
-
-
1
0.8
100.0
-
-
-
-
-
-
-
-
-
1
0.3
100.0
-
-
-
-
-
-
-
-
-
-
-
-
1
0.9
100.0 +
Don't know
16 3.9
9 4.7
56.3
7 3.3
43.8
- -
-
1 2.7
6.3
5 5.4
31.3
5 4.1
31.3
4 4.3
25.0
1 1.8
6.3
3 4.9
18.8
13 3.9
81.3
- -
-
- -
-
9 7.2
56.3
++
4 3.2
25.0
3 2.8
18.8
Not applicable
3
0.7
-
- -
3
1.4 100.0
-
- -
1
2.7 33.3
1
1.1 33.3
-
- -
-
- -
1
1.8 33.3
-
- -
3
0.9 100.0
-
- -
-
- -
-
- -
-
- -
3
2.8 100.0
+++

Table 11.4: Quality of Council Importance of Services
Quality/Performance of Outdoor Workers
Total
Gender Age Group Home ownership Location
Male
Fe-
male
18-24
yrs
25-34
yrs
35-44
yrs
45-54
yrs
55-64
yrs
65 yrs
and
over
Rent
ing
Own
home Other Nth. Mid. Sth.
On-
line
Unweighted Base 406
100.0
191
47.0 100.0
215
53.0 100.0
5
1.2 100.0
37
9.1 100.0
93
22.9 100.0
123
30.3 100.0
93
22.9 100.0
55
13.5 100.0
61
15.0 100.0
335
82.5 100.0
10
2.5 100.0
50
12.3 100.0
125
30.8 100.0
125
30.8 100.0
106
26.1 100.0
Crucial
136
33.5
64
33.5 47.1
72
33.5 52.9
-
- -
13
35.1 9.6
29
31.2 21.3
46
37.4 33.8
35
37.6 25.7
13
23.6 9.6
-
16
26.2 11.8
119
35.5 87.5
+
1
10.0 0.7
21
42.0 15.4
37
29.6 27.2
50
40.0 36.8
+
28
26.4 20.6
-
Important
218
53.7
107
56.0
49.1
111
51.6
50.9
4
80.0
1.8
18
48.6
8.3
52
55.9
23.9
64
52.0
29.4
47
50.5
21.6
33
60.0
15.1
38
62.3
17.4
174
51.9
79.8
6
60.0
2.8
26
52.0
11.9
70
56.0
32.1
69
55.2
31.7
53
50.0
24.3
Nice to have
37 9.1
16 8.4
43.2
21 9.8
56.8
1 20.0
2.7
3 8.1
8.1
9 9.7
24.3
9 7.3
24.3
8 8.6
21.6
7 12.7
18.9
4 6.6
10.8
32 9.6
86.5
1 10.0
2.7
2 4.0
5.4
14 11.2
37.8
6 4.8
16.2
--
15 14.2
40.5
++
Unimportant
5
1.2
2
1.0 40.0
3
1.4 60.0
-
- -
2
5.4 40.0
++
1
1.1 20.0
1
0.8 20.0
-
- -
1
1.8 20.0
2
3.3 40.0
1
0.3 20.0
---
2
20.0 40.0
1
2.0 20.0
1
0.8 20.0
-
- -
3
2.8 60.0
+
Quite unimportant
1
0.2
-
-
-
1
0.5
100.0
-
-
-
-
-
-
-
-
-
1
0.8
100.0
-
-
-
-
-
-
-
-
-
1
0.3
100.0
-
-
-
-
-
-
-
-
-
-
-
-
1
0.9
100.0 +
Don't know
7 1.7
2 1.0
28.6
5 2.3
71.4
- -
-
- -
-
2 2.2
28.6
2 1.6
28.6
3 3.2
42.9
- -
-
1 1.6
14.3
6 1.8
85.7
- -
-
- -
-
3 2.4
42.9
- -
-
4 3.8
57.1
+
Not applicable
2
0.5
-
- -
2
0.9 100.0
-
- -
1
2.7 50.0
++
-
- -
-
- -
-
- -
1
1.8 50.0
-
- -
2
0.6 100.0
-
- -
-
- -
-
- -
-
- -
2
1.9 100.0
++

Table 11.5: Quality of Council Importance of Services
Quality/Performance of Indoor Staff
Total
Gender Age Group Home ownership Location
Male
Fe-
male
18-24
yrs
25-34
yrs
35-44
yrs
45-54
yrs
55-64
yrs
65 yrs
and
over
Rent
ing
Own
home Other Nth. Mid. Sth.
On-
line
Unweighted Base 406
100.0
191
47.0 100.0
215
53.0 100.0
5
1.2 100.0
37
9.1 100.0
93
22.9 100.0
123
30.3 100.0
93
22.9 100.0
55
13.5 100.0
61
15.0 100.0
335
82.5 100.0
10
2.5 100.0
50
12.3 100.0
125
30.8 100.0
125
30.8 100.0
106
26.1 100.0
Crucial
127
31.3
60
31.4 47.2
67
31.2 52.8
-
- -
11
29.7 8.7
26
28.0 20.5
44
35.8 34.6
33
35.5 26.0
13
23.6 10.2
16
26.2 12.6
111
33.1 87.4
+
-
- -
18
36.0 14.2
36
28.8 28.3
47
37.6 37.0
+
26
24.5 20.5
-
Important
218
53.7
100
52.4
45.9
118
54.9
54.1
2
40.0
0.9
19
51.4
8.7
49
52.7
22.5
67
54.5
30.7
51
54.8
23.4
30
54.5
13.8
37
60.7
17.0
175
52.2
80.3
6
60.0
2.8
27
54.0
12.4
68
54.4
31.2
65
52.0
29.8
58
54.7
26.6
Nice to have
44 10.8
26 13.6
59.1
+
18 8.4
40.9
-
2 40.0
4.5
4 10.8
9.1
15 16.1
34.1
+
8 6.5
18.2
-
6 6.5
13.6
9 16.4
20.5
5 8.2
11.4
36 10.7
81.8
3 30.0
6.8
3 6.0
6.8
17 13.6
38.6
12 9.6
27.3
12 11.3
27.3
Unimportant
6
1.5
2
1.0 33.3
4
1.9 66.7
1
20.0 16.7
2
5.4 33.3
++
1
1.1 16.7
1
0.8 16.7
-
- -
1
1.8 16.7
2
3.3 33.3
3
0.9 50.0
--
1
10.0 16.7
2
4.0 33.3
-
- -
1
0.8 16.7
3
2.8 50.0
Quite unimportant
2
0.5
1
0.5
50.0
1
0.5
50.0
-
-
-
-
-
-
-
-
-
1
0.8
50.0
-
-
-
1
1.8
50.0
-
-
-
2
0.6
100.0
-
-
-
-
-
-
1
0.8
50.0
-
-
-
1
0.9
50.0
Don't know
7 1.7
2 1.0
28.6
5 2.3
71.4
- -
-
- -
-
2 2.2
28.6
2 1.6
28.6
3 3.2
42.9
- -
-
1 1.6
14.3
6 1.8
85.7
- -
-
- -
-
3 2.4
42.9
- -
-
4 3.8
57.1
+
Not applicable
2
0.5
-
- -
2
0.9 100.0
-
- -
1
2.7 50.0
++
-
- -
-
- -
-
- -
1
1.8 50.0
-
- -
2
0.6 100.0
-
- -
-
- -
-
- -
-
- -
2
1.9 100.0
++
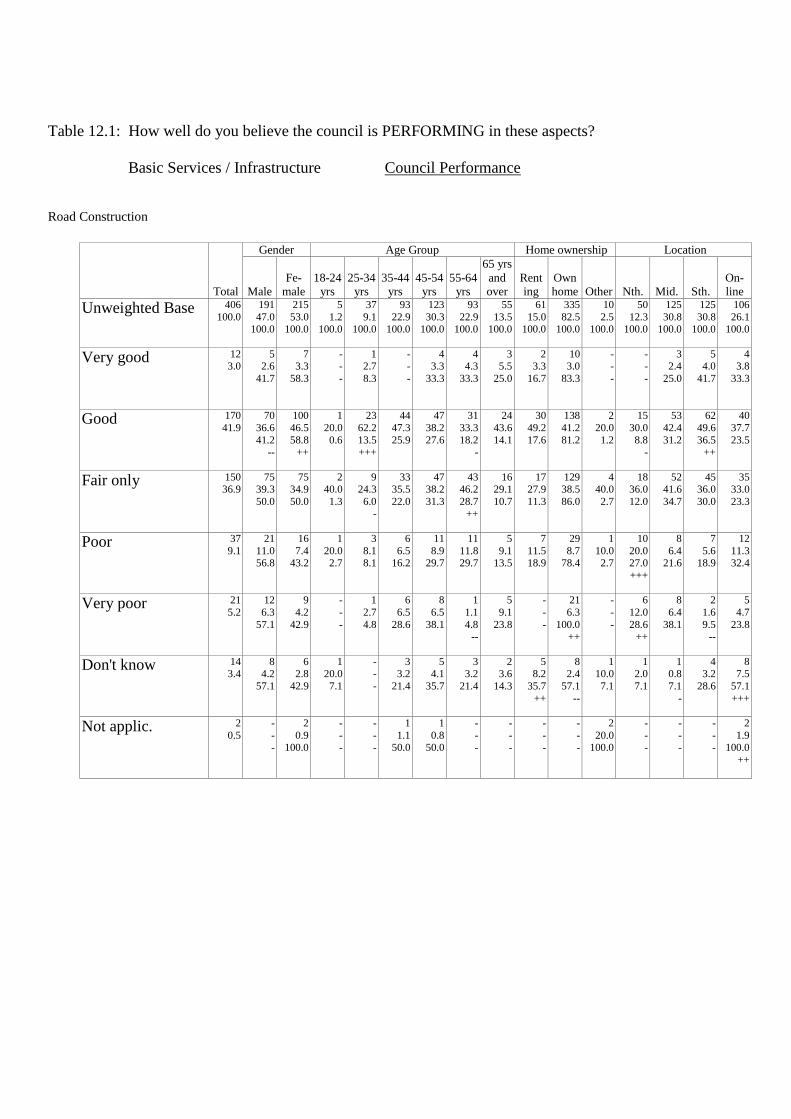
Table 12.1: How well do you believe the council is PERFORMING in these aspects?
Basic Services / Infrastructure Council Performance
Road Construction
Total
Gender Age Group Home ownership Location
Male
Fe-
male
18-24
yrs
25-34
yrs
35-44
yrs
45-54
yrs
55-64
yrs
65 yrs
and
over
Rent
ing
Own
home Other Nth. Mid. Sth.
On-
line
Unweighted Base 406
100.0
191
47.0 100.0
215
53.0 100.0
5
1.2 100.0
37
9.1 100.0
93
22.9 100.0
123
30.3 100.0
93
22.9 100.0
55
13.5 100.0
61
15.0 100.0
335
82.5 100.0
10
2.5 100.0
50
12.3 100.0
125
30.8 100.0
125
30.8 100.0
106
26.1 100.0
Very good
12 3.0
5 2.6
41.7
7 3.3
58.3
- -
-
1 2.7
8.3
- -
-
4 3.3
33.3
4 4.3
33.3
3 5.5
25.0
2 3.3
16.7
10 3.0
83.3
- -
-
- -
-
3 2.4
25.0
5 4.0
41.7
4 3.8
33.3
Good
170
41.9
70
36.6
41.2 --
100
46.5
58.8 ++
1
20.0
0.6
23
62.2
13.5 +++
44
47.3
25.9
47
38.2
27.6
31
33.3
18.2 -
24
43.6
14.1
30
49.2
17.6
138
41.2
81.2
2
20.0
1.2
15
30.0
8.8 -
53
42.4
31.2
62
49.6
36.5 ++
40
37.7
23.5
Fair only
150 36.9
75 39.3
50.0
75 34.9
50.0
2 40.0
1.3
9 24.3
6.0
-
33 35.5
22.0
47 38.2
31.3
43 46.2
28.7
++
16 29.1
10.7
17 27.9
11.3
129 38.5
86.0
4 40.0
2.7
18 36.0
12.0
52 41.6
34.7
45 36.0
30.0
35 33.0
23.3
Poor
37
9.1
21
11.0 56.8
16
7.4 43.2
1
20.0 2.7
3
8.1 8.1
6
6.5 16.2
11
8.9 29.7
11
11.8 29.7
5
9.1 13.5
7
11.5 18.9
29
8.7 78.4
1
10.0 2.7
10
20.0 27.0
+++
8
6.4 21.6
7
5.6 18.9
12
11.3 32.4
Very poor
21
5.2
12
6.3
57.1
9
4.2
42.9
-
-
-
1
2.7
4.8
6
6.5
28.6
8
6.5
38.1
1
1.1
4.8 --
5
9.1
23.8
-
-
-
21
6.3
100.0 ++
-
-
-
6
12.0
28.6 ++
8
6.4
38.1
2
1.6
9.5 --
5
4.7
23.8
Don't know
14 3.4
8 4.2
57.1
6 2.8
42.9
1 20.0
7.1
- -
-
3 3.2
21.4
5 4.1
35.7
3 3.2
21.4
2 3.6
14.3
5 8.2
35.7
++
8 2.4
57.1
--
1 10.0
7.1
1 2.0
7.1
1 0.8
7.1
-
4 3.2
28.6
8 7.5
57.1
+++
Not applic.
2
0.5
-
- -
2
0.9 100.0
-
- -
-
- -
1
1.1 50.0
1
0.8 50.0
-
- -
-
- -
-
- -
-
- -
2
20.0 100.0
-
- -
-
- -
-
- -
2
1.9 100.0
++

Table 12.2: How well do you believe the council is PERFORMING in these aspects?
Basic Services / Infrastructure Council Performance
Road Maintenance
Total
Gender Age Group Home ownership Location
Male
Fe-
male
18-24
yrs
25-34
yrs
35-44
yrs
45-54
yrs
55-64
yrs
65 yrs
and
over
Rent
ing
Own
home Other Nth. Mid. Sth.
On-
line
Unweighted Base 406
100.0
191
47.0 100.0
215
53.0 100.0
5
1.2 100.0
37
9.1 100.0
93
22.9 100.0
123
30.3 100.0
93
22.9 100.0
55
13.5 100.0
61
15.0 100.0
335
82.5 100.0
10
2.5 100.0
50
12.3 100.0
125
30.8 100.0
125
30.8 100.0
106
26.1 100.0
Very good
19 4.7
9 4.7
47.4
10 4.7
52.6
- -
-
1 2.7
5.3
4 4.3
21.1
5 4.1
26.3
3 3.2
15.8
6 10.9
31.6
++
3 4.9
15.8
15 4.5
78.9
1 10.0
5.3
1 2.0
5.3
5 4.0
26.3
7 5.6
36.8
6 5.7
31.6
Good
157
38.7
66
34.6
42.0
91
42.3
58.0
2
40.0
1.3
15
40.5
9.6
44
47.3
28.0 +
43
35.0
27.4
34
36.6
21.7
19
34.5
12.1
25
41.0
15.9
128
38.2
81.5
4
40.0
2.5
12
24.0
7.6 --
54
43.2
34.4
52
41.6
33.1
39
36.8
24.8
Fair only
137 33.7
66 34.6
48.2
71 33.0
51.8
2 40.0
1.5
12 32.4
8.8
29 31.2
21.2
40 32.5
29.2
35 37.6
25.5
19 34.5
13.9
19 31.1
13.9
116 34.6
84.7
2 20.0
1.5
11 22.0
8.0
-
49 39.2
35.8
42 33.6
30.7
35 33.0
25.5
Poor
58
14.3
33
17.3 56.9
25
11.6 43.1
1
20.0 1.7
6
16.2 10.3
9
9.7 15.5
21
17.1 36.2
16
17.2 27.6
5
9.1 8.6
8
13.1 13.8
49
14.6 84.5
1
10.0 1.7
15
30.0 25.9
+++
10
8.0 17.2
--
18
14.4 31.0
15
14.2 25.9
Very poor
33
8.1
16
8.4
48.5
17
7.9
51.5
-
-
-
3
8.1
9.1
7
7.5
21.2
13
10.6
39.4
4
4.3
12.1
6
10.9
18.2
6
9.8
18.2
25
7.5
75.8
2
20.0
6.1
10
20.0
30.3 +++
7
5.6
21.2
6
4.8
18.2
10
9.4
30.3
Don't know
1 0.2
- -
-
1 0.5
100.0
- -
-
- -
-
- -
-
1 0.8
100.0
- -
-
- -
-
- -
-
1 0.3
100.0
- -
-
- -
-
- -
-
- -
-
1 0.9
100.0
+
Not applic.
1
0.2
1
0.5 100.0
-
- -
-
- -
-
- -
-
- -
-
- -
1
1.1 100.0
+
-
- -
-
- -
1
0.3 100.0
-
- -
1
2.0 100.0
+++
-
- -
-
- -
-
- -

Table 12.3: How well do you believe the council is PERFORMING in these aspects?
Basic Services / Infrastructure Council Performance
Footpaths, Kerbing and Guttering
Total
Gender Age Group Home ownership Location
Male
Fe-
male
18-24
yrs
25-34
yrs
35-44
yrs
45-54
yrs
55-64
yrs
65 yrs
and
over
Rent
ing
Own
home Other Nth. Mid. Sth.
On-
line
Unweighted Base 406
100.0
191
47.0 100.0
215
53.0 100.0
5
1.2 100.0
37
9.1 100.0
93
22.9 100.0
123
30.3 100.0
93
22.9 100.0
55
13.5 100.0
61
15.0 100.0
335
82.5 100.0
10
2.5 100.0
50
12.3 100.0
125
30.8 100.0
125
30.8 100.0
106
26.1 100.0
Very good
15 3.7
6 3.1
40.0
9 4.2
60.0
- -
-
- -
-
4 4.3
26.7
4 3.3
26.7
4 4.3
26.7
3 5.5
20.0
3 4.9
20.0
11 3.3
73.3
1 10.0
6.7
1 2.0
6.7
3 2.4
20.0
6 4.8
40.0
5 4.7
33.3
Good
147
36.2
64
33.5
43.5
83
38.6
56.5
3
60.0
2.0
18
48.6
12.2 +
33
35.5
22.4
46
37.4
31.3
30
32.3
20.4
17
30.9
11.6
18
29.5
12.2
127
37.9
86.4
2
20.0
1.4
8
16.0
5.4 ---
55
44.0
37.4 ++
60
48.0
40.8 +++
24
22.6
16.3 ---
Fair only
121 29.8
58 30.4
47.9
63 29.3
52.1
1 20.0
0.8
9 24.3
7.4
31 33.3
25.6
35 28.5
28.9
28 30.1
23.1
17 30.9
14.0
21 34.4
17.4
98 29.3
81.0
2 20.0
1.7
5 10.0
4.1
---
53 42.4
43.8
+++
30 24.0
24.8
-
33 31.1
27.3
Poor
58
14.3
29
15.2 50.0
29
13.5 50.0
1
20.0 1.7
6
16.2 10.3
10
10.8 17.2
15
12.2 25.9
18
19.4 31.0
8
14.5 13.8
7
11.5 12.1
48
14.3 82.8
3
30.0 5.2
6
12.0 10.3
10
8.0 17.2
--
21
16.8 36.2
21
19.8 36.2
+
Very poor
16
3.9
10
5.2
62.5
6
2.8
37.5
-
-
-
3
8.1
18.8
5
5.4
31.3
6
4.9
37.5
2
2.2
12.5
-
-
-
4
6.6
25.0
12
3.6
75.0
-
-
-
1
2.0
6.3
3
2.4
18.8
6
4.8
37.5
6
5.7
37.5
Don't know
12 3.0
4 2.1
33.3
8 3.7
66.7
- -
-
1 2.7
8.3
5 5.4
41.7
2 1.6
16.7
3 3.2
25.0
1 1.8
8.3
1 1.6
8.3
9 2.7
75.0
2 20.0
16.7
2 4.0
16.7
- -
-
- -
-
10 9.4
83.3
+++
Not applic.
37
9.1
20
10.5 54.1
17
7.9 45.9
-
- -
-
- -
5
5.4 13.5
15
12.2 40.5
8
8.6 21.6
9
16.4 24.3
++
7
11.5 18.9
30
9.0 81.1
-
- -
27
54.0 73.0
+++
1
0.8 2.7
---
2
1.6 5.4
---
7
6.6 18.9
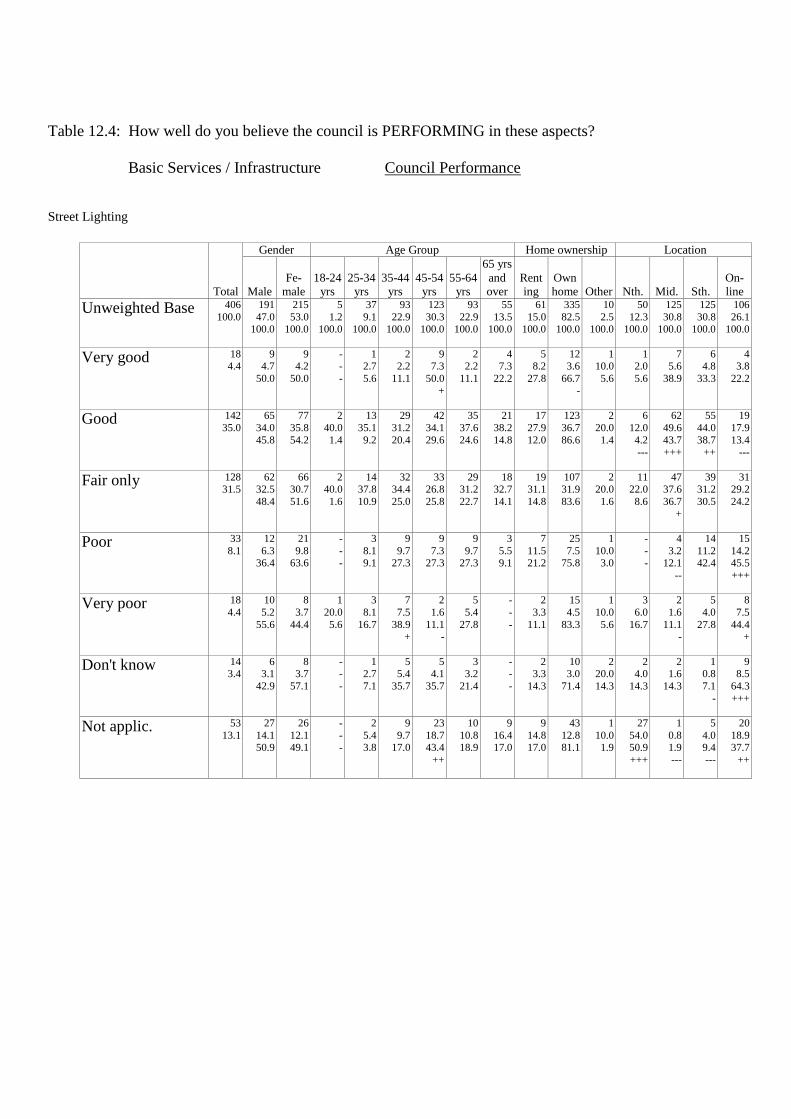
Table 12.4: How well do you believe the council is PERFORMING in these aspects?
Basic Services / Infrastructure Council Performance
Street Lighting
Total
Gender Age Group Home ownership Location
Male
Fe-
male
18-24
yrs
25-34
yrs
35-44
yrs
45-54
yrs
55-64
yrs
65 yrs
and
over
Rent
ing
Own
home Other Nth. Mid. Sth.
On-
line
Unweighted Base 406
100.0
191
47.0 100.0
215
53.0 100.0
5
1.2 100.0
37
9.1 100.0
93
22.9 100.0
123
30.3 100.0
93
22.9 100.0
55
13.5 100.0
61
15.0 100.0
335
82.5 100.0
10
2.5 100.0
50
12.3 100.0
125
30.8 100.0
125
30.8 100.0
106
26.1 100.0
Very good
18 4.4
9 4.7
50.0
9 4.2
50.0
- -
-
1 2.7
5.6
2 2.2
11.1
9 7.3
50.0
+
2 2.2
11.1
4 7.3
22.2
5 8.2
27.8
12 3.6
66.7
-
1 10.0
5.6
1 2.0
5.6
7 5.6
38.9
6 4.8
33.3
4 3.8
22.2
Good
142
35.0
65
34.0
45.8
77
35.8
54.2
2
40.0
1.4
13
35.1
9.2
29
31.2
20.4
42
34.1
29.6
35
37.6
24.6
21
38.2
14.8
17
27.9
12.0
123
36.7
86.6
2
20.0
1.4
6
12.0
4.2 ---
62
49.6
43.7 +++
55
44.0
38.7 ++
19
17.9
13.4 ---
Fair only
128 31.5
62 32.5
48.4
66 30.7
51.6
2 40.0
1.6
14 37.8
10.9
32 34.4
25.0
33 26.8
25.8
29 31.2
22.7
18 32.7
14.1
19 31.1
14.8
107 31.9
83.6
2 20.0
1.6
11 22.0
8.6
47 37.6
36.7
+
39 31.2
30.5
31 29.2
24.2
Poor
33
8.1
12
6.3 36.4
21
9.8 63.6
-
- -
3
8.1 9.1
9
9.7 27.3
9
7.3 27.3
9
9.7 27.3
3
5.5 9.1
7
11.5 21.2
25
7.5 75.8
1
10.0 3.0
-
- -
4
3.2 12.1
--
14
11.2 42.4
15
14.2 45.5
+++
Very poor
18
4.4
10
5.2
55.6
8
3.7
44.4
1
20.0
5.6
3
8.1
16.7
7
7.5
38.9 +
2
1.6
11.1 -
5
5.4
27.8
-
-
-
2
3.3
11.1
15
4.5
83.3
1
10.0
5.6
3
6.0
16.7
2
1.6
11.1 -
5
4.0
27.8
8
7.5
44.4 +
Don't know
14 3.4
6 3.1
42.9
8 3.7
57.1
- -
-
1 2.7
7.1
5 5.4
35.7
5 4.1
35.7
3 3.2
21.4
- -
-
2 3.3
14.3
10 3.0
71.4
2 20.0
14.3
2 4.0
14.3
2 1.6
14.3
1 0.8
7.1
-
9 8.5
64.3
+++
Not applic.
53
13.1
27
14.1 50.9
26
12.1 49.1
-
- -
2
5.4 3.8
9
9.7 17.0
23
18.7 43.4
++
10
10.8 18.9
9
16.4 17.0
9
14.8 17.0
43
12.8 81.1
1
10.0 1.9
27
54.0 50.9
+++
1
0.8 1.9
---
5
4.0 9.4
---
20
18.9 37.7
++

Table 12.5: How well do you believe the council is PERFORMING in these aspects?
Basic Services / Infrastructure Council Performance
Traffic Management
Total
Gender Age Group Home ownership Location
Male
Fe-
male
18-24
yrs
25-34
yrs
35-44
yrs
45-54
yrs
55-64
yrs
65 yrs
and
over
Rent
ing
Own
home Other Nth. Mid. Sth.
On-
line
Unweighted Base 405
100.0
190
46.9 100.0
215
53.1 100.0
5
1.2 100.0
37
9.1 100.0
93
23.0 100.0
122
30.1 100.0
93
23.0 100.0
55
13.6 100.0
60
14.8 100.0
335
82.7 100.0
10
2.5 100.0
49
12.1 100.0
125
30.9 100.0
125
30.9 100.0
106
26.2 100.0
Very good
24 5.9
8 4.2
33.3
16 7.4
66.7
- -
-
1 2.7
4.2
5 5.4
20.8
9 7.4
37.5
6 6.5
25.0
3 5.5
12.5
3 5.0
12.5
20 6.0
83.3
1 10.0
4.2
- -
-
11 8.8
45.8
8 6.4
33.3
5 4.7
20.8
Good
152
37.5
69
36.3
45.4
83
38.6
54.6
2
40.0
1.3
19
51.4
12.5 +
31
33.3
20.4
40
32.8
26.3
39
41.9
25.7
21
38.2
13.8
23
38.3
15.1
128
38.2
84.2
1
10.0
0.7
7
14.3
4.6 ---
51
40.8
33.6
59
47.2
38.8 +++
35
33.0
23.0
Fair only
128 31.6
65 34.2
50.8
63 29.3
49.2
3 60.0
2.3
8 21.6
6.3
37 39.8
28.9
+
33 27.0
25.8
30 32.3
23.4
17 30.9
13.3
22 36.7
17.2
103 30.7
80.5
3 30.0
2.3
11 22.4
8.6
50 40.0
39.1
++
40 32.0
31.3
27 25.5
21.1
Poor
39
9.6
18
9.5 46.2
21
9.8 53.8
-
- -
5
13.5 12.8
9
9.7 23.1
13
10.7 33.3
6
6.5 15.4
6
10.9 15.4
4
6.7 10.3
32
9.6 82.1
3
30.0 7.7
9
18.4 23.1
++
8
6.4 20.5
12
9.6 30.8
10
9.4 25.6
Very poor
26
6.4
11
5.8
42.3
15
7.0
57.7
-
-
-
3
8.1
11.5
7
7.5
26.9
9
7.4
34.6
4
4.3
15.4
3
5.5
11.5
3
5.0
11.5
21
6.3
80.8
2
20.0
7.7
4
8.2
15.4
3
2.4
11.5 --
2
1.6
7.7 ---
17
16.0
65.4 +++
Don't know
10 2.5
2 1.1
20.0
-
8 3.7
80.0
+
- -
-
- -
-
2 2.2
20.0
5 4.1
50.0
2 2.2
20.0
1 1.8
10.0
- -
-
10 3.0
100.0
- -
-
1 2.0
10.0
1 0.8
10.0
2 1.6
20.0
6 5.7
60.0
++
Not applic.
26
6.4
17
8.9 65.4
+
9
4.2 34.6
-
-
- -
1
2.7 3.8
2
2.2 7.7
-
13
10.7 50.0
++
6
6.5 23.1
4
7.3 15.4
5
8.3 19.2
21
6.3 80.8
-
- -
17
34.7 65.4
+++
1
0.8 3.8
---
2
1.6 7.7
---
6
5.7 23.1

Table 12.6: How well do you believe the council is PERFORMING in these aspects?
Basic Services / Infrastructure Council Performance
Parking Facilities
Total
Gender Age Group Home ownership Location
Male
Fe-
male
18-24
yrs
25-34
yrs
35-44
yrs
45-54
yrs
55-64
yrs
65 yrs
and
over
Rent
ing
Own
home Other Nth. Mid. Sth.
On-
line
Unweighted Base 406
100.0
191
47.0 100.0
215
53.0 100.0
5
1.2 100.0
37
9.1 100.0
93
22.9 100.0
123
30.3 100.0
93
22.9 100.0
55
13.5 100.0
61
15.0 100.0
335
82.5 100.0
10
2.5 100.0
50
12.3 100.0
125
30.8 100.0
125
30.8 100.0
106
26.1 100.0
Very good
18 4.4
8 4.2
44.4
10 4.7
55.6
- -
-
2 5.4
11.1
2 2.2
11.1
10 8.1
55.6
++
2 2.2
11.1
2 3.6
11.1
1 1.6
5.6
16 4.8
88.9
1 10.0
5.6
- -
-
7 5.6
38.9
7 5.6
38.9
4 3.8
22.2
Good
122
30.0
55
28.8
45.1
67
31.2
54.9
1
20.0
0.8
11
29.7
9.0
33
35.5
27.0
33
26.8
27.0
28
30.1
23.0
16
29.1
13.1
18
29.5
14.8
103
30.7
84.4
1
10.0
0.8
6
12.0
4.9 ---
40
32.0
32.8
48
38.4
39.3 ++
28
26.4
23.0
Fair only
129 31.8
58 30.4
45.0
71 33.0
55.0
2 40.0
1.6
14 37.8
10.9
26 28.0
20.2
35 28.5
27.1
32 34.4
24.8
20 36.4
15.5
20 32.8
15.5
108 32.2
83.7
1 10.0
0.8
9 18.0
7.0
--
40 32.0
31.0
49 39.2
38.0
++
31 29.2
24.0
Poor
68
16.7
34
17.8 50.0
34
15.8 50.0
1
20.0 1.5
8
21.6 11.8
21
22.6 30.9
+
16
13.0 23.5
13
14.0 19.1
9
16.4 13.2
15
24.6 22.1
+
49
14.6 72.1
--
4
40.0 5.9
11
22.0 16.2
23
18.4 33.8
15
12.0 22.1
-
19
17.9 27.9
Very poor
23
5.7
13
6.8
56.5
10
4.7
43.5
-
-
-
2
5.4
8.7
5
5.4
21.7
7
5.7
30.4
8
8.6
34.8
1
1.8
4.3
1
1.6
4.3
22
6.6
95.7 +
-
-
-
5
10.0
21.7
7
5.6
30.4
1
0.8
4.3 ---
10
9.4
43.5 +
Don't know
15 3.7
4 2.1
26.7
11 5.1
73.3
- -
-
- -
-
3 3.2
20.0
6 4.9
40.0
4 4.3
26.7
2 3.6
13.3
- -
-
13 3.9
86.7
2 20.0
13.3
2 4.0
13.3
3 2.4
20.0
3 2.4
20.0
7 6.6
46.7
+
Not applic.
31
7.6
19
9.9 61.3
+
12
5.6 38.7
-
1
20.0 3.2
-
- -
3
3.2 9.7
-
16
13.0 51.6
+++
6
6.5 19.4
5
9.1 16.1
6
9.8 19.4
24
7.2 77.4
1
10.0 3.2
17
34.0 54.8
+++
5
4.0 16.1
-
2
1.6 6.5
---
7
6.6 22.6

Table 12.7: How well do you believe the council is PERFORMING in these aspects?
Basic Services / Infrastructure Council Performance
Public Transport
Total
Gender Age Group Home ownership Location
Male
Fe-
male
18-24
yrs
25-34
yrs
35-44
yrs
45-54
yrs
55-64
yrs
65 yrs
and
over
Rent
ing
Own
home Other Nth. Mid. Sth.
On-
line
Unweighted Base 406
100.0
191
47.0 100.0
215
53.0 100.0
5
1.2 100.0
37
9.1 100.0
93
22.9 100.0
123
30.3 100.0
93
22.9 100.0
55
13.5 100.0
61
15.0 100.0
335
82.5 100.0
10
2.5 100.0
50
12.3 100.0
125
30.8 100.0
125
30.8 100.0
106
26.1 100.0
Very good
4 1.0
3 1.6
75.0
1 0.5
25.0
1 20.0
25.0
1 2.7
25.0
1 1.1
25.0
- -
-
- -
-
1 1.8
25.0
- -
-
4 1.2
100.0
- -
-
1 2.0
25.0
1 0.8
25.0
2 1.6
50.0
- -
-
Good
73
18.0
29
15.2
39.7
44
20.5
60.3
2
40.0
2.7
8
21.6
11.0
15
16.1
20.5
22
17.9
30.1
17
18.3
23.3
9
16.4
12.3
11
18.0
15.1
62
18.5
84.9
-
-
-
7
14.0
9.6
20
16.0
27.4
34
27.2
46.6 +++
12
11.3
16.4 --
Fair only
62 15.3
33 17.3
53.2
29 13.5
46.8
1 20.0
1.6
7 18.9
11.3
17 18.3
27.4
15 12.2
24.2
17 18.3
27.4
5 9.1
8.1
12 19.7
19.4
49 14.6
79.0
1 10.0
1.6
5 10.0
8.1
15 12.0
24.2
28 22.4
45.2
+++
14 13.2
22.6
Poor
61
15.0
28
14.7 45.9
33
15.3 54.1
1
20.0 1.6
6
16.2 9.8
15
16.1 24.6
17
13.8 27.9
15
16.1 24.6
7
12.7 11.5
10
16.4 16.4
47
14.0 77.0
4
40.0 6.6
6
12.0 9.8
17
13.6 27.9
16
12.8 26.2
22
20.8 36.1
+
Very poor
103
25.4
50
26.2
48.5
53
24.7
51.5
-
-
-
9
24.3
8.7
30
32.3
29.1 +
31
25.2
30.1
22
23.7
21.4
11
20.0
10.7
20
32.8
19.4
80
23.9
77.7
3
30.0
2.9
18
36.0
17.5 +
24
19.2
23.3 -
23
18.4
22.3 --
38
35.8
36.9 +++
Don't know
37 9.1
13 6.8
35.1
24 11.2
64.9
- -
-
2 5.4
5.4
5 5.4
13.5
12 9.8
32.4
9 9.7
24.3
9 16.4
24.3
++
4 6.6
10.8
31 9.3
83.8
2 20.0
5.4
1 2.0
2.7
-
15 12.0
40.5
13 10.4
35.1
8 7.5
21.6
Not applic.
66
16.3
35
18.3 53.0
31
14.4 47.0
-
- -
4
10.8 6.1
10
10.8 15.2
26
21.1 39.4
+
13
14.0 19.7
13
23.6 19.7
4
6.6 6.1
--
62
18.5 93.9
+++
-
- -
12
24.0 18.2
33
26.4 50.0
+++
9
7.2 13.6
---
12
11.3 18.2

Table 12.8: How well do you believe the council is PERFORMING in these aspects?
Basic Services / Infrastructure Council Performance
Water Supply
Total
Gender Age Group Home ownership Location
Male
Fe-
male
18-24
yrs
25-34
yrs
35-44
yrs
45-54
yrs
55-64
yrs
65 yrs
and
over
Rent
ing
Own
home Other Nth. Mid. Sth.
On-
line
Unweighted Base 406
100.0
191
47.0 100.0
215
53.0 100.0
5
1.2 100.0
37
9.1 100.0
93
22.9 100.0
123
30.3 100.0
93
22.9 100.0
55
13.5 100.0
61
15.0 100.0
335
82.5 100.0
10
2.5 100.0
50
12.3 100.0
125
30.8 100.0
125
30.8 100.0
106
26.1 100.0
Very good
61 15.0
30 15.7
49.2
31 14.4
50.8
1 20.0
1.6
8 21.6
13.1
15 16.1
24.6
20 16.3
32.8
6 6.5
9.8
---
11 20.0
18.0
8 13.1
13.1
50 14.9
82.0
3 30.0
4.9
3 6.0
4.9
-
23 18.4
37.7
18 14.4
29.5
17 16.0
27.9
Good
187
46.1
88
46.1
47.1
99
46.0
52.9
2
40.0
1.1
23
62.2
12.3 ++
41
44.1
21.9
49
39.8
26.2 -
47
50.5
25.1
25
45.5
13.4
28
45.9
15.0
157
46.9
84.0
2
20.0
1.1
11
22.0
5.9 ---
68
54.4
36.4 ++
72
57.6
38.5 +++
36
34.0
19.3 ---
Fair only
44 10.8
15 7.9
34.1
-
29 13.5
65.9
+
1 20.0
2.3
3 8.1
6.8
12 12.9
27.3
12 9.8
27.3
11 11.8
25.0
5 9.1
11.4
11 18.0
25.0
++
33 9.9
75.0
- -
-
4 8.0
9.1
16 12.8
36.4
13 10.4
29.5
11 10.4
25.0
Poor
22
5.4
11
5.8 50.0
11
5.1 50.0
-
- -
1
2.7 4.5
5
5.4 22.7
5
4.1 22.7
8
8.6 36.4
3
5.5 13.6
4
6.6 18.2
16
4.8 72.7
2
20.0 9.1
2
4.0 9.1
6
4.8 27.3
6
4.8 27.3
8
7.5 36.4
Very poor
18
4.4
9
4.7
50.0
9
4.2
50.0
-
-
-
2
5.4
11.1
6
6.5
33.3
5
4.1
27.8
3
3.2
16.7
2
3.6
11.1
1
1.6
5.6
17
5.1
94.4
-
-
-
3
6.0
16.7
3
2.4
16.7
3
2.4
16.7
9
8.5
50.0 ++
Don't know
12 3.0
5 2.6
41.7
7 3.3
58.3
1 20.0
8.3
- -
-
2 2.2
16.7
3 2.4
25.0
4 4.3
33.3
2 3.6
16.7
1 1.6
8.3
10 3.0
83.3
1 10.0
8.3
1 2.0
8.3
- -
-
4 3.2
33.3
7 6.6
58.3
++
Not applic.
62
15.3
33
17.3 53.2
29
13.5 46.8
-
- -
-
- -
12
12.9 19.4
29
23.6 46.8
+++
14
15.1 22.6
7
12.7 11.3
8
13.1 12.9
52
15.5 83.9
2
20.0 3.2
26
52.0 41.9
+++
9
7.2 14.5
---
9
7.2 14.5
---
18
17.0 29.0

Table 12.9: How well do you believe the council is PERFORMING in these aspects?
Basic Services / Infrastructure Council Performance
Sewerage
Total
Gender Age Group Home ownership Location
Male
Fe-
male
18-24
yrs
25-34
yrs
35-44
yrs
45-54
yrs
55-64
yrs
65 yrs
and
over
Rent
ing
Own
home Other Nth. Mid. Sth.
On-
line
Unweighted Base 406
100.0
191
47.0 100.0
215
53.0 100.0
5
1.2 100.0
37
9.1 100.0
93
22.9 100.0
123
30.3 100.0
93
22.9 100.0
55
13.5 100.0
61
15.0 100.0
335
82.5 100.0
10
2.5 100.0
50
12.3 100.0
125
30.8 100.0
125
30.8 100.0
106
26.1 100.0
Very good
52 12.8
22 11.5
42.3
30 14.0
57.7
- -
-
6 16.2
11.5
13 14.0
25.0
14 11.4
26.9
9 9.7
17.3
10 18.2
19.2
8 13.1
15.4
43 12.8
82.7
1 10.0
1.9
- -
-
21 16.8
40.4
18 14.4
34.6
13 12.3
25.0
Good
192
47.3
86
45.0
44.8
106
49.3
55.2
2
40.0
1.0
24
64.9
12.5 ++
42
45.2
21.9
52
42.3
27.1
48
51.6
25.0
24
43.6
12.5
29
47.5
15.1
161
48.1
83.9
2
20.0
1.0
13
26.0
6.8 ---
61
48.8
31.8
78
62.4
40.6 +++
40
37.7
20.8 --
Fair only
35 8.6
14 7.3
40.0
21 9.8
60.0
2 40.0
5.7
- -
-
8 8.6
22.9
11 8.9
31.4
10 10.8
28.6
4 7.3
11.4
6 9.8
17.1
28 8.4
80.0
1 10.0
2.9
4 8.0
11.4
12 9.6
34.3
9 7.2
25.7
10 9.4
28.6
Poor
11
2.7
7
3.7 63.6
4
1.9 36.4
-
- -
1
2.7 9.1
3
3.2 27.3
2
1.6 18.2
3
3.2 27.3
2
3.6 18.2
1
1.6 9.1
9
2.7 81.8
1
10.0 9.1
1
2.0 9.1
6
4.8 54.5
+
2
1.6 18.2
2
1.9 18.2
Very poor
21
5.2
11
5.8
52.4
10
4.7
47.6
-
-
-
2
5.4
9.5
8
8.6
38.1 +
5
4.1
23.8
3
3.2
14.3
3
5.5
14.3
2
3.3
9.5
19
5.7
90.5
-
-
-
3
6.0
14.3
5
4.0
23.8
3
2.4
14.3 -
10
9.4
47.6 ++
Don't know
19 4.7
9 4.7
47.4
10 4.7
52.6
1 20.0
5.3
2 5.4
10.5
4 4.3
21.1
5 4.1
26.3
5 5.4
26.3
2 3.6
10.5
3 4.9
15.8
13 3.9
68.4
-
3 30.0
15.8
1 2.0
5.3
3 2.4
15.8
4 3.2
21.1
11 10.4
57.9
+++
Not applic.
76
18.7
42
22.0 55.3
34
15.8 44.7
-
- -
2
5.4 2.6
--
15
16.1 19.7
34
27.6 44.7
+++
15
16.1 19.7
10
18.2 13.2
12
19.7 15.8
62
18.5 81.6
2
20.0 2.6
28
56.0 36.8
+++
17
13.6 22.4
-
11
8.8 14.5
---
20
18.9 26.3

Table 12.10: How well do you believe the council is PERFORMING in these aspects?
Basic Services / Infrastructure Council Performance
Drainage and Flood Mitigation
Total
Gender Age Group Home ownership Location
Male
Fe-
male
18-24
yrs
25-34
yrs
35-44
yrs
45-54
yrs
55-64
yrs
65 yrs
and
over
Rent
ing
Own
home Other Nth. Mid. Sth.
On-
line
Unweighted Base 406
100.0
191
47.0 100.0
215
53.0 100.0
5
1.2 100.0
37
9.1 100.0
93
22.9 100.0
123
30.3 100.0
93
22.9 100.0
55
13.5 100.0
61
15.0 100.0
335
82.5 100.0
10
2.5 100.0
50
12.3 100.0
125
30.8 100.0
125
30.8 100.0
106
26.1 100.0
Very good
34 8.4
12 6.3
35.3
22 10.2
64.7
- -
-
3 8.1
8.8
6 6.5
17.6
13 10.6
38.2
7 7.5
20.6
5 9.1
14.7
6 9.8
17.6
28 8.4
82.4
- -
-
- -
-
14 11.2
41.2
12 9.6
35.3
8 7.5
23.5
Good
185
45.6
87
45.5
47.0
98
45.6
53.0
2
40.0
1.1
17
45.9
9.2
42
45.2
22.7
56
45.5
30.3
45
48.4
24.3
23
41.8
12.4
28
45.9
15.1
153
45.7
82.7
4
40.0
2.2
15
30.0
8.1 --
65
52.0
35.1 +
67
53.6
36.2 ++
38
35.8
20.5 --
Fair only
94 23.2
46 24.1
48.9
48 22.3
51.1
2 40.0
2.1
8 21.6
8.5
23 24.7
24.5
20 16.3
21.3
--
22 23.7
23.4
19 34.5
20.2
++
14 23.0
14.9
77 23.0
81.9
3 30.0
3.2
14 28.0
14.9
35 28.0
37.2
26 20.8
27.7
19 17.9
20.2
Poor
32
7.9
17
8.9 53.1
15
7.0 46.9
-
- -
3
8.1 9.4
7
7.5 21.9
12
9.8 37.5
7
7.5 21.9
3
5.5 9.4
7
11.5 21.9
25
7.5 78.1
-
- -
4
8.0 12.5
6
4.8 18.8
14
11.2 43.8
+
8
7.5 25.0
Very poor
16
3.9
8
4.2
50.0
8
3.7
50.0
-
-
-
3
8.1
18.8
5
5.4
31.3
4
3.3
25.0
3
3.2
18.8
1
1.8
6.3
1
1.6
6.3
15
4.5
93.8
-
-
-
4
8.0
25.0
2
1.6
12.5
2
1.6
12.5
8
7.5
50.0 ++
Don't know
22 5.4
10 5.2
45.5
12 5.6
54.5
1 20.0
4.5
3 8.1
13.6
6 6.5
27.3
5 4.1
22.7
5 5.4
22.7
2 3.6
9.1
3 4.9
13.6
17 5.1
77.3
2 20.0
9.1
1 2.0
4.5
3 2.4
13.6
-
4 3.2
18.2
14 13.2
63.6
+++
Not applic.
23
5.7
11
5.8 47.8
12
5.6 52.2
-
- -
-
- -
4
4.3 17.4
13
10.6 56.5
+++
4
4.3 17.4
2
3.6 8.7
2
3.3 8.7
20
6.0 87.0
1
10.0 4.3
12
24.0 52.2
+++
-
- -
-
- -
11
10.4 47.8
++

Table 12.11: How well do you believe the council is PERFORMING in these aspects?
Basic Services / Infrastructure Council Performance
Waste Management
Total
Gender Age Group Home ownership Location
Male
Fe-
male
18-24
yrs
25-34
yrs
35-44
yrs
45-54
yrs
55-64
yrs
65 yrs
and
over
Rent
ing
Own
home Other Nth. Mid. Sth.
On-
line
Unweighted Base 406
100.0
191
47.0 100.0
215
53.0 100.0
5
1.2 100.0
37
9.1 100.0
93
22.9 100.0
123
30.3 100.0
93
22.9 100.0
55
13.5 100.0
61
15.0 100.0
335
82.5 100.0
10
2.5 100.0
50
12.3 100.0
125
30.8 100.0
125
30.8 100.0
106
26.1 100.0
Very good
66 16.3
30 15.7
45.5
36 16.7
54.5
- -
-
8 21.6
12.1
13 14.0
19.7
24 19.5
36.4
9 9.7
13.6
-
12 21.8
18.2
10 16.4
15.2
54 16.1
81.8
2 20.0
3.0
- -
-
32 25.6
48.5
+++
22 17.6
33.3
12 11.3
18.2
Good
204
50.2
93
48.7
45.6
111
51.6
54.4
2
40.0
1.0
19
51.4
9.3
46
49.5
22.5
54
43.9
26.5 -
53
57.0
26.0
30
54.5
14.7
29
47.5
14.2
171
51.0
83.8
4
40.0
2.0
15
30.0
7.4 ---
68
54.4
33.3
78
62.4
38.2 +++
43
40.6
21.1 --
Fair only
70 17.2
42 22.0
60.0
++
28 13.0
40.0
--
2 40.0
2.9
5 13.5
7.1
15 16.1
21.4
25 20.3
35.7
16 17.2
22.9
7 12.7
10.0
11 18.0
15.7
59 17.6
84.3
- -
-
13 26.0
18.6
+
22 17.6
31.4
16 12.8
22.9
19 17.9
27.1
Poor
22
5.4
5
2.6 22.7
--
17
7.9 77.3
++
-
- -
-
- -
6
6.5 27.3
5
4.1 22.7
7
7.5 31.8
4
7.3 18.2
4
6.6 18.2
18
5.4 81.8
-
- -
7
14.0 31.8
+++
1
0.8 4.5
---
5
4.0 22.7
9
8.5 40.9
Very poor
28
6.9
13
6.8
46.4
15
7.0
53.6
-
-
-
4
10.8
14.3
9
9.7
32.1
10
8.1
35.7
4
4.3
14.3
1
1.8
3.6
4
6.6
14.3
22
6.6
78.6
2
20.0
7.1
8
16.0
28.6 +++
2
1.6
7.1 ---
1
0.8
3.6 ---
17
16.0
60.7 +++
Don't know
6 1.5
2 1.0
33.3
4 1.9
66.7
1 20.0
16.7
1 2.7
16.7
2 2.2
33.3
1 0.8
16.7
1 1.1
16.7
- -
-
1 1.6
16.7
3 0.9
50.0
--
2 20.0
33.3
- -
-
- -
-
2 1.6
33.3
4 3.8
66.7
++
Not applic.
10
2.5
6
3.1 60.0
4
1.9 40.0
-
- -
-
- -
2
2.2 20.0
4
3.3 40.0
3
3.2 30.0
1
1.8 10.0
2
3.3 20.0
8
2.4 80.0
-
- -
7
14.0 70.0
+++
-
- -
1
0.8 10.0
2
1.9 20.0

Table 12.12: How well do you believe the council is PERFORMING in these aspects?
Basic Services / Infrastructure Council Performance
Community Health
Total
Gender Age Group Home ownership Location
Male
Fe-
male
18-24
yrs
25-34
yrs
35-44
yrs
45-54
yrs
55-64
yrs
65 yrs
and
over
Rent
ing
Own
home Other Nth. Mid. Sth.
On-
line
Unweighted Base 406
100.0
191
47.0 100.0
215
53.0 100.0
5
1.2 100.0
37
9.1 100.0
93
22.9 100.0
123
30.3 100.0
93
22.9 100.0
55
13.5 100.0
61
15.0 100.0
335
82.5 100.0
10
2.5 100.0
50
12.3 100.0
125
30.8 100.0
125
30.8 100.0
106
26.1 100.0
Very good
27 6.7
10 5.2
37.0
17 7.9
63.0
- -
-
4 10.8
14.8
4 4.3
14.8
11 8.9
40.7
5 5.4
18.5
3 5.5
11.1
5 8.2
18.5
22 6.6
81.5
- -
-
1 2.0
3.7
12 9.6
44.4
8 6.4
29.6
6 5.7
22.2
Good
180
44.3
83
43.5
46.1
97
45.1
53.9
2
40.0
1.1
13
35.1
7.2
42
45.2
23.3
50
40.7
27.8
44
47.3
24.4
29
52.7
16.1
25
41.0
13.9
151
45.1
83.9
4
40.0
2.2
8
16.0
4.4 ---
67
53.6
37.2 ++
67
53.6
37.2 ++
38
35.8
21.1 --
Fair only
105 25.9
49 25.7
46.7
56 26.0
53.3
2 40.0
1.9
12 32.4
11.4
28 30.1
26.7
33 26.8
31.4
20 21.5
19.0
10 18.2
9.5
17 27.9
16.2
86 25.7
81.9
2 20.0
1.9
18 36.0
17.1
+
28 22.4
26.7
29 23.2
27.6
30 28.3
28.6
Poor
38
9.4
18
9.4 47.4
20
9.3 52.6
-
- -
3
8.1 7.9
8
8.6 21.1
8
6.5 21.1
13
14.0 34.2
+
6
10.9 15.8
5
8.2 13.2
31
9.3 81.6
2
20.0 5.3
13
26.0 34.2
+++
8
6.4 21.1
6
4.8 15.8
--
11
10.4 28.9
Very poor
13
3.2
8
4.2
61.5
5
2.3
38.5
-
-
-
1
2.7
7.7
2
2.2
15.4
5
4.1
38.5
3
3.2
23.1
2
3.6
15.4
-
-
-
12
3.6
92.3
1
10.0
7.7
3
6.0
23.1
2
1.6
15.4
2
1.6
15.4
6
5.7
46.2 +
Don't know
36 8.9
18 9.4
50.0
18 8.4
50.0
1 20.0
2.8
4 10.8
11.1
6 6.5
16.7
13 10.6
36.1
7 7.5
19.4
5 9.1
13.9
7 11.5
19.4
28 8.4
77.8
1 10.0
2.8
2 4.0
5.6
8 6.4
22.2
13 10.4
36.1
13 12.3
36.1
Not applic.
7
1.7
5
2.6 71.4
2
0.9 28.6
-
- -
-
- -
3
3.2 42.9
3
2.4 42.9
1
1.1 14.3
-
- -
2
3.3 28.6
5
1.5 71.4
-
- -
5
10.0 71.4
+++
-
- -
-
- -
2
1.9 28.6

Table 13.1: Community Lifestyle Services Council Performance
Parks, Playgrounds and Public Amenities
Total
Gender Age Group Home ownership Location
Male
Fe-
male
18-24
yrs
25-34
yrs
35-44
yrs
45-54
yrs
55-64
yrs
65 yrs
and
over
Rent
ing
Own
home Other Nth. Mid. Sth.
On-
line
Unweighted Base 406
100.0
191
47.0 100.0
215
53.0 100.0
5
1.2 100.0
37
9.1 100.0
93
22.9 100.0
123
30.3 100.0
93
22.9 100.0
55
13.5 100.0
61
15.0 100.0
335
82.5 100.0
10
2.5 100.0
50
12.3 100.0
125
30.8 100.0
125
30.8 100.0
106
26.1 100.0
Very good
37
9.1
18
9.4 48.6
19
8.8 51.4
1
20.0 2.7
5
13.5 13.5
7
7.5 18.9
14
11.4 37.8
6
6.5 16.2
4
7.3 10.8
6
9.8 16.2
30
9.0 81.1
1
10.0 2.7
1
2.0 2.7
-
16
12.8 43.2
+
16
12.8 43.2
+
4
3.8 10.8
--
Good
182
44.8
90
47.1
49.5
92
42.8
50.5
2
40.0
1.1
14
37.8
7.7
45
48.4
24.7
54
43.9
29.7
46
49.5
25.3
21
38.2
11.5
26
42.6
14.3
151
45.1
83.0
5
50.0
2.7
15
30.0
8.2 --
61
48.8
33.5
61
48.8
33.5
45
42.5
24.7
Fair only
132 32.5
55 28.8
41.7
77 35.8
58.3
2 40.0
1.5
11 29.7
8.3
28 30.1
21.2
40 32.5
30.3
28 30.1
21.2
23 41.8
17.4
25 41.0
18.9
104 31.0
78.8
3 30.0
2.3
22 44.0
16.7
+
35 28.0
26.5
41 32.8
31.1
34 32.1
25.8
Poor
26
6.4
13
6.8 50.0
13
6.0 50.0
-
- -
2
5.4 7.7
9
9.7 34.6
6
4.9 23.1
5
5.4 19.2
4
7.3 15.4
-
- -
25
7.5 96.2
+
1
10.0 3.8
2
4.0 7.7
10
8.0 38.5
6
4.8 23.1
8
7.5 30.8
Very poor
14
3.4
7
3.7
50.0
7
3.3
50.0
-
-
-
4
10.8
28.6 ++
2
2.2
14.3
5
4.1
35.7
3
3.2
21.4
-
-
-
2
3.3
14.3
12
3.6
85.7
-
-
-
1
2.0
7.1
2
1.6
14.3
-
-
-
11
10.4
78.6 +++
Don't know
13 3.2
7 3.7
53.8
6 2.8
46.2
- -
-
1 2.7
7.7
2 2.2
15.4
4 3.3
30.8
3 3.2
23.1
3 5.5
23.1
2 3.3
15.4
11 3.3
84.6
- -
-
8 16.0
61.5
+++
1 0.8
7.7
-
1 0.8
7.7
-
3 2.8
23.1
Not applic.
2
0.5
1
0.5 50.0
1
0.5 50.0
-
- -
-
- -
-
- -
-
- -
2
2.2 100.0
+++
-
- -
-
- -
2
0.6 100.0
-
- -
1
2.0 50.0
-
- -
-
- -
1
0.9 50.0

Table 13.2: Community Lifestyle Services Council Performance
Environmental Controls
Total
Gender Age Group Home ownership Location
Male
Fe-
male
18-24
yrs
25-34
yrs
35-44
yrs
45-54
yrs
55-64
yrs
65 yrs
and
over
Rent
ing
Own
home Other Nth. Mid. Sth.
On-
line
Unweighted Base 406
100.0
191
47.0 100.0
215
53.0 100.0
5
1.2 100.0
37
9.1 100.0
93
22.9 100.0
123
30.3 100.0
93
22.9 100.0
55
13.5 100.0
61
15.0 100.0
335
82.5 100.0
10
2.5 100.0
50
12.3 100.0
125
30.8 100.0
125
30.8 100.0
106
26.1 100.0
Very good
23
5.7
14
7.3 60.9
9
4.2 39.1
-
- -
1
2.7 4.3
4
4.3 17.4
11
8.9 47.8
+
4
4.3 17.4
3
5.5 13.0
3
4.9 13.0
20
6.0 87.0
-
- -
-
- -
7
5.6 30.4
10
8.0 43.5
6
5.7 26.1
Good
156
38.4
72
37.7
46.2
84
39.1
53.8
1
20.0
0.6
13
35.1
8.3
41
44.1
26.3
44
35.8
28.2
39
41.9
25.0
18
32.7
11.5
25
41.0
16.0
126
37.6
80.8
5
50.0
3.2
13
26.0
8.3 -
48
38.4
30.8
48
38.4
30.8
47
44.3
30.1
Fair only
136 33.5
58 30.4
42.6
78 36.3
57.4
2 40.0
1.5
16 43.2
11.8
26 28.0
19.1
41 33.3
30.1
28 30.1
20.6
23 41.8
16.9
20 32.8
14.7
113 33.7
83.1
3 30.0
2.2
22 44.0
16.2
+
44 35.2
32.4
46 36.8
33.8
24 22.6
17.6
---
Poor
41
10.1
21
11.0 51.2
20
9.3 48.8
1
20.0 2.4
3
8.1 7.3
12
12.9 29.3
13
10.6 31.7
9
9.7 22.0
3
5.5 7.3
8
13.1 19.5
33
9.9 80.5
-
- -
7
14.0 17.1
9
7.2 22.0
15
12.0 36.6
10
9.4 24.4
Very poor
20
4.9
12
6.3
60.0
8
3.7
40.0
-
-
-
3
8.1
15.0
3
3.2
15.0
8
6.5
40.0
5
5.4
25.0
1
1.8
5.0
2
3.3
10.0
17
5.1
85.0
1
10.0
5.0
3
6.0
15.0
5
4.0
25.0
2
1.6
10.0 --
10
9.4
50.0 ++
Don't know
29 7.1
13 6.8
44.8
16 7.4
55.2
1 20.0
3.4
1 2.7
3.4
7 7.5
24.1
6 4.9
20.7
7 7.5
24.1
7 12.7
24.1
+
3 4.9
10.3
25 7.5
86.2
1 10.0
3.4
4 8.0
13.8
12 9.6
41.4
4 3.2
13.8
--
9 8.5
31.0
Not applic.
1
0.2
1
0.5 100.0
-
- -
-
- -
-
- -
-
- -
-
- -
1
1.1 100.0
+
-
- -
-
- -
1
0.3 100.0
-
- -
1
2.0 100.0
+++
-
- -
-
- -
-
- -

Table 13.3: Community Lifestyle Services Council Performance
Environmental Protection/ Conserv.
Total
Gender Age Group Home ownership Location
Male
Fe-
male
18-24
yrs
25-34
yrs
35-44
yrs
45-54
yrs
55-64
yrs
65 yrs
and
over
Rent
ing
Own
home Other Nth. Mid. Sth.
On-
line
Unweighted Base 406
100.0
191
47.0 100.0
215
53.0 100.0
5
1.2 100.0
37
9.1 100.0
93
22.9 100.0
123
30.3 100.0
93
22.9 100.0
55
13.5 100.0
61
15.0 100.0
335
82.5 100.0
10
2.5 100.0
50
12.3 100.0
125
30.8 100.0
125
30.8 100.0
106
26.1 100.0
Very good
27
6.7
14
7.3 51.9
13
6.0 48.1
-
- -
1
2.7 3.7
4
4.3 14.8
12
9.8 44.4
+
5
5.4 18.5
5
9.1 18.5
2
3.3 7.4
25
7.5 92.6
-
- -
-
- -
8
6.4 29.6
13
10.4 48.1
++
6
5.7 22.2
Good
156
38.4
64
33.5
41.0 -
92
42.8
59.0 +
2
40.0
1.3
14
37.8
9.0
35
37.6
22.4
47
38.2
30.1
39
41.9
25.0
19
34.5
12.2
22
36.1
14.1
130
38.8
83.3
4
40.0
2.6
12
24.0
7.7 --
50
40.0
32.1
50
40.0
32.1
44
41.5
28.2
Fair only
121 29.8
57 29.8
47.1
64 29.8
52.9
2 40.0
1.7
13 35.1
10.7
27 29.0
22.3
35 28.5
28.9
26 28.0
21.5
18 32.7
14.9
22 36.1
18.2
96 28.7
79.3
3 30.0
2.5
21 42.0
17.4
++
39 31.2
32.2
39 31.2
32.2
22 20.8
18.2
--
Poor
55
13.5
29
15.2 52.7
26
12.1 47.3
-
- -
6
16.2 10.9
17
18.3 30.9
15
12.2 27.3
8
8.6 14.5
9
16.4 16.4
10
16.4 18.2
43
12.8 78.2
2
20.0 3.6
12
24.0 21.8
++
14
11.2 25.5
13
10.4 23.6
16
15.1 29.1
Very poor
22
5.4
15
7.9
68.2 ++
7
3.3
31.8 --
-
-
-
2
5.4
9.1
5
5.4
22.7
9
7.3
40.9
5
5.4
22.7
1
1.8
4.5
3
4.9
13.6
19
5.7
86.4
-
-
-
2
4.0
9.1
4
3.2
18.2
5
4.0
22.7
11
10.4
50.0 +++
Don't know
25 6.2
12 6.3
48.0
13 6.0
52.0
1 20.0
4.0
1 2.7
4.0
5 5.4
20.0
5 4.1
20.0
10 10.8
40.0
++
3 5.5
12.0
2 3.3
8.0
22 6.6
88.0
1 10.0
4.0
3 6.0
12.0
10 8.0
40.0
5 4.0
20.0
7 6.6
28.0

Table 13.4: Community Lifestyle Services Council Performance
Heritage Protection
Total
Gender Age Group Home ownership Location
Male
Fe-
male
18-24
yrs
25-34
yrs
35-44
yrs
45-54
yrs
55-64
yrs
65 yrs
and
over
Rent
ing
Own
home Other Nth. Mid. Sth.
On-
line
Unweighted Base 406
100.0
191
47.0 100.0
215
53.0 100.0
5
1.2 100.0
37
9.1 100.0
93
22.9 100.0
123
30.3 100.0
93
22.9 100.0
55
13.5 100.0
61
15.0 100.0
335
82.5 100.0
10
2.5 100.0
50
12.3 100.0
125
30.8 100.0
125
30.8 100.0
106
26.1 100.0
Very good
16
3.9
7
3.7 43.8
9
4.2 56.3
-
- -
1
2.7 6.3
1
1.1 6.3
10
8.1 62.5
+++
2
2.2 12.5
2
3.6 12.5
-
- -
16
4.8 100.0
+
-
- -
-
- -
6
4.8 37.5
6
4.8 37.5
4
3.8 25.0
Good
158
38.9
64
33.5
40.5 --
94
43.7
59.5 ++
2
40.0
1.3
15
40.5
9.5
40
43.0
25.3
45
36.6
28.5
34
36.6
21.5
22
40.0
13.9
25
41.0
15.8
127
37.9
80.4
6
60.0
3.8
15
30.0
9.5
42
33.6
26.6
51
40.8
32.3
50
47.2
31.6 ++
Fair only
132 32.5
67 35.1
50.8
65 30.2
49.2
2 40.0
1.5
14 37.8
10.6
25 26.9
18.9
43 35.0
32.6
29 31.2
22.0
19 34.5
14.4
20 32.8
15.2
109 32.5
82.6
3 30.0
2.3
19 38.0
14.4
46 36.8
34.8
44 35.2
33.3
23 21.7
17.4
---
Poor
25
6.2
15
7.9 60.0
10
4.7 40.0
-
- -
1
2.7 4.0
8
8.6 32.0
6
4.9 24.0
7
7.5 28.0
3
5.5 12.0
6
9.8 24.0
19
5.7 76.0
-
- -
7
14.0 28.0
++
5
4.0 20.0
7
5.6 28.0
6
5.7 24.0
Very poor
15
3.7
9
4.7
60.0
6
2.8
40.0
-
-
-
2
5.4
13.3
3
3.2
20.0
3
2.4
20.0
4
4.3
26.7
3
5.5
20.0
-
-
-
15
4.5
100.0 +
-
-
-
3
6.0
20.0
2
1.6
13.3
1
0.8
6.7 --
9
8.5
60.0 +++
Don't know
55 13.5
25 13.1
45.5
30 14.0
54.5
1 20.0
1.8
3 8.1
5.5
14 15.1
25.5
16 13.0
29.1
15 16.1
27.3
6 10.9
10.9
9 14.8
16.4
45 13.4
81.8
1 10.0
1.8
5 10.0
9.1
24 19.2
43.6
++
15 12.0
27.3
11 10.4
20.0
Not applic.
5
1.2
4
2.1 80.0
1
0.5 20.0
-
- -
1
2.7 20.0
2
2.2 40.0
-
- -
2
2.2 40.0
-
- -
1
1.6 20.0
4
1.2 80.0
-
- -
1
2.0 20.0
-
- -
1
0.8 20.0
3
2.8 60.0
+

Table 13.5: Community Lifestyle Services Council Performance
Sporting and Recreational Facilities
Total
Gender Age Group Home ownership Location
Male
Fe-
male
18-24
yrs
25-34
yrs
35-44
yrs
45-54
yrs
55-64
yrs
65 yrs
and
over
Rent
ing
Own
home Other Nth. Mid. Sth.
On-
line
Unweighted Base 406
100.0
191
47.0 100.0
215
53.0 100.0
5
1.2 100.0
37
9.1 100.0
93
22.9 100.0
123
30.3 100.0
93
22.9 100.0
55
13.5 100.0
61
15.0 100.0
335
82.5 100.0
10
2.5 100.0
50
12.3 100.0
125
30.8 100.0
125
30.8 100.0
106
26.1 100.0
Very good
30
7.4
13
6.8 43.3
17
7.9 56.7
-
- -
6
16.2 20.0
++
6
6.5 20.0
11
8.9 36.7
3
3.2 10.0
-
4
7.3 13.3
1
1.6 3.3
-
28
8.4 93.3
1
10.0 3.3
1
2.0 3.3
12
9.6 40.0
13
10.4 43.3
4
3.8 13.3
-
Good
185
45.6
85
44.5
45.9
100
46.5
54.1
3
60.0
1.6
12
32.4
6.5 -
38
40.9
20.5
59
48.0
31.9
45
48.4
24.3
28
50.9
15.1
28
45.9
15.1
154
46.0
83.2
3
30.0
1.6
13
26.0
7.0 ---
63
50.4
34.1
63
50.4
34.1
46
43.4
24.9
Fair only
121 29.8
61 31.9
50.4
60 27.9
49.6
- -
-
10 27.0
8.3
30 32.3
24.8
40 32.5
33.1
25 26.9
20.7
16 29.1
13.2
22 36.1
18.2
94 28.1
77.7
-
5 50.0
4.1
22 44.0
18.2
++
32 25.6
26.4
38 30.4
31.4
29 27.4
24.0
Poor
27
6.7
10
5.2 37.0
17
7.9 63.0
1
20.0 3.7
6
16.2 22.2
++
9
9.7 33.3
1
0.8 3.7
---
4
4.3 14.8
6
10.9 22.2
7
11.5 25.9
20
6.0 74.1
-
- -
6
12.0 22.2
7
5.6 25.9
7
5.6 25.9
7
6.6 25.9
Very poor
16
3.9
9
4.7
56.3
7
3.3
43.8
-
-
-
2
5.4
12.5
5
5.4
31.3
5
4.1
31.3
4
4.3
25.0
-
-
-
-
-
-
16
4.8
100.0 +
-
-
-
4
8.0
25.0
3
2.4
18.8
1
0.8
6.3 --
8
7.5
50.0 ++
Don't know
23 5.7
11 5.8
47.8
12 5.6
52.2
1 20.0
4.3
- -
-
5 5.4
21.7
6 4.9
26.1
10 10.8
43.5
++
1 1.8
4.3
3 4.9
13.0
19 5.7
82.6
1 10.0
4.3
4 8.0
17.4
8 6.4
34.8
2 1.6
8.7
--
9 8.5
39.1
Not applic.
4
1.0
2
1.0 50.0
2
0.9 50.0
-
- -
1
2.7 25.0
-
- -
1
0.8 25.0
2
2.2 50.0
-
- -
-
- -
4
1.2 100.0
-
- -
-
- -
-
- -
1
0.8 25.0
3
2.8 75.0
++
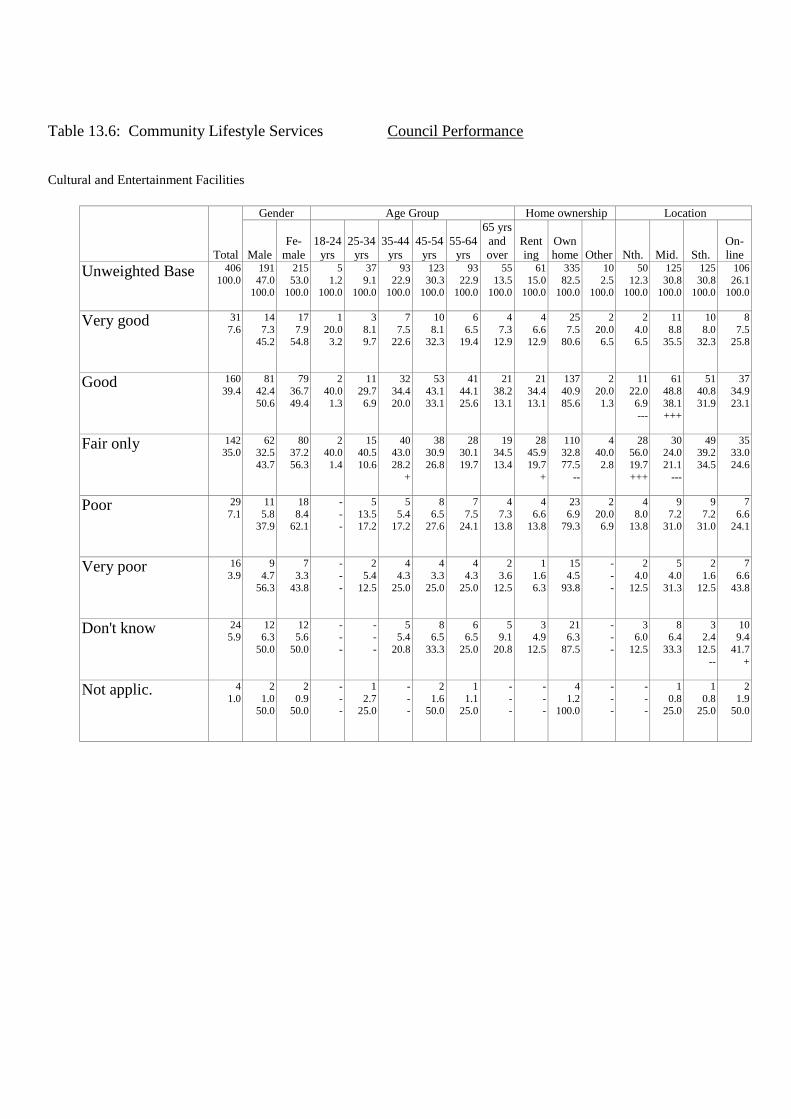
Table 13.6: Community Lifestyle Services Council Performance
Cultural and Entertainment Facilities
Total
Gender Age Group Home ownership Location
Male
Fe-
male
18-24
yrs
25-34
yrs
35-44
yrs
45-54
yrs
55-64
yrs
65 yrs
and
over
Rent
ing
Own
home Other Nth. Mid. Sth.
On-
line
Unweighted Base 406
100.0
191
47.0 100.0
215
53.0 100.0
5
1.2 100.0
37
9.1 100.0
93
22.9 100.0
123
30.3 100.0
93
22.9 100.0
55
13.5 100.0
61
15.0 100.0
335
82.5 100.0
10
2.5 100.0
50
12.3 100.0
125
30.8 100.0
125
30.8 100.0
106
26.1 100.0
Very good
31
7.6
14
7.3 45.2
17
7.9 54.8
1
20.0 3.2
3
8.1 9.7
7
7.5 22.6
10
8.1 32.3
6
6.5 19.4
4
7.3 12.9
4
6.6 12.9
25
7.5 80.6
2
20.0 6.5
2
4.0 6.5
11
8.8 35.5
10
8.0 32.3
8
7.5 25.8
Good
160
39.4
81
42.4
50.6
79
36.7
49.4
2
40.0
1.3
11
29.7
6.9
32
34.4
20.0
53
43.1
33.1
41
44.1
25.6
21
38.2
13.1
21
34.4
13.1
137
40.9
85.6
2
20.0
1.3
11
22.0
6.9 ---
61
48.8
38.1 +++
51
40.8
31.9
37
34.9
23.1
Fair only
142 35.0
62 32.5
43.7
80 37.2
56.3
2 40.0
1.4
15 40.5
10.6
40 43.0
28.2
+
38 30.9
26.8
28 30.1
19.7
19 34.5
13.4
28 45.9
19.7
+
110 32.8
77.5
--
4 40.0
2.8
28 56.0
19.7
+++
30 24.0
21.1
---
49 39.2
34.5
35 33.0
24.6
Poor
29
7.1
11
5.8 37.9
18
8.4 62.1
-
- -
5
13.5 17.2
5
5.4 17.2
8
6.5 27.6
7
7.5 24.1
4
7.3 13.8
4
6.6 13.8
23
6.9 79.3
2
20.0 6.9
4
8.0 13.8
9
7.2 31.0
9
7.2 31.0
7
6.6 24.1
Very poor
16
3.9
9
4.7
56.3
7
3.3
43.8
-
-
-
2
5.4
12.5
4
4.3
25.0
4
3.3
25.0
4
4.3
25.0
2
3.6
12.5
1
1.6
6.3
15
4.5
93.8
-
-
-
2
4.0
12.5
5
4.0
31.3
2
1.6
12.5
7
6.6
43.8
Don't know
24 5.9
12 6.3
50.0
12 5.6
50.0
- -
-
- -
-
5 5.4
20.8
8 6.5
33.3
6 6.5
25.0
5 9.1
20.8
3 4.9
12.5
21 6.3
87.5
- -
-
3 6.0
12.5
8 6.4
33.3
3 2.4
12.5
--
10 9.4
41.7
+
Not applic.
4
1.0
2
1.0 50.0
2
0.9 50.0
-
- -
1
2.7 25.0
-
- -
2
1.6 50.0
1
1.1 25.0
-
- -
-
- -
4
1.2 100.0
-
- -
-
- -
1
0.8 25.0
1
0.8 25.0
2
1.9 50.0

Table 13.7: Community Lifestyle Services Council Performance
Libraries and other Information Access
Total
Gender Age Group Home ownership Location
Male
Fe-
male
18-24
yrs
25-34
yrs
35-44
yrs
45-54
yrs
55-64
yrs
65 yrs
and
over
Rent
ing
Own
home Other Nth. Mid. Sth.
On-
line
Unweighted Base 406
100.0
191
47.0 100.0
215
53.0 100.0
5
1.2 100.0
37
9.1 100.0
93
22.9 100.0
123
30.3 100.0
93
22.9 100.0
55
13.5 100.0
61
15.0 100.0
335
82.5 100.0
10
2.5 100.0
50
12.3 100.0
125
30.8 100.0
125
30.8 100.0
106
26.1 100.0
Very good
64
15.8
32
16.8 50.0
32
14.9 50.0
-
- -
9
24.3 14.1
13
14.0 20.3
22
17.9 34.4
10
10.8 15.6
10
18.2 15.6
5
8.2 7.8
-
59
17.6 92.2
++
-
- -
2
4.0 3.1
--
31
24.8 48.4
+++
20
16.0 31.3
11
10.4 17.2
-
Good
206
50.7
93
48.7
45.1
113
52.6
54.9
1
20.0
0.5
16
43.2
7.8
48
51.6
23.3
64
52.0
31.1
49
52.7
23.8
28
50.9
13.6
31
50.8
15.0
170
50.7
82.5
5
50.0
2.4
20
40.0
9.7
71
56.8
34.5
66
52.8
32.0
49
46.2
23.8
Fair only
91 22.4
47 24.6
51.6
44 20.5
48.4
2 40.0
2.2
8 21.6
8.8
20 21.5
22.0
28 22.8
30.8
20 21.5
22.0
13 23.6
14.3
19 31.1
20.9
+
69 20.6
75.8
-
3 30.0
3.3
20 40.0
22.0
+++
19 15.2
20.9
--
32 25.6
35.2
20 18.9
22.0
Poor
14
3.4
6
3.1 42.9
8
3.7 57.1
1
20.0 7.1
1
2.7 7.1
2
2.2 14.3
2
1.6 14.3
5
5.4 35.7
3
5.5 21.4
2
3.3 14.3
11
3.3 78.6
1
10.0 7.1
4
8.0 28.6
+
1
0.8 7.1
-
2
1.6 14.3
7
6.6 50.0
++
Very poor
9
2.2
4
2.1
44.4
5
2.3
55.6
-
-
-
1
2.7
11.1
3
3.2
33.3
3
2.4
33.3
2
2.2
22.2
-
-
-
-
-
-
9
2.7
100.0
-
-
-
1
2.0
11.1
1
0.8
11.1
-
-
-
7
6.6
77.8 +++
Don't know
18 4.4
6 3.1
33.3
12 5.6
66.7
1 20.0
5.6
1 2.7
5.6
6 6.5
33.3
3 2.4
16.7
6 6.5
33.3
1 1.8
5.6
4 6.6
22.2
13 3.9
72.2
1 10.0
5.6
2 4.0
11.1
1 0.8
5.6
--
5 4.0
27.8
10 9.4
55.6
+++
Not applic.
4
1.0
3
1.6 75.0
1
0.5 25.0
-
- -
1
2.7 25.0
1
1.1 25.0
1
0.8 25.0
1
1.1 25.0
-
- -
-
- -
4
1.2 100.0
-
- -
1
2.0 25.0
1
0.8 25.0
-
- -
2
1.9 50.0

Table 13.8: Community Lifestyle Services Council Performance
Community Safety
Total
Gender Age Group Home ownership Location
Male
Fe-
male
18-24
yrs
25-34
yrs
35-44
yrs
45-54
yrs
55-64
yrs
65 yrs
and
over
Rent
ing
Own
home Other Nth. Mid. Sth.
On-
line
Unweighted Base 406
100.0
191
47.0 100.0
215
53.0 100.0
5
1.2 100.0
37
9.1 100.0
93
22.9 100.0
123
30.3 100.0
93
22.9 100.0
55
13.5 100.0
61
15.0 100.0
335
82.5 100.0
10
2.5 100.0
50
12.3 100.0
125
30.8 100.0
125
30.8 100.0
106
26.1 100.0
Very good
25
6.2
10
5.2 40.0
15
7.0 60.0
-
- -
5
13.5 20.0
+
4
4.3 16.0
11
8.9 44.0
4
4.3 16.0
1
1.8 4.0
2
3.3 8.0
23
6.9 92.0
-
- -
2
4.0 8.0
10
8.0 40.0
10
8.0 40.0
3
2.8 12.0
-
Good
181
44.6
82
42.9
45.3
99
46.0
54.7
1
20.0
0.6
18
48.6
9.9
35
37.6
19.3
55
44.7
30.4
45
48.4
24.9
27
49.1
14.9
26
42.6
14.4
152
45.4
84.0
3
30.0
1.7
10
20.0
5.5 ---
67
53.6
37.0 ++
60
48.0
33.1
44
41.5
24.3
Fair only
126 31.0
64 33.5
50.8
62 28.8
49.2
2 40.0
1.6
11 29.7
8.7
30 32.3
23.8
37 30.1
29.4
29 31.2
23.0
17 30.9
13.5
23 37.7
18.3
100 29.9
79.4
3 30.0
2.4
26 52.0
20.6
+++
29 23.2
23.0
--
44 35.2
34.9
27 25.5
21.4
Poor
28
6.9
13
6.8 46.4
15
7.0 53.6
1
20.0 3.6
-
- -
10
10.8 35.7
+
8
6.5 28.6
5
5.4 17.9
4
7.3 14.3
5
8.2 17.9
21
6.3 75.0
2
20.0 7.1
6
12.0 21.4
8
6.4 28.6
6
4.8 21.4
8
7.5 28.6
Very poor
18
4.4
8
4.2
44.4
10
4.7
55.6
-
-
-
1
2.7
5.6
5
5.4
27.8
7
5.7
38.9
4
4.3
22.2
1
1.8
5.6
-
-
-
18
5.4
100.0 ++
-
-
-
4
8.0
22.2
3
2.4
16.7
2
1.6
11.1 -
9
8.5
50.0 ++
Don't know
25 6.2
12 6.3
48.0
13 6.0
52.0
1 20.0
4.0
1 2.7
4.0
8 8.6
32.0
5 4.1
20.0
6 6.5
24.0
4 7.3
16.0
5 8.2
20.0
18 5.4
72.0
2 20.0
8.0
2 4.0
8.0
7 5.6
28.0
3 2.4
12.0
--
13 12.3
52.0
+++
Not applic.
3
0.7
2
1.0 66.7
1
0.5 33.3
-
- -
1
2.7 33.3
1
1.1 33.3
-
- -
-
- -
1
1.8 33.3
-
- -
3
0.9 100.0
-
- -
-
- -
1
0.8 33.3
-
- -
2
1.9 66.7

Table 13.9: Community Lifestyle Services Council Performance
Community Service
Total
Gender Age Group Home ownership Location
Male
Fe-
male
18-24
yrs
25-34
yrs
35-44
yrs
45-54
yrs
55-64
yrs
65 yrs
and
over
Rent
ing
Own
home Other Nth. Mid. Sth.
On-
line
Unweighted Base 406
100.0
191
47.0 100.0
215
53.0 100.0
5
1.2 100.0
37
9.1 100.0
93
22.9 100.0
123
30.3 100.0
93
22.9 100.0
55
13.5 100.0
61
15.0 100.0
335
82.5 100.0
10
2.5 100.0
50
12.3 100.0
125
30.8 100.0
125
30.8 100.0
106
26.1 100.0
Very good
17
4.2
7
3.7 41.2
10
4.7 58.8
-
- -
3
8.1 17.6
2
2.2 11.8
5
4.1 29.4
2
2.2 11.8
5
9.1 29.4
+
1
1.6 5.9
16
4.8 94.1
-
- -
1
2.0 5.9
10
8.0 58.8
++
3
2.4 17.6
3
2.8 17.6
Good
161
39.7
78
40.8
48.4
83
38.6
51.6
1
20.0
0.6
11
29.7
6.8
37
39.8
23.0
50
40.7
31.1
40
43.0
24.8
22
40.0
13.7
26
42.6
16.1
131
39.1
81.4
4
40.0
2.5
9
18.0
5.6 ---
56
44.8
34.8
54
43.2
33.5
42
39.6
26.1
Fair only
133 32.8
63 33.0
47.4
70 32.6
52.6
2 40.0
1.5
15 40.5
11.3
30 32.3
22.6
41 33.3
30.8
31 33.3
23.3
14 25.5
10.5
23 37.7
17.3
108 32.2
81.2
2 20.0
1.5
24 48.0
18.0
++
35 28.0
26.3
42 33.6
31.6
32 30.2
24.1
Poor
37
9.1
15
7.9 40.5
22
10.2 59.5
1
20.0 2.7
3
8.1 8.1
9
9.7 24.3
8
6.5 21.6
9
9.7 24.3
7
12.7 18.9
4
6.6 10.8
32
9.6 86.5
1
10.0 2.7
10
20.0 27.0
+++
10
8.0 27.0
10
8.0 27.0
7
6.6 18.9
Very poor
15
3.7
6
3.1
40.0
9
4.2
60.0
-
-
-
1
2.7
6.7
5
5.4
33.3
4
3.3
26.7
3
3.2
20.0
2
3.6
13.3
-
-
-
14
4.2
93.3
1
10.0
6.7
4
8.0
26.7 +
3
2.4
20.0
1
0.8
6.7 --
7
6.6
46.7 +
Don't know
41 10.1
21 11.0
51.2
20 9.3
48.8
1 20.0
2.4
3 8.1
7.3
9 9.7
22.0
15 12.2
36.6
8 8.6
19.5
5 9.1
12.2
7 11.5
17.1
32 9.6
78.0
2 20.0
4.9
2 4.0
4.9
11 8.8
26.8
15 12.0
36.6
13 12.3
31.7
Not applic.
2
0.5
1
0.5 50.0
1
0.5 50.0
-
- -
1
2.7 50.0
++
1
1.1 50.0
-
- -
-
- -
-
- -
-
- -
2
0.6 100.0
-
- -
-
- -
-
- -
-
- -
2
1.9 100.0
++

Table 13.10: Community Lifestyle Services Council Performance
Pet/Animal Control
Total
Gender Age Group Home ownership Location
Male
Fe-
male
18-24
yrs
25-34
yrs
35-44
yrs
45-54
yrs
55-64
yrs
65 yrs
and
over
Rent
ing
Own
home Other Nth. Mid. Sth.
On-
line
Unweighted Base 406
100.0
191
47.0 100.0
215
53.0 100.0
5
1.2 100.0
37
9.1 100.0
93
22.9 100.0
123
30.3 100.0
93
22.9 100.0
55
13.5 100.0
61
15.0 100.0
335
82.5 100.0
10
2.5 100.0
50
12.3 100.0
125
30.8 100.0
125
30.8 100.0
106
26.1 100.0
Very good
18
4.4
9
4.7 50.0
9
4.2 50.0
-
- -
1
2.7 5.6
6
6.5 33.3
6
4.9 33.3
4
4.3 22.2
1
1.8 5.6
-
- -
18
5.4 100.0
++
-
- -
2
4.0 11.1
6
4.8 33.3
7
5.6 38.9
3
2.8 16.7
Good
145
35.7
62
32.5
42.8
83
38.6
57.2
1
20.0
0.7
17
45.9
11.7
32
34.4
22.1
47
38.2
32.4
32
34.4
22.1
16
29.1
11.0
19
31.1
13.1
124
37.0
85.5
2
20.0
1.4
5
10.0
3.4 ---
45
36.0
31.0
63
50.4
43.4 +++
32
30.2
22.1
Fair only
121 29.8
61 31.9
50.4
60 27.9
49.6
3 60.0
2.5
9 24.3
7.4
28 30.1
23.1
33 26.8
27.3
27 29.0
22.3
21 38.2
17.4
28 45.9
23.1
+++
89 26.6
73.6
---
4 40.0
3.3
25 50.0
20.7
+++
36 28.8
29.8
34 27.2
28.1
26 24.5
21.5
Poor
57
14.0
27
14.1 47.4
30
14.0 52.6
-
- -
6
16.2 10.5
14
15.1 24.6
14
11.4 24.6
16
17.2 28.1
7
12.7 12.3
6
9.8 10.5
51
15.2 89.5
-
- -
9
18.0 15.8
18
14.4 31.6
11
8.8 19.3
--
19
17.9 33.3
Very poor
43
10.6
19
9.9
44.2
24
11.2
55.8
-
-
-
2
5.4
4.7
8
8.6
18.6
18
14.6
41.9 +
9
9.7
20.9
6
10.9
14.0
3
4.9
7.0
38
11.3
88.4
2
20.0
4.7
8
16.0
18.6
12
9.6
27.9
4
3.2
9.3 ---
19
17.9
44.2 +++
Don't know
17 4.2
10 5.2
58.8
7 3.3
41.2
1 20.0
5.9
- -
-
5 5.4
29.4
4 3.3
23.5
5 5.4
29.4
2 3.6
11.8
4 6.6
23.5
11 3.3
64.7
--
2 20.0
11.8
1 2.0
5.9
5 4.0
29.4
5 4.0
29.4
6 5.7
35.3
Not applic.
5
1.2
3
1.6 60.0
2
0.9 40.0
-
- -
2
5.4 40.0
++
-
- -
1
0.8 20.0
-
- -
2
3.6 40.0
+
1
1.6 20.0
4
1.2 80.0
-
- -
-
- -
3
2.4 60.0
1
0.8 20.0
1
0.9 20.0

Table 13.11: Community Lifestyle Services Council Performance
Shopping Facilities
Total
Gender Age Group Home ownership Location
Male
Fe-
male
18-24
yrs
25-34
yrs
35-44
yrs
45-54
yrs
55-64
yrs
65 yrs
and
over
Rent
ing
Own
home Other Nth. Mid. Sth.
On-
line
Unweighted Base 406
100.0
191
47.0 100.0
215
53.0 100.0
5
1.2 100.0
37
9.1 100.0
93
22.9 100.0
123
30.3 100.0
93
22.9 100.0
55
13.5 100.0
61
15.0 100.0
335
82.5 100.0
10
2.5 100.0
50
12.3 100.0
125
30.8 100.0
125
30.8 100.0
106
26.1 100.0
Very good
31
7.6
10
5.2 32.3
-
21
9.8 67.7
+
-
- -
5
13.5 16.1
7
7.5 22.6
9
7.3 29.0
6
6.5 19.4
4
7.3 12.9
-
- -
30
9.0 96.8
++
1
10.0 3.2
1
2.0 3.2
11
8.8 35.5
11
8.8 35.5
8
7.5 25.8
Good
214
52.7
100
52.4
46.7
114
53.0
53.3
2
40.0
0.9
19
51.4
8.9
47
50.5
22.0
60
48.8
28.0
56
60.2
26.2 +
30
54.5
14.0
36
59.0
16.8
175
52.2
81.8
3
30.0
1.4
11
22.0
5.1 ---
79
63.2
36.9 +++
81
64.8
37.9 +++
43
40.6
20.1 ---
Fair only
95 23.4
48 25.1
50.5
47 21.9
49.5
2 40.0
2.1
6 16.2
6.3
24 25.8
25.3
34 27.6
35.8
19 20.4
20.0
10 18.2
10.5
16 26.2
16.8
75 22.4
78.9
4 40.0
4.2
18 36.0
18.9
++
25 20.0
26.3
27 21.6
28.4
25 23.6
26.3
Poor
29
7.1
13
6.8 44.8
16
7.4 55.2
1
20.0 3.4
5
13.5 17.2
5
5.4 17.2
9
7.3 31.0
4
4.3 13.8
5
9.1 17.2
7
11.5 24.1
22
6.6 75.9
-
- -
11
22.0 37.9
+++
7
5.6 24.1
3
2.4 10.3
--
8
7.5 27.6
Very poor
16
3.9
9
4.7
56.3
7
3.3
43.8
-
-
-
1
2.7
6.3
5
5.4
31.3
4
3.3
25.0
3
3.2
18.8
3
5.5
18.8
-
-
-
16
4.8
100.0 +
-
-
-
5
10.0
31.3 ++
1
0.8
6.3 --
3
2.4
18.8
7
6.6
43.8
Don't know
8 2.0
5 2.6
62.5
3 1.4
37.5
- -
-
- -
-
3 3.2
37.5
2 1.6
25.0
1 1.1
12.5
2 3.6
25.0
1 1.6
12.5
6 1.8
75.0
1 10.0
12.5
1 2.0
12.5
1 0.8
12.5
- -
-
6 5.7
75.0
+++
Not applic.
13
3.2
6
3.1 46.2
7
3.3 53.8
-
- -
1
2.7 7.7
2
2.2 15.4
5
4.1 38.5
4
4.3 30.8
1
1.8 7.7
1
1.6 7.7
11
3.3 84.6
1
10.0 7.7
3
6.0 23.1
1
0.8 7.7
-
-
- -
9
8.5 69.2
+++

Table 13.12: Community Lifestyle Services Council Performance
Community Development
Total
Gender Age Group Home ownership Location
Male
Fe-
male
18-24
yrs
25-34
yrs
35-44
yrs
45-54
yrs
55-64
yrs
65 yrs
and
over
Rent
ing
Own
home Other Nth. Mid. Sth.
On-
line
Unweighted Base 406
100.0
191
47.0 100.0
215
53.0 100.0
5
1.2 100.0
37
9.1 100.0
93
22.9 100.0
123
30.3 100.0
93
22.9 100.0
55
13.5 100.0
61
15.0 100.0
335
82.5 100.0
10
2.5 100.0
50
12.3 100.0
125
30.8 100.0
125
30.8 100.0
106
26.1 100.0
Very good
13
3.2
3
1.6 23.1
-
10
4.7 76.9
+
-
- -
1
2.7 7.7
4
4.3 30.8
5
4.1 38.5
1
1.1 7.7
2
3.6 15.4
1
1.6 7.7
12
3.6 92.3
-
- -
1
2.0 7.7
4
3.2 30.8
6
4.8 46.2
2
1.9 15.4
Good
157
38.7
77
40.3
49.0
80
37.2
51.0
1
20.0
0.6
12
32.4
7.6
30
32.3
19.1
53
43.1
33.8
43
46.2
27.4 +
18
32.7
11.5
17
27.9
10.8 -
137
40.9
87.3 ++
3
30.0
1.9
8
16.0
5.1 ---
60
48.0
38.2 ++
52
41.6
33.1
37
34.9
23.6
Fair only
133 32.8
63 33.0
47.4
70 32.6
52.6
2 40.0
1.5
16 43.2
12.0
35 37.6
26.3
35 28.5
26.3
23 24.7
17.3
-
22 40.0
16.5
27 44.3
20.3
++
101 30.1
75.9
--
5 50.0
3.8
17 34.0
12.8
44 35.2
33.1
44 35.2
33.1
28 26.4
21.1
Poor
33
8.1
14
7.3 42.4
19
8.8 57.6
-
- -
3
8.1 9.1
7
7.5 21.2
9
7.3 27.3
11
11.8 33.3
3
5.5 9.1
6
9.8 18.2
27
8.1 81.8
-
- -
10
20.0 30.3
+++
5
4.0 15.2
--
5
4.0 15.2
--
13
12.3 39.4
+
Very poor
24
5.9
12
6.3
50.0
12
5.6
50.0
1
20.0
4.2
1
2.7
4.2
7
7.5
29.2
10
8.1
41.7
3
3.2
12.5
2
3.6
8.3
3
4.9
12.5
20
6.0
83.3
1
10.0
4.2
8
16.0
33.3 +++
3
2.4
12.5 --
2
1.6
8.3 --
11
10.4
45.8 ++
Don't know
38 9.4
19 9.9
50.0
19 8.8
50.0
1 20.0
2.6
2 5.4
5.3
9 9.7
23.7
9 7.3
23.7
11 11.8
28.9
6 10.9
15.8
6 9.8
15.8
31 9.3
81.6
1 10.0
2.6
1 2.0
2.6
-
9 7.2
23.7
16 12.8
42.1
12 11.3
31.6
Not applic.
8
2.0
3
1.6 37.5
5
2.3 62.5
-
- -
2
5.4 25.0
1
1.1 12.5
2
1.6 25.0
1
1.1 12.5
2
3.6 25.0
1
1.6 12.5
7
2.1 87.5
-
- -
5
10.0 62.5
+++
-
- -
-
- -
3
2.8 37.5

Table 14.1: Managing the Shire/City Council Performance
Town Planning
Total
Gender Age Group Home ownership Location
Male
Fe-
male
18-24
yrs
25-34
yrs
35-44
yrs
45-54
yrs
55-64
yrs
65 yrs
and
over
Rent
ing
Own
home Other Nth. Mid. Sth.
On-
line
Unweighted Base 406
100.0
191
47.0 100.0
215
53.0 100.0
5
1.2 100.0
37
9.1 100.0
93
22.9 100.0
123
30.3 100.0
93
22.9 100.0
55
13.5 100.0
61
15.0 100.0
335
82.5 100.0
10
2.5 100.0
50
12.3 100.0
125
30.8 100.0
125
30.8 100.0
106
26.1 100.0
Very good
26
6.4
13
6.8 50.0
13
6.0 50.0
-
- -
3
8.1 11.5
4
4.3 15.4
11
8.9 42.3
5
5.4 19.2
3
5.5 11.5
3
4.9 11.5
23
6.9 88.5
-
- -
2
4.0 7.7
8
6.4 30.8
9
7.2 34.6
7
6.6 26.9
Good
154
37.9
70
36.6
45.5
84
39.1
54.5
2
40.0
1.3
15
40.5
9.7
36
38.7
23.4
42
34.1
27.3
36
38.7
23.4
23
41.8
14.9
24
39.3
15.6
128
38.2
83.1
2
20.0
1.3
14
28.0
9.1
45
36.0
29.2
62
49.6
40.3 +++
33
31.1
21.4 -
Fair only
140 34.5
69 36.1
49.3
71 33.0
50.7
1 20.0
0.7
12 32.4
8.6
32 34.4
22.9
50 40.7
35.7
+
27 29.0
19.3
18 32.7
12.9
23 37.7
16.4
112 33.4
80.0
5 50.0
3.6
23 46.0
16.4
+
50 40.0
35.7
35 28.0
25.0
-
32 30.2
22.9
Poor
36
8.9
17
8.9 47.2
19
8.8 52.8
-
- -
3
8.1 8.3
10
10.8 27.8
10
8.1 27.8
8
8.6 22.2
5
9.1 13.9
4
6.6 11.1
30
9.0 83.3
2
20.0 5.6
2
4.0 5.6
10
8.0 27.8
11
8.8 30.6
13
12.3 36.1
Very poor
25
6.2
14
7.3
56.0
11
5.1
44.0
1
20.0
4.0
2
5.4
8.0
5
5.4
20.0
8
6.5
32.0
7
7.5
28.0
2
3.6
8.0
5
8.2
20.0
20
6.0
80.0
-
-
-
7
14.0
28.0 ++
5
4.0
20.0
1
0.8
4.0 ---
12
11.3
48.0 ++
Don't know
24 5.9
7 3.7
29.2
-
17 7.9
70.8
+
1 20.0
4.2
1 2.7
4.2
6 6.5
25.0
2 1.6
8.3
--
10 10.8
41.7
++
4 7.3
16.7
2 3.3
8.3
21 6.3
87.5
1 10.0
4.2
1 2.0
4.2
7 5.6
29.2
7 5.6
29.2
9 8.5
37.5
Not applic.
1
0.2
1
0.5 100.0
-
- -
-
- -
1
2.7 100.0
+++
-
- -
-
- -
-
- -
-
- -
-
- -
1
0.3 100.0
-
- -
1
2.0 100.0
+++
-
- -
-
- -
-
- -

Table 14.2: Managing the Shire/City Council Performance
Building Control
Total
Gender Age Group Home ownership Location
Male
Fe-
male
18-24
yrs
25-34
yrs
35-44
yrs
45-54
yrs
55-64
yrs
65 yrs
and
over
Rent
ing
Own
home Other Nth. Mid. Sth.
On-
line
Unweighted Base 406
100.0
191
47.0 100.0
215
53.0 100.0
5
1.2 100.0
37
9.1 100.0
93
22.9 100.0
123
30.3 100.0
93
22.9 100.0
55
13.5 100.0
61
15.0 100.0
335
82.5 100.0
10
2.5 100.0
50
12.3 100.0
125
30.8 100.0
125
30.8 100.0
106
26.1 100.0
Very good
21
5.2
11
5.8 52.4
10
4.7 47.6
-
- -
2
5.4 9.5
5
5.4 23.8
8
6.5 38.1
3
3.2 14.3
3
5.5 14.3
1
1.6 4.8
20
6.0 95.2
-
- -
-
- -
7
5.6 33.3
10
8.0 47.6
+
4
3.8 19.0
Good
165
40.6
69
36.1
41.8 -
96
44.7
58.2 +
1
20.0
0.6
17
45.9
10.3
42
45.2
25.5
39
31.7
23.6 --
42
45.2
25.5
24
43.6
14.5
26
42.6
15.8
137
40.9
83.0
2
20.0
1.2
12
24.0
7.3 --
54
43.2
32.7
54
43.2
32.7
45
42.5
27.3
Fair only
137 33.7
75 39.3
54.7
++
62 28.8
45.3
--
2 40.0
1.5
11 29.7
8.0
26 28.0
19.0
50 40.7
36.5
+
28 30.1
20.4
20 36.4
14.6
22 36.1
16.1
109 32.5
79.6
6 60.0
4.4
28 56.0
20.4
+++
41 32.8
29.9
45 36.0
32.8
23 21.7
16.8
---
Poor
35
8.6
15
7.9 42.9
20
9.3 57.1
1
20.0 2.9
2
5.4 5.7
9
9.7 25.7
14
11.4 40.0
5
5.4 14.3
4
7.3 11.4
2
3.3 5.7
32
9.6 91.4
1
10.0 2.9
5
10.0 14.3
9
7.2 25.7
11
8.8 31.4
10
9.4 28.6
Very poor
18
4.4
11
5.8
61.1
7
3.3
38.9
-
-
-
2
5.4
11.1
5
5.4
27.8
7
5.7
38.9
4
4.3
22.2
-
-
-
5
8.2
27.8
13
3.9
72.2
-
-
-
3
6.0
16.7
5
4.0
27.8
1
0.8
5.6 --
9
8.5
50.0 ++
Don't know
29 7.1
9 4.7
31.0
-
20 9.3
69.0
+
1 20.0
3.4
2 5.4
6.9
6 6.5
20.7
5 4.1
17.2
11 11.8
37.9
++
4 7.3
13.8
5 8.2
17.2
23 6.9
79.3
1 10.0
3.4
1 2.0
3.4
9 7.2
31.0
4 3.2
13.8
--
15 14.2
51.7
+++
Not applic.
1
0.2
1
0.5 100.0
-
- -
-
- -
1
2.7 100.0
+++
-
- -
-
- -
-
- -
-
- -
-
- -
1
0.3 100.0
-
- -
1
2.0 100.0
+++
-
- -
-
- -
-
- -

Table 14.3: Managing the Shire/City Council Performance
Economic Development /Local Employment
Total
Gender Age Group Home ownership Location
Male
Fe-
male
18-24
yrs
25-34
yrs
35-44
yrs
45-54
yrs
55-64
yrs
65 yrs
and
over
Rent
ing
Own
home Other Nth. Mid. Sth.
On-
line
Unweighted Base 406
100.0
191
47.0 100.0
215
53.0 100.0
5
1.2 100.0
37
9.1 100.0
93
22.9 100.0
123
30.3 100.0
93
22.9 100.0
55
13.5 100.0
61
15.0 100.0
335
82.5 100.0
10
2.5 100.0
50
12.3 100.0
125
30.8 100.0
125
30.8 100.0
106
26.1 100.0
Very good
12
3.0
4
2.1 33.3
8
3.7 66.7
-
- -
1
2.7 8.3
4
4.3 33.3
2
1.6 16.7
4
4.3 33.3
1
1.8 8.3
-
- -
12
3.6 100.0
-
- -
-
- -
3
2.4 25.0
7
5.6 58.3
++
2
1.9 16.7
Good
128
31.5
53
27.7
41.4
75
34.9
58.6
1
20.0
0.8
9
24.3
7.0
30
32.3
23.4
40
32.5
31.3
30
32.3
23.4
18
32.7
14.1
19
31.1
14.8
107
31.9
83.6
2
20.0
1.6
13
26.0
10.2
37
29.6
28.9
48
38.4
37.5 ++
30
28.3
23.4
Fair only
136 33.5
65 34.0
47.8
71 33.0
52.2
2 40.0
1.5
16 43.2
11.8
26 28.0
19.1
41 33.3
30.1
30 32.3
22.1
21 38.2
15.4
23 37.7
16.9
110 32.8
80.9
3 30.0
2.2
19 38.0
14.0
45 36.0
33.1
40 32.0
29.4
32 30.2
23.5
Poor
74
18.2
36
18.8 48.6
38
17.7 51.4
2
40.0 2.7
5
13.5 6.8
21
22.6 28.4
23
18.7 31.1
16
17.2 21.6
7
12.7 9.5
11
18.0 14.9
59
17.6 79.7
4
40.0 5.4
13
26.0 17.6
26
20.8 35.1
15
12.0 20.3
--
20
18.9 27.0
Very poor
27
6.7
18
9.4
66.7 ++
9
4.2
33.3 --
-
-
-
3
8.1
11.1
9
9.7
33.3
10
8.1
37.0
3
3.2
11.1
2
3.6
7.4
4
6.6
14.8
22
6.6
81.5
1
10.0
3.7
2
4.0
7.4
6
4.8
22.2
6
4.8
22.2
13
12.3
48.1 +++
Don't know
26 6.4
13 6.8
50.0
13 6.0
50.0
- -
-
1 2.7
3.8
3 3.2
11.5
6 4.9
23.1
10 10.8
38.5
+
6 10.9
23.1
4 6.6
15.4
22 6.6
84.6
- -
-
2 4.0
7.7
8 6.4
30.8
9 7.2
34.6
7 6.6
26.9
Not applic.
3
0.7
2
1.0 66.7
1
0.5 33.3
-
- -
2
5.4 66.7
+++
-
- -
1
0.8 33.3
-
- -
-
- -
-
- -
3
0.9 100.0
-
- -
1
2.0 33.3
-
- -
-
- -
2
1.9 66.7

Table 14.4: Managing the Shire/City Council Performance
Development of Tourism
Total
Gender Age Group Home ownership Location
Male
Fe-
male
18-24
yrs
25-34
yrs
35-44
yrs
45-54
yrs
55-64
yrs
65 yrs
and
over
Rent
ing
Own
home Other Nth. Mid. Sth.
On-
line
Unweighted Base 406
100.0
191
47.0 100.0
215
53.0 100.0
5
1.2 100.0
37
9.1 100.0
93
22.9 100.0
123
30.3 100.0
93
22.9 100.0
55
13.5 100.0
61
15.0 100.0
335
82.5 100.0
10
2.5 100.0
50
12.3 100.0
125
30.8 100.0
125
30.8 100.0
106
26.1 100.0
Very good
37
9.1
13
6.8 35.1
24
11.2 64.9
-
- -
6
16.2 16.2
6
6.5 16.2
10
8.1 27.0
10
10.8 27.0
5
9.1 13.5
3
4.9 8.1
34
10.1 91.9
-
- -
1
2.0 2.7
-
17
13.6 45.9
++
17
13.6 45.9
++
2
1.9 5.4
---
Good
160
39.4
71
37.2
44.4
89
41.4
55.6
1
20.0
0.6
12
32.4
7.5
38
40.9
23.8
45
36.6
28.1
38
40.9
23.8
26
47.3
16.3
24
39.3
15.0
133
39.7
83.1
3
30.0
1.9
11
22.0
6.9 ---
54
43.2
33.8
50
40.0
31.3
45
42.5
28.1
Fair only
128 31.5
61 31.9
47.7
67 31.2
52.3
2 40.0
1.6
14 37.8
10.9
34 36.6
26.6
38 30.9
29.7
25 26.9
19.5
15 27.3
11.7
23 37.7
18.0
100 29.9
78.1
5 50.0
3.9
17 34.0
13.3
37 29.6
28.9
41 32.8
32.0
33 31.1
25.8
Poor
42
10.3
24
12.6 57.1
18
8.4 42.9
1
20.0 2.4
3
8.1 7.1
7
7.5 16.7
16
13.0 38.1
11
11.8 26.2
4
7.3 9.5
7
11.5 16.7
34
10.1 81.0
1
10.0 2.4
11
22.0 26.2
+++
12
9.6 28.6
9
7.2 21.4
10
9.4 23.8
Very poor
22
5.4
14
7.3
63.6
8
3.7
36.4
-
-
-
-
-
-
5
5.4
22.7
10
8.1
45.5
4
4.3
18.2
3
5.5
13.6
2
3.3
9.1
20
6.0
90.9
-
-
-
6
12.0
27.3 ++
3
2.4
13.6 -
3
2.4
13.6 -
10
9.4
45.5 ++
Don't know
13 3.2
6 3.1
46.2
7 3.3
53.8
1 20.0
7.7
- -
-
2 2.2
15.4
3 2.4
23.1
5 5.4
38.5
2 3.6
15.4
1 1.6
7.7
11 3.3
84.6
1 10.0
7.7
2 4.0
15.4
2 1.6
15.4
5 4.0
38.5
4 3.8
30.8
Not applic.
4
1.0
2
1.0 50.0
2
0.9 50.0
-
- -
2
5.4 50.0
+++
1
1.1 25.0
1
0.8 25.0
-
- -
-
- -
1
1.6 25.0
3
0.9 75.0
-
- -
2
4.0 50.0
++
-
- -
-
- -
2
1.9 50.0

Table 14.5: Managing the Shire/City Council Performance
Financial Management
Total
Gender Age Group Home ownership Location
Male
Fe-
male
18-24
yrs
25-34
yrs
35-44
yrs
45-54
yrs
55-64
yrs
65 yrs
and
over
Rent
ing
Own
home Other Nth. Mid. Sth.
On-
line
Unweighted Base 406
100.0
191
47.0 100.0
215
53.0 100.0
5
1.2 100.0
37
9.1 100.0
93
22.9 100.0
123
30.3 100.0
93
22.9 100.0
55
13.5 100.0
61
15.0 100.0
335
82.5 100.0
10
2.5 100.0
50
12.3 100.0
125
30.8 100.0
125
30.8 100.0
106
26.1 100.0
Very good
34
8.4
19
9.9 55.9
15
7.0 44.1
-
- -
3
8.1 8.8
6
6.5 17.6
12
9.8 35.3
9
9.7 26.5
4
7.3 11.8
1
1.6 2.9
--
32
9.6 94.1
+
1
10.0 2.9
2
4.0 5.9
9
7.2 26.5
9
7.2 26.5
14
13.2 41.2
++
Good
136
33.5
54
28.3
39.7 --
82
38.1
60.3 ++
2
40.0
1.5
12
32.4
8.8
28
30.1
20.6
36
29.3
26.5
37
39.8
27.2
21
38.2
15.4
22
36.1
16.2
113
33.7
83.1
1
10.0
0.7
12
24.0
8.8
42
33.6
30.9
48
38.4
35.3
34
32.1
25.0
Fair only
104 25.6
53 27.7
51.0
51 23.7
49.0
1 20.0
1.0
15 40.5
14.4
++
27 29.0
26.0
32 26.0
30.8
18 19.4
17.3
11 20.0
10.6
18 29.5
17.3
82 24.5
78.8
4 40.0
3.8
14 28.0
13.5
30 24.0
28.8
36 28.8
34.6
24 22.6
23.1
Poor
34
8.4
17
8.9 50.0
17
7.9 50.0
1
20.0 2.9
2
5.4 5.9
7
7.5 20.6
16
13.0 47.1
++
6
6.5 17.6
2
3.6 5.9
7
11.5 20.6
26
7.8 76.5
1
10.0 2.9
9
18.0 26.5
+++
7
5.6 20.6
8
6.4 23.5
10
9.4 29.4
Very poor
24
5.9
15
7.9
62.5
9
4.2
37.5
-
-
-
1
2.7
4.2
8
8.6
33.3
7
5.7
29.2
4
4.3
16.7
4
7.3
16.7
1
1.6
4.2
22
6.6
91.7
1
10.0
4.2
7
14.0
29.2 +++
5
4.0
20.8
3
2.4
12.5 --
9
8.5
37.5
Don't know
70 17.2
30 15.7
42.9
40 18.6
57.1
1 20.0
1.4
2 5.4
2.9
--
17 18.3
24.3
18 14.6
25.7
19 20.4
27.1
13 23.6
18.6
12 19.7
17.1
56 16.7
80.0
2 20.0
2.9
4 8.0
5.7
-
32 25.6
45.7
+++
21 16.8
30.0
13 12.3
18.6
Not applic.
4
1.0
3
1.6 75.0
1
0.5 25.0
-
- -
2
5.4 50.0
+++
-
- -
2
1.6 50.0
-
- -
-
- -
-
- -
4
1.2 100.0
-
- -
2
4.0 50.0
++
-
- -
-
- -
2
1.9 50.0

Table 14.6: Managing the Shire/City Council Performance
Revenue-Raising
Total
Gender Age Group Home ownership Location
Male
Fe-
male
18-24
yrs
25-34
yrs
35-44
yrs
45-54
yrs
55-64
yrs
65 yrs
and
over
Rent
ing
Own
home Other Nth. Mid. Sth.
On-
line
Unweighted Base 406
100.0
191
47.0 100.0
215
53.0 100.0
5
1.2 100.0
37
9.1 100.0
93
22.9 100.0
123
30.3 100.0
93
22.9 100.0
55
13.5 100.0
61
15.0 100.0
335
82.5 100.0
10
2.5 100.0
50
12.3 100.0
125
30.8 100.0
125
30.8 100.0
106
26.1 100.0
Very good
21
5.2
8
4.2 38.1
13
6.0 61.9
-
- -
2
5.4 9.5
4
4.3 19.0
7
5.7 33.3
5
5.4 23.8
3
5.5 14.3
3
4.9 14.3
17
5.1 81.0
1
10.0 4.8
-
- -
5
4.0 23.8
7
5.6 33.3
9
8.5 42.9
+
Good
130
32.0
60
31.4
46.2
70
32.6
53.8
1
20.0
0.8
10
27.0
7.7
29
31.2
22.3
39
31.7
30.0
35
37.6
26.9
16
29.1
12.3
18
29.5
13.8
109
32.5
83.8
3
30.0
2.3
13
26.0
10.0
34
27.2
26.2
47
37.6
36.2
36
34.0
27.7
Fair only
127 31.3
65 34.0
51.2
62 28.8
48.8
2 40.0
1.6
14 37.8
11.0
31 33.3
24.4
38 30.9
29.9
23 24.7
18.1
19 34.5
15.0
19 31.1
15.0
106 31.6
83.5
2 20.0
1.6
15 30.0
11.8
43 34.4
33.9
44 35.2
34.6
25 23.6
19.7
--
Poor
46
11.3
23
12.0 50.0
23
10.7 50.0
1
20.0 2.2
5
13.5 10.9
11
11.8 23.9
16
13.0 34.8
8
8.6 17.4
5
9.1 10.9
8
13.1 17.4
36
10.7 78.3
2
20.0 4.3
11
22.0 23.9
++
12
9.6 26.1
15
12.0 32.6
8
7.5 17.4
Very poor
25
6.2
11
5.8
44.0
14
6.5
56.0
-
-
-
2
5.4
8.0
5
5.4
20.0
11
8.9
44.0
5
5.4
20.0
2
3.6
8.0
2
3.3
8.0
23
6.9
92.0
-
-
-
8
16.0
32.0 +++
5
4.0
20.0
3
2.4
12.0 --
9
8.5
36.0
Don't know
53 13.1
21 11.0
39.6
32 14.9
60.4
1 20.0
1.9
2 5.4
3.8
13 14.0
24.5
10 8.1
18.9
-
17 18.3
32.1
+
10 18.2
18.9
11 18.0
20.8
40 11.9
75.5
2 20.0
3.8
1 2.0
1.9
--
26 20.8
49.1
+++
9 7.2
17.0
--
17 16.0
32.1
Not applic.
4
1.0
3
1.6 75.0
1
0.5 25.0
-
- -
2
5.4 50.0
+++
-
- -
2
1.6 50.0
-
- -
-
- -
-
- -
4
1.2 100.0
-
- -
2
4.0 50.0
++
-
- -
-
- -
2
1.9 50.0
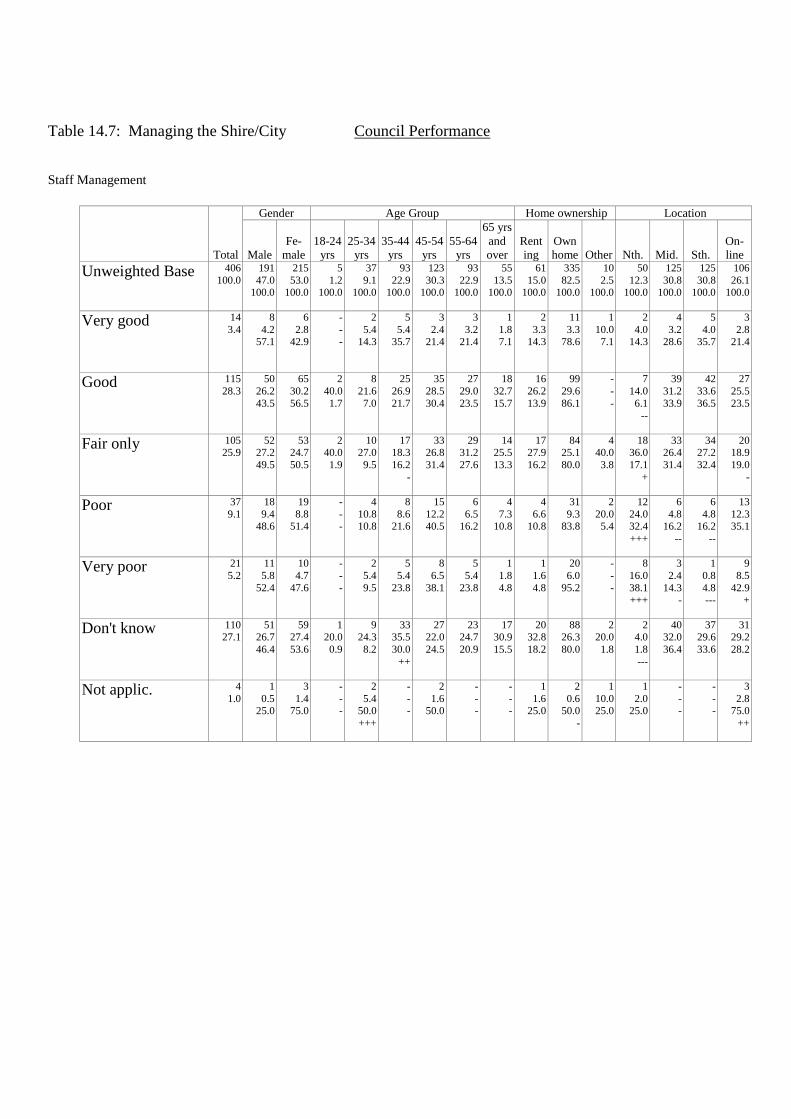
Table 14.7: Managing the Shire/City Council Performance
Staff Management
Total
Gender Age Group Home ownership Location
Male
Fe-
male
18-24
yrs
25-34
yrs
35-44
yrs
45-54
yrs
55-64
yrs
65 yrs
and
over
Rent
ing
Own
home Other Nth. Mid. Sth.
On-
line
Unweighted Base 406
100.0
191
47.0 100.0
215
53.0 100.0
5
1.2 100.0
37
9.1 100.0
93
22.9 100.0
123
30.3 100.0
93
22.9 100.0
55
13.5 100.0
61
15.0 100.0
335
82.5 100.0
10
2.5 100.0
50
12.3 100.0
125
30.8 100.0
125
30.8 100.0
106
26.1 100.0
Very good
14
3.4
8
4.2 57.1
6
2.8 42.9
-
- -
2
5.4 14.3
5
5.4 35.7
3
2.4 21.4
3
3.2 21.4
1
1.8 7.1
2
3.3 14.3
11
3.3 78.6
1
10.0 7.1
2
4.0 14.3
4
3.2 28.6
5
4.0 35.7
3
2.8 21.4
Good
115
28.3
50
26.2
43.5
65
30.2
56.5
2
40.0
1.7
8
21.6
7.0
25
26.9
21.7
35
28.5
30.4
27
29.0
23.5
18
32.7
15.7
16
26.2
13.9
99
29.6
86.1
-
-
-
7
14.0
6.1 --
39
31.2
33.9
42
33.6
36.5
27
25.5
23.5
Fair only
105 25.9
52 27.2
49.5
53 24.7
50.5
2 40.0
1.9
10 27.0
9.5
17 18.3
16.2
-
33 26.8
31.4
29 31.2
27.6
14 25.5
13.3
17 27.9
16.2
84 25.1
80.0
4 40.0
3.8
18 36.0
17.1
+
33 26.4
31.4
34 27.2
32.4
20 18.9
19.0
-
Poor
37
9.1
18
9.4 48.6
19
8.8 51.4
-
- -
4
10.8 10.8
8
8.6 21.6
15
12.2 40.5
6
6.5 16.2
4
7.3 10.8
4
6.6 10.8
31
9.3 83.8
2
20.0 5.4
12
24.0 32.4
+++
6
4.8 16.2
--
6
4.8 16.2
--
13
12.3 35.1
Very poor
21
5.2
11
5.8
52.4
10
4.7
47.6
-
-
-
2
5.4
9.5
5
5.4
23.8
8
6.5
38.1
5
5.4
23.8
1
1.8
4.8
1
1.6
4.8
20
6.0
95.2
-
-
-
8
16.0
38.1 +++
3
2.4
14.3 -
1
0.8
4.8 ---
9
8.5
42.9 +
Don't know
110 27.1
51 26.7
46.4
59 27.4
53.6
1 20.0
0.9
9 24.3
8.2
33 35.5
30.0
++
27 22.0
24.5
23 24.7
20.9
17 30.9
15.5
20 32.8
18.2
88 26.3
80.0
2 20.0
1.8
2 4.0
1.8
---
40 32.0
36.4
37 29.6
33.6
31 29.2
28.2
Not applic.
4
1.0
1
0.5 25.0
3
1.4 75.0
-
- -
2
5.4 50.0
+++
-
- -
2
1.6 50.0
-
- -
-
- -
1
1.6 25.0
2
0.6 50.0
-
1
10.0 25.0
1
2.0 25.0
-
- -
-
- -
3
2.8 75.0
++

Table 15.1: Customer Services and Communication Council Performance
Customer Service
Total
Gender Age Group Home ownership Location
Male
Fe-
male
18-24
yrs
25-34
yrs
35-44
yrs
45-54
yrs
55-64
yrs
65 yrs
and
over
Rent
ing
Own
home Other Nth. Mid. Sth.
On-
line
Unweighted Base 406
100.0
191
47.0 100.0
215
53.0 100.0
5
1.2 100.0
37
9.1 100.0
93
22.9 100.0
123
30.3 100.0
93
22.9 100.0
55
13.5 100.0
61
15.0 100.0
335
82.5 100.0
10
2.5 100.0
50
12.3 100.0
125
30.8 100.0
125
30.8 100.0
106
26.1 100.0
Very good
58
14.3
30
15.7 51.7
28
13.0 48.3
1
20.0 1.7
4
10.8 6.9
15
16.1 25.9
16
13.0 27.6
13
14.0 22.4
9
16.4 15.5
5
8.2 8.6
51
15.2 87.9
2
20.0 3.4
-
- -
24
19.2 41.4
+
20
16.0 34.5
14
13.2 24.1
Good
195
48.0
89
46.6
45.6
106
49.3
54.4
3
60.0
1.5
17
45.9
8.7
46
49.5
23.6
55
44.7
28.2
48
51.6
24.6
26
47.3
13.3
27
44.3
13.8
164
49.0
84.1
4
40.0
2.1
26
52.0
13.3
63
50.4
32.3
55
44.0
28.2
51
48.1
26.2
Fair only
97 23.9
42 22.0
43.3
55 25.6
56.7
- -
-
11 29.7
11.3
16 17.2
16.5
-
34 27.6
35.1
23 24.7
23.7
13 23.6
13.4
17 27.9
17.5
77 23.0
79.4
3 30.0
3.1
17 34.0
17.5
+
23 18.4
23.7
-
34 27.2
35.1
23 21.7
23.7
Poor
28
6.9
14
7.3 50.0
14
6.5 50.0
-
- -
2
5.4 7.1
6
6.5 21.4
10
8.1 35.7
5
5.4 17.9
5
9.1 17.9
5
8.2 17.9
23
6.9 82.1
-
- -
4
8.0 14.3
7
5.6 25.0
10
8.0 35.7
7
6.6 25.0
Very poor
13
3.2
8
4.2
61.5
5
2.3
38.5
-
-
-
-
-
-
5
5.4
38.5
3
2.4
23.1
4
4.3
30.8
1
1.8
7.7
-
-
-
13
3.9
100.0 +
-
-
-
2
4.0
15.4
4
3.2
30.8
2
1.6
15.4
5
4.7
38.5
Don't know
13 3.2
8 4.2
61.5
5 2.3
38.5
1 20.0
7.7
2 5.4
15.4
4 4.3
30.8
5 4.1
38.5
- -
-
1 1.8
7.7
6 9.8
46.2
+++
6 1.8
46.2
---
1 10.0
7.7
1 2.0
7.7
4 3.2
30.8
4 3.2
30.8
4 3.8
30.8
Not applic.
2
0.5
-
- -
2
0.9 100.0
-
- -
1
2.7 50.0
++
1
1.1 50.0
-
- -
-
- -
-
- -
1
1.6 50.0
1
0.3 50.0
-
- -
-
- -
-
- -
-
- -
2
1.9 100.0
++

Table 15.2: Customer Services and Communication Council Performance
Information Services
Total
Gender Age Group Home ownership Location
Male
Fe-
male
18-24
yrs
25-34
yrs
35-44
yrs
45-54
yrs
55-64
yrs
65 yrs
and
over
Rent
ing
Own
home Other Nth. Mid. Sth.
On-
line
Unweighted Base 406
100.0
191
47.0 100.0
215
53.0 100.0
5
1.2 100.0
37
9.1 100.0
93
22.9 100.0
123
30.3 100.0
93
22.9 100.0
55
13.5 100.0
61
15.0 100.0
335
82.5 100.0
10
2.5 100.0
50
12.3 100.0
125
30.8 100.0
125
30.8 100.0
106
26.1 100.0
Very good
28
6.9
14
7.3 50.0
14
6.5 50.0
-
- -
4
10.8 14.3
2
2.2 7.1
--
12
9.8 42.9
5
5.4 17.9
5
9.1 17.9
2
3.3 7.1
26
7.8 92.9
-
- -
1
2.0 3.6
12
9.6 42.9
7
5.6 25.0
8
7.5 28.6
Good
180
44.3
78
40.8
43.3
102
47.4
56.7
2
40.0
1.1
17
45.9
9.4
44
47.3
24.4
51
41.5
28.3
40
43.0
22.2
26
47.3
14.4
23
37.7
12.8
152
45.4
84.4
5
50.0
2.8
9
18.0
5.0 ---
69
55.2
38.3 +++
55
44.0
30.6
47
44.3
26.1
Fair only
140 34.5
67 35.1
47.9
73 34.0
52.1
2 40.0
1.4
12 32.4
8.6
34 36.6
24.3
42 34.1
30.0
33 35.5
23.6
17 30.9
12.1
26 42.6
18.6
110 32.8
78.6
4 40.0
2.9
28 56.0
20.0
+++
33 26.4
23.6
--
50 40.0
35.7
29 27.4
20.7
-
Poor
31
7.6
14
7.3 45.2
17
7.9 54.8
-
- -
-
- -
7
7.5 22.6
12
9.8 38.7
6
6.5 19.4
6
10.9 19.4
5
8.2 16.1
26
7.8 83.9
-
- -
8
16.0 25.8
++
6
4.8 19.4
9
7.2 29.0
8
7.5 25.8
Very poor
11
2.7
8
4.2
72.7 +
3
1.4
27.3 -
-
-
-
-
-
-
3
3.2
27.3
3
2.4
27.3
4
4.3
36.4
1
1.8
9.1
2
3.3
18.2
9
2.7
81.8
-
-
-
3
6.0
27.3
2
1.6
18.2
2
1.6
18.2
4
3.8
36.4
Don't know
15 3.7
10 5.2
66.7
5 2.3
33.3
1 20.0
6.7
3 8.1
20.0
3 3.2
20.0
3 2.4
20.0
5 5.4
33.3
- -
-
3 4.9
20.0
11 3.3
73.3
1 10.0
6.7
1 2.0
6.7
3 2.4
20.0
2 1.6
13.3
9 8.5
60.0
+++
Not applic.
1
0.2
-
- -
1
0.5 100.0
-
- -
1
2.7 100.0
+++
-
- -
-
- -
-
- -
-
- -
-
- -
1
0.3 100.0
-
- -
-
- -
-
- -
-
- -
1
0.9 100.0
+
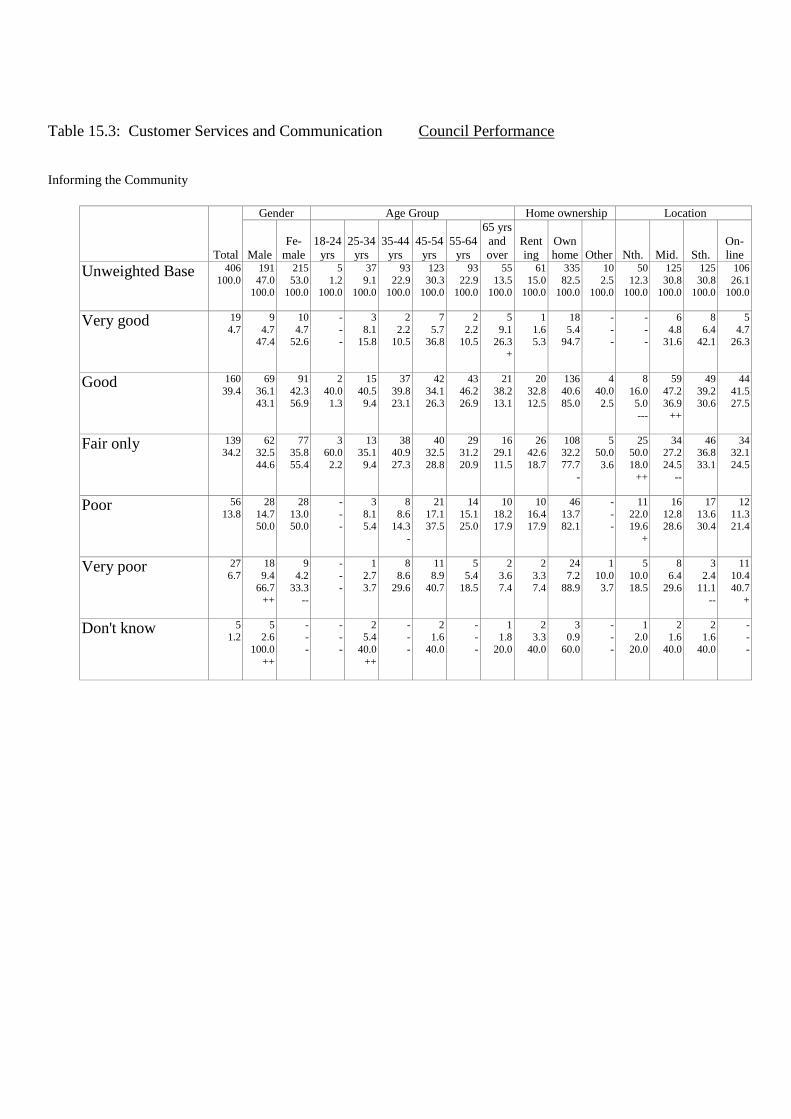
Table 15.3: Customer Services and Communication Council Performance
Informing the Community
Total
Gender Age Group Home ownership Location
Male
Fe-
male
18-24
yrs
25-34
yrs
35-44
yrs
45-54
yrs
55-64
yrs
65 yrs
and
over
Rent
ing
Own
home Other Nth. Mid. Sth.
On-
line
Unweighted Base 406
100.0
191
47.0 100.0
215
53.0 100.0
5
1.2 100.0
37
9.1 100.0
93
22.9 100.0
123
30.3 100.0
93
22.9 100.0
55
13.5 100.0
61
15.0 100.0
335
82.5 100.0
10
2.5 100.0
50
12.3 100.0
125
30.8 100.0
125
30.8 100.0
106
26.1 100.0
Very good
19
4.7
9
4.7 47.4
10
4.7 52.6
-
- -
3
8.1 15.8
2
2.2 10.5
7
5.7 36.8
2
2.2 10.5
5
9.1 26.3
+
1
1.6 5.3
18
5.4 94.7
-
- -
-
- -
6
4.8 31.6
8
6.4 42.1
5
4.7 26.3
Good
160
39.4
69
36.1
43.1
91
42.3
56.9
2
40.0
1.3
15
40.5
9.4
37
39.8
23.1
42
34.1
26.3
43
46.2
26.9
21
38.2
13.1
20
32.8
12.5
136
40.6
85.0
4
40.0
2.5
8
16.0
5.0 ---
59
47.2
36.9 ++
49
39.2
30.6
44
41.5
27.5
Fair only
139 34.2
62 32.5
44.6
77 35.8
55.4
3 60.0
2.2
13 35.1
9.4
38 40.9
27.3
40 32.5
28.8
29 31.2
20.9
16 29.1
11.5
26 42.6
18.7
108 32.2
77.7
-
5 50.0
3.6
25 50.0
18.0
++
34 27.2
24.5
--
46 36.8
33.1
34 32.1
24.5
Poor
56
13.8
28
14.7 50.0
28
13.0 50.0
-
- -
3
8.1 5.4
8
8.6 14.3
-
21
17.1 37.5
14
15.1 25.0
10
18.2 17.9
10
16.4 17.9
46
13.7 82.1
-
- -
11
22.0 19.6
+
16
12.8 28.6
17
13.6 30.4
12
11.3 21.4
Very poor
27
6.7
18
9.4
66.7 ++
9
4.2
33.3 --
-
-
-
1
2.7
3.7
8
8.6
29.6
11
8.9
40.7
5
5.4
18.5
2
3.6
7.4
2
3.3
7.4
24
7.2
88.9
1
10.0
3.7
5
10.0
18.5
8
6.4
29.6
3
2.4
11.1 --
11
10.4
40.7 +
Don't know
5 1.2
5 2.6
100.0
++
- -
-
- -
-
2 5.4
40.0
++
- -
-
2 1.6
40.0
- -
-
1 1.8
20.0
2 3.3
40.0
3 0.9
60.0
- -
-
1 2.0
20.0
2 1.6
40.0
2 1.6
40.0
- -
-

Table 15.4: Customer Services and Communication Council Performance
Consulting the Community
Total
Gender Age Group Home ownership Location
Male
Fe-
male
18-24
yrs
25-34
yrs
35-44
yrs
45-54
yrs
55-64
yrs
65 yrs
and
over
Rent
ing
Own
home Other Nth. Mid. Sth.
On-
line
Unweighted Base 406
100.0
191
47.0 100.0
215
53.0 100.0
5
1.2 100.0
37
9.1 100.0
93
22.9 100.0
123
30.3 100.0
93
22.9 100.0
55
13.5 100.0
61
15.0 100.0
335
82.5 100.0
10
2.5 100.0
50
12.3 100.0
125
30.8 100.0
125
30.8 100.0
106
26.1 100.0
Very good
17
4.2
8
4.2 47.1
9
4.2 52.9
-
- -
2
5.4 11.8
1
1.1 5.9
-
10
8.1 58.8
+++
1
1.1 5.9
-
3
5.5 17.6
1
1.6 5.9
16
4.8 94.1
-
- -
1
2.0 5.9
3
2.4 17.6
9
7.2 52.9
++
4
3.8 23.5
Good
101
24.9
46
24.1
45.5
55
25.6
54.5
2
40.0
2.0
9
24.3
8.9
23
24.7
22.8
22
17.9
21.8 --
29
31.2
28.7
16
29.1
15.8
12
19.7
11.9
87
26.0
86.1
2
20.0
2.0
4
8.0
4.0 ---
35
28.0
34.7
33
26.4
32.7
29
27.4
28.7
Fair only
152 37.4
61 31.9
40.1
--
91 42.3
59.9
++
1 20.0
0.7
15 40.5
9.9
40 43.0
26.3
45 36.6
29.6
33 35.5
21.7
18 32.7
11.8
24 39.3
15.8
124 37.0
81.6
4 40.0
2.6
20 40.0
13.2
51 40.8
33.6
46 36.8
30.3
35 33.0
23.0
Poor
82
20.2
45
23.6 54.9
37
17.2 45.1
1
20.0 1.2
6
16.2 7.3
17
18.3 20.7
28
22.8 34.1
20
21.5 24.4
10
18.2 12.2
14
23.0 17.1
66
19.7 80.5
2
20.0 2.4
16
32.0 19.5
++
20
16.0 24.4
27
21.6 32.9
19
17.9 23.2
Very poor
42
10.3
24
12.6
57.1
18
8.4
42.9
-
-
-
4
10.8
9.5
11
11.8
26.2
15
12.2
35.7
7
7.5
16.7
5
9.1
11.9
6
9.8
14.3
35
10.4
83.3
1
10.0
2.4
9
18.0
21.4 +
11
8.8
26.2
6
4.8
14.3 --
16
15.1
38.1 +
Don't know
12 3.0
7 3.7
58.3
5 2.3
41.7
1 20.0
8.3
1 2.7
8.3
1 1.1
8.3
3 2.4
25.0
3 3.2
25.0
3 5.5
25.0
4 6.6
33.3
+
7 2.1
58.3
--
1 10.0
8.3
- -
-
5 4.0
41.7
4 3.2
33.3
3 2.8
25.0

Table 15.5: Customer Services and Communication Council Performance
Responding to the Community
Total
Gender Age Group Home ownership Location
Male
Fe-
male
18-24
yrs
25-34
yrs
35-44
yrs
45-54
yrs
55-64
yrs
65 yrs
and
over
Rent
ing
Own
home Other Nth. Mid. Sth.
On-
line
Unweighted Base 406
100.0
191
47.0 100.0
215
53.0 100.0
5
1.2 100.0
37
9.1 100.0
93
22.9 100.0
123
30.3 100.0
93
22.9 100.0
55
13.5 100.0
61
15.0 100.0
335
82.5 100.0
10
2.5 100.0
50
12.3 100.0
125
30.8 100.0
125
30.8 100.0
106
26.1 100.0
Very good
16
3.9
9
4.7 56.3
7
3.3 43.8
-
- -
2
5.4 12.5
3
3.2 18.8
8
6.5 50.0
+
2
2.2 12.5
1
1.8 6.3
-
- -
15
4.5 93.8
1
10.0 6.3
-
- -
2
1.6 12.5
9
7.2 56.3
++
5
4.7 31.3
Good
98
24.1
43
22.5
43.9
55
25.6
56.1
2
40.0
2.0
9
24.3
9.2
22
23.7
22.4
21
17.1
21.4 --
31
33.3
31.6 ++
13
23.6
13.3
15
24.6
15.3
82
24.5
83.7
1
10.0
1.0
8
16.0
8.2
40
32.0
40.8 ++
28
22.4
28.6
22
20.8
22.4
Fair only
130 32.0
54 28.3
41.5
76 35.3
58.5
1 20.0
0.8
14 37.8
10.8
30 32.3
23.1
42 34.1
32.3
26 28.0
20.0
17 30.9
13.1
21 34.4
16.2
106 31.6
81.5
3 30.0
2.3
16 32.0
12.3
40 32.0
30.8
43 34.4
33.1
31 29.2
23.8
Poor
85
20.9
45
23.6 52.9
40
18.6 47.1
1
20.0 1.2
2
5.4 2.4
--
21
22.6 24.7
29
23.6 34.1
19
20.4 22.4
13
23.6 15.3
10
16.4 11.8
72
21.5 84.7
3
30.0 3.5
15
30.0 17.6
+
27
21.6 31.8
24
19.2 28.2
19
17.9 22.4
Very poor
52
12.8
26
13.6
50.0
26
12.1
50.0
-
-
-
6
16.2
11.5
13
14.0
25.0
19
15.4
36.5
10
10.8
19.2
4
7.3
7.7
9
14.8
17.3
42
12.5
80.8
1
10.0
1.9
11
22.0
21.2 ++
9
7.2
17.3 --
9
7.2
17.3 --
23
21.7
44.2 +++
Don't know
24 5.9
14 7.3
58.3
10 4.7
41.7
1 20.0
4.2
4 10.8
16.7
4 4.3
16.7
4 3.3
16.7
5 5.4
20.8
6 10.9
25.0
+
6 9.8
25.0
17 5.1
70.8
1 10.0
4.2
- -
-
7 5.6
29.2
11 8.8
45.8
+
6 5.7
25.0
Not applic.
1
0.2
-
- -
1
0.5 100.0
-
- -
-
- -
-
- -
-
- -
-
- -
1
1.8 100.0
++
-
- -
1
0.3 100.0
-
- -
-
- -
-
- -
1
0.8 100.0
-
- -

Table 15.6: Customer Services and Communication Council Performance
Providing Leadership & Advocacy
Total
Gender Age Group Home ownership Location
Male
Fe-
male
18-24
yrs
25-34
yrs
35-44
yrs
45-54
yrs
55-64
yrs
65 yrs
and
over
Rent
ing
Own
home Other Nth. Mid. Sth.
On-
line
Unweighted Base 406
100.0
191
47.0 100.0
215
53.0 100.0
5
1.2 100.0
37
9.1 100.0
93
22.9 100.0
123
30.3 100.0
93
22.9 100.0
55
13.5 100.0
61
15.0 100.0
335
82.5 100.0
10
2.5 100.0
50
12.3 100.0
125
30.8 100.0
125
30.8 100.0
106
26.1 100.0
Very good
22
5.4
10
5.2 45.5
12
5.6 54.5
-
- -
1
2.7 4.5
2
2.2 9.1
8
6.5 36.4
8
8.6 36.4
3
5.5 13.6
1
1.6 4.5
21
6.3 95.5
-
- -
1
2.0 4.5
5
4.0 22.7
11
8.8 50.0
++
5
4.7 22.7
Good
117
28.8
50
26.2
42.7
67
31.2
57.3
2
40.0
1.7
12
32.4
10.3
33
35.5
28.2
26
21.1
22.2 --
29
31.2
24.8
15
27.3
12.8
16
26.2
13.7
99
29.6
84.6
2
20.0
1.7
9
18.0
7.7 -
47
37.6
40.2 +++
28
22.4
23.9 -
33
31.1
28.2
Fair only
134 33.0
66 34.6
49.3
68 31.6
50.7
2 40.0
1.5
15 40.5
11.2
28 30.1
20.9
45 36.6
33.6
30 32.3
22.4
14 25.5
10.4
25 41.0
18.7
105 31.3
78.4
4 40.0
3.0
17 34.0
12.7
40 32.0
29.9
48 38.4
35.8
29 27.4
21.6
Poor
53
13.1
23
12.0 43.4
30
14.0 56.6
-
- -
4
10.8 7.5
9
9.7 17.0
19
15.4 35.8
13
14.0 24.5
8
14.5 15.1
9
14.8 17.0
43
12.8 81.1
1
10.0 1.9
15
30.0 28.3
+++
16
12.8 30.2
13
10.4 24.5
9
8.5 17.0
Very poor
36
8.9
20
10.5
55.6
16
7.4
44.4
-
-
-
2
5.4
5.6
12
12.9
33.3
12
9.8
33.3
6
6.5
16.7
4
7.3
11.1
2
3.3
5.6 -
33
9.9
91.7
1
10.0
2.8
7
14.0
19.4
5
4.0
13.9 --
5
4.0
13.9 --
19
17.9
52.8 +++
Don't know
42 10.3
22 11.5
52.4
20 9.3
47.6
1 20.0
2.4
2 5.4
4.8
9 9.7
21.4
13 10.6
31.0
6 6.5
14.3
11 20.0
26.2
++
8 13.1
19.0
32 9.6
76.2
2 20.0
4.8
1 2.0
2.4
--
12 9.6
28.6
20 16.0
47.6
++
9 8.5
21.4
Not applic.
2
0.5
-
- -
2
0.9 100.0
-
- -
1
2.7 50.0
++
-
- -
-
- -
1
1.1 50.0
-
- -
-
- -
2
0.6 100.0
-
- -
-
- -
-
- -
-
- -
2
1.9 100.0
++

Table 16.1: Quality of Council Council Performance
Qualities of Elected Council
Total
Gender Age Group Home ownership Location
Male
Fe-
male
18-24
yrs
25-34
yrs
35-44
yrs
45-54
yrs
55-64
yrs
65 yrs
and
over
Rent
ing
Own
home Other Nth. Mid. Sth.
On-
line
Unweighted Base 406
100.0
191
47.0 100.0
215
53.0 100.0
5
1.2 100.0
37
9.1 100.0
93
22.9 100.0
123
30.3 100.0
93
22.9 100.0
55
13.5 100.0
61
15.0 100.0
335
82.5 100.0
10
2.5 100.0
50
12.3 100.0
125
30.8 100.0
125
30.8 100.0
106
26.1 100.0
Very good
32
7.9
20
10.5 62.5
+
12
5.6 37.5
-
-
- -
1
2.7 3.1
8
8.6 25.0
14
11.4 43.8
+
8
8.6 25.0
1
1.8 3.1
-
1
1.6 3.1
--
30
9.0 93.8
+
1
10.0 3.1
2
4.0 6.3
7
5.6 21.9
14
11.2 43.8
+
9
8.5 28.1
Good
161
39.7
60
31.4
37.3 ---
101
47.0
62.7 +++
1
20.0
0.6
16
43.2
9.9
34
36.6
21.1
42
34.1
26.1
42
45.2
26.1
26
47.3
16.1
26
42.6
16.1
133
39.7
82.6
2
20.0
1.2
11
22.0
6.8 ---
55
44.0
34.2
53
42.4
32.9
42
39.6
26.1
Fair only
127 31.3
68 35.6
53.5
+
59 27.4
46.5
-
3 60.0
2.4
14 37.8
11.0
29 31.2
22.8
41 33.3
32.3
20 21.5
15.7
--
20 36.4
15.7
21 34.4
16.5
102 30.4
80.3
4 40.0
3.1
22 44.0
17.3
++
41 32.8
32.3
38 30.4
29.9
26 24.5
20.5
-
Poor
38
9.4
20
10.5 52.6
18
8.4 47.4
-
- -
3
8.1 7.9
9
9.7 23.7
13
10.6 34.2
10
10.8 26.3
3
5.5 7.9
4
6.6 10.5
33
9.9 86.8
1
10.0 2.6
8
16.0 21.1
+
11
8.8 28.9
11
8.8 28.9
8
7.5 21.1
Very poor
24
5.9
13
6.8
54.2
11
5.1
45.8
-
-
-
1
2.7
4.2
5
5.4
20.8
10
8.1
41.7
5
5.4
20.8
3
5.5
12.5
3
4.9
12.5
21
6.3
87.5
-
-
-
4
8.0
16.7
6
4.8
25.0
4
3.2
16.7
10
9.4
41.7 +
Don't know
22 5.4
9 4.7
40.9
13 6.0
59.1
1 20.0
4.5
1 2.7
4.5
8 8.6
36.4
2 1.6
9.1
--
8 8.6
36.4
2 3.6
9.1
6 9.8
27.3
+
14 4.2
63.6
--
2 20.0
9.1
2 4.0
9.1
5 4.0
22.7
5 4.0
22.7
10 9.4
45.5
++
Not applic.
2
0.5
1
0.5 50.0
1
0.5 50.0
-
- -
1
2.7 50.0
++
-
- -
1
0.8 50.0
-
- -
-
- -
-
- -
2
0.6 100.0
-
- -
1
2.0 50.0
-
- -
-
- -
1
0.9 50.0

Table 16.2: Quality of Council Council Performance
Qualities of Councillor(s) Dealt with
Total
Gender Age Group Home ownership Location
Male
Fe-
male
18-24
yrs
25-34
yrs
35-44
yrs
45-54
yrs
55-64
yrs
65 yrs
and
over
Rent
ing
Own
home Other Nth. Mid. Sth.
On-
line
Unweighted Base 406
100.0
191
47.0 100.0
215
53.0 100.0
5
1.2 100.0
37
9.1 100.0
93
22.9 100.0
123
30.3 100.0
93
22.9 100.0
55
13.5 100.0
61
15.0 100.0
335
82.5 100.0
10
2.5 100.0
50
12.3 100.0
125
30.8 100.0
125
30.8 100.0
106
26.1 100.0
Very good
32
7.9
17
8.9 53.1
15
7.0 46.9
-
- -
3
8.1 9.4
9
9.7 28.1
9
7.3 28.1
8
8.6 25.0
3
5.5 9.4
2
3.3 6.3
30
9.0 93.8
+
-
- -
1
2.0 3.1
-
7
5.6 21.9
13
10.4 40.6
11
10.4 34.4
Good
129
31.8
50
26.2
38.8 --
79
36.7
61.2 ++
2
40.0
1.6
13
35.1
10.1
26
28.0
20.2
32
26.0
24.8
36
38.7
27.9
20
36.4
15.5
18
29.5
14.0
109
32.5
84.5
2
20.0
1.6
8
16.0
6.2 --
42
33.6
32.6
42
33.6
32.6
37
34.9
28.7
Fair only
110 27.1
56 29.3
50.9
54 25.1
49.1
2 40.0
1.8
10 27.0
9.1
26 28.0
23.6
34 27.6
30.9
24 25.8
21.8
14 25.5
12.7
18 29.5
16.4
88 26.3
80.0
4 40.0
3.6
17 34.0
15.5
33 26.4
30.0
41 32.8
37.3
+
19 17.9
17.3
--
Poor
38
9.4
18
9.4 47.4
20
9.3 52.6
-
- -
4
10.8 10.5
9
9.7 23.7
14
11.4 36.8
7
7.5 18.4
4
7.3 10.5
7
11.5 18.4
30
9.0 78.9
1
10.0 2.6
16
32.0 42.1
+++
6
4.8 15.8
--
10
8.0 26.3
6
5.7 15.8
Very poor
23
5.7
14
7.3
60.9
9
4.2
39.1
-
-
-
1
2.7
4.3
7
7.5
30.4
10
8.1
43.5
3
3.2
13.0
2
3.6
8.7
3
4.9
13.0
20
6.0
87.0
-
-
-
3
6.0
13.0
8
6.4
34.8
2
1.6
8.7 --
10
9.4
43.5 +
Don't know
38 9.4
19 9.9
50.0
19 8.8
50.0
1 20.0
2.6
1 2.7
2.6
9 9.7
23.7
11 8.9
28.9
9 9.7
23.7
7 12.7
18.4
7 11.5
18.4
29 8.7
76.3
2 20.0
5.3
1 2.0
2.6
-
13 10.4
34.2
12 9.6
31.6
12 11.3
31.6
Not applic.
36
8.9
17
8.9 47.2
19
8.8 52.8
-
- -
5
13.5 13.9
7
7.5 19.4
13
10.6 36.1
6
6.5 16.7
5
9.1 13.9
6
9.8 16.7
29
8.7 80.6
1
10.0 2.8
4
8.0 11.1
16
12.8 44.4
+
5
4.0 13.9
--
11
10.4 30.6
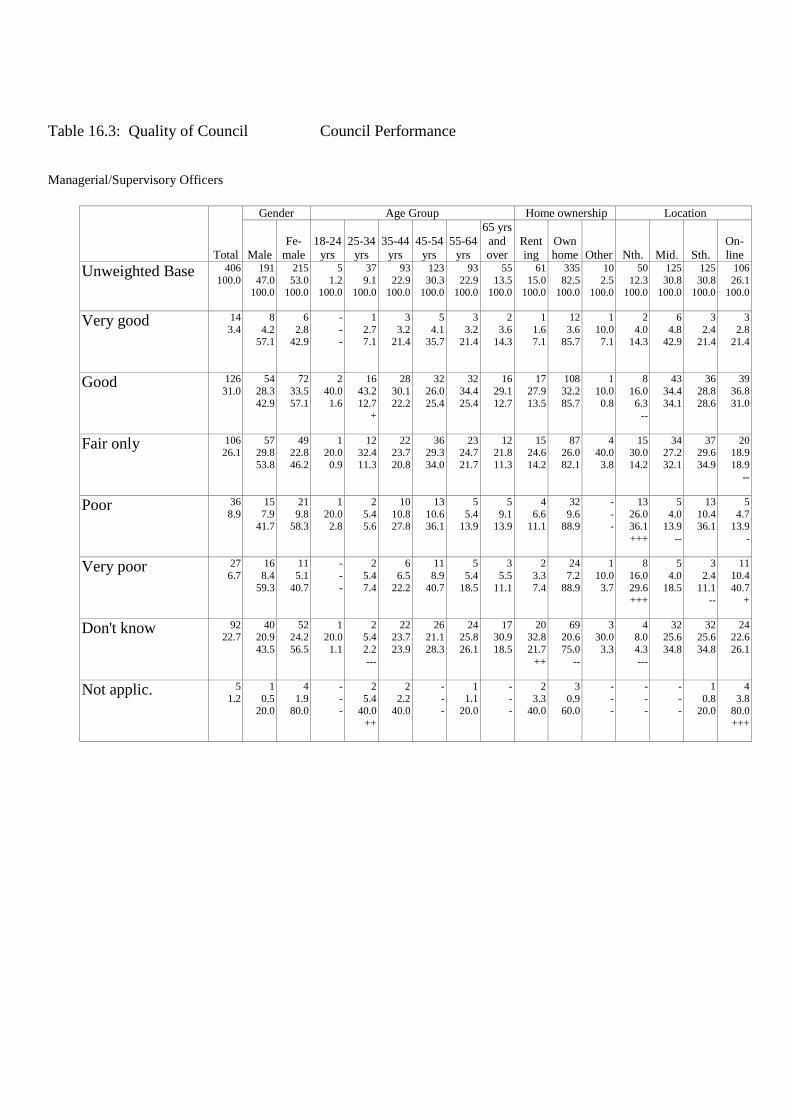
Table 16.3: Quality of Council Council Performance
Managerial/Supervisory Officers
Total
Gender Age Group Home ownership Location
Male
Fe-
male
18-24
yrs
25-34
yrs
35-44
yrs
45-54
yrs
55-64
yrs
65 yrs
and
over
Rent
ing
Own
home Other Nth. Mid. Sth.
On-
line
Unweighted Base 406
100.0
191
47.0 100.0
215
53.0 100.0
5
1.2 100.0
37
9.1 100.0
93
22.9 100.0
123
30.3 100.0
93
22.9 100.0
55
13.5 100.0
61
15.0 100.0
335
82.5 100.0
10
2.5 100.0
50
12.3 100.0
125
30.8 100.0
125
30.8 100.0
106
26.1 100.0
Very good
14
3.4
8
4.2 57.1
6
2.8 42.9
-
- -
1
2.7 7.1
3
3.2 21.4
5
4.1 35.7
3
3.2 21.4
2
3.6 14.3
1
1.6 7.1
12
3.6 85.7
1
10.0 7.1
2
4.0 14.3
6
4.8 42.9
3
2.4 21.4
3
2.8 21.4
Good
126
31.0
54
28.3
42.9
72
33.5
57.1
2
40.0
1.6
16
43.2
12.7 +
28
30.1
22.2
32
26.0
25.4
32
34.4
25.4
16
29.1
12.7
17
27.9
13.5
108
32.2
85.7
1
10.0
0.8
8
16.0
6.3 --
43
34.4
34.1
36
28.8
28.6
39
36.8
31.0
Fair only
106 26.1
57 29.8
53.8
49 22.8
46.2
1 20.0
0.9
12 32.4
11.3
22 23.7
20.8
36 29.3
34.0
23 24.7
21.7
12 21.8
11.3
15 24.6
14.2
87 26.0
82.1
4 40.0
3.8
15 30.0
14.2
34 27.2
32.1
37 29.6
34.9
20 18.9
18.9
--
Poor
36
8.9
15
7.9 41.7
21
9.8 58.3
1
20.0 2.8
2
5.4 5.6
10
10.8 27.8
13
10.6 36.1
5
5.4 13.9
5
9.1 13.9
4
6.6 11.1
32
9.6 88.9
-
- -
13
26.0 36.1
+++
5
4.0 13.9
--
13
10.4 36.1
5
4.7 13.9
-
Very poor
27
6.7
16
8.4
59.3
11
5.1
40.7
-
-
-
2
5.4
7.4
6
6.5
22.2
11
8.9
40.7
5
5.4
18.5
3
5.5
11.1
2
3.3
7.4
24
7.2
88.9
1
10.0
3.7
8
16.0
29.6 +++
5
4.0
18.5
3
2.4
11.1 --
11
10.4
40.7 +
Don't know
92 22.7
40 20.9
43.5
52 24.2
56.5
1 20.0
1.1
2 5.4
2.2
---
22 23.7
23.9
26 21.1
28.3
24 25.8
26.1
17 30.9
18.5
20 32.8
21.7
++
69 20.6
75.0
--
3 30.0
3.3
4 8.0
4.3
---
32 25.6
34.8
32 25.6
34.8
24 22.6
26.1
Not applic.
5
1.2
1
0.5 20.0
4
1.9 80.0
-
- -
2
5.4 40.0
++
2
2.2 40.0
-
- -
1
1.1 20.0
-
- -
2
3.3 40.0
3
0.9 60.0
-
- -
-
- -
-
- -
1
0.8 20.0
4
3.8 80.0
+++

Table 16.4: Quality of Council Council Performance
Quality/Performance of Outdoor Workers
Total
Gender Age Group Home ownership Location
Male
Fe-
male
18-24
yrs
25-34
yrs
35-44
yrs
45-54
yrs
55-64
yrs
65 yrs
and
over
Rent
ing
Own
home Other Nth. Mid. Sth.
On-
line
Unweighted Base 406
100.0
191
47.0 100.0
215
53.0 100.0
5
1.2 100.0
37
9.1 100.0
93
22.9 100.0
123
30.3 100.0
93
22.9 100.0
55
13.5 100.0
61
15.0 100.0
335
82.5 100.0
10
2.5 100.0
50
12.3 100.0
125
30.8 100.0
125
30.8 100.0
106
26.1 100.0
Very good
28
6.9
14
7.3 50.0
14
6.5 50.0
-
- -
5
13.5 17.9
+
6
6.5 21.4
7
5.7 25.0
7
7.5 25.0
3
5.5 10.7
2
3.3 7.1
23
6.9 82.1
3
30.0 10.7
1
2.0 3.6
12
9.6 42.9
9
7.2 32.1
6
5.7 21.4
Good
173
42.6
74
38.7
42.8
99
46.0
57.2
2
40.0
1.2
17
45.9
9.8
42
45.2
24.3
49
39.8
28.3
39
41.9
22.5
24
43.6
13.9
27
44.3
15.6
143
42.7
82.7
3
30.0
1.7
19
38.0
11.0
46
36.8
26.6
51
40.8
29.5
57
53.8
32.9 +++
Fair only
121 29.8
62 32.5
51.2
59 27.4
48.8
2 40.0
1.7
8 21.6
6.6
32 34.4
26.4
36 29.3
29.8
25 26.9
20.7
18 32.7
14.9
15 24.6
12.4
103 30.7
85.1
3 30.0
2.5
18 36.0
14.9
34 27.2
28.1
48 38.4
39.7
++
21 19.8
17.4
---
Poor
26
6.4
13
6.8 50.0
13
6.0 50.0
-
- -
2
5.4 7.7
1
1.1 3.8
--
13
10.6 50.0
++
7
7.5 26.9
3
5.5 11.5
5
8.2 19.2
21
6.3 80.8
-
- -
8
16.0 30.8
+++
9
7.2 34.6
5
4.0 19.2
4
3.8 15.4
Very poor
22
5.4
14
7.3
63.6
8
3.7
36.4
-
-
-
2
5.4
9.1
4
4.3
18.2
7
5.7
31.8
7
7.5
31.8
2
3.6
9.1
4
6.6
18.2
18
5.4
81.8
-
-
-
4
8.0
18.2
5
4.0
22.7
8
6.4
36.4
5
4.7
22.7
Don't know
35 8.6
14 7.3
40.0
21 9.8
60.0
1 20.0
2.9
2 5.4
5.7
8 8.6
22.9
11 8.9
31.4
8 8.6
22.9
5 9.1
14.3
8 13.1
22.9
26 7.8
74.3
1 10.0
2.9
- -
-
19 15.2
54.3
+++
4 3.2
11.4
---
12 11.3
34.3
Not applic.
1
0.2
-
- -
1
0.5 100.0
-
- -
1
2.7 100.0
+++
-
- -
-
- -
-
- -
-
- -
-
- -
1
0.3 100.0
-
- -
-
- -
-
- -
-
- -
1
0.9 100.0
+

Table 16.5: Quality of Council Council Performance
Quality/Performance of Indoor Staff
Total
Gender Age Group Home ownership Location
Male
Fe-
male
18-24
yrs
25-34
yrs
35-44
yrs
45-54
yrs
55-64
yrs
65 yrs
and
over
Rent
ing
Own
home Other Nth. Mid. Sth.
On-
line
Unweighted Base 406
100.0
191
47.0 100.0
215
53.0 100.0
5
1.2 100.0
37
9.1 100.0
93
22.9 100.0
123
30.3 100.0
93
22.9 100.0
55
13.5 100.0
61
15.0 100.0
335
82.5 100.0
10
2.5 100.0
50
12.3 100.0
125
30.8 100.0
125
30.8 100.0
106
26.1 100.0
Very good
31
7.6
14
7.3 45.2
17
7.9 54.8
-
- -
4
10.8 12.9
7
7.5 22.6
9
7.3 29.0
6
6.5 19.4
5
9.1 16.1
3
4.9 9.7
26
7.8 83.9
2
20.0 6.5
-
- -
10
8.0 32.3
14
11.2 45.2
+
7
6.6 22.6
Good
189
46.6
85
44.5
45.0
104
48.4
55.0
2
40.0
1.1
15
40.5
7.9
43
46.2
22.8
57
46.3
30.2
46
49.5
24.3
26
47.3
13.8
23
37.7
12.2
161
48.1
85.2
5
50.0
2.6
14
28.0
7.4 ---
65
52.0
34.4
56
44.8
29.6
54
50.9
28.6
Fair only
101 24.9
53 27.7
52.5
48 22.3
47.5
1 20.0
1.0
12 32.4
11.9
24 25.8
23.8
26 21.1
25.7
23 24.7
22.8
15 27.3
14.9
15 24.6
14.9
84 25.1
83.2
2 20.0
2.0
22 44.0
21.8
+++
24 19.2
23.8
-
37 29.6
36.6
18 17.0
17.8
--
Poor
17
4.2
9
4.7 52.9
8
3.7 47.1
1
20.0 5.9
1
2.7 5.9
-
- -
11
8.9 64.7
+++
4
4.3 23.5
-
- -
4
6.6 23.5
13
3.9 76.5
-
- -
9
18.0 52.9
+++
1
0.8 5.9
--
4
3.2 23.5
3
2.8 17.6
Very poor
13
3.2
7
3.7
53.8
6
2.8
46.2
-
-
-
1
2.7
7.7
2
2.2
15.4
5
4.1
38.5
3
3.2
23.1
2
3.6
15.4
2
3.3
15.4
11
3.3
84.6
-
-
-
3
6.0
23.1
2
1.6
15.4
2
1.6
15.4
6
5.7
46.2 +
Don't know
52 12.8
22 11.5
42.3
30 14.0
57.7
1 20.0
1.9
3 8.1
5.8
15 16.1
28.8
15 12.2
28.8
11 11.8
21.2
7 12.7
13.5
14 23.0
26.9
++
37 11.0
71.2
--
1 10.0
1.9
1 2.0
1.9
--
23 18.4
44.2
++
12 9.6
23.1
16 15.1
30.8
Not applic.
3
0.7
1
0.5 33.3
2
0.9 66.7
-
- -
1
2.7 33.3
2
2.2 66.7
+
-
- -
-
- -
-
- -
-
- -
3
0.9 100.0
-
- -
1
2.0 33.3
-
- -
-
- -
2
1.9 66.7

Table 17.1: Overall Performance Rating
Overall Performance Rating
Total
Gender Age Group Home ownership Location
Male
Fe-
male
18-24
yrs
25-34
yrs
35-44
yrs
45-54
yrs
55-64
yrs
65 yrs
and
over
Rent
ing
Own
home Other Nth. Mid. Sth.
On-
line
Unweighted Base 406
100.0
191
47.0 100.0
215
53.0 100.0
5
1.2 100.0
37
9.1 100.0
93
22.9 100.0
123
30.3 100.0
93
22.9 100.0
55
13.5 100.0
61
15.0 100.0
335
82.5 100.0
10
2.5 100.0
50
12.3 100.0
125
30.8 100.0
125
30.8 100.0
106
26.1 100.0
Very good
20
4.9
12
6.3 60.0
8
3.7 40.0
-
- -
2
5.4 10.0
2
2.2 10.0
9
7.3 45.0
5
5.4 25.0
2
3.6 10.0
1
1.6 5.0
19
5.7 95.0
-
- -
-
- -
6
4.8 30.0
8
6.4 40.0
6
5.7 30.0
Good
167
41.1
67
35.1
40.1 --
100
46.5
59.9 ++
2
40.0
1.2
14
37.8
8.4
40
43.0
24.0
36
29.3
21.6 ---
46
49.5
27.5 +
29
52.7
17.4 +
25
41.0
15.0
139
41.5
83.2
3
30.0
1.8
7
14.0
4.2 ---
58
46.4
34.7
54
43.2
32.3
48
45.3
28.7
Fair only
166 40.9
86 45.0
51.8
80 37.2
48.2
2 40.0
1.2
15 40.5
9.0
40 43.0
24.1
58 47.2
34.9
+
29 31.2
17.5
--
22 40.0
13.3
29 47.5
17.5
130 38.8
78.3
-
7 70.0
4.2
30 60.0
18.1
+++
51 40.8
30.7
57 45.6
34.3
28 26.4
16.9
---
Poor
38
9.4
19
9.9 50.0
19
8.8 50.0
-
- -
4
10.8 10.5
7
7.5 18.4
16
13.0 42.1
+
10
10.8 26.3
1
1.8 2.6
--
6
9.8 15.8
32
9.6 84.2
-
- -
9
18.0 23.7
++
9
7.2 23.7
5
4.0 13.2
--
15
14.2 39.5
++
Very poor
14
3.4
7
3.7
50.0
7
3.3
50.0
1
20.0
7.1
2
5.4
14.3
4
4.3
28.6
4
3.3
28.6
2
2.2
14.3
1
1.8
7.1
-
-
-
14
4.2
100.0 +
-
-
-
4
8.0
28.6 +
1
0.8
7.1 -
-
-
-
9
8.5
64.3 +++
Don't know
1 0.2
- -
-
1 0.5
100.0
- -
-
- -
-
- -
-
- -
-
1 1.1
100.0
+
- -
-
- -
-
1 0.3
100.0
- -
-
- -
-
- -
-
1 0.8
100.0
- -
-

Table 18: 1. Council consistently strives to strike the right balance between providing the best possible
services and operating within its financial means. Would you prefer that Council....
Total
Gender Age Group Home ownership Location
Male
Fe-
male
18-24
yrs
25-34
yrs
35-44
yrs
45-54
yrs
55-64
yrs
65 yrs
and
over
Rent
ing
Own
home Other Nth. Mid. Sth.
On-
line
Unweighted Base 406
100.0
191
47.0 100.0
215
53.0 100.0
5
1.2 100.0
37
9.1 100.0
93
22.9 100.0
123
30.3 100.0
93
22.9 100.0
55
13.5 100.0
61
15.0 100.0
335
82.5 100.0
10
2.5 100.0
50
12.3 100.0
125
30.8 100.0
125
30.8 100.0
106
26.1 100.0
Neither a) not b) -
leave things as
they are
273 67.2
139 72.8
50.9
++
134 62.3
49.1
--
3 60.0
1.1
24 64.9
8.8
61 65.6
22.3
88 71.5
32.2
59 63.4
21.6
38 69.1
13.9
45 73.8
16.5
225 67.2
82.4
3 30.0
1.1
29 58.0
10.6
92 73.6
33.7
+
103 82.4
37.7
+++
49 46.2
17.9
---
Provided improved
or increased
services, at a
higher cost to
ratepayers
65
16.0
21
11.0
32.3 ---
44
20.5
67.7 +++
2
40.0
3.1
10
27.0
15.4 +
14
15.1
21.5
15
12.2
23.1
14
15.1
21.5
10
18.2
15.4
10
16.4
15.4
49
14.6
75.4 -
6
60.0
9.2
14
28.0
21.5 ++
15
12.0
23.1
13
10.4
20.0 --
23
21.7
35.4 +
Reduce services
and lowered the
cost to ratepayers
37
9.1
19
9.9
51.4
18
8.4
48.6
-
-
-
1
2.7
2.7
12
12.9
32.4
10
8.1
27.0
10
10.8
27.0
4
7.3
10.8
1
1.6
2.7 --
36
10.7
97.3 ++
-
-
-
2
4.0
5.4
15
12.0
40.5
6
4.8
16.2 --
14
13.2
37.8 +
Don't know
31
7.6
12
6.3 38.7
19
8.8 61.3
-
- -
2
5.4 6.5
6
6.5 19.4
10
8.1 32.3
10
10.8 32.3
3
5.5 9.7
5
8.2 16.1
25
7.5 80.6
1
10.0 3.2
5
10.0 16.1
3
2.4 9.7
---
3
2.4 9.7
---
20
18.9 64.5
+++

Table 19: 2a What is Douglas Shire's greatest strength?
Total
Gender Age Group Home ownership Location
Male
Fe-
male
18-24
yrs
25-34
yrs
35-44
yrs
45-54
yrs
55-64
yrs
65 yrs
and
over
Rent
ing
Own
home Other Nth. Mid. Sth.
On-
line
Unweighted Base 406
100.0
191
47.0 100.0
215
53.0 100.0
5
1.2 100.0
37
9.1 100.0
93
22.9 100.0
123
30.3 100.0
93
22.9 100.0
55
13.5 100.0
61
15.0 100.0
335
82.5 100.0
10
2.5 100.0
50
12.3 100.0
125
30.8 100.0
125
30.8 100.0
106
26.1 100.0
Natural
Environment -
GBR/Daintree/clim
ate
100 24.6
56 29.3
56.0
++
44 20.5
44.0
--
- -
-
6 16.2
6.0
23 24.7
23.0
33 26.8
33.0
30 32.3
30.0
+
8 14.5
8.0
-
18 29.5
18.0
80 23.9
80.0
2 20.0
2.0
13 26.0
13.0
32 25.6
32.0
38 30.4
38.0
+
17 16.0
17.0
--
Lifestyle/friendly
Atmosphere
83
20.4
39
20.4
47.0
44
20.5
53.0
-
-
-
10
27.0
12.0
16
17.2
19.3
28
22.8
33.7
16
17.2
19.3
13
23.6
15.7
16
26.2
19.3
67
20.0
80.7
-
-
-
3
6.0
3.6 ---
30
24.0
36.1
38
30.4
45.8 +++
12
11.3
14.5 ---
Don't know / Can't
think of anything
52
12.8
24
12.6 46.2
28
13.0 53.8
3
60.0 5.8
11
29.7 21.2
+++
11
11.8 21.2
12
9.8 23.1
10
10.8 19.2
5
9.1 9.6
6
9.8 11.5
42
12.5 80.8
4
40.0 7.7
15
30.0 28.8
+++
6
4.8 11.5
---
5
4.0 9.6
---
26
24.5 50.0
+++
Tourism
51
12.6
21
11.0
41.2
30
14.0
58.8
1
20.0
2.0
4
10.8
7.8
15
16.1
29.4
13
10.6
25.5
11
11.8
21.6
7
12.7
13.7
6
9.8
11.8
42
12.5
82.4
3
30.0
5.9
9
18.0
17.6
19
15.2
37.3
14
11.2
27.5
9
8.5
17.6
Parks/Beaches/Spo
rt and Recreation
38 9.4
15 7.9
39.5
23 10.7
60.5
- -
-
2 5.4
5.3
8 8.6
21.1
8 6.5
21.1
8 8.6
21.1
12 21.8
31.6
+++
4 6.6
10.5
34 10.1
89.5
- -
-
3 6.0
7.9
14 11.2
36.8
15 12.0
39.5
6 5.7
15.8
Management/finan
cial Administration
34
8.4
14
7.3 41.2
20
9.3 58.8
-
- -
-
- -
11
11.8 32.4
13
10.6 38.2
7
7.5 20.6
3
5.5 8.8
5
8.2 14.7
28
8.4 82.4
1
10.0 2.9
5
10.0 14.7
7
5.6 20.6
6
4.8 17.6
-
16
15.1 47.1
+++
Customer
Service/responsive
ness
31
7.6
12
6.3
38.7
19
8.8
61.3
1
20.0
3.2
2
5.4
6.5
6
6.5
19.4
10
8.1
32.3
7
7.5
22.6
5
9.1
16.1
3
4.9
9.7
28
8.4
90.3
-
-
-
2
4.0
6.5
6
4.8
19.4
8
6.4
25.8
15
14.2
48.4 +++
Local
Agriculture/Sugarc
ane Industry
17
4.2
10
5.2 58.8
7
3.3 41.2
-
- -
2
5.4 11.8
3
3.2 17.6
6
4.9 35.3
4
4.3 23.5
2
3.6 11.8
3
4.9 17.6
14
4.2 82.4
-
- -
-
- -
11
8.8 64.7
+++
1
0.8 5.9
--
5
4.7 29.4
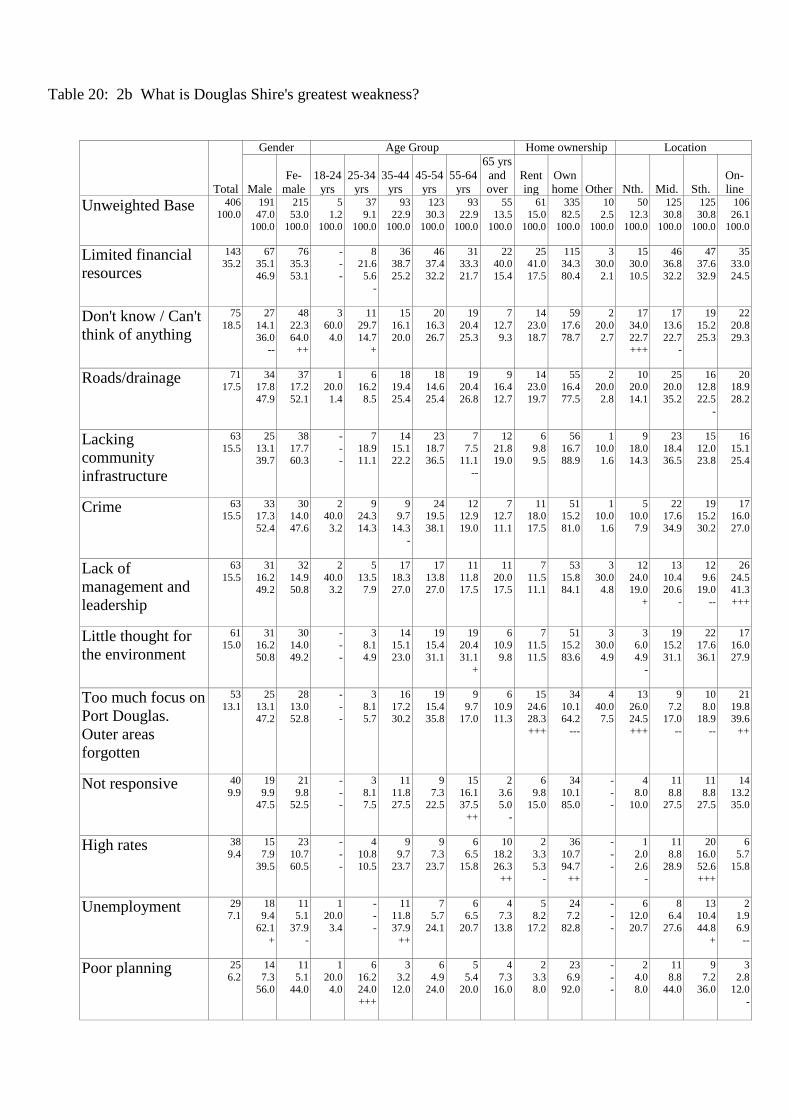
Table 20: 2b What is Douglas Shire's greatest weakness?
Total
Gender Age Group Home ownership Location
Male
Fe-
male
18-24
yrs
25-34
yrs
35-44
yrs
45-54
yrs
55-64
yrs
65 yrs
and
over
Rent
ing
Own
home Other Nth. Mid. Sth.
On-
line
Unweighted Base 406
100.0
191
47.0 100.0
215
53.0 100.0
5
1.2 100.0
37
9.1 100.0
93
22.9 100.0
123
30.3 100.0
93
22.9 100.0
55
13.5 100.0
61
15.0 100.0
335
82.5 100.0
10
2.5 100.0
50
12.3 100.0
125
30.8 100.0
125
30.8 100.0
106
26.1 100.0
Limited financial
resources
143 35.2
67 35.1
46.9
76 35.3
53.1
- -
-
8 21.6
5.6
-
36 38.7
25.2
46 37.4
32.2
31 33.3
21.7
22 40.0
15.4
25 41.0
17.5
115 34.3
80.4
3 30.0
2.1
15 30.0
10.5
46 36.8
32.2
47 37.6
32.9
35 33.0
24.5
Don't know / Can't
think of anything
75
18.5
27
14.1
36.0 --
48
22.3
64.0 ++
3
60.0
4.0
11
29.7
14.7 +
15
16.1
20.0
20
16.3
26.7
19
20.4
25.3
7
12.7
9.3
14
23.0
18.7
59
17.6
78.7
2
20.0
2.7
17
34.0
22.7 +++
17
13.6
22.7 -
19
15.2
25.3
22
20.8
29.3
Roads/drainage
71 17.5
34 17.8
47.9
37 17.2
52.1
1 20.0
1.4
6 16.2
8.5
18 19.4
25.4
18 14.6
25.4
19 20.4
26.8
9 16.4
12.7
14 23.0
19.7
55 16.4
77.5
2 20.0
2.8
10 20.0
14.1
25 20.0
35.2
16 12.8
22.5
-
20 18.9
28.2
Lacking
community
infrastructure
63
15.5
25
13.1 39.7
38
17.7 60.3
-
- -
7
18.9 11.1
14
15.1 22.2
23
18.7 36.5
7
7.5 11.1
--
12
21.8 19.0
6
9.8 9.5
56
16.7 88.9
1
10.0 1.6
9
18.0 14.3
23
18.4 36.5
15
12.0 23.8
16
15.1 25.4
Crime
63 15.5
33 17.3
52.4
30 14.0
47.6
2 40.0
3.2
9 24.3
14.3
9 9.7
14.3
-
24 19.5
38.1
12 12.9
19.0
7 12.7
11.1
11 18.0
17.5
51 15.2
81.0
1 10.0
1.6
5 10.0
7.9
22 17.6
34.9
19 15.2
30.2
17 16.0
27.0
Lack of
management and
leadership
63
15.5
31
16.2 49.2
32
14.9 50.8
2
40.0 3.2
5
13.5 7.9
17
18.3 27.0
17
13.8 27.0
11
11.8 17.5
11
20.0 17.5
7
11.5 11.1
53
15.8 84.1
3
30.0 4.8
12
24.0 19.0
+
13
10.4 20.6
-
12
9.6 19.0
--
26
24.5 41.3
+++
Little thought for
the environment
61 15.0
31 16.2
50.8
30 14.0
49.2
- -
-
3 8.1
4.9
14 15.1
23.0
19 15.4
31.1
19 20.4
31.1
+
6 10.9
9.8
7 11.5
11.5
51 15.2
83.6
3 30.0
4.9
3 6.0
4.9
-
19 15.2
31.1
22 17.6
36.1
17 16.0
27.9
Too much focus on
Port Douglas.
Outer areas
forgotten
53
13.1
25
13.1 47.2
28
13.0 52.8
-
- -
3
8.1 5.7
16
17.2 30.2
19
15.4 35.8
9
9.7 17.0
6
10.9 11.3
15
24.6 28.3
+++
34
10.1 64.2
---
4
40.0 7.5
13
26.0 24.5
+++
9
7.2 17.0
--
10
8.0 18.9
--
21
19.8 39.6
++
Not responsive
40
9.9
19
9.9 47.5
21
9.8 52.5
-
- -
3
8.1 7.5
11
11.8 27.5
9
7.3 22.5
15
16.1 37.5
++
2
3.6 5.0
-
6
9.8 15.0
34
10.1 85.0
-
- -
4
8.0 10.0
11
8.8 27.5
11
8.8 27.5
14
13.2 35.0
High rates
38
9.4
15
7.9
39.5
23
10.7
60.5
-
-
-
4
10.8
10.5
9
9.7
23.7
9
7.3
23.7
6
6.5
15.8
10
18.2
26.3
++
2
3.3
5.3
-
36
10.7
94.7
++
-
-
-
1
2.0
2.6
-
11
8.8
28.9
20
16.0
52.6
+++
6
5.7
15.8
Unemployment
29 7.1
18 9.4
62.1
+
11 5.1
37.9
-
1 20.0
3.4
- -
-
11 11.8
37.9
++
7 5.7
24.1
6 6.5
20.7
4 7.3
13.8
5 8.2
17.2
24 7.2
82.8
- -
-
6 12.0
20.7
8 6.4
27.6
13 10.4
44.8
+
2 1.9
6.9
--
Poor planning
25
6.2
14
7.3 56.0
11
5.1 44.0
1
20.0 4.0
6
16.2 24.0
+++
3
3.2 12.0
6
4.9 24.0
5
5.4 20.0
4
7.3 16.0
2
3.3 8.0
23
6.9 92.0
-
- -
2
4.0 8.0
11
8.8 44.0
9
7.2 36.0
3
2.8 12.0
-

Table 20: 2b What is Douglas Shire's greatest weakness?
Total
Gender Age Group Home ownership Location
Male
Fe-
male
18-24
yrs
25-34
yrs
35-44
yrs
45-54
yrs
55-64
yrs
65 yrs
and
over
Rent
ing
Own
home Other Nth. Mid. Sth.
On-
line
Unweighted Base 406
100.0
191
47.0
100.0
215
53.0
100.0
5
1.2
100.0
37
9.1
100.0
93
22.9
100.0
123
30.3
100.0
93
22.9
100.0
55
13.5
100.0
61
15.0
100.0
335
82.5
100.0
10
2.5
100.0
50
12.3
100.0
125
30.8
100.0
125
30.8
100.0
106
26.1
100.0
Nothing for
Kids/Young people
to do
25
6.2
7
3.7 28.0
--
18
8.4 72.0
++
-
- -
7
18.9 28.0
+++
5
5.4 20.0
7
5.7 28.0
4
4.3 16.0
2
3.6 8.0
3
4.9 12.0
22
6.6 88.0
-
- -
-
- -
10
8.0 40.0
11
8.8 44.0
4
3.8 16.0
Too much reliance
on tourism
23
5.7
13
6.8 56.5
10
4.7 43.5
-
- -
-
- -
3
3.2 13.0
7
5.7 30.4
8
8.6 34.8
5
9.1 21.7
2
3.3 8.7
21
6.3 91.3
-
- -
-
- -
9
7.2 39.1
11
8.8 47.8
+
3
2.8 13.0
Lack of public
transport
16
3.9
10
5.2
62.5
6
2.8
37.5
-
-
-
-
-
-
4
4.3
25.0
5
4.1
31.3
5
5.4
31.3
2
3.6
12.5
-
-
-
15
4.5
93.8
1
10.0
6.3
2
4.0
12.5
7
5.6
43.8
4
3.2
25.0
3
2.8
18.8
Newcomers
allowed to make
changes
13 3.2
7 3.7
53.8
6 2.8
46.2
- -
-
- -
-
- -
-
5 4.1
38.5
7 7.5
53.8
+++
1 1.8
7.7
2 3.3
15.4
11 3.3
84.6
- -
-
- -
-
6 4.8
46.2
5 4.0
38.5
2 1.9
15.4
Cost of housing
10
2.5
5
2.6
50.0
5
2.3
50.0
-
-
-
2
5.4
20.0
1
1.1
10.0
5
4.1
50.0
2
2.2
20.0
-
-
-
1
1.6
10.0
9
2.7
90.0
-
-
-
1
2.0
10.0
3
2.4
30.0
5
4.0
50.0
1
0.9
10.0
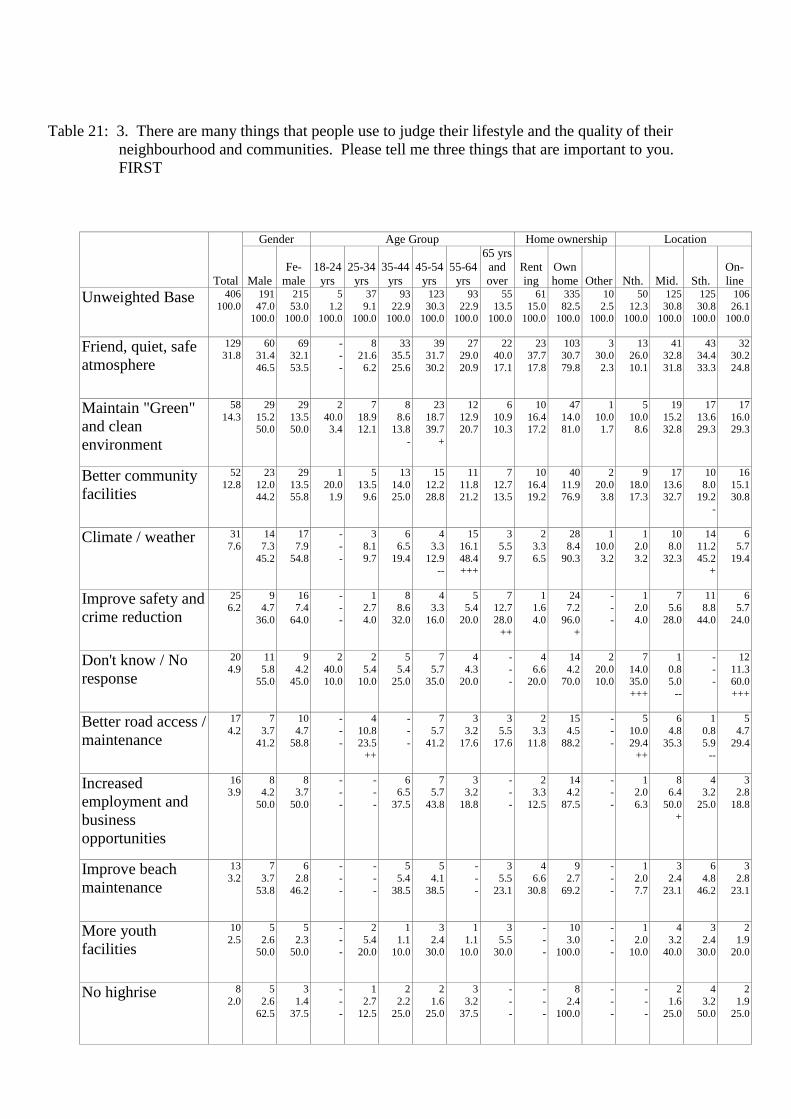
Table 21: 3. There are many things that people use to judge their lifestyle and the quality of their
neighbourhood and communities. Please tell me three things that are important to you.
FIRST
Total
Gender Age Group Home ownership Location
Male
Fe-
male
18-24
yrs
25-34
yrs
35-44
yrs
45-54
yrs
55-64
yrs
65 yrs
and
over
Rent
ing
Own
home Other Nth. Mid. Sth.
On-
line
Unweighted Base 406
100.0
191
47.0 100.0
215
53.0 100.0
5
1.2 100.0
37
9.1 100.0
93
22.9 100.0
123
30.3 100.0
93
22.9 100.0
55
13.5 100.0
61
15.0 100.0
335
82.5 100.0
10
2.5 100.0
50
12.3 100.0
125
30.8 100.0
125
30.8 100.0
106
26.1 100.0
Friend, quiet, safe
atmosphere
129 31.8
60 31.4
46.5
69 32.1
53.5
- -
-
8 21.6
6.2
33 35.5
25.6
39 31.7
30.2
27 29.0
20.9
22 40.0
17.1
23 37.7
17.8
103 30.7
79.8
3 30.0
2.3
13 26.0
10.1
41 32.8
31.8
43 34.4
33.3
32 30.2
24.8
Maintain "Green"
and clean
environment
58
14.3
29
15.2 50.0
29
13.5 50.0
2
40.0 3.4
7
18.9 12.1
8
8.6 13.8
-
23
18.7 39.7
+
12
12.9 20.7
6
10.9 10.3
10
16.4 17.2
47
14.0 81.0
1
10.0 1.7
5
10.0 8.6
19
15.2 32.8
17
13.6 29.3
17
16.0 29.3
Better community
facilities
52
12.8
23
12.0 44.2
29
13.5 55.8
1
20.0 1.9
5
13.5 9.6
13
14.0 25.0
15
12.2 28.8
11
11.8 21.2
7
12.7 13.5
10
16.4 19.2
40
11.9 76.9
2
20.0 3.8
9
18.0 17.3
17
13.6 32.7
10
8.0 19.2
-
16
15.1 30.8
Climate / weather
31
7.6
14
7.3
45.2
17
7.9
54.8
-
-
-
3
8.1
9.7
6
6.5
19.4
4
3.3
12.9 --
15
16.1
48.4 +++
3
5.5
9.7
2
3.3
6.5
28
8.4
90.3
1
10.0
3.2
1
2.0
3.2
10
8.0
32.3
14
11.2
45.2 +
6
5.7
19.4
Improve safety and
crime reduction
25 6.2
9 4.7
36.0
16 7.4
64.0
- -
-
1 2.7
4.0
8 8.6
32.0
4 3.3
16.0
5 5.4
20.0
7 12.7
28.0
++
1 1.6
4.0
24 7.2
96.0
+
- -
-
1 2.0
4.0
7 5.6
28.0
11 8.8
44.0
6 5.7
24.0
Don't know / No
response
20
4.9
11
5.8 55.0
9
4.2 45.0
2
40.0 10.0
2
5.4 10.0
5
5.4 25.0
7
5.7 35.0
4
4.3 20.0
-
- -
4
6.6 20.0
14
4.2 70.0
2
20.0 10.0
7
14.0 35.0
+++
1
0.8 5.0
--
-
- -
12
11.3 60.0
+++
Better road access /
maintenance
17
4.2
7
3.7
41.2
10
4.7
58.8
-
-
-
4
10.8
23.5 ++
-
-
-
7
5.7
41.2
3
3.2
17.6
3
5.5
17.6
2
3.3
11.8
15
4.5
88.2
-
-
-
5
10.0
29.4 ++
6
4.8
35.3
1
0.8
5.9 --
5
4.7
29.4
Increased
employment and
business
opportunities
16 3.9
8 4.2
50.0
8 3.7
50.0
- -
-
- -
-
6 6.5
37.5
7 5.7
43.8
3 3.2
18.8
- -
-
2 3.3
12.5
14 4.2
87.5
- -
-
1 2.0
6.3
8 6.4
50.0
+
4 3.2
25.0
3 2.8
18.8
Improve beach
maintenance
13
3.2
7
3.7
53.8
6
2.8
46.2
-
-
-
-
-
-
5
5.4
38.5
5
4.1
38.5
-
-
-
3
5.5
23.1
4
6.6
30.8
9
2.7
69.2
-
-
-
1
2.0
7.7
3
2.4
23.1
6
4.8
46.2
3
2.8
23.1
More youth
facilities
10
2.5
5
2.6 50.0
5
2.3 50.0
-
- -
2
5.4 20.0
1
1.1 10.0
3
2.4 30.0
1
1.1 10.0
3
5.5 30.0
-
- -
10
3.0 100.0
-
- -
1
2.0 10.0
4
3.2 40.0
3
2.4 30.0
2
1.9 20.0
No highrise
8
2.0
5
2.6
62.5
3
1.4
37.5
-
-
-
1
2.7
12.5
2
2.2
25.0
2
1.6
25.0
3
3.2
37.5
-
-
-
-
-
-
8
2.4
100.0
-
-
-
-
-
-
2
1.6
25.0
4
3.2
50.0
2
1.9
25.0


Table 21: 3. There are many things that people use to judge their lifestyle and the quality of their
neighbourhood and communities. Please tell me three things that are important to you.
FIRST
Total
Gender Age Group Home ownership Location
Male
Fe-
male
18-24
yrs
25-34
yrs
35-44
yrs
45-54
yrs
55-64
yrs
65 yrs
and
over
Rent
ing
Own
home Other Nth. Mid. Sth.
On-
line
Unweighted Base 406
100.0
191
47.0
100.0
215
53.0
100.0
5
1.2
100.0
37
9.1
100.0
93
22.9
100.0
123
30.3
100.0
93
22.9
100.0
55
13.5
100.0
61
15.0
100.0
335
82.5
100.0
10
2.5
100.0
50
12.3
100.0
125
30.8
100.0
125
30.8
100.0
106
26.1
100.0
Community
consultation
7
1.7
2
1.0 28.6
5
2.3 71.4
-
- -
2
5.4 28.6
+
-
- -
3
2.4 42.9
2
2.2 28.6
-
- -
-
- -
7
2.1 100.0
-
- -
1
2.0 14.3
2
1.6 28.6
3
2.4 42.9
1
0.9 14.3
Enhance tourism
opportunities
6
1.5
3
1.6
50.0
3
1.4
50.0
-
-
-
-
-
-
3
3.2
50.0
-
-
-
3
3.2
50.0
-
-
-
2
3.3
33.3
4
1.2
66.7
-
-
-
5
10.0
83.3 +++
-
-
-
1
0.8
16.7
-
-
-
Affordable housing
5
1.2
2
1.0 40.0
3
1.4 60.0
-
- -
2
5.4 40.0
++
-
- -
1
0.8 20.0
2
2.2 40.0
-
- -
-
- -
5
1.5 100.0
-
- -
-
- -
2
1.6 40.0
3
2.4 60.0
-
- -
Better transport
options
4
1.0
2
1.0
50.0
2
0.9
50.0
-
-
-
-
-
-
1
1.1
25.0
2
1.6
50.0
1
1.1
25.0
-
-
-
-
-
-
3
0.9
75.0
1
10.0
25.0
-
-
-
2
1.6
50.0
1
0.8
25.0
1
0.9
25.0
Location and
lifestyle
4 1.0
3 1.6
75.0
1 0.5
25.0
- -
-
- -
-
2 2.2
50.0
1 0.8
25.0
- -
-
1 1.8
25.0
1 1.6
25.0
3 0.9
75.0
- -
-
- -
-
1 0.8
25.0
3 2.4
75.0
+
- -
-
Health services are
good here
1
0.2
1
0.5 100.0
-
- -
-
- -
-
- -
-
- -
-
- -
1
1.1 100.0
+
-
- -
-
- -
1
0.3 100.0
-
- -
-
- -
-
- -
1
0.8 100.0
-
- -
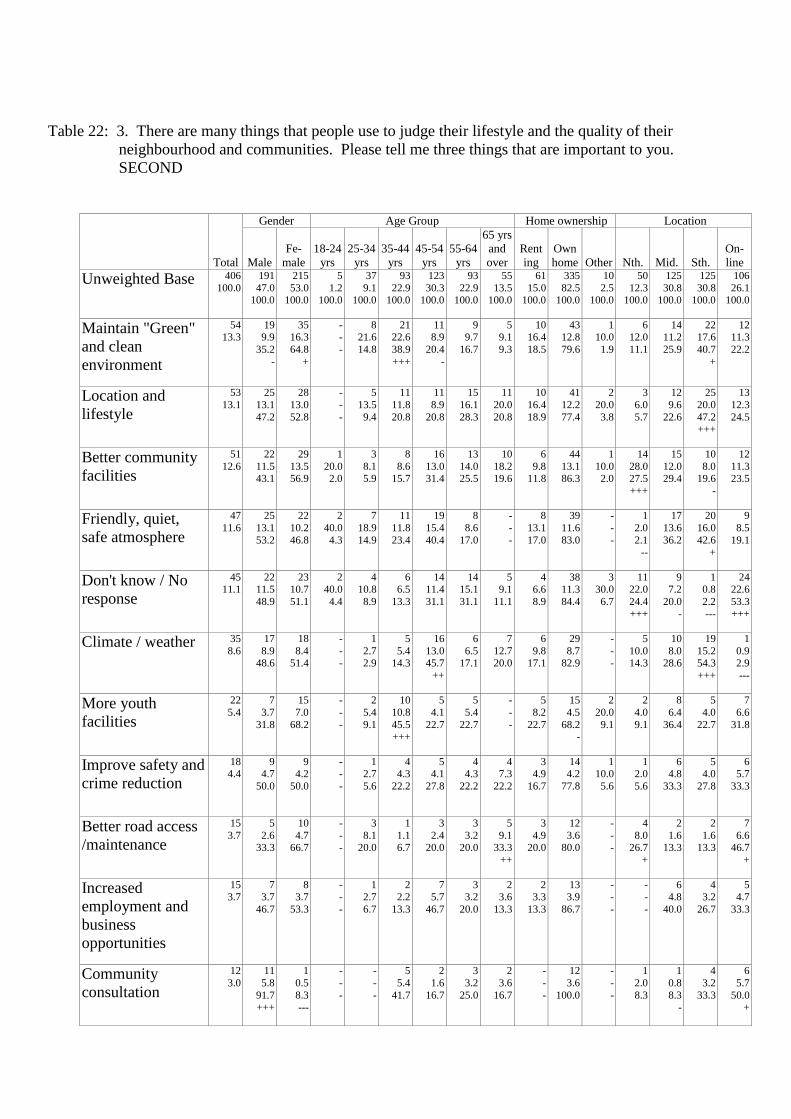
Table 22: 3. There are many things that people use to judge their lifestyle and the quality of their
neighbourhood and communities. Please tell me three things that are important to you.
SECOND
Total
Gender Age Group Home ownership Location
Male
Fe-
male
18-24
yrs
25-34
yrs
35-44
yrs
45-54
yrs
55-64
yrs
65 yrs
and
over
Rent
ing
Own
home Other Nth. Mid. Sth.
On-
line
Unweighted Base 406
100.0
191
47.0 100.0
215
53.0 100.0
5
1.2 100.0
37
9.1 100.0
93
22.9 100.0
123
30.3 100.0
93
22.9 100.0
55
13.5 100.0
61
15.0 100.0
335
82.5 100.0
10
2.5 100.0
50
12.3 100.0
125
30.8 100.0
125
30.8 100.0
106
26.1 100.0
Maintain "Green"
and clean
environment
54 13.3
19 9.9
35.2
-
35 16.3
64.8
+
- -
-
8 21.6
14.8
21 22.6
38.9
+++
11 8.9
20.4
-
9 9.7
16.7
5 9.1
9.3
10 16.4
18.5
43 12.8
79.6
1 10.0
1.9
6 12.0
11.1
14 11.2
25.9
22 17.6
40.7
+
12 11.3
22.2
Location and
lifestyle
53
13.1
25
13.1
47.2
28
13.0
52.8
-
-
-
5
13.5
9.4
11
11.8
20.8
11
8.9
20.8
15
16.1
28.3
11
20.0
20.8
10
16.4
18.9
41
12.2
77.4
2
20.0
3.8
3
6.0
5.7
12
9.6
22.6
25
20.0
47.2 +++
13
12.3
24.5
Better community
facilities
51
12.6
22
11.5 43.1
29
13.5 56.9
1
20.0 2.0
3
8.1 5.9
8
8.6 15.7
16
13.0 31.4
13
14.0 25.5
10
18.2 19.6
6
9.8 11.8
44
13.1 86.3
1
10.0 2.0
14
28.0 27.5
+++
15
12.0 29.4
10
8.0 19.6
-
12
11.3 23.5
Friendly, quiet,
safe atmosphere
47
11.6
25
13.1
53.2
22
10.2
46.8
2
40.0
4.3
7
18.9
14.9
11
11.8
23.4
19
15.4
40.4
8
8.6
17.0
-
-
-
8
13.1
17.0
39
11.6
83.0
-
-
-
1
2.0
2.1 --
17
13.6
36.2
20
16.0
42.6 +
9
8.5
19.1
Don't know / No
response
45 11.1
22 11.5
48.9
23 10.7
51.1
2 40.0
4.4
4 10.8
8.9
6 6.5
13.3
14 11.4
31.1
14 15.1
31.1
5 9.1
11.1
4 6.6
8.9
38 11.3
84.4
3 30.0
6.7
11 22.0
24.4
+++
9 7.2
20.0
-
1 0.8
2.2
---
24 22.6
53.3
+++
Climate / weather
35
8.6
17
8.9 48.6
18
8.4 51.4
-
- -
1
2.7 2.9
5
5.4 14.3
16
13.0 45.7
++
6
6.5 17.1
7
12.7 20.0
6
9.8 17.1
29
8.7 82.9
-
- -
5
10.0 14.3
10
8.0 28.6
19
15.2 54.3
+++
1
0.9 2.9
---
More youth
facilities
22
5.4
7
3.7
31.8
15
7.0
68.2
-
-
-
2
5.4
9.1
10
10.8
45.5 +++
5
4.1
22.7
5
5.4
22.7
-
-
-
5
8.2
22.7
15
4.5
68.2 -
2
20.0
9.1
2
4.0
9.1
8
6.4
36.4
5
4.0
22.7
7
6.6
31.8
Improve safety and
crime reduction
18 4.4
9 4.7
50.0
9 4.2
50.0
- -
-
1 2.7
5.6
4 4.3
22.2
5 4.1
27.8
4 4.3
22.2
4 7.3
22.2
3 4.9
16.7
14 4.2
77.8
1 10.0
5.6
1 2.0
5.6
6 4.8
33.3
5 4.0
27.8
6 5.7
33.3
Better road access
/maintenance
15
3.7
5
2.6 33.3
10
4.7 66.7
-
- -
3
8.1 20.0
1
1.1 6.7
3
2.4 20.0
3
3.2 20.0
5
9.1 33.3
++
3
4.9 20.0
12
3.6 80.0
-
- -
4
8.0 26.7
+
2
1.6 13.3
2
1.6 13.3
7
6.6 46.7
+
Increased
employment and
business
opportunities
15 3.7
7 3.7
46.7
8 3.7
53.3
- -
-
1 2.7
6.7
2 2.2
13.3
7 5.7
46.7
3 3.2
20.0
2 3.6
13.3
2 3.3
13.3
13 3.9
86.7
- -
-
- -
-
6 4.8
40.0
4 3.2
26.7
5 4.7
33.3
Community
consultation
12
3.0
11
5.8
91.7 +++
1
0.5
8.3 ---
-
-
-
-
-
-
5
5.4
41.7
2
1.6
16.7
3
3.2
25.0
2
3.6
16.7
-
-
-
12
3.6
100.0
-
-
-
1
2.0
8.3
1
0.8
8.3 -
4
3.2
33.3
6
5.7
50.0 +

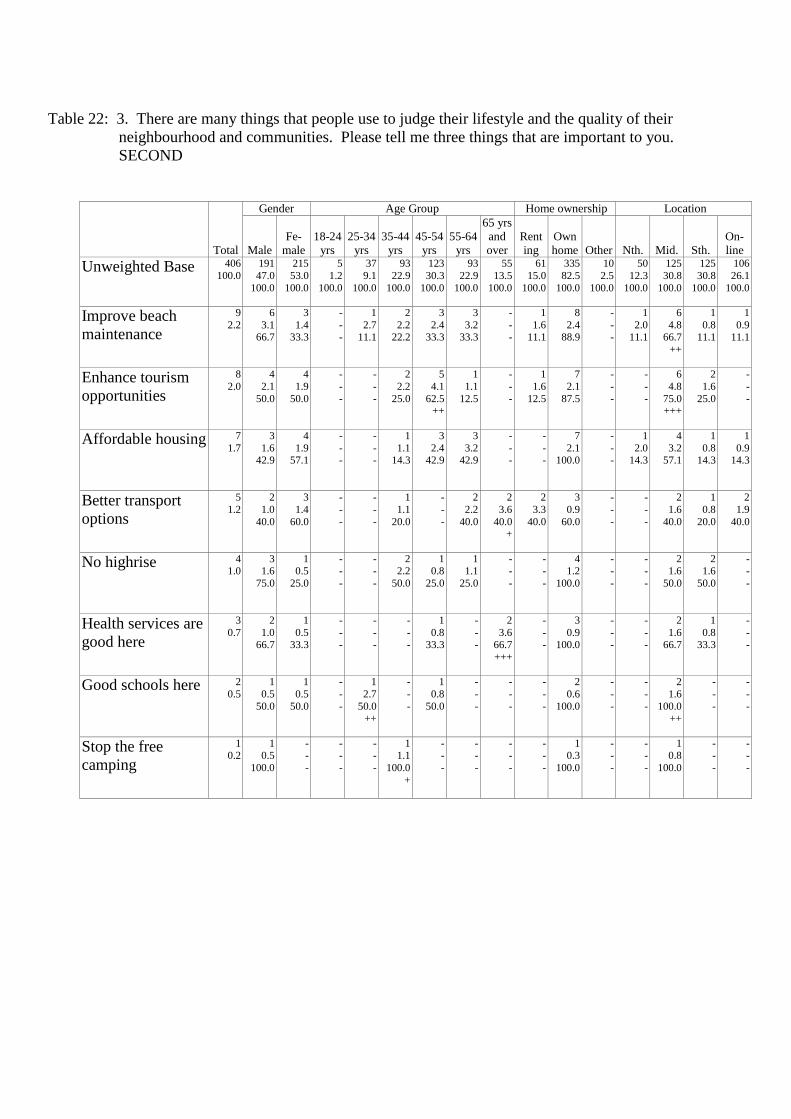
Table 22: 3. There are many things that people use to judge their lifestyle and the quality of their
neighbourhood and communities. Please tell me three things that are important to you.
SECOND
Total
Gender Age Group Home ownership Location
Male
Fe-
male
18-24
yrs
25-34
yrs
35-44
yrs
45-54
yrs
55-64
yrs
65 yrs
and
over
Rent
ing
Own
home Other Nth. Mid. Sth.
On-
line
Unweighted Base 406
100.0
191
47.0
100.0
215
53.0
100.0
5
1.2
100.0
37
9.1
100.0
93
22.9
100.0
123
30.3
100.0
93
22.9
100.0
55
13.5
100.0
61
15.0
100.0
335
82.5
100.0
10
2.5
100.0
50
12.3
100.0
125
30.8
100.0
125
30.8
100.0
106
26.1
100.0
Improve beach
maintenance
9
2.2
6
3.1 66.7
3
1.4 33.3
-
- -
1
2.7 11.1
2
2.2 22.2
3
2.4 33.3
3
3.2 33.3
-
- -
1
1.6 11.1
8
2.4 88.9
-
- -
1
2.0 11.1
6
4.8 66.7
++
1
0.8 11.1
1
0.9 11.1
Enhance tourism
opportunities
8
2.0
4
2.1
50.0
4
1.9
50.0
-
-
-
-
-
-
2
2.2
25.0
5
4.1
62.5 ++
1
1.1
12.5
-
-
-
1
1.6
12.5
7
2.1
87.5
-
-
-
-
-
-
6
4.8
75.0 +++
2
1.6
25.0
-
-
-
Affordable housing
7
1.7
3
1.6 42.9
4
1.9 57.1
-
- -
-
- -
1
1.1 14.3
3
2.4 42.9
3
3.2 42.9
-
- -
-
- -
7
2.1 100.0
-
- -
1
2.0 14.3
4
3.2 57.1
1
0.8 14.3
1
0.9 14.3
Better transport
options
5
1.2
2
1.0
40.0
3
1.4
60.0
-
-
-
-
-
-
1
1.1
20.0
-
-
-
2
2.2
40.0
2
3.6
40.0 +
2
3.3
40.0
3
0.9
60.0
-
-
-
-
-
-
2
1.6
40.0
1
0.8
20.0
2
1.9
40.0
No highrise
4 1.0
3 1.6
75.0
1 0.5
25.0
- -
-
- -
-
2 2.2
50.0
1 0.8
25.0
1 1.1
25.0
- -
-
- -
-
4 1.2
100.0
- -
-
- -
-
2 1.6
50.0
2 1.6
50.0
- -
-
Health services are
good here
3
0.7
2
1.0 66.7
1
0.5 33.3
-
- -
-
- -
-
- -
1
0.8 33.3
-
- -
2
3.6 66.7
+++
-
- -
3
0.9 100.0
-
- -
-
- -
2
1.6 66.7
1
0.8 33.3
-
- -
Good schools here
2
0.5
1
0.5
50.0
1
0.5
50.0
-
-
-
1
2.7
50.0 ++
-
-
-
1
0.8
50.0
-
-
-
-
-
-
-
-
-
2
0.6
100.0
-
-
-
-
-
-
2
1.6
100.0 ++
-
-
-
-
-
-
Stop the free
camping
1 0.2
1 0.5
100.0
- -
-
- -
-
- -
-
1 1.1
100.0
+
- -
-
- -
-
- -
-
- -
-
1 0.3
100.0
- -
-
- -
-
1 0.8
100.0
- -
-
- -
-

Table 23: 3. There are many things that people use to judge their lifestyle and the quality of their
neighbourhood and communities. Please tell me three things that are important to you.
THIRD
Total
Gender Age Group Home ownership Location
Male
Fe-
male
18-24
yrs
25-34
yrs
35-44
yrs
45-54
yrs
55-64
yrs
65 yrs
and
over
Rent
ing
Own
home Other Nth. Mid. Sth.
On-
line
Unweighted Base 406
100.0
191
47.0 100.0
215
53.0 100.0
5
1.2 100.0
37
9.1 100.0
93
22.9 100.0
123
30.3 100.0
93
22.9 100.0
55
13.5 100.0
61
15.0 100.0
335
82.5 100.0
10
2.5 100.0
50
12.3 100.0
125
30.8 100.0
125
30.8 100.0
106
26.1 100.0
Don't know / No
response
74 18.2
31 16.2
41.9
43 20.0
58.1
3 60.0
4.1
4 10.8
5.4
11 11.8
14.9
-
24 19.5
32.4
24 25.8
32.4
++
8 14.5
10.8
10 16.4
13.5
61 18.2
82.4
3 30.0
4.1
13 26.0
17.6
17 13.6
23.0
9 7.2
12.2
---
35 33.0
47.3
+++
Location and
lifestyle
53
13.1
30
15.7 56.6
23
10.7 43.4
2
40.0 3.8
3
8.1 5.7
14
15.1 26.4
17
13.8 32.1
10
10.8 18.9
7
12.7 13.2
11
18.0 20.8
40
11.9 75.5
2
20.0 3.8
8
16.0 15.1
19
15.2 35.8
18
14.4 34.0
8
7.5 15.1
-
Maintain "Green"
and clean
environment
32 7.9
14 7.3
43.8
18 8.4
56.3
- -
-
3 8.1
9.4
7 7.5
21.9
11 8.9
34.4
4 4.3
12.5
7 12.7
21.9
2 3.3
6.3
30 9.0
93.8
+
- -
-
3 6.0
9.4
13 10.4
40.6
13 10.4
40.6
3 2.8
9.4
--
Friendly, quiet,
safe atmosphere
31
7.6
18
9.4
58.1
13
6.0
41.9
-
-
-
2
5.4
6.5
8
8.6
25.8
10
8.1
32.3
9
9.7
29.0
2
3.6
6.5
6
9.8
19.4
25
7.5
80.6
-
-
-
5
10.0
16.1
11
8.8
35.5
13
10.4
41.9
2
1.9
6.5 ---
Community
consultation
30 7.4
16 8.4
53.3
14 6.5
46.7
- -
-
8 21.6
26.7
+++
5 5.4
16.7
9 7.3
30.0
4 4.3
13.3
4 7.3
13.3
1 1.6
3.3
-
28 8.4
93.3
1 10.0
3.3
1 2.0
3.3
15 12.0
50.0
++
8 6.4
26.7
6 5.7
20.0
Better community
facilities
21
5.2
14
7.3 66.7
+
7
3.3 33.3
-
-
- -
2
5.4 9.5
4
4.3 19.0
7
5.7 33.3
7
7.5 33.3
1
1.8 4.8
5
8.2 23.8
16
4.8 76.2
-
- -
2
4.0 9.5
5
4.0 23.8
8
6.4 38.1
6
5.7 28.6
Health services are
good here
21
5.2
5
2.6
23.8 --
16
7.4
76.2 ++
-
-
-
-
-
-
3
3.2
14.3
2
1.6
9.5 --
8
8.6
38.1 +
8
14.5
38.1 +++
5
8.2
23.8
16
4.8
76.2
-
-
-
3
6.0
14.3
5
4.0
23.8
5
4.0
23.8
8
7.5
38.1
Better road access
/maintenance
20 4.9
7 3.7
35.0
13 6.0
65.0
- -
-
1 2.7
5.0
7 7.5
35.0
4 3.3
20.0
3 3.2
15.0
5 9.1
25.0
3 4.9
15.0
16 4.8
80.0
1 10.0
5.0
5 10.0
25.0
+
2 1.6
10.0
--
7 5.6
35.0
6 5.7
30.0
Climate / Weather
20
4.9
7
3.7 35.0
13
6.0 65.0
-
- -
-
- -
8
8.6 40.0
+
8
6.5 40.0
3
3.2 15.0
1
1.8 5.0
2
3.3 10.0
18
5.4 90.0
-
- -
2
4.0 10.0
6
4.8 30.0
10
8.0 50.0
+
2
1.9 10.0
-
More youth
facilities
18 4.4
9 4.7
50.0
9 4.2
50.0
- -
-
5 13.5
27.8
+++
6 6.5
33.3
6 4.9
33.3
1 1.1
5.6
-
- -
-
2 3.3
11.1
14 4.2
77.8
2 20.0
11.1
2 4.0
11.1
7 5.6
38.9
2 1.6
11.1
-
7 6.6
38.9
Increased
employment and
business
opportunities
17
4.2
7
3.7 41.2
10
4.7 58.8
-
- -
3
8.1 17.6
4
4.3 23.5
5
4.1 29.4
4
4.3 23.5
1
1.8 5.9
4
6.6 23.5
12
3.6 70.6
1
10.0 5.9
-
- -
6
4.8 35.3
4
3.2 23.5
7
6.6 41.2
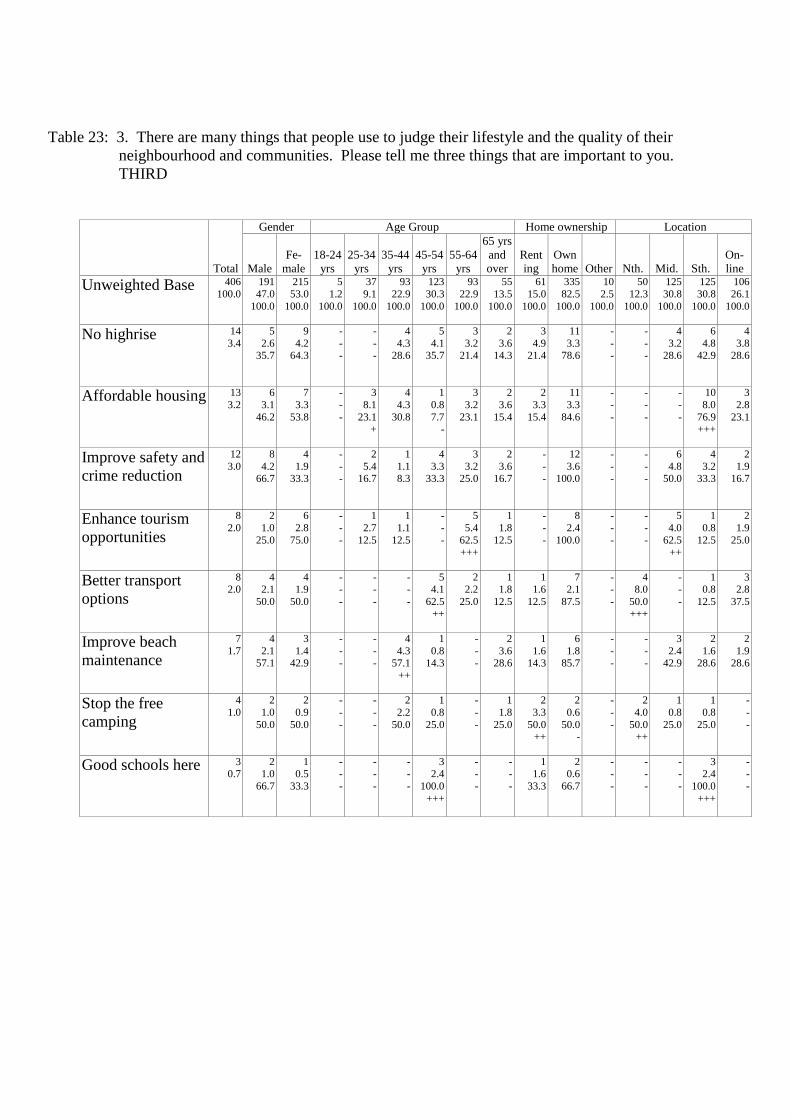
Table 23: 3. There are many things that people use to judge their lifestyle and the quality of their
neighbourhood and communities. Please tell me three things that are important to you.
THIRD
Total
Gender Age Group Home ownership Location
Male
Fe-
male
18-24
yrs
25-34
yrs
35-44
yrs
45-54
yrs
55-64
yrs
65 yrs
and
over
Rent
ing
Own
home Other Nth. Mid. Sth.
On-
line
Unweighted Base 406
100.0
191
47.0
100.0
215
53.0
100.0
5
1.2
100.0
37
9.1
100.0
93
22.9
100.0
123
30.3
100.0
93
22.9
100.0
55
13.5
100.0
61
15.0
100.0
335
82.5
100.0
10
2.5
100.0
50
12.3
100.0
125
30.8
100.0
125
30.8
100.0
106
26.1
100.0
No highrise
14
3.4
5
2.6 35.7
9
4.2 64.3
-
- -
-
- -
4
4.3 28.6
5
4.1 35.7
3
3.2 21.4
2
3.6 14.3
3
4.9 21.4
11
3.3 78.6
-
- -
-
- -
4
3.2 28.6
6
4.8 42.9
4
3.8 28.6
Affordable housing
13
3.2
6
3.1
46.2
7
3.3
53.8
-
-
-
3
8.1
23.1 +
4
4.3
30.8
1
0.8
7.7 -
3
3.2
23.1
2
3.6
15.4
2
3.3
15.4
11
3.3
84.6
-
-
-
-
-
-
-
-
-
10
8.0
76.9 +++
3
2.8
23.1
Improve safety and
crime reduction
12
3.0
8
4.2 66.7
4
1.9 33.3
-
- -
2
5.4 16.7
1
1.1 8.3
4
3.3 33.3
3
3.2 25.0
2
3.6 16.7
-
- -
12
3.6 100.0
-
- -
-
- -
6
4.8 50.0
4
3.2 33.3
2
1.9 16.7
Enhance tourism
opportunities
8
2.0
2
1.0
25.0
6
2.8
75.0
-
-
-
1
2.7
12.5
1
1.1
12.5
-
-
-
5
5.4
62.5 +++
1
1.8
12.5
-
-
-
8
2.4
100.0
-
-
-
-
-
-
5
4.0
62.5 ++
1
0.8
12.5
2
1.9
25.0
Better transport
options
8 2.0
4 2.1
50.0
4 1.9
50.0
- -
-
- -
-
- -
-
5 4.1
62.5
++
2 2.2
25.0
1 1.8
12.5
1 1.6
12.5
7 2.1
87.5
- -
-
4 8.0
50.0
+++
- -
-
1 0.8
12.5
3 2.8
37.5
Improve beach
maintenance
7
1.7
4
2.1 57.1
3
1.4 42.9
-
- -
-
- -
4
4.3 57.1
++
1
0.8 14.3
-
- -
2
3.6 28.6
1
1.6 14.3
6
1.8 85.7
-
- -
-
- -
3
2.4 42.9
2
1.6 28.6
2
1.9 28.6
Stop the free
camping
4
1.0
2
1.0
50.0
2
0.9
50.0
-
-
-
-
-
-
2
2.2
50.0
1
0.8
25.0
-
-
-
1
1.8
25.0
2
3.3
50.0 ++
2
0.6
50.0 -
-
-
-
2
4.0
50.0 ++
1
0.8
25.0
1
0.8
25.0
-
-
-
Good schools here
3 0.7
2 1.0
66.7
1 0.5
33.3
- -
-
- -
-
- -
-
3 2.4
100.0
+++
- -
-
- -
-
1 1.6
33.3
2 0.6
66.7
- -
-
- -
-
- -
-
3 2.4
100.0
+++
- -
-

Table 24: 4. Council is constantly striving to communicate well with residents. What would be the
method/s you would choose to receive information about council?
Total
Gender Age Group Home ownership Location
Male
Fe-
male
18-24
yrs
25-34
yrs
35-44
yrs
45-54
yrs
55-64
yrs
65 yrs
and
over
Rent
ing
Own
home Other Nth. Mid. Sth.
On-
line
Unweighted Base 406
100.0
191
47.0 100.0
215
53.0 100.0
5
1.2 100.0
37
9.1 100.0
93
22.9 100.0
123
30.3 100.0
93
22.9 100.0
55
13.5 100.0
61
15.0 100.0
335
82.5 100.0
10
2.5 100.0
50
12.3 100.0
125
30.8 100.0
125
30.8 100.0
106
26.1 100.0
Local newspaper
255 62.8
114 59.7
44.7
141 65.6
55.3
- -
-
19 51.4
7.5
54 58.1
21.2
73 59.3
28.6
68 73.1
26.7
++
41 74.5
16.1
+
39 63.9
15.3
214 63.9
83.9
2 20.0
0.8
31 62.0
12.2
79 63.2
31.0
86 68.8
33.7
+
59 55.7
23.1
-
Council's website
122
30.0
58
30.4 47.5
64
29.8 52.5
1
20.0 0.8
11
29.7 9.0
24
25.8 19.7
44
35.8 36.1
+
30
32.3 24.6
12
21.8 9.8
22
36.1 18.0
95
28.4 77.9
5
50.0 4.1
11
22.0 9.0
33
26.4 27.0
37
29.6 30.3
41
38.7 33.6
++
Social media
(Facebook, Twitter
etc)
119 29.3
41 21.5
34.5
---
78 36.3
65.5
+++
3 60.0
2.5
13 35.1
10.9
31 33.3
26.1
33 26.8
27.7
27 29.0
22.7
12 21.8
10.1
21 34.4
17.6
91 27.2
76.5
--
7 70.0
5.9
11 22.0
9.2
16 12.8
13.4
---
17 13.6
14.3
---
75 70.8
63.0
+++
Letterbox drops
105
25.9
50
26.2
47.6
55
25.6
52.4
2
40.0
1.9
11
29.7
10.5
26
28.0
24.8
26
21.1
24.8
27
29.0
25.7
13
23.6
12.4
15
24.6
14.3
90
26.9
85.7
-
-
-
13
26.0
12.4
43
34.4
41.0 +++
34
27.2
32.4
15
14.2
14.3 ---
Newsletter from
mayor/councillors
88 21.7
45 23.6
51.1
43 20.0
48.9
- -
-
12 32.4
13.6
+
20 21.5
22.7
26 21.1
29.5
19 20.4
21.6
11 20.0
12.5
7 11.5
8.0
--
80 23.9
90.9
++
1 10.0
1.1
6 12.0
6.8
-
38 30.4
43.2
+++
26 20.8
29.5
18 17.0
20.5
Council's customer
service staff
53
13.1
30
15.7 56.6
23
10.7 43.4
1
20.0 1.9
5
13.5 9.4
11
11.8 20.8
16
13.0 30.2
14
15.1 26.4
6
10.9 11.3
7
11.5 13.2
45
13.4 84.9
1
10.0 1.9
1
2.0 1.9
--
18
14.4 34.0
21
16.8 39.6
13
12.3 24.5
Emails
39
9.6
19
9.9
48.7
20
9.3
51.3
-
-
-
3
8.1
7.7
11
11.8
28.2
11
8.9
28.2
10
10.8
25.6
4
7.3
10.3
6
9.8
15.4
30
9.0
76.9
3
30.0
7.7
3
6.0
7.7
-
-
-
1
0.8
2.6 ---
35
33.0
89.7 +++
Happy with word
of mouth
26 6.4
16 8.4
61.5
10 4.7
38.5
- -
-
2 5.4
7.7
5 5.4
19.2
11 8.9
42.3
6 6.5
23.1
2 3.6
7.7
4 6.6
15.4
22 6.6
84.6
- -
-
- -
-
11 8.8
42.3
15 12.0
57.7
+++
- -
-
Television
10
2.5
4
2.1
40.0
6
2.8
60.0
-
-
-
2
5.4
20.0
5
5.4
50.0 ++
-
-
-
2
2.2
20.0
1
1.8
10.0
3
4.9
30.0
7
2.1
70.0
-
-
-
-
-
-
3
2.4
30.0
7
5.6
70.0 +++
-
-
-
Don't know
6
1.5
2
1.0
33.3
4
1.9
66.7
-
-
-
2
5.4
33.3
++
2
2.2
33.3
1
0.8
16.7
1
1.1
16.7
-
-
-
-
-
-
5
1.5
83.3
1
10.0
16.7
1
2.0
16.7
2
1.6
33.3
3
2.4
50.0
-
-
-
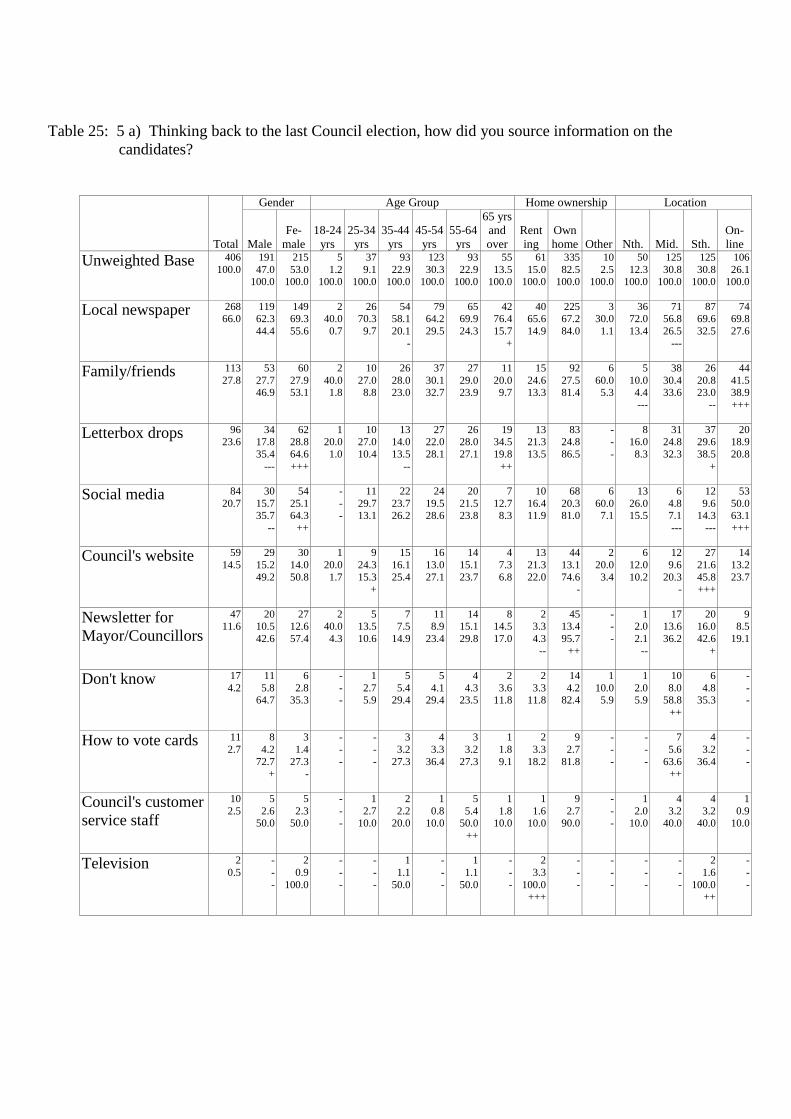
Table 25: 5 a) Thinking back to the last Council election, how did you source information on the
candidates?
Total
Gender Age Group Home ownership Location
Male
Fe-
male
18-24
yrs
25-34
yrs
35-44
yrs
45-54
yrs
55-64
yrs
65 yrs
and
over
Rent
ing
Own
home Other Nth. Mid. Sth.
On-
line
Unweighted Base 406
100.0
191
47.0 100.0
215
53.0 100.0
5
1.2 100.0
37
9.1 100.0
93
22.9 100.0
123
30.3 100.0
93
22.9 100.0
55
13.5 100.0
61
15.0 100.0
335
82.5 100.0
10
2.5 100.0
50
12.3 100.0
125
30.8 100.0
125
30.8 100.0
106
26.1 100.0
Local newspaper
268 66.0
119 62.3
44.4
149 69.3
55.6
2 40.0
0.7
26 70.3
9.7
54 58.1
20.1
-
79 64.2
29.5
65 69.9
24.3
42 76.4
15.7
+
40 65.6
14.9
225 67.2
84.0
3 30.0
1.1
36 72.0
13.4
71 56.8
26.5
---
87 69.6
32.5
74 69.8
27.6
Family/friends
113
27.8
53
27.7 46.9
60
27.9 53.1
2
40.0 1.8
10
27.0 8.8
26
28.0 23.0
37
30.1 32.7
27
29.0 23.9
11
20.0 9.7
15
24.6 13.3
92
27.5 81.4
6
60.0 5.3
5
10.0 4.4
---
38
30.4 33.6
26
20.8 23.0
--
44
41.5 38.9
+++
Letterbox drops
96 23.6
34 17.8
35.4
---
62 28.8
64.6
+++
1 20.0
1.0
10 27.0
10.4
13 14.0
13.5
--
27 22.0
28.1
26 28.0
27.1
19 34.5
19.8
++
13 21.3
13.5
83 24.8
86.5
- -
-
8 16.0
8.3
31 24.8
32.3
37 29.6
38.5
+
20 18.9
20.8
Social media
84
20.7
30
15.7 35.7
--
54
25.1 64.3
++
-
- -
11
29.7 13.1
22
23.7 26.2
24
19.5 28.6
20
21.5 23.8
7
12.7 8.3
10
16.4 11.9
68
20.3 81.0
6
60.0 7.1
13
26.0 15.5
6
4.8 7.1
---
12
9.6 14.3
---
53
50.0 63.1
+++
Council's website
59
14.5
29
15.2
49.2
30
14.0
50.8
1
20.0
1.7
9
24.3
15.3 +
15
16.1
25.4
16
13.0
27.1
14
15.1
23.7
4
7.3
6.8
13
21.3
22.0
44
13.1
74.6 -
2
20.0
3.4
6
12.0
10.2
12
9.6
20.3 -
27
21.6
45.8 +++
14
13.2
23.7
Newsletter for
Mayor/Councillors
47
11.6
20
10.5
42.6
27
12.6
57.4
2
40.0
4.3
5
13.5
10.6
7
7.5
14.9
11
8.9
23.4
14
15.1
29.8
8
14.5
17.0
2
3.3
4.3
--
45
13.4
95.7
++
-
-
-
1
2.0
2.1
--
17
13.6
36.2
20
16.0
42.6
+
9
8.5
19.1
Don't know
17
4.2
11
5.8 64.7
6
2.8 35.3
-
- -
1
2.7 5.9
5
5.4 29.4
5
4.1 29.4
4
4.3 23.5
2
3.6 11.8
2
3.3 11.8
14
4.2 82.4
1
10.0 5.9
1
2.0 5.9
10
8.0 58.8
++
6
4.8 35.3
-
- -
How to vote cards
11
2.7
8
4.2
72.7 +
3
1.4
27.3 -
-
-
-
-
-
-
3
3.2
27.3
4
3.3
36.4
3
3.2
27.3
1
1.8
9.1
2
3.3
18.2
9
2.7
81.8
-
-
-
-
-
-
7
5.6
63.6 ++
4
3.2
36.4
-
-
-
Council's customer
service staff
10
2.5
5
2.6 50.0
5
2.3 50.0
-
- -
1
2.7 10.0
2
2.2 20.0
1
0.8 10.0
5
5.4 50.0
++
1
1.8 10.0
1
1.6 10.0
9
2.7 90.0
-
- -
1
2.0 10.0
4
3.2 40.0
4
3.2 40.0
1
0.9 10.0
Television
2
0.5
-
-
-
2
0.9
100.0
-
-
-
-
-
-
1
1.1
50.0
-
-
-
1
1.1
50.0
-
-
-
2
3.3
100.0 +++
-
-
-
-
-
-
-
-
-
-
-
-
2
1.6
100.0 ++
-
-
-

Table 26: 5 b) (If Family/Friends mentioned in a), How do you think they sourced information on the
candidates?
Total
Gender Age Group Home ownership Location
Male
Fe-
male
18-24
yrs
25-34
yrs
35-44
yrs
45-54
yrs
55-64
yrs
65 yrs
and
over
Rent
ing
Own
home Other Nth. Mid. Sth.
On-
line
Unweighted Base 113
100.0
53
46.9 100.0
60
53.1 100.0
2
1.8 100.0
10
8.8 100.0
26
23.0 100.0
37
32.7 100.0
27
23.9 100.0
11
9.7 100.0
15
13.3 100.0
92
81.4 100.0
6
5.3 100.0
5
4.4 100.0
38
33.6 100.0
26
23.0 100.0
44
38.9 100.0
Local newspaper
62 54.9
28 52.8
45.2
34 56.7
54.8
1 50.0
1.6
5 50.0
8.1
15 57.7
24.2
20 54.1
32.3
16 59.3
25.8
5 45.5
8.1
5 33.3
8.1
55 59.8
88.7
2 33.3
3.2
2 40.0
3.2
18 47.4
29.0
13 50.0
21.0
29 65.9
46.8
+
Social media
37
32.7
16
30.2 43.2
21
35.0 56.8
2
100.0 5.4
4
40.0 10.8
6
23.1 16.2
13
35.1 35.1
11
40.7 29.7
1
9.1 2.7
6
40.0 16.2
28
30.4 75.7
3
50.0 8.1
2
40.0 5.4
1
2.6 2.7
---
3
11.5 8.1
31
70.5 83.8
+++
Don't know
29 25.7
12 22.6
41.4
17 28.3
58.6
- -
-
4 40.0
13.8
5 19.2
17.2
8 21.6
27.6
6 22.2
20.7
6 54.5
20.7
6 40.0
20.7
21 22.8
72.4
2 33.3
6.9
2 40.0
6.9
17 44.7
58.6
+++
7 26.9
24.1
3 6.8
10.3
---
Council's website
14
12.4
4
7.5 28.6
10
16.7 71.4
-
- -
2
20.0 14.3
3
11.5 21.4
3
8.1 21.4
6
22.2 42.9
-
- -
1
6.7 7.1
13
14.1 92.9
-
- -
1
20.0 7.1
3
7.9 21.4
-
- -
10
22.7 71.4
+++
Letterbox drops
14
12.4
5
9.4
35.7
9
15.0
64.3
-
-
-
2
20.0
14.3
2
7.7
14.3
7
18.9
50.0
2
7.4
14.3
1
9.1
7.1
2
13.3
14.3
11
12.0
78.6
1
16.7
7.1
2
40.0
14.3
4
10.5
28.6
1
3.8
7.1
7
15.9
50.0
Council's customer
service staff
7
6.2
5
9.4
71.4
2
3.3
28.6
-
-
-
-
-
-
5
19.2
71.4
1
2.7
14.3
1
3.7
14.3
-
-
-
-
-
-
6
6.5
85.7
1
16.7
14.3
-
-
-
-
-
-
2
7.7
28.6
5
11.4
71.4
+
Newsletter for
Mayor/Councillors
4
3.5
-
- -
4
6.7 100.0
+
-
- -
1
10.0 25.0
-
- -
1
2.7 25.0
2
7.4 50.0
-
- -
-
- -
4
4.3 100.0
-
- -
-
- -
-
- -
-
- -
4
9.1 100.0
++

Table 27: 6 Would you register to receive important Council updates if available using any of the following
methods?
Total
Gender Age Group Home ownership Location
Male
Fe-
male
18-24
yrs
25-34
yrs
35-44
yrs
45-54
yrs
55-64
yrs
65 yrs
and
over
Rent
ing
Own
home Other Nth. Mid. Sth.
On-
line
Unweighted Base 406
100.0
191
47.0 100.0
215
53.0 100.0
5
1.2 100.0
37
9.1 100.0
93
22.9 100.0
123
30.3 100.0
93
22.9 100.0
55
13.5 100.0
61
15.0 100.0
335
82.5 100.0
10
2.5 100.0
50
12.3 100.0
125
30.8 100.0
125
30.8 100.0
106
26.1 100.0
No
171 42.1
80 41.9
46.8
91 42.3
53.2
1 20.0
0.6
12 32.4
7.0
34 36.6
19.9
55 44.7
32.2
34 36.6
19.9
35 63.6
20.5
+++
25 41.0
14.6
145 43.3
84.8
1 10.0
0.6
20 40.0
11.7
70 56.0
40.9
+++
65 52.0
38.0
+++
16 15.1
9.4
---
135
33.3
65
34.0 48.1
70
32.6 51.9
3
60.0 2.2
15
40.5 11.1
33
35.5 24.4
34
27.6 25.2
38
40.9 28.1
+
12
21.8 8.9
-
20
32.8 14.8
110
32.8 81.5
5
50.0 3.7
17
34.0 12.6
30
24.0 22.2
---
34
27.2 25.2
-
54
50.9 40.0
+++
Social network
117 28.8
45 23.6
38.5
--
72 33.5
61.5
++
3 60.0
2.6
13 35.1
11.1
38 40.9
32.5
+++
32 26.0
27.4
21 22.6
17.9
10 18.2
8.5
-
21 34.4
17.9
90 26.9
76.9
-
6 60.0
5.1
14 28.0
12.0
24 19.2
20.5
---
22 17.6
18.8
---
57 53.8
48.7
+++
Online council
newsletter
104
25.6
49
25.7 47.1
55
25.6 52.9
-
- -
10
27.0 9.6
15
16.1 14.4
--
40
32.5 38.5
++
30
32.3 28.8
+
9
16.4 8.7
-
13
21.3 12.5
89
26.6 85.6
2
20.0 1.9
10
20.0 9.6
31
24.8 29.8
38
30.4 36.5
25
23.6 24.0
SMS messages
60
14.8
31
16.2
51.7
29
13.5
48.3
1
20.0
1.7
10
27.0
16.7 ++
18
19.4
30.0
14
11.4
23.3
13
14.0
21.7
4
7.3
6.7 -
13
21.3
21.7
46
13.7
76.7
1
10.0
1.7
3
6.0
5.0 -
12
9.6
20.0 --
30
24.0
50.0 +++
15
14.2
25.0

Table 30: What is the present occupation of the main income-earner in your household?
Total
Gender Age Group Home ownership Location
Male
Fe-
male
18-24
yrs
25-34
yrs
35-44
yrs
45-54
yrs
55-64
yrs
65 yrs
and
over
Rent
ing
Own
home Other Nth. Mid. Sth.
On-
line
Unweighted Base 406
100.0
191
47.0
100.0
215
53.0
100.0
5
1.2
100.0
37
9.1
100.0
93
22.9
100.0
123
30.3
100.0
93
22.9
100.0
55
13.5
100.0
61
15.0
100.0
335
82.5
100.0
10
2.5
100.0
50
12.3
100.0
125
30.8
100.0
125
30.8
100.0
106
26.1
100.0
Manager/Professio
nal
120
29.6
53
27.7 44.2
67
31.2 55.8
2
40.0 1.7
11
29.7 9.2
37
39.8 30.8
++
36
29.3 30.0
30
32.3 25.0
4
7.3 3.3
---
17
27.9 14.2
98
29.3 81.7
5
50.0 4.2
5
10.0 4.2
---
28
22.4 23.3
--
36
28.8 30.0
51
48.1 42.5
+++
Main income-
earner not
working/no
breadwinner
101
24.9
47
24.6
46.5
54
25.1
53.5
-
-
-
1
2.7
1.0 ---
10
10.8
9.9 ---
13
10.6
12.9 ---
27
29.0
26.7
50
90.9
49.5 +++
10
16.4
9.9 -
91
27.2
90.1 ++
-
-
-
15
30.0
14.9
41
32.8
40.6 ++
37
29.6
36.6
8
7.5
7.9 ---
Para-professional/
tradesman
90
22.2
46
24.1 51.1
44
20.5 48.9
2
40.0 2.2
16
43.2 17.8
+++
22
23.7 24.4
33
26.8 36.7
16
17.2 17.8
1
1.8 1.1
---
18
29.5 20.0
70
20.9 77.8
2
20.0 2.2
14
28.0 15.6
26
20.8 28.9
25
20.0 27.8
25
23.6 27.8
Plant/machine
operator/farm
worker
47 11.6
30 15.7
63.8 ++
17 7.9
36.2 --
- -
-
6 16.2
12.8
13 14.0
27.7
19 15.4
40.4
9 9.7
19.1
- -
-
10 16.4
21.3
36 10.7
76.6
1 10.0
2.1
10 20.0
21.3 ++
16 12.8
34.0
17 13.6
36.2
4 3.8
8.5 ---
Clerical/sales/
personal service
29
7.1
11
5.8
37.9
18
8.4
62.1
-
-
-
2
5.4
6.9
9
9.7
31.0
13
10.6
44.8 +
5
5.4
17.2
-
-
-
5
8.2
17.2
23
6.9
79.3
1
10.0
3.4
4
8.0
13.8
6
4.8
20.7
10
8.0
34.5
9
8.5
31.0
Other
17 4.2
4 2.1
23.5
--
13 6.0
76.5
++
1 20.0
5.9
1 2.7
5.9
2 2.2
11.8
9 7.3
52.9
++
4 4.3
23.5
- -
-
1 1.6
5.9
15 4.5
88.2
1 10.0
5.9
- -
-
8 6.4
47.1
- -
-
9 8.5
52.9
++
Student
2
0.5
-
- -
2
0.9 100.0
-
- -
-
- -
-
- -
-
- -
2
2.2 100.0
+++
-
- -
-
- -
2
0.6 100.0
-
- -
2
4.0 100.0
+++
-
- -
-
- -
-
- -

Table 31: Household situation
Total
Gender Age Group Home ownership Location
Male
Fe-
male
18-24
yrs
25-34
yrs
35-44
yrs
45-54
yrs
55-64
yrs
65 yrs
and
over
Rent
ing
Own
home Other Nth. Mid. Sth.
On-
line
Unweighted Base 406
100.0
191
47.0
100.0
215
53.0
100.0
5
1.2
100.0
37
9.1
100.0
93
22.9
100.0
123
30.3
100.0
93
22.9
100.0
55
13.5
100.0
61
15.0
100.0
335
82.5
100.0
10
2.5
100.0
50
12.3
100.0
125
30.8
100.0
125
30.8
100.0
106
26.1
100.0
Living as a couple
189
46.6
95
49.7 50.3
94
43.7 49.7
1
20.0 0.5
10
27.0 5.3
--
30
32.3 15.9
---
55
44.7 29.1
61
65.6 32.3
+++
32
58.2 16.9
+
19
31.1 10.1
---
169
50.4 89.4
+++
1
10.0 0.5
26
52.0 13.8
55
44.0 29.1
64
51.2 33.9
44
41.5 23.3
Living as a family
(2 parent)
120
29.6
50
26.2
41.7
70
32.6
58.3
1
20.0
0.8
24
64.9
20.0 +++
45
48.4
37.5 +++
39
31.7
32.5
9
9.7
7.5 ---
2
3.6
1.7 ---
19
31.1
15.8
96
28.7
80.0
5
50.0
4.2
10
20.0
8.3
37
29.6
30.8
43
34.4
35.8
30
28.3
25.0
Living alone
49 12.1
24 12.6
49.0
25 11.6
51.0
- -
-
2 5.4
4.1
10 10.8
20.4
13 10.6
26.5
12 12.9
24.5
12 21.8
24.5
++
13 21.3
26.5
++
35 10.4
71.4
--
1 10.0
2.0
9 18.0
18.4
12 9.6
24.5
11 8.8
22.4
17 16.0
34.7
Other
20
4.9
7
3.7
35.0
13
6.0
65.0
-
-
-
-
-
-
1
1.1
5.0 -
9
7.3
45.0
3
3.2
15.0
7
12.7
35.0 +++
2
3.3
10.0
18
5.4
90.0
-
-
-
2
4.0
10.0
14
11.2
70.0 +++
-
-
-
4
3.8
20.0
Living as a family
(1 parent)
15 3.7
7 3.7
46.7
8 3.7
53.3
1 20.0
6.7
1 2.7
6.7
4 4.3
26.7
5 4.1
33.3
3 3.2
20.0
1 1.8
6.7
4 6.6
26.7
8 2.4
53.3
---
3 30.0
20.0
2 4.0
13.3
3 2.4
20.0
4 3.2
26.7
6 5.7
40.0
Single /sharing
accommodation
13
3.2
8
4.2
61.5
5
2.3
38.5
2
40.0
15.4
-
-
-
3
3.2
23.1
2
1.6
15.4
5
5.4
38.5
1
1.8
7.7
4
6.6
30.8
9
2.7
69.2
-
-
-
1
2.0
7.7
4
3.2
30.8
3
2.4
23.1
5
4.7
38.5

Table 32: Location
Total
Gender Age Group Home ownership Location
Male
Fe-
male
18-24
yrs
25-34
yrs
35-44
yrs
45-54
yrs
55-64
yrs
65 yrs
and
over
Rent
ing
Own
home Other Nth. Mid. Sth.
On-
line
Unweighted Base 406
100.0
191
47.0 100.0
215
53.0 100.0
5
1.2 100.0
37
9.1 100.0
93
22.9 100.0
123
30.3 100.0
93
22.9 100.0
55
13.5 100.0
61
15.0 100.0
335
82.5 100.0
10
2.5 100.0
50
12.3 100.0
125
30.8 100.0
125
30.8 100.0
106
26.1 100.0
Middle
125 30.8
67 35.1
53.6
+
58 27.0
46.4
-
- -
-
7 18.9
5.6
28 30.1
22.4
43 35.0
34.4
24 25.8
19.2
23 41.8
18.4
+
12 19.7
9.6
--
112 33.4
89.6
++
1 10.0
0.8
- -
-
125 100.0
100.0
+++
- -
-
- -
-
South
125
30.8
64
33.5
51.2
61
28.4
48.8
2
40.0
1.6
14
37.8
11.2
29
31.2
23.2
33
26.8
26.4
32
34.4
25.6
15
27.3
12.0
20
32.8
16.0
105
31.3
84.0
-
-
-
-
-
-
-
-
-
125
100.0
100.0
+++
-
-
-
Online
106 26.1
35 18.3
33.0
---
71 33.0
67.0
+++
2 40.0
1.9
13 35.1
12.3
26 28.0
24.5
29 23.6
27.4
27 29.0
25.5
9 16.4
8.5
-
17 27.9
16.0
82 24.5
77.4
7 70.0
6.6
- -
-
- -
-
- -
-
106 100.0
100.0
+++
North
50
12.3
25
13.1 50.0
25
11.6 50.0
1
20.0 2.0
3
8.1 6.0
10
10.8 20.0
18
14.6 36.0
10
10.8 20.0
8
14.5 16.0
12
19.7 24.0
+
36
10.7 72.0
--
2
20.0 4.0
50
100.0 100.0
+++
-
- -
-
- -
-
- -