Client Satisfaction Benchmarking
21
© 2015 Information Services Group, Inc. All Rights Reserved.
-
Upload
information-services-group-isg -
Category
Business
-
view
333 -
download
0
Transcript of Client Satisfaction Benchmarking

© 2015 Information Services Group, Inc. All Rights Reserved.

© 2015 Information Services Group, Inc. All Rights Reserved.
Chris Pfauser
Client Satisfaction Benchmarking

© 2015 Information Services Group, Inc. All Rights Reserved 3
Agenda
o Today’s client challenges
o Case study in measuring user and business satisfaction
oWhat does this mean for service providers?

© 2015 Information Services Group, Inc. All Rights Reserved 4 4
Today’s Client Challenges

© 2015 Information Services Group, Inc. All Rights Reserved 5
How are clients adapting to the digital imperative?
Clients need ways to:
o support the evolving needs of users across multiple channels
omaximize user satisfaction
oreduce costs to serve

© 2015 Information Services Group, Inc. All Rights Reserved 6
How do clients manage evolutionary change along their digital transformation journey?
Measure & analyze
end user experience
Confirm actions taken
Digest reports
& identify actions
Develop action plan &
implement
Cycle of change
(quarterly/ annually)

© 2015 Information Services Group, Inc. All Rights Reserved 7
How do clients drive efficiency?
1. Understand the barriers and levers to shifting users to lower-cost support channels.
2. Anticipate new channels
0%10%20%30%40%50%60%70%80%90%
100%
Self Service Live Chat Desk Second Level Onsite Support
58 62
Actual usage Customer Satisfaction
$ $$ $$$ Cost to deliver support service by ticket
76

© 2015 Information Services Group, Inc. All Rights Reserved 8
How do clients build strong relationships with service providers?
The Relationship Framework
Op
erat
ion
s Strategic relationship
Operational excellence Trusted partner
Intervention required Not sustainable
High Low
High
Path to strategic engagement
© 2015 Information Services Group, Inc. All Rights Reserved 9
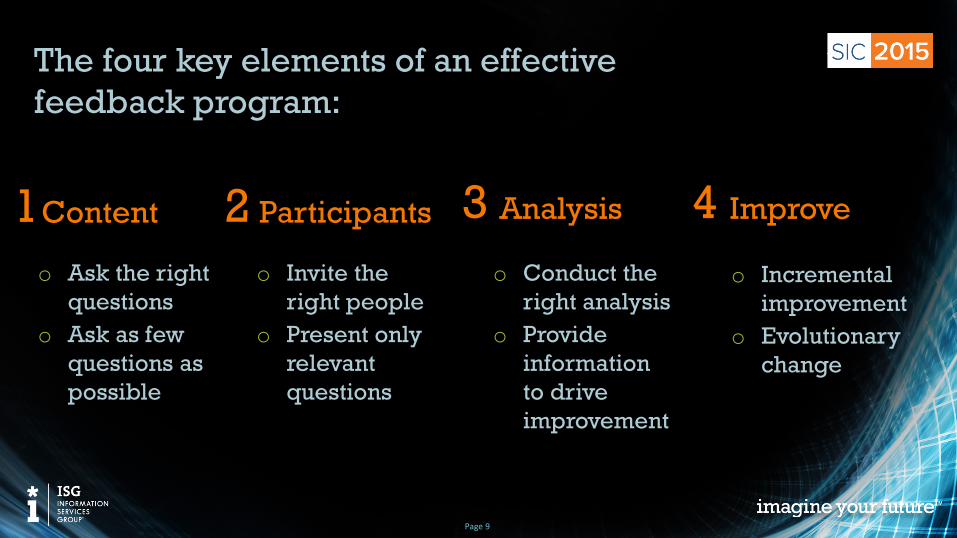
The four key elements of an effective feedback program:
Page 9
Content
o Ask the right questions
o Ask as few questions as possible
1 Participants
o Invite the right people
o Present only relevant questions
2 Analysis
o Conduct the right analysis
o Provide information to drive improvement
3 Improve
o Incremental improvement
o Evolutionary change
4

© 2015 Information Services Group, Inc. All Rights Reserved 10
Savvy clients are using data to make fact-based decisions.
Satis
fact
ion
Impact
Onsite support
Support via email
Support via Portal
2nd Level Support
Ordering and receiving hardware
1st level support (via phone)
Phone/voicemail
Printer/ Multifunction device
Desktop/ Laptop/ ultralite
The Intranet Smartphone
Productivity opportunities
Greatest opportunity for productivity improvements
The Wire Greatest opportunity for productivity improvements

© 2015 Information Services Group, Inc. All Rights Reserved 11 11
A Case Study in User & Business Satisfaction

© 2015 Information Services Group, Inc. All Rights Reserved 12
Research identifies drivers of satisfaction.
In three years, the NPS increased from
-28 to +53.
The Relationship Framework O
per
atio
ns
Strategic relationship
Operational excellence Trusted partner
Intervention required Not sustainable
High Low
High
Path to strategic engagement
2012
2013 2014 2015

© 2015 Information Services Group, Inc. All Rights Reserved 13
How to understand the user experience
~70% of the variation in the service desk satisfaction score can
be explained by just 4 metrics:
o Time to resolve
o Communication/kept up to date
o Quality of outcome
o Staff knowledge/expertise
Page 13
Components of an experience
Process Conduct Outcome
Communication

© 2015 Information Services Group, Inc. All Rights Reserved 14
What are the benefits?
The client can o Define user requirements
o Connect more frequently
o Provide clear, open and timely communication
o Share business knowledge
o Ensure unified understanding of the scope and obligations
The service provider can o Better understand
business outcomes
o Clearly define the roles and responsibilities
o Improve timelines of service delivery
o Take a proactive approach.
o Present innovation.
Both can o Enhance the health
of the relationship
o Clarify roles and responsibilities of both organizations
o Ensure mutual clarity for the ongoing process of project delivery
o Align organizationally and procedurally

© 2015 Information Services Group, Inc. All Rights Reserved 15 15
What does this mean for service providers?

© 2015 Information Services Group, Inc. All Rights Reserved 16
Understanding the current relationship
The client conversation The service provider conversation
Why aren’t we getting the innovation they promised?
CXO
Client Team
Service Provider
Team
They want to attend our strategy meetings, but I think it is just to sell more services.
Delivery Lead
Service Delivery Manager
Service levels are OK, but our stakeholders are unhappy!
Service Delivery Manager
We are delivering according to the contract!
Delivery Lead
They never give us time to respond to their urgent requests!
CXO
How can we get past the day-to-day to a more strategic relationship?

© 2015 Information Services Group, Inc. All Rights Reserved 17
Benchmarking can boost new accounts.
Clients often over-emphasize how good the situation was before outsourcing and underestimate the challenge of the transition process.
Sati
sfac
tion
Q1 Q2 Q3 Q4

© 2015 Information Services Group, Inc. All Rights Reserved 18
Benchmarking can boost accounts at mid-term.
Key Accounts
1
3
2
18 months – measure the baseline
6 months – measure to demonstrate uplift
Uncompetitive renewal – measure customer satisfaction renewal

© 2015 Information Services Group, Inc. All Rights Reserved 19
And benchmarking troubled accounts demonstrates commitment.
Gather feedback from both sides to establish the foundation for building a jointly owned improvement plan.

© 2015 Information Services Group, Inc. All Rights Reserved 20
Measure the business relationship to
oBetter understand the business needs
oWork together
oManage for the future
oImprove service delivery

www.isg-one.com
imagine your future™
let’s connect…