Community Ecology. Climate and the Distribution of Ecological Communities n Communities are...
39
Community Ecology
-
date post
21-Dec-2015 -
Category
Documents
-
view
214 -
download
0
Transcript of Community Ecology. Climate and the Distribution of Ecological Communities n Communities are...

Community Ecology
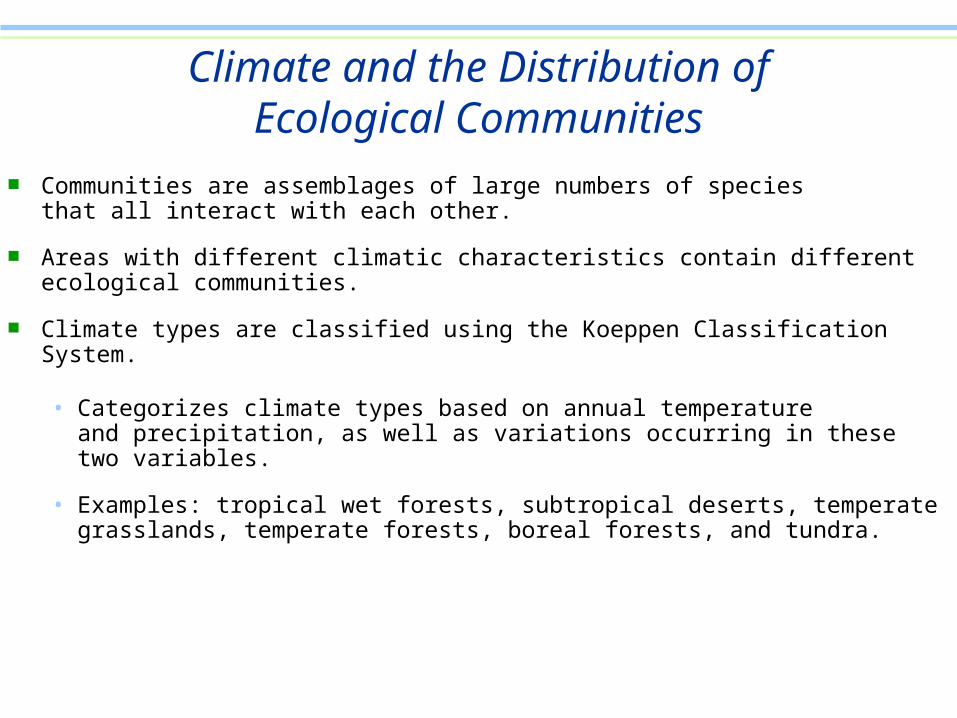
Climate and the Distribution ofEcological Communities
Communities are assemblages of large numbers of speciesthat all interact with each other.
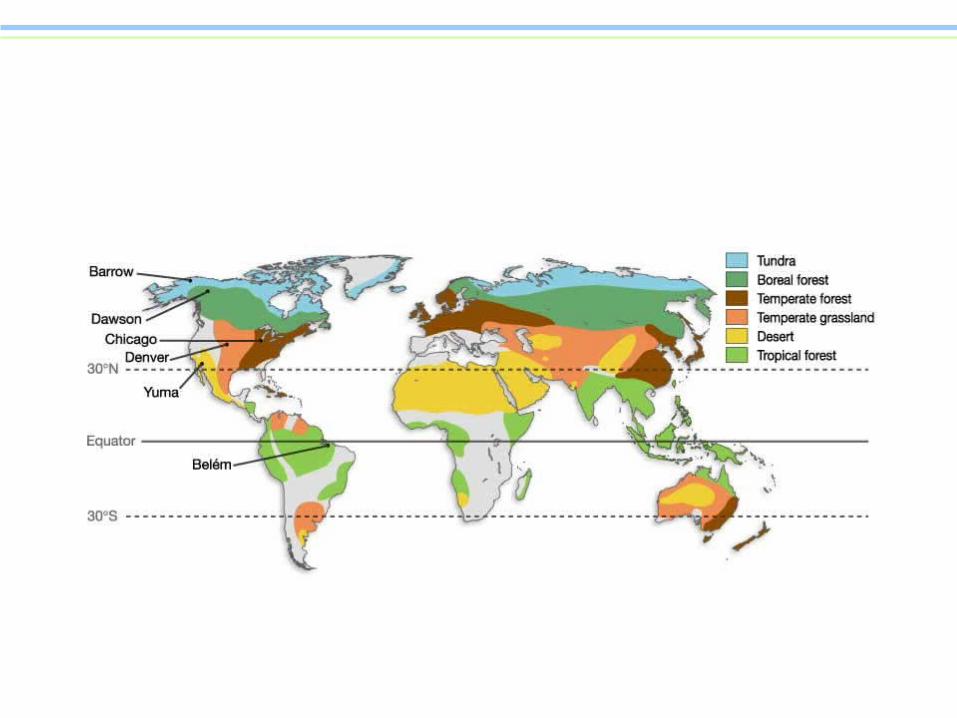
Areas with different climatic characteristics contain different ecological communities.
Climate types are classified using the Koeppen Classification System.
• Categorizes climate types based on annual temperatureand precipitation, as well as variations occurring in these two variables.
• Examples: tropical wet forests, subtropical deserts, temperate grasslands, temperate forests, boreal forests, and tundra.
Climate and the Distribution ofEcological Communities
Productivity is positively correlated with temperature and humidity.
Communities have a characteristic pattern or type of disturbance.
How Predictable Are Community Assemblages?
Two views of community dynamics exist.
• Clements believed that communities are stable, integrated, orderly, and predictable entities.
• Gleason believed communities are neither stable nor predictable, but a matter of history and chance.
• Historical and experimental data support Gleason’s view.
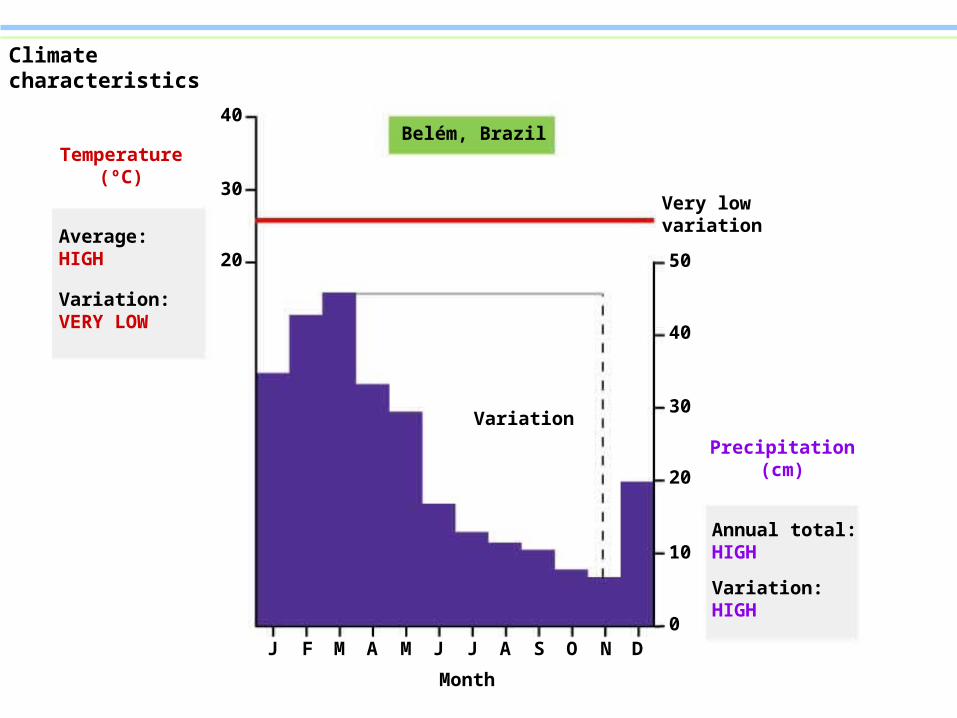
Belém, BrazilTemperature
(ºC)
40
30
20
40
30
20
50
10
0J J JF M MA A S O N D
Variation
Annual total:HIGH
Variation:HIGH
Precipitation(cm)
Very lowvariation
Average:HIGH
Variation:VERY LOW
Month
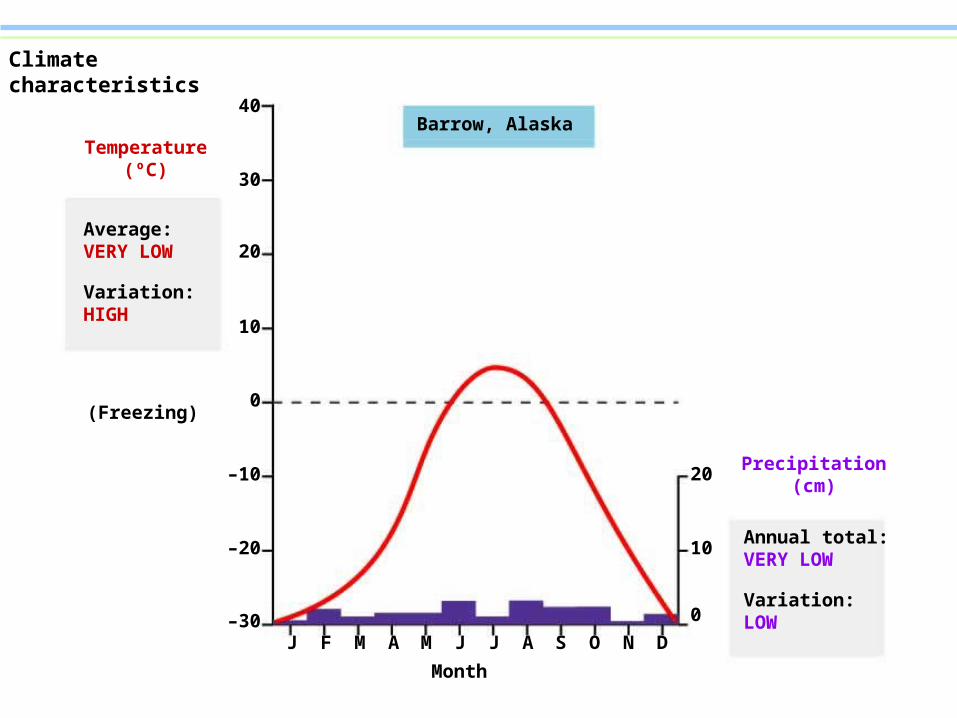
Climate characteristics
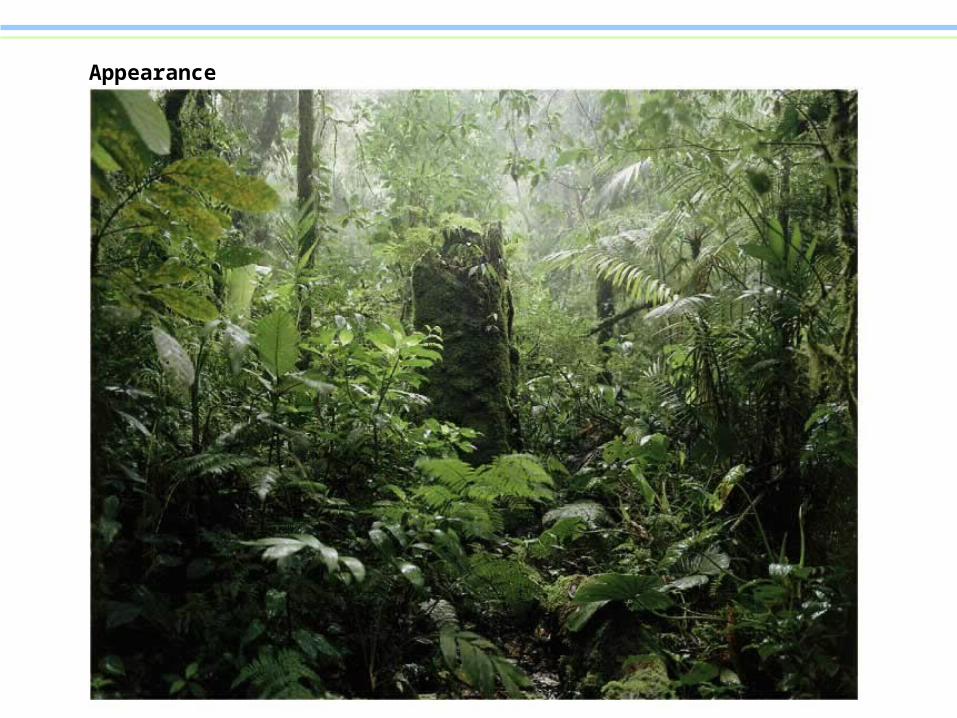
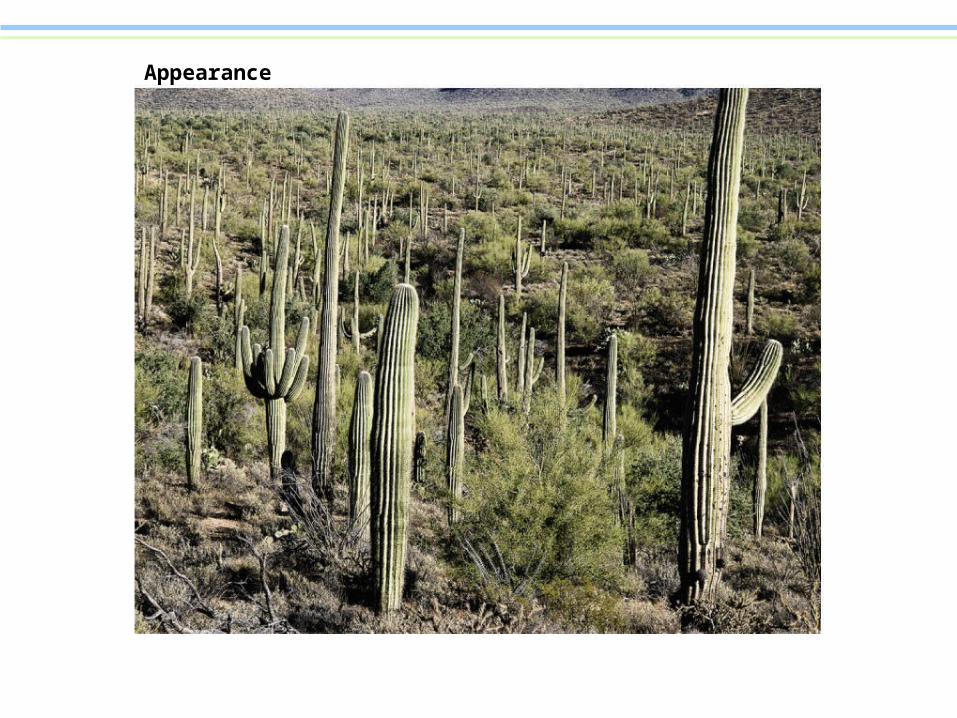
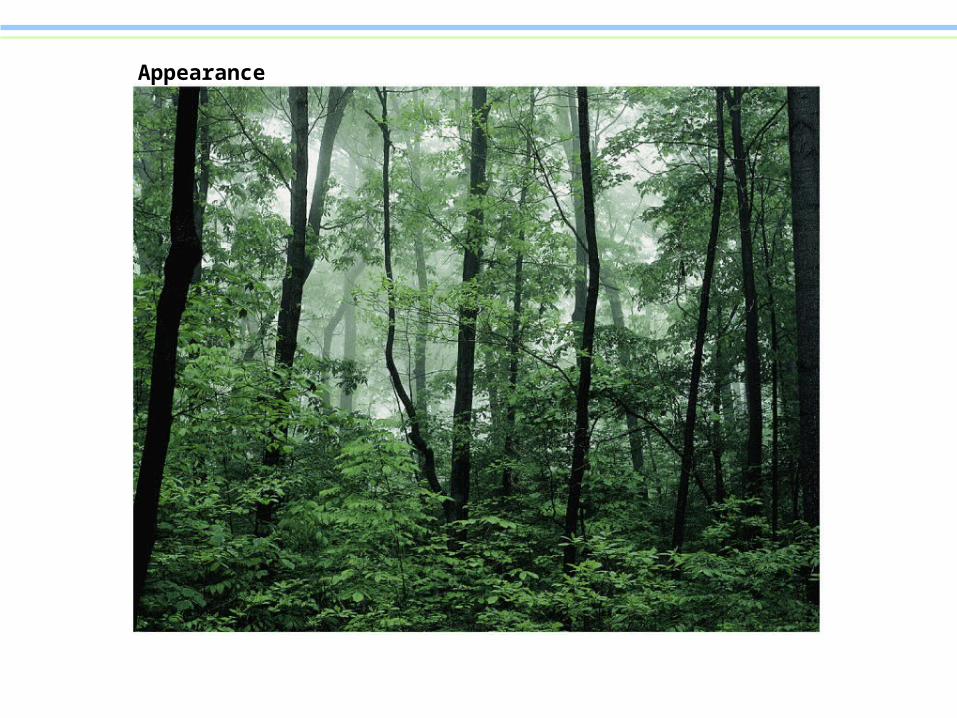
Appearance
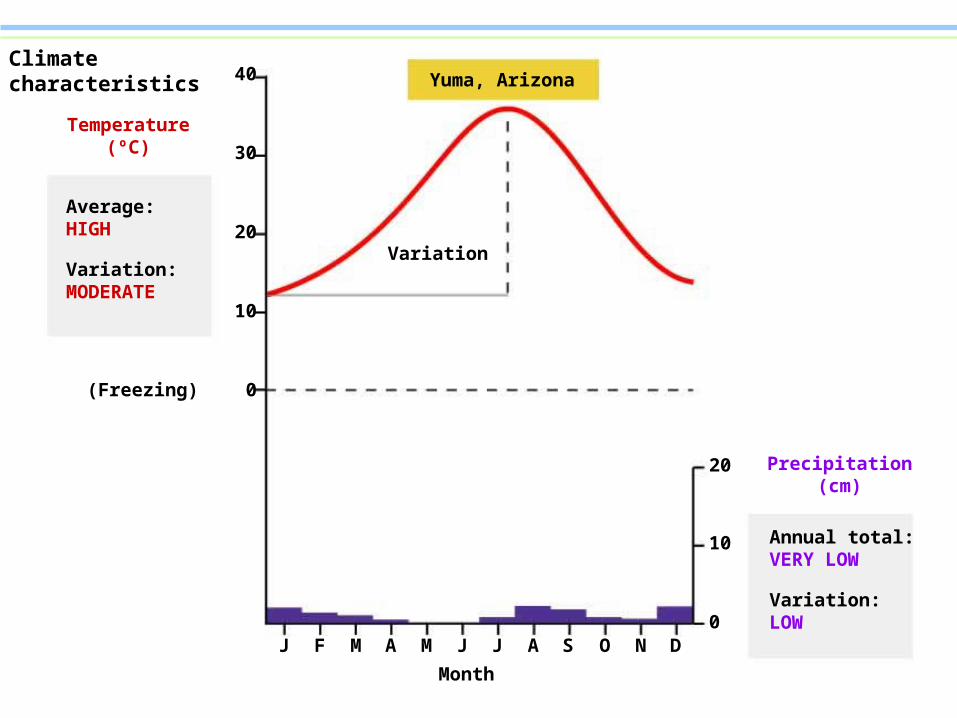
Temperature(ºC)
40
30
20
20
10
0J J JF M MA A S O N D
Annual total:VERY LOW
Variation:LOW
Precipitation(cm)
Variation
Average:HIGH
Variation:MODERATE
Month
10
0
Yuma, Arizona
(Freezing)
Climate characteristics
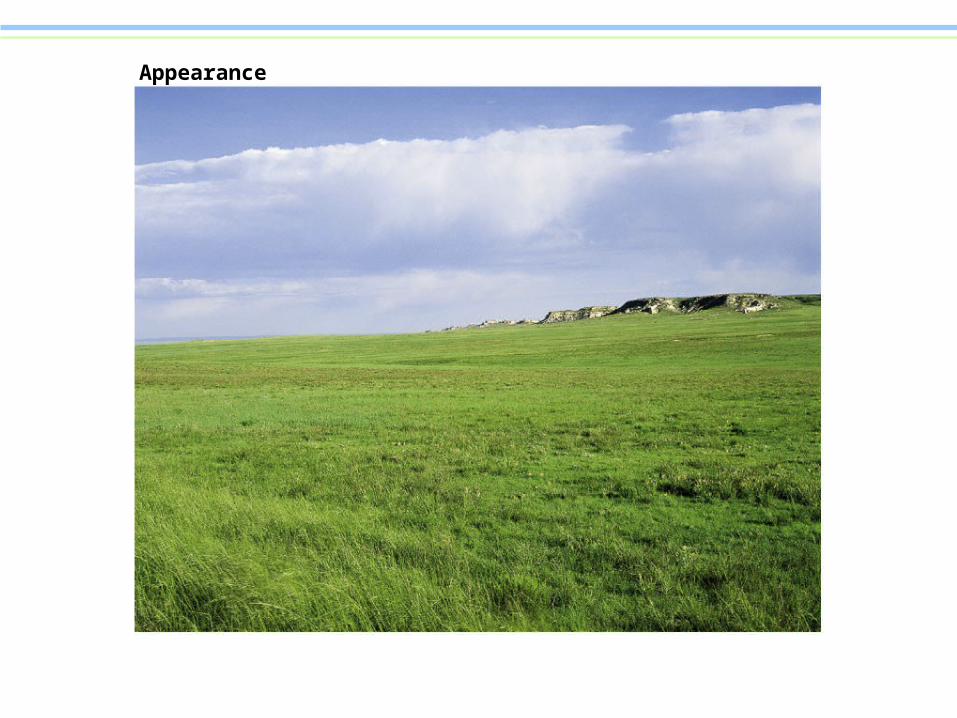
Appearance
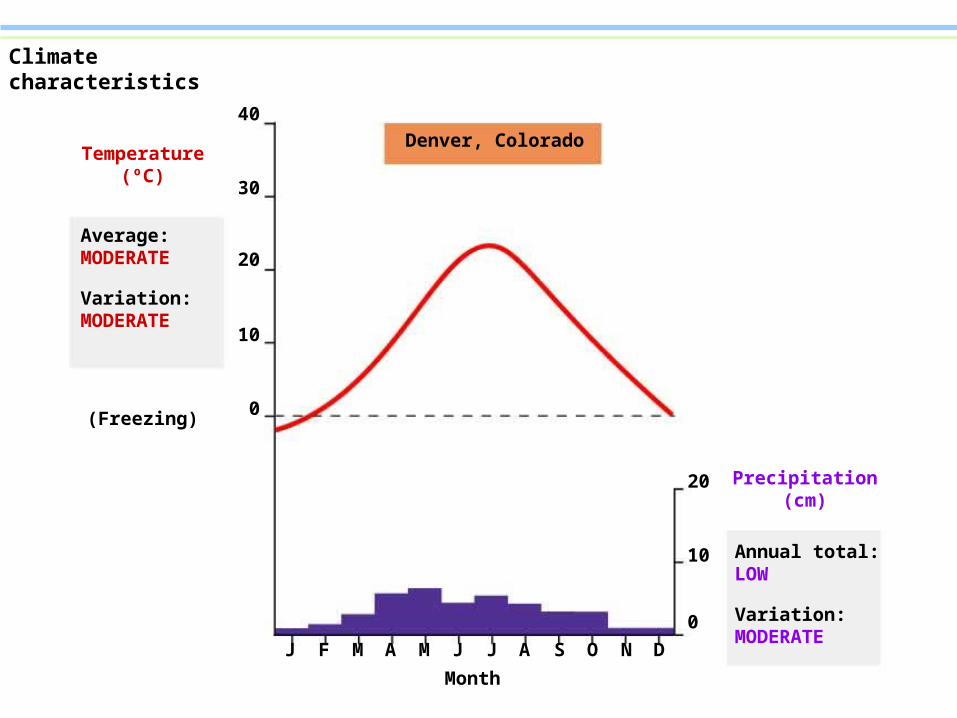
Temperature(ºC)
40
30
20
20
10
0
J J JF M MA A S O N D
Annual total:LOW
Variation:MODERATE
Precipitation(cm)
Average:MODERATE
Variation:MODERATE
Month
10
0
Denver, Colorado
(Freezing)
Climate characteristics
Appearance
Temperature(ºC)
40
30
20
20
10
0
J J JF M MA A S O N D
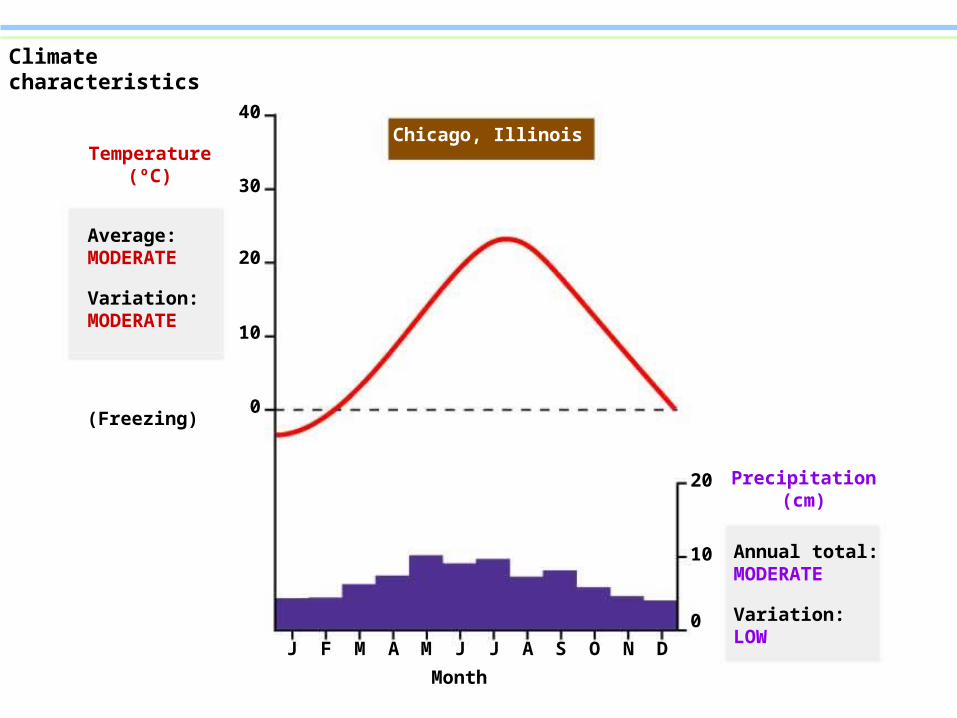
Annual total:MODERATE
Variation:LOW
Precipitation(cm)
Average:MODERATE
Variation:MODERATE
Month
10
0
Chicago, Illinois
(Freezing)
Climate characteristics
Appearance
Temperature(ºC)
40
30
20
20
10
0
J J JF M MA A S O N D
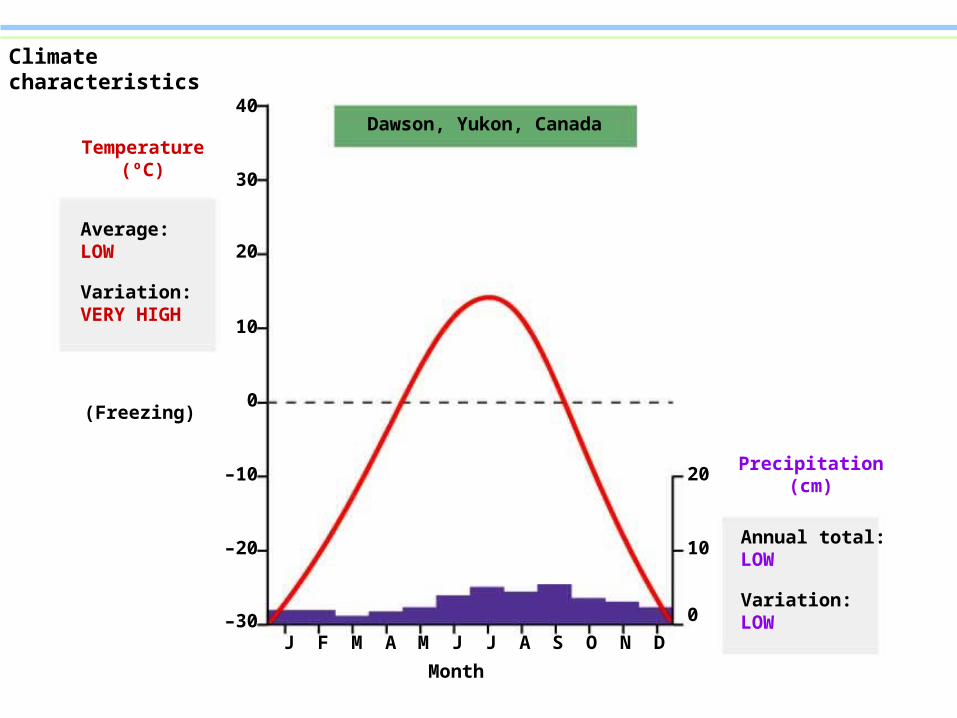
Annual total:LOW
Variation:LOW
Precipitation(cm)
Average:LOW
Variation:VERY HIGH
Month
10
0
Dawson, Yukon, Canada
Climate characteristics
(Freezing)
–10
–20
–30
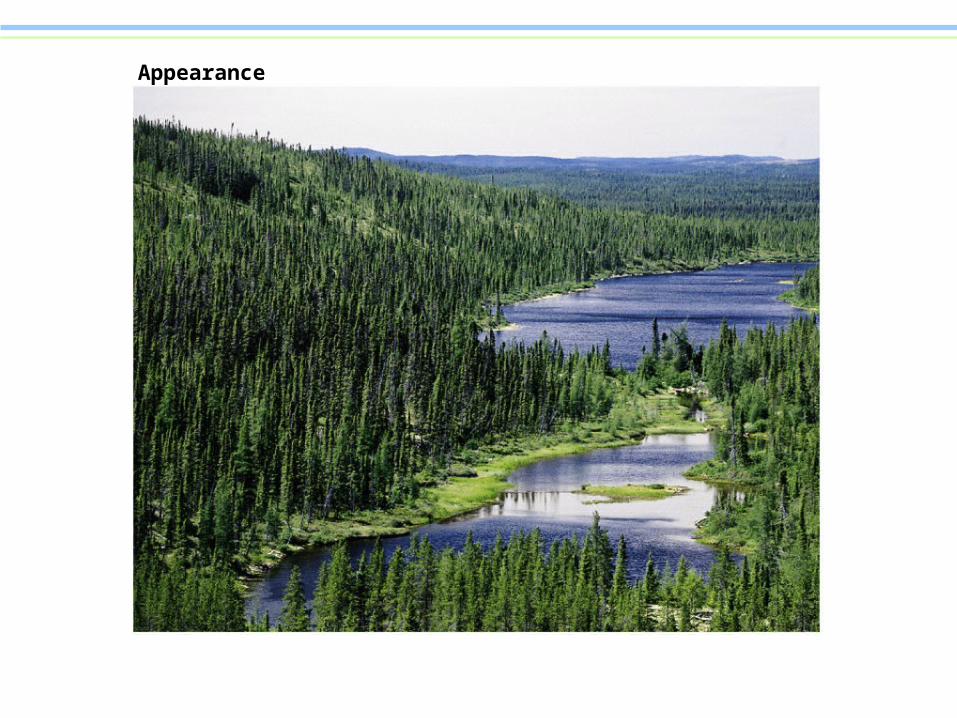
Appearance
Temperature(ºC)
40
30
20
20
10
0
J J JF M MA A S O N D
Annual total:VERY LOW
Variation:LOW
Precipitation(cm)
Average:VERY LOW
Variation:HIGH
Month
10
0
Barrow, Alaska
(Freezing)
–10
–20
–30
Climate characteristics
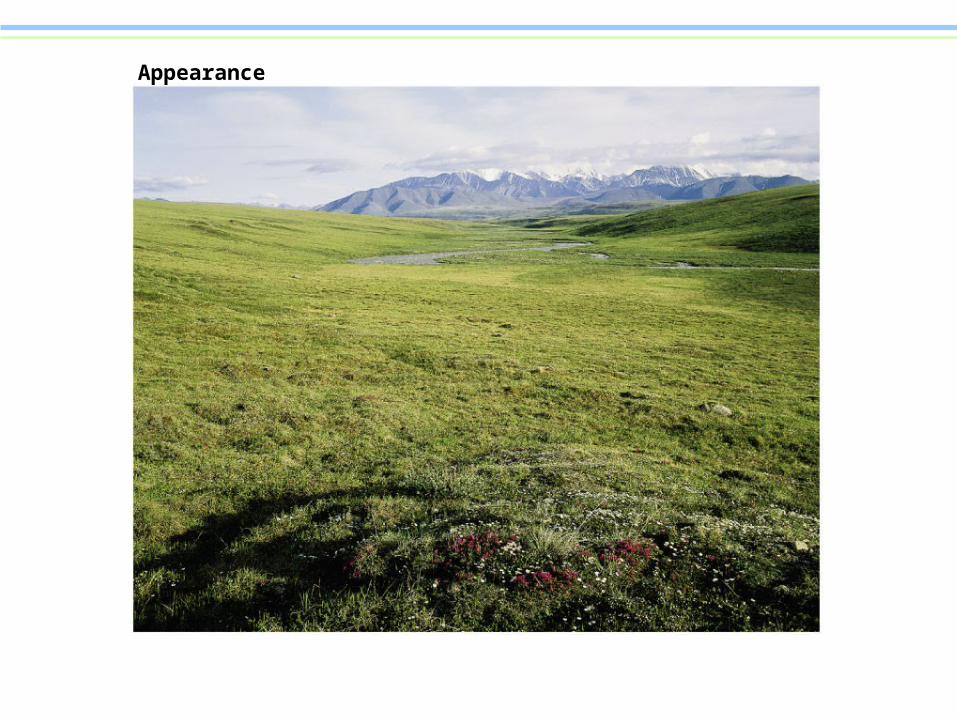
Appearance
1 2 3 4 5 6 7 8 9
10 11 12
1
10
20
30
40
50
60
Ponds
Pla
nkt
on
sp
eci
es(n
um
ber
ed r
ath
er t
han
nam
ed,
for
sim
pli
city
)
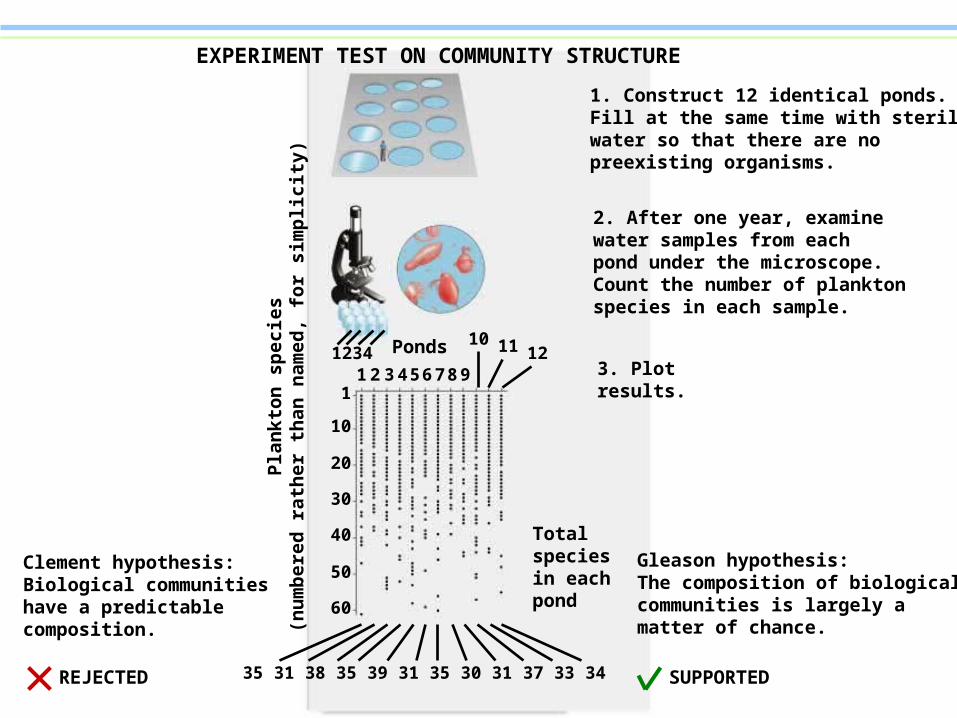
EXPERIMENT TEST ON COMMUNITY STRUCTURE
1. Construct 12 identical ponds.Fill at the same time with sterilewater so that there are nopreexisting organisms.
2. After one year, examinewater samples from eachpond under the microscope.Count the number of planktonspecies in each sample.
3. Plot results.
Clement hypothesis:Biological communitieshave a predictablecomposition.
Gleason hypothesis:The composition of biologicalcommunities is largely amatter of chance.
REJECTED SUPPORTED
Totalspeciesin eachpond
35 31 38 35 39 31 35 30 31 37 33 34
1234
Ponds12341 2 3 456789
10 11 12
1
10
20
30
40
50
60
Pla
nkt
on
sp
eci
es(n
um
ber
ed r
ath
er t
han
n
amed
, fo
r si
mp
lic
ity)
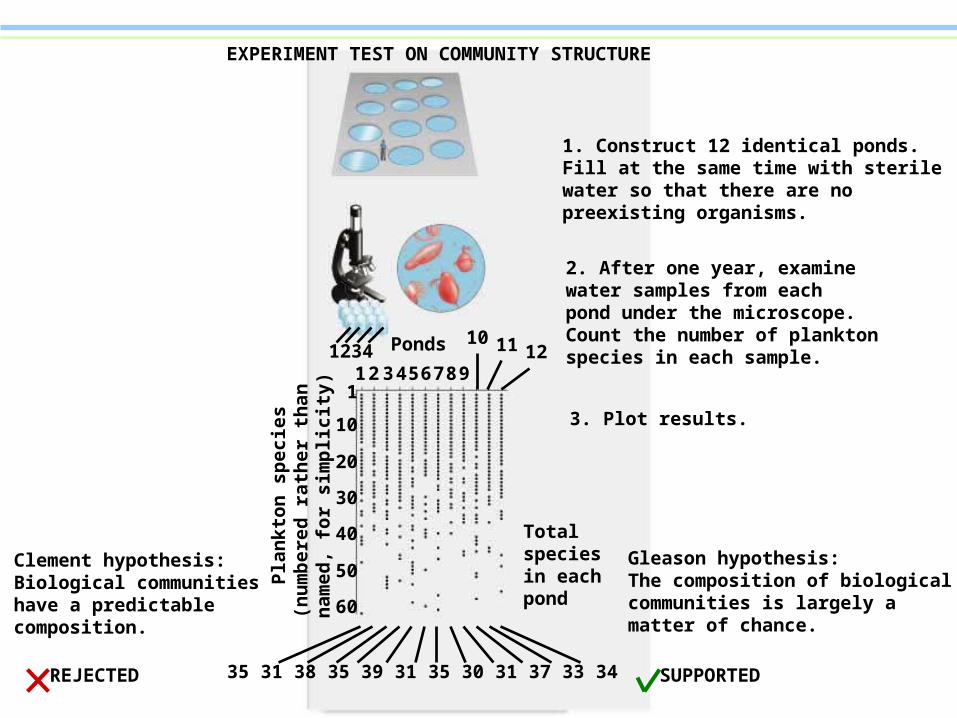
Clement hypothesis:Biological communitieshave a predictablecomposition.
Gleason hypothesis:The composition of biologicalcommunities is largely amatter of chance.
REJECTED SUPPORTED
Totalspeciesin eachpond
35 31 38 35 39 31 35 30 31 37 33 34
1. Construct 12 identical ponds.Fill at the same time with sterilewater so that there are nopreexisting organisms.
2. After one year, examinewater samples from eachpond under the microscope.Count the number of planktonspecies in each sample.
3. Plot results.
EXPERIMENT TEST ON COMMUNITY STRUCTURE
How Predictable Are Community Assemblages?
Disturbance and change in ecological communities.
• Disturbance is any event that removes some individuals or biomass from a community.
• The characteristic type of disturbance found in a community is known as its disturbance regime.
• Important management decisions hinge on understanding the disturbance regimes of any community.
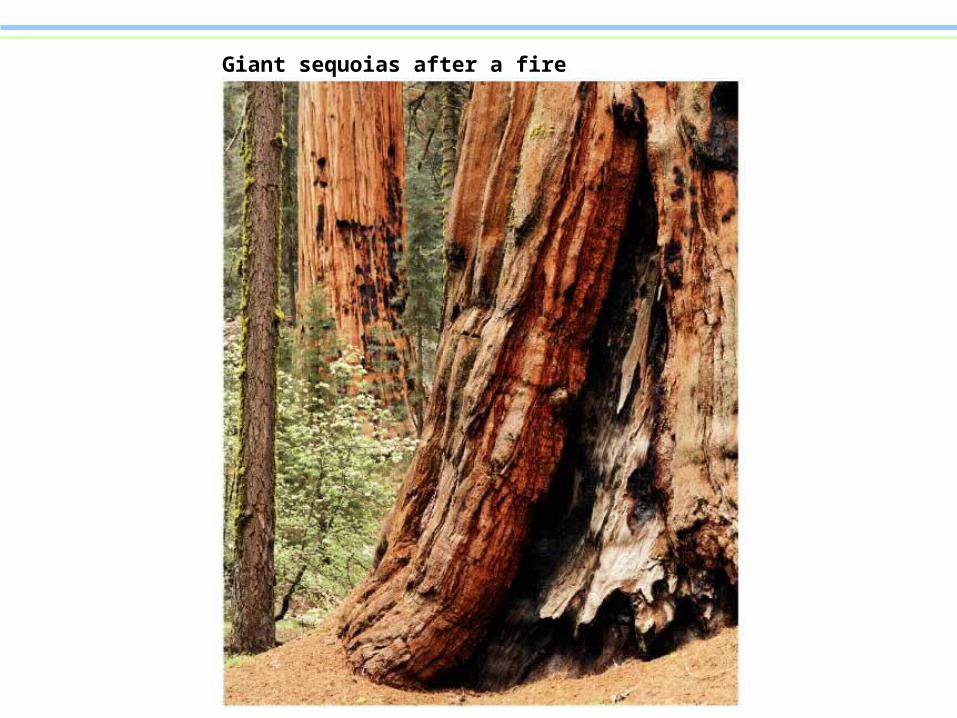
Giant sequoias after a fire
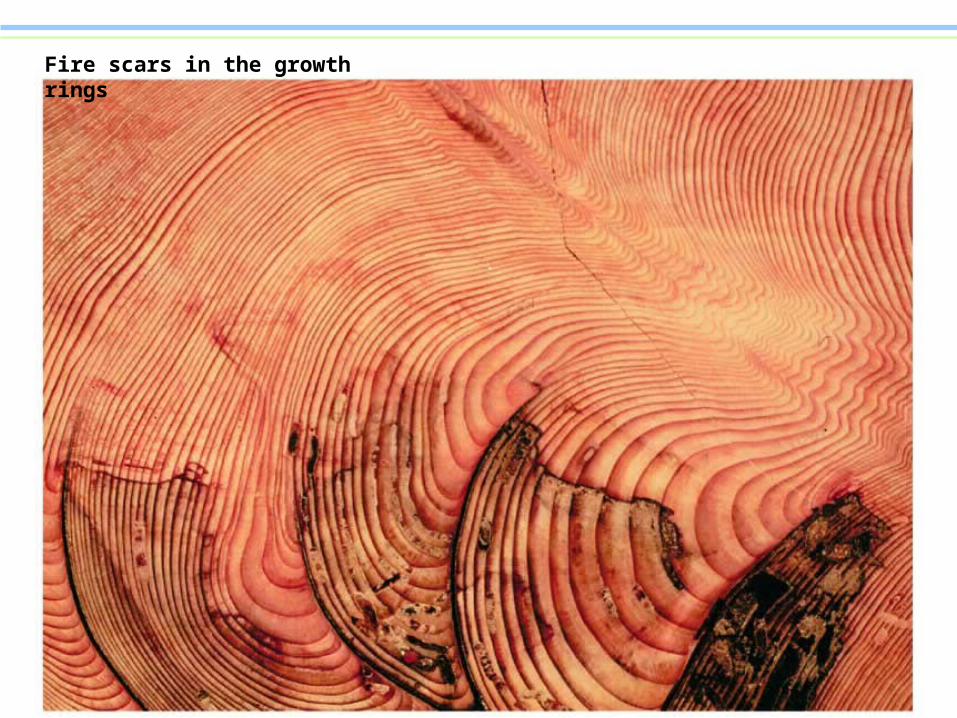
Fire scars in the growth rings
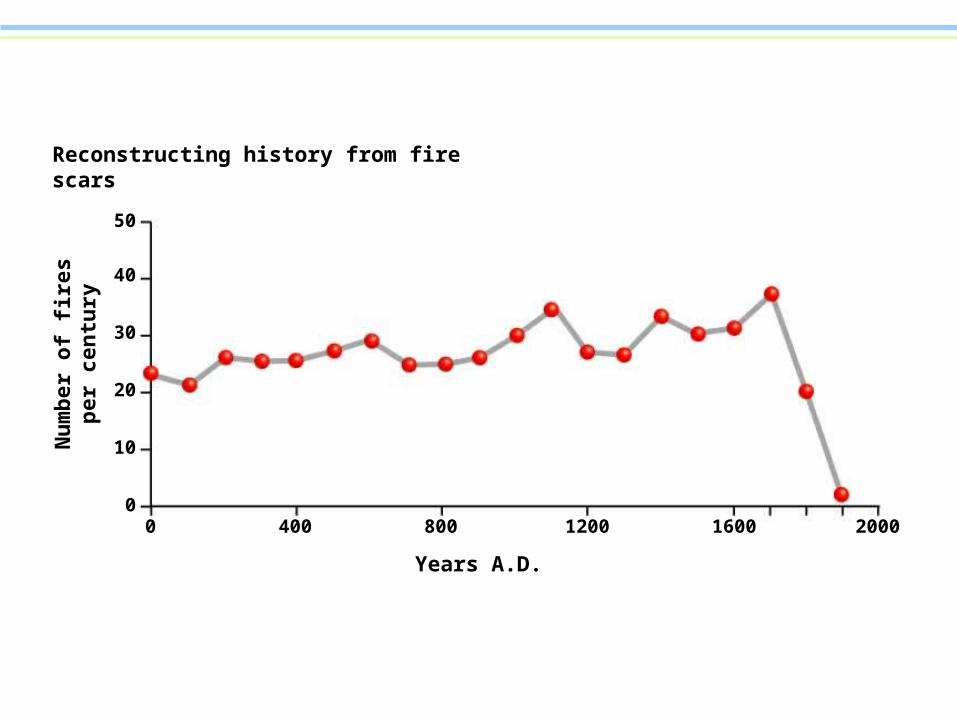
Reconstructing history from fire scars
50
40
30
20
10
00 400 800 1200 1600 2000
Years A.D.
Nu
mb
er o
f fi
res
per
cen
tury
How Predictable Are Community Assemblages? Succession
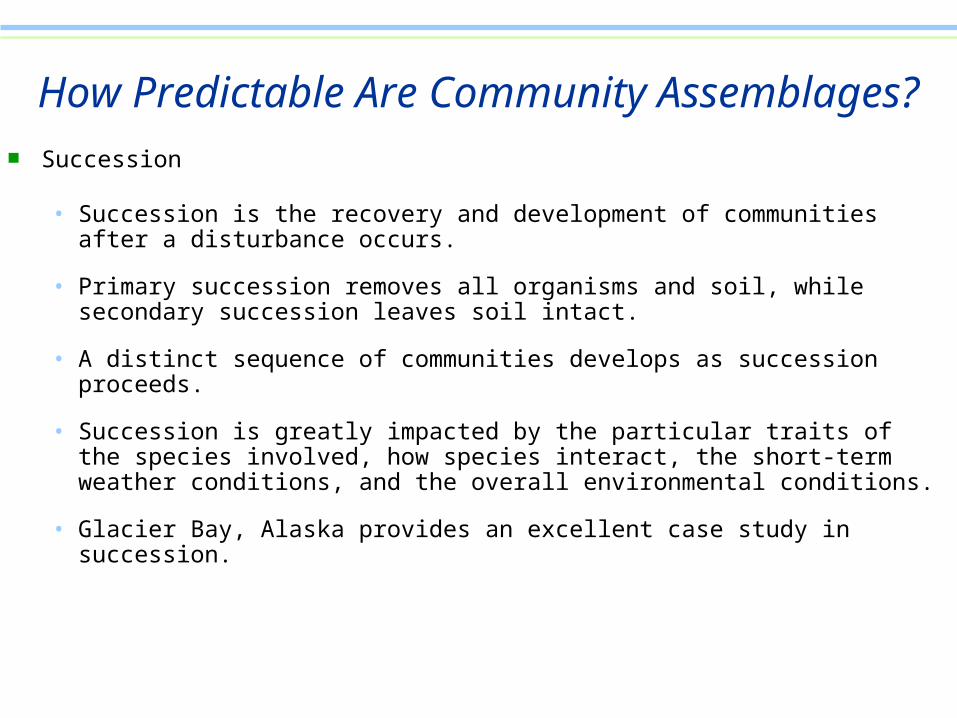
• Succession is the recovery and development of communitiesafter a disturbance occurs.
• Primary succession removes all organisms and soil, while secondary succession leaves soil intact.
• A distinct sequence of communities develops as succession proceeds.
• Succession is greatly impacted by the particular traits of the species involved, how species interact, the short-term weather conditions, and the overall environmental conditions.
• Glacier Bay, Alaska provides an excellent case study in succession.
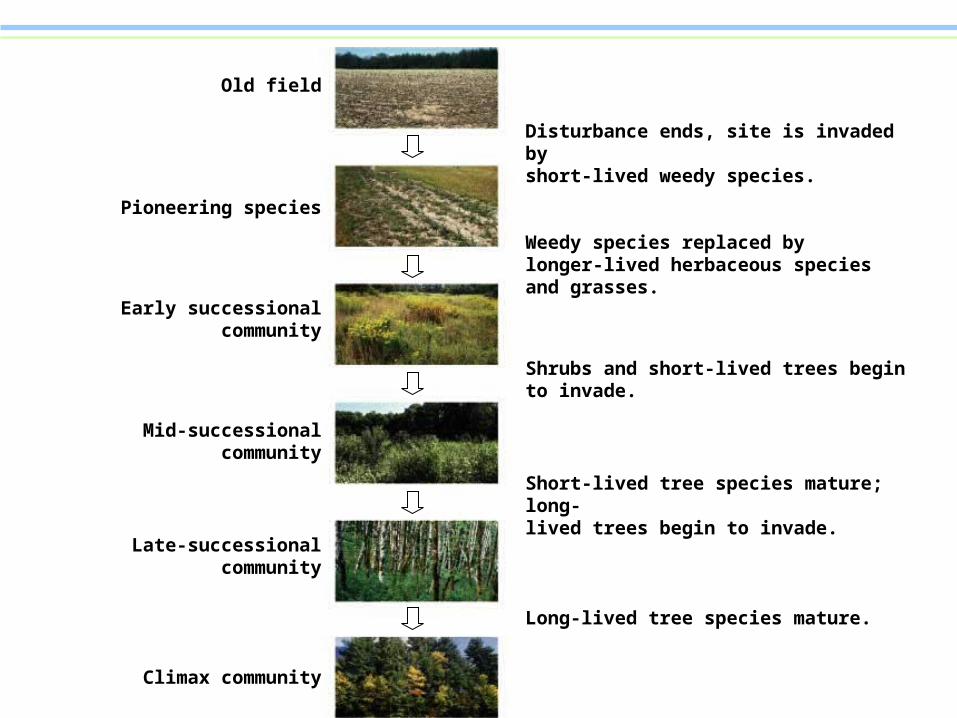
Old field
Pioneering species
Early successionalcommunity
Mid-successionalcommunity
Late-successionalcommunity
Climax community
Disturbance ends, site is invaded byshort-lived weedy species.
Weedy species replaced bylonger-lived herbaceous speciesand grasses.
Shrubs and short-lived trees beginto invade.
Short-lived tree species mature; long-lived trees begin to invade.
Long-lived tree species mature.

Climax community
Old field
Disturbance ends, site is invaded byshort-lived weedy species.
Pioneering species
Weedy species replaced bylonger-lived herbaceous speciesand grasses.
Early successionalcommunity
Shrubs and short-lived trees beginto invade.
Mid-successionalcommunity
Short-lived tree species mature; long-lived trees begin to invade.
Late-successionalcommunity
Long-lived tree species mature.
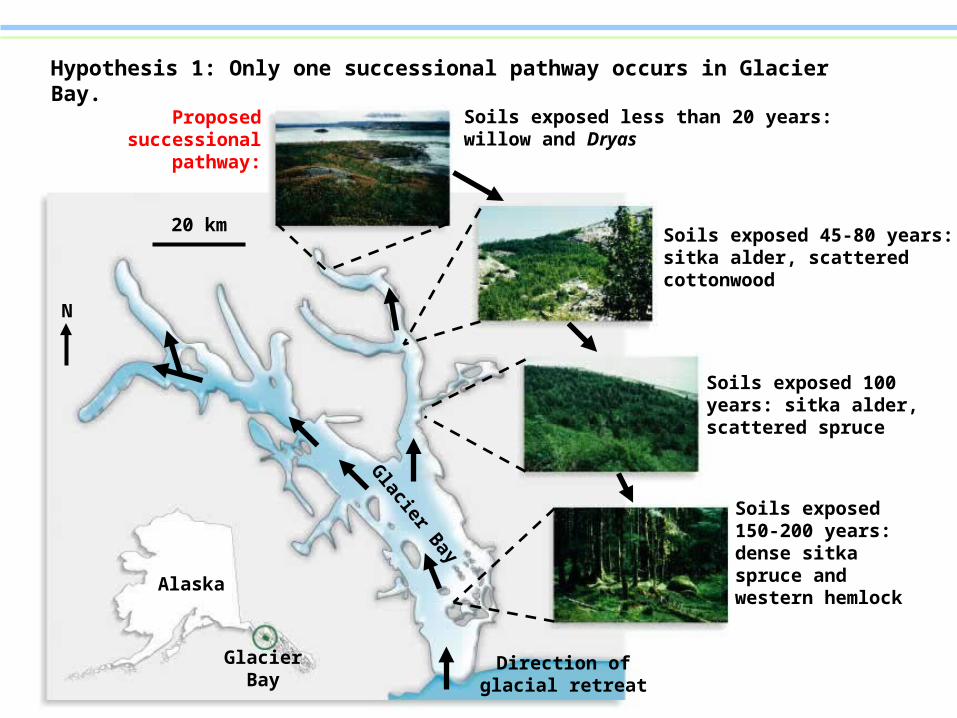
Hypothesis 1: Only one successional pathway occurs in Glacier Bay.
GlacierBay
Alaska
Proposed successionalpathway:
Soils exposed less than 20 years:willow and Dryas
Soils exposed 45-80 years:sitka alder, scatteredcottonwood
Soils exposed 100years: sitka alder,scattered spruce
Soils exposed150-200 years:dense sitkaspruce andwestern hemlock
Glacier Bay
Direction ofglacial retreat
20 km
N
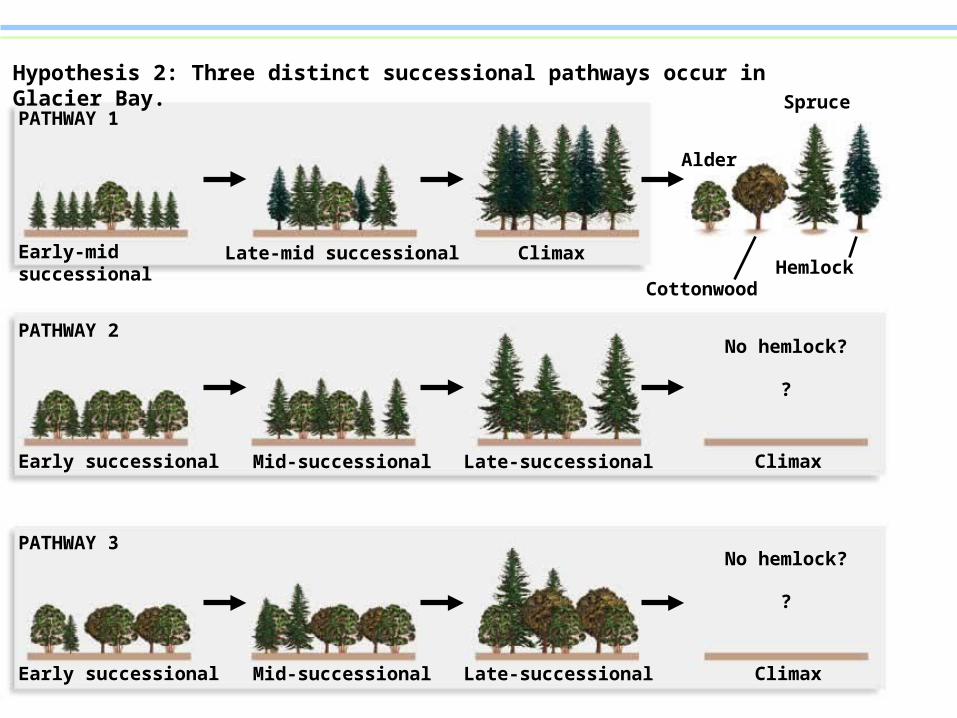
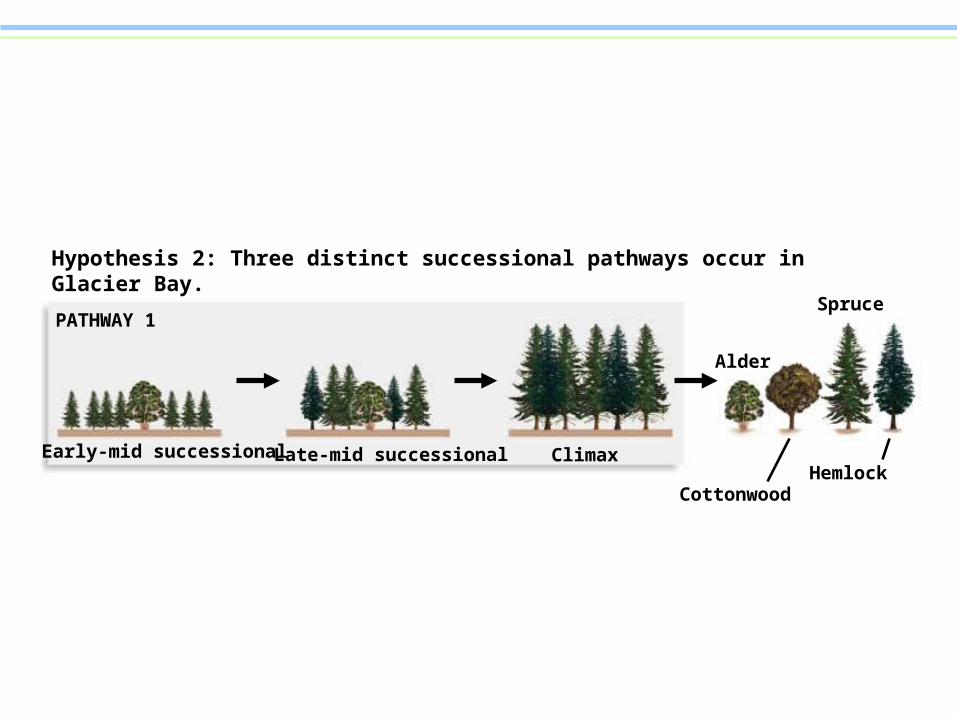
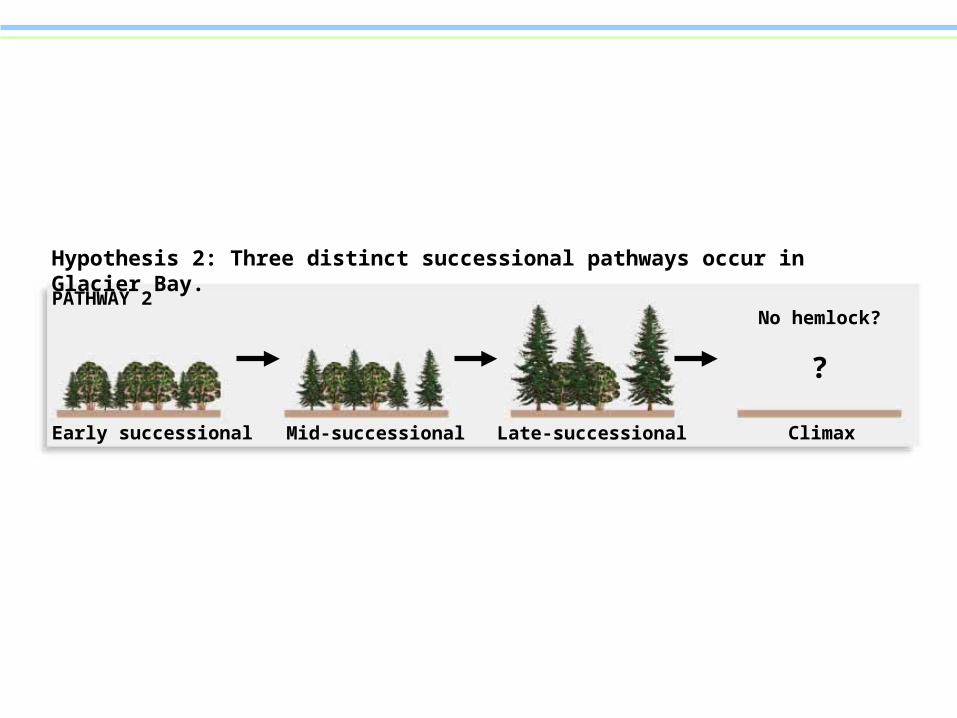
Hypothesis 2: Three distinct successional pathways occur in Glacier Bay.
Early-mid successional Late-mid successional Climax
Alder
Spruce
CottonwoodHemlock
PATHWAY 1
Early successional Mid-successional
PATHWAY 2
Late-successional Climax
No hemlock?
?
Early successional Mid-successional
PATHWAY 3
Late-successional Climax
No hemlock?
?
Hypothesis 2: Three distinct successional pathways occur in Glacier Bay.
Early-mid successional Late-mid successional Climax
Alder
Spruce
CottonwoodHemlock
PATHWAY 1
Early successional Mid-successional
PATHWAY 2
Late-successional Climax
No hemlock?
?
Hypothesis 2: Three distinct successional pathways occur in Glacier Bay.
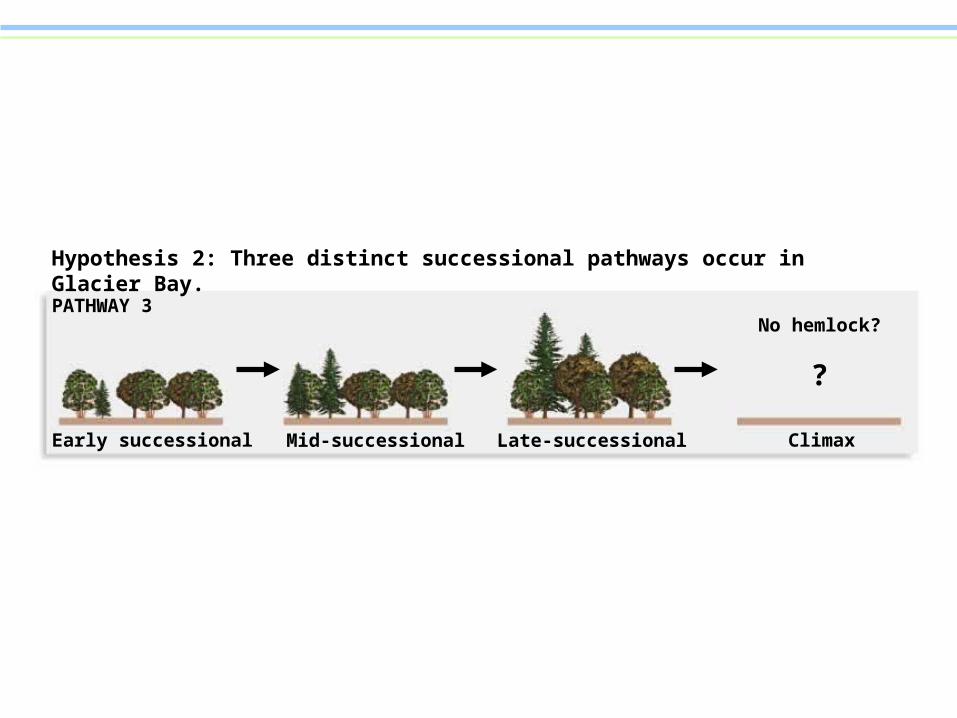
Early successional Mid-successional
PATHWAY 3
Late-successional Climax
No hemlock?
?
Hypothesis 2: Three distinct successional pathways occur in Glacier Bay.
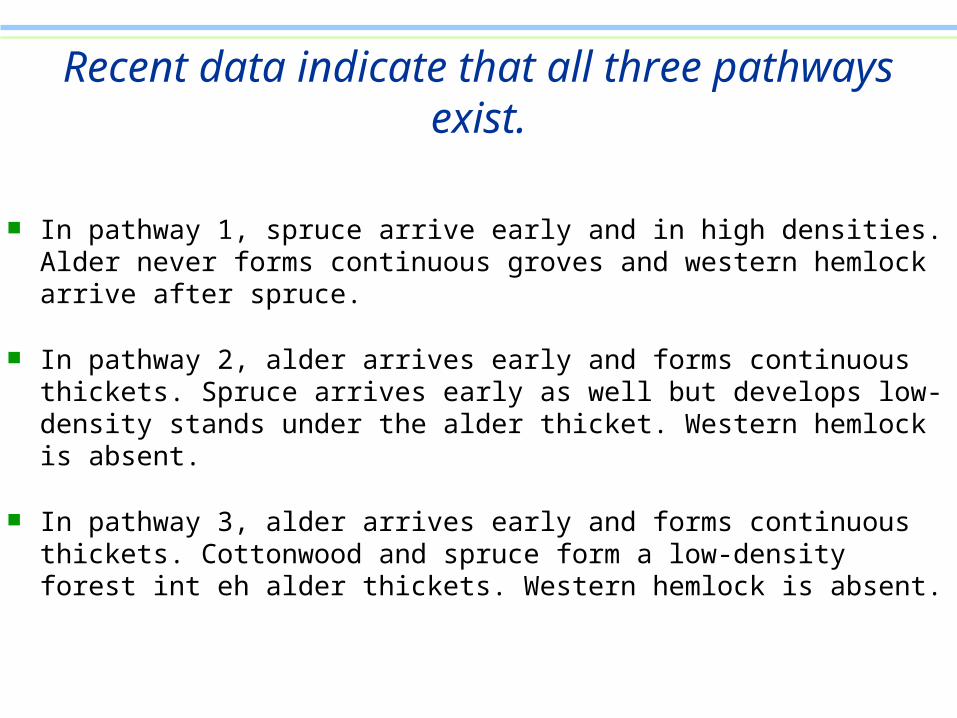
Recent data indicate that all three pathways exist.
In pathway 1, spruce arrive early and in high densities. Alder never forms continuous groves and western hemlock arrive after spruce.
In pathway 2, alder arrives early and forms continuous thickets. Spruce arrives early as well but develops low-density stands under the alder thicket. Western hemlock is absent.
In pathway 3, alder arrives early and forms continuous thickets. Cottonwood and spruce form a low-density forest int eh alder thickets. Western hemlock is absent.
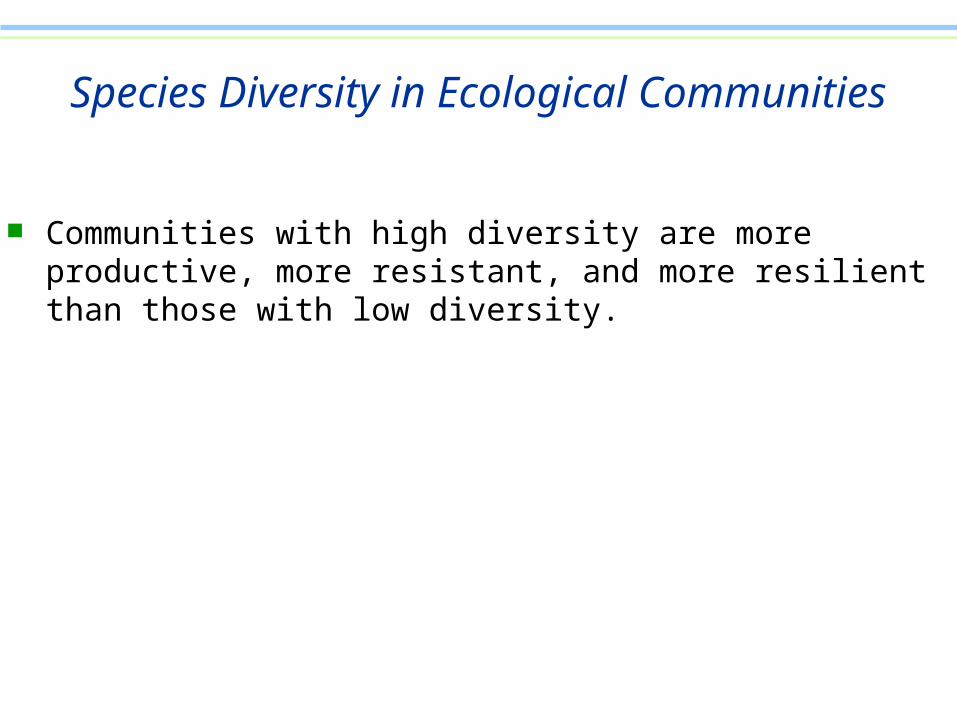
Species Diversity in Ecological Communities
Quantifying diversity can be simple or complex.
Research has focused on why some communities are more diverse than others and why diversity is important.
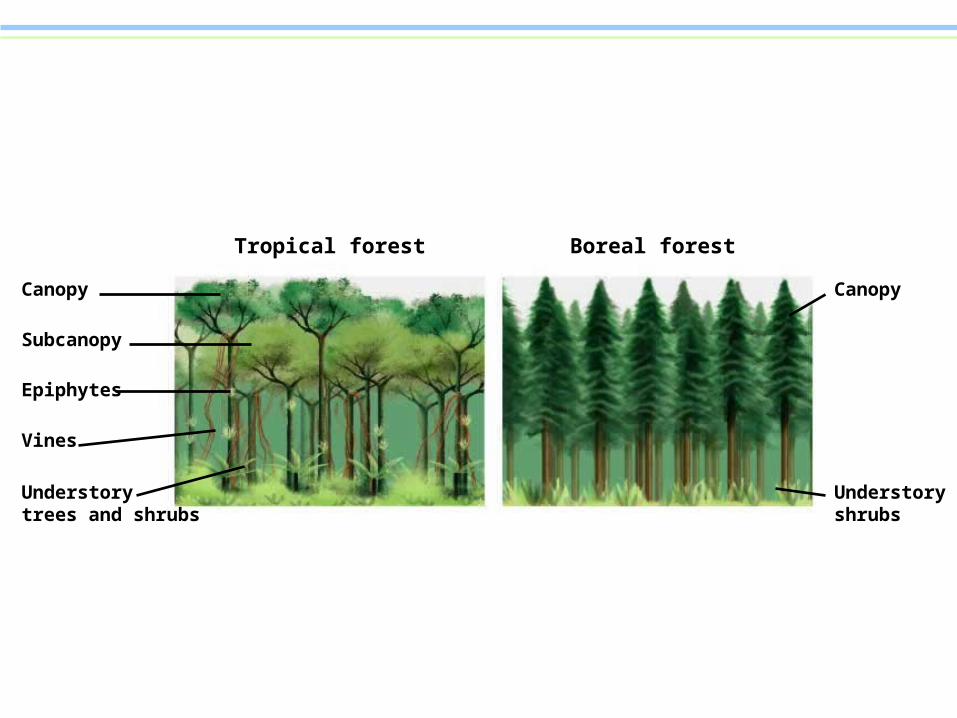
Tropical forest Boreal forest
Canopy
Subcanopy
Epiphytes
Vines
Understorytrees and shrubs
Canopy
Understoryshrubs
Species Diversity in Ecological Communities
On a global scale, a latitudinal gradient of species diversity exists for most taxa.
• Species diversity declines as latitude increases.
• Several hypotheses have been proposed to explain thisgradient, but no simple answer exists.
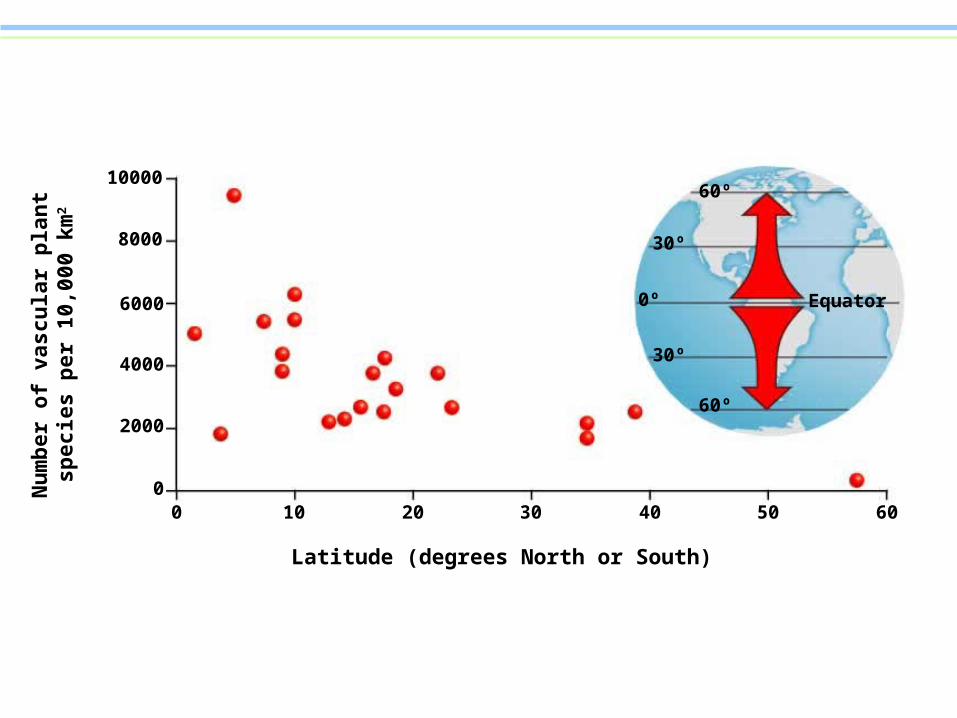
10000
8000
6000
4000
2000
00 10 20 30 40 50 60
Latitude (degrees North or South)
Nu
mb
er o
f va
scu
lar
pla
nt
spec
ies
per
10,
000
km2
Equator
60º
30º
0º
60º
30º
Species Diversity in Ecological Communities
Communities with high diversity are more productive, more resistant, and more resilient than those with low diversity.
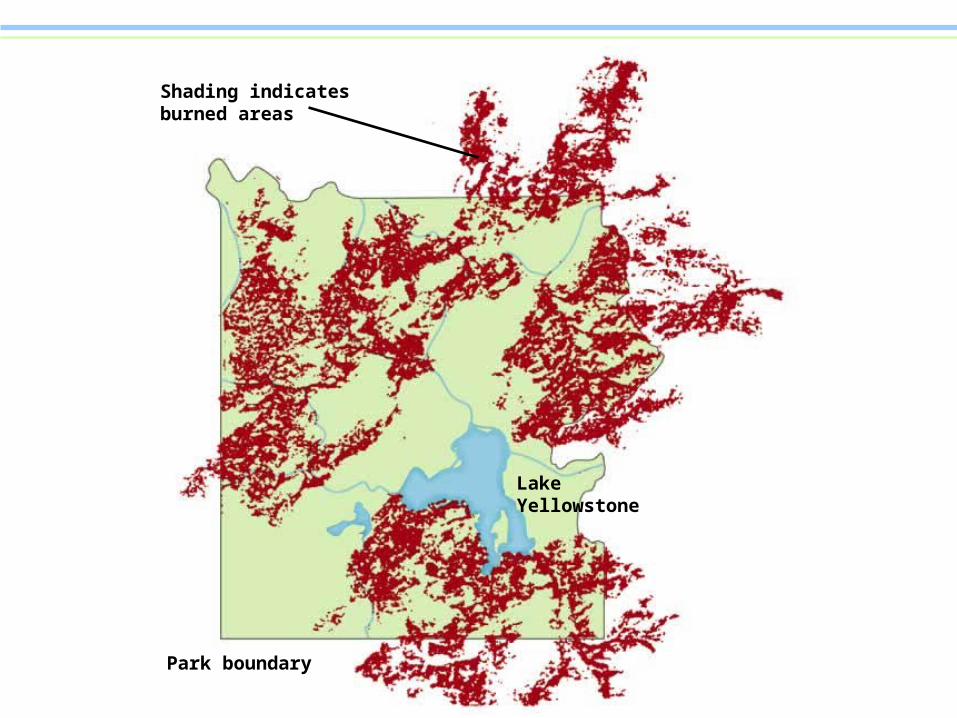
Shading indicatesburned areas
LakeYellowstone
Park boundary