COMMUNITY DATA SNAPSHOT CICERO, MUNICIPALITY JUNE … · Community Data Snapshot: Cicero...
21
COMMUNITY DATA SNAPSHOT CICERO, MUNICIPALITY JUNE 2019 RELEASE About The Community Data Snapshot 1
Transcript of COMMUNITY DATA SNAPSHOT CICERO, MUNICIPALITY JUNE … · Community Data Snapshot: Cicero...
COMMUNITY DATA SNAPSHOTCICERO, MUNICIPALITYJUNE 2019 RELEASE
About The Community Data Snapshot 1
About The Community Data SnapshotThe Community Data Snapshots are a series of County, Municipal, and Chicago Community Area data profiles thatprimarily feature data from the 2013-2017 American Community Survey (ACS) 5-Year Estimates. As noted in eachprofile, the data comes from multiple sources in addition to the ACS, which include U.S. Census Bureau, IllinoisEnvironmental Protection Agency (EPA), Illinois Department of Employment Security (IDES), Illinois Department ofRevenue (IDR), and the Chicago Metropolitan Agency for Planning (CMAP).
User NotesMargin of errorACS is a sample-based data product. Exercise caution when using data from low-population municipalities, as themargins of error are often large compared to the estimate. For more details please refer to the ACS Sample Size andData Quality Methodology.
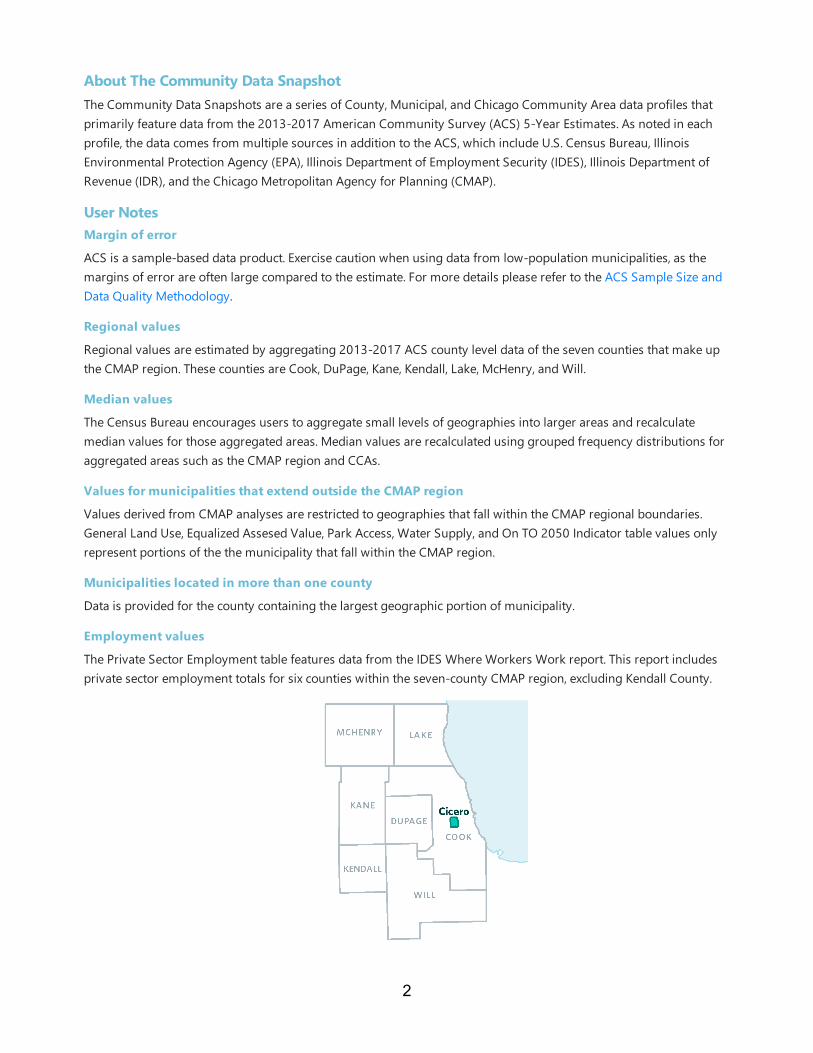
Regional valuesRegional values are estimated by aggregating 2013-2017 ACS county level data of the seven counties that make upthe CMAP region. These counties are Cook, DuPage, Kane, Kendall, Lake, McHenry, and Will.
Median valuesThe Census Bureau encourages users to aggregate small levels of geographies into larger areas and recalculatemedian values for those aggregated areas. Median values are recalculated using grouped frequency distributions foraggregated areas such as the CMAP region and CCAs.
Values for municipalities that extend outside the CMAP regionValues derived from CMAP analyses are restricted to geographies that fall within the CMAP regional boundaries.General Land Use, Equalized Assesed Value, Park Access, Water Supply, and On TO 2050 Indicator table values onlyrepresent portions of the the municipality that fall within the CMAP region.
Municipalities located in more than one countyData is provided for the county containing the largest geographic portion of municipality.
Employment valuesThe Private Sector Employment table features data from the IDES Where Workers Work report. This report includesprivate sector employment totals for six counties within the seven-county CMAP region, excluding Kendall County.
2
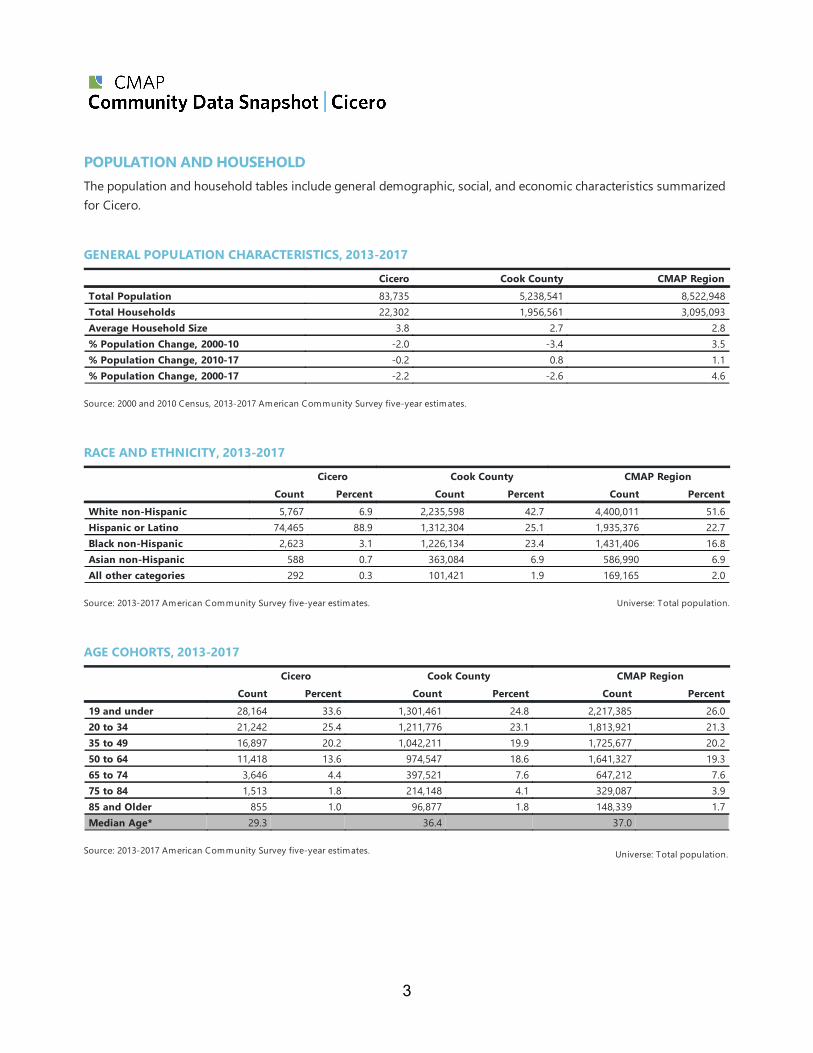
POPULATION AND HOUSEHOLDThe population and household tables include general demographic, social, and economic characteristics summarizedfor Cicero.
GENERAL POPULATION CHARACTERISTICS, 2013-2017Cicero Cook County CMAP Region
Total Population 83,735 5,238,541 8,522,948Total Households 22,302 1,956,561 3,095,093Average Household Size 3.8 2.7 2.8% Population Change, 2000-10 -2.0 -3.4 3.5% Population Change, 2010-17 -0.2 0.8 1.1% Population Change, 2000-17 -2.2 -2.6 4.6
Source: 2000 and 2010 Census, 2013-2017 American Community Survey five-year estimates.
RACE AND ETHNICITY, 2013-2017Cicero Cook County CMAP Region
Count Percent Count Percent Count PercentWhite non-Hispanic 5,767 6.9 2,235,598 42.7 4,400,011 51.6Hispanic or Latino 74,465 88.9 1,312,304 25.1 1,935,376 22.7Black non-Hispanic 2,623 3.1 1,226,134 23.4 1,431,406 16.8Asian non-Hispanic 588 0.7 363,084 6.9 586,990 6.9All other categories 292 0.3 101,421 1.9 169,165 2.0
Source: 2013-2017 American Community Survey five-year estimates. Universe: Total population.
AGE COHORTS, 2013-2017Cicero Cook County CMAP Region
Count Percent Count Percent Count Percent19 and under 28,164 33.6 1,301,461 24.8 2,217,385 26.020 to 34 21,242 25.4 1,211,776 23.1 1,813,921 21.335 to 49 16,897 20.2 1,042,211 19.9 1,725,677 20.250 to 64 11,418 13.6 974,547 18.6 1,641,327 19.365 to 74 3,646 4.4 397,521 7.6 647,212 7.675 to 84 1,513 1.8 214,148 4.1 329,087 3.985 and Older 855 1.0 96,877 1.8 148,339 1.7Median Age* 29.3 36.4 37.0
Source: 2013-2017 American Community Survey five-year estimates. Universe: Total population.
3
Community Data Snapshot: Cicero
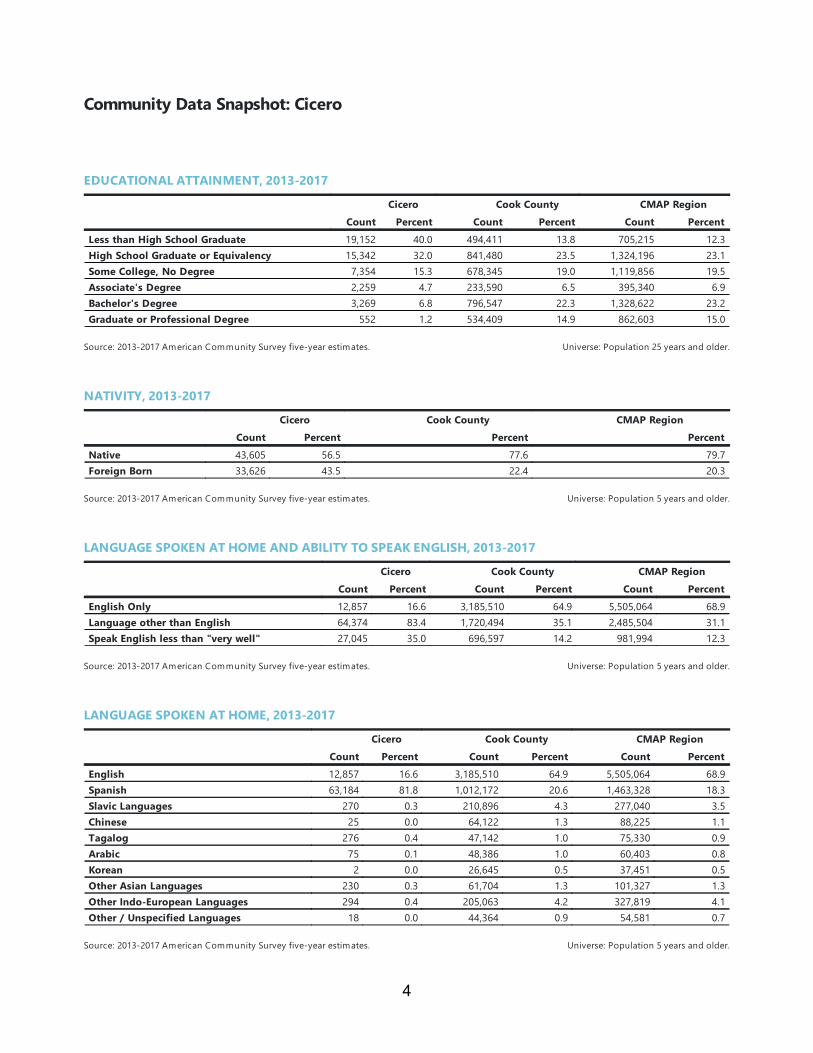
EDUCATIONAL ATTAINMENT, 2013-2017Cicero Cook County CMAP Region
Count Percent Count Percent Count PercentLess than High School Graduate 19,152 40.0 494,411 13.8 705,215 12.3High School Graduate or Equivalency 15,342 32.0 841,480 23.5 1,324,196 23.1Some College, No Degree 7,354 15.3 678,345 19.0 1,119,856 19.5Associate's Degree 2,259 4.7 233,590 6.5 395,340 6.9Bachelor's Degree 3,269 6.8 796,547 22.3 1,328,622 23.2Graduate or Professional Degree 552 1.2 534,409 14.9 862,603 15.0
Source: 2013-2017 American Community Survey five-year estimates. Universe: Population 25 years and older.
NATIVITY, 2013-2017Cicero Cook County CMAP Region
Count Percent Percent PercentNative 43,605 56.5 77.6 79.7Foreign Born 33,626 43.5 22.4 20.3
Source: 2013-2017 American Community Survey five-year estimates. Universe: Population 5 years and older.
LANGUAGE SPOKEN AT HOME AND ABILITY TO SPEAK ENGLISH, 2013-2017Cicero Cook County CMAP Region
Count Percent Count Percent Count PercentEnglish Only 12,857 16.6 3,185,510 64.9 5,505,064 68.9Language other than English 64,374 83.4 1,720,494 35.1 2,485,504 31.1Speak English less than "very well" 27,045 35.0 696,597 14.2 981,994 12.3
Source: 2013-2017 American Community Survey five-year estimates. Universe: Population 5 years and older.
LANGUAGE SPOKEN AT HOME, 2013-2017Cicero Cook County CMAP Region
Count Percent Count Percent Count PercentEnglish 12,857 16.6 3,185,510 64.9 5,505,064 68.9Spanish 63,184 81.8 1,012,172 20.6 1,463,328 18.3Slavic Languages 270 0.3 210,896 4.3 277,040 3.5Chinese 25 0.0 64,122 1.3 88,225 1.1Tagalog 276 0.4 47,142 1.0 75,330 0.9Arabic 75 0.1 48,386 1.0 60,403 0.8Korean 2 0.0 26,645 0.5 37,451 0.5Other Asian Languages 230 0.3 61,704 1.3 101,327 1.3Other Indo-European Languages 294 0.4 205,063 4.2 327,819 4.1Other / Unspecified Languages 18 0.0 44,364 0.9 54,581 0.7
Source: 2013-2017 American Community Survey five-year estimates. Universe: Population 5 years and older.
4
Community Data Snapshot: Cicero
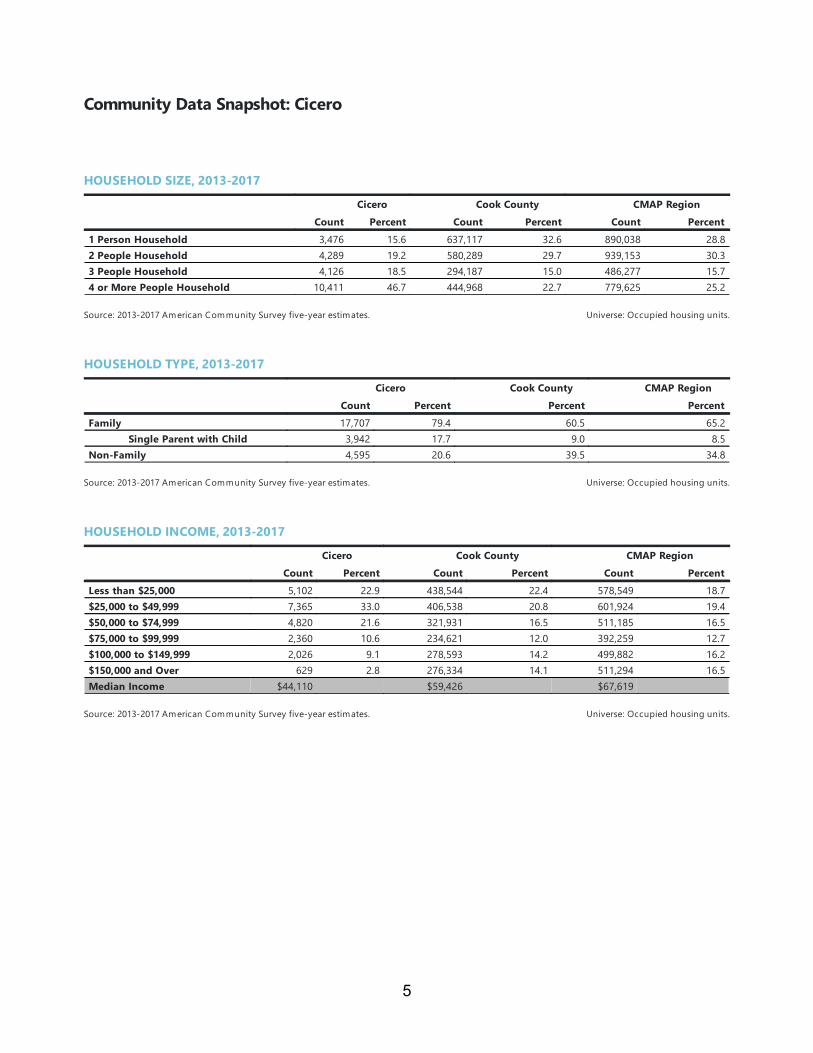
HOUSEHOLD SIZE, 2013-2017Cicero Cook County CMAP Region
Count Percent Count Percent Count Percent1 Person Household 3,476 15.6 637,117 32.6 890,038 28.82 People Household 4,289 19.2 580,289 29.7 939,153 30.33 People Household 4,126 18.5 294,187 15.0 486,277 15.74 or More People Household 10,411 46.7 444,968 22.7 779,625 25.2
Source: 2013-2017 American Community Survey five-year estimates. Universe: Occupied housing units.
HOUSEHOLD TYPE, 2013-2017Cicero Cook County CMAP Region
Count Percent Percent PercentFamily 17,707 79.4 60.5 65.2
Single Parent with Child 3,942 17.7 9.0 8.5Non-Family 4,595 20.6 39.5 34.8
Source: 2013-2017 American Community Survey five-year estimates. Universe: Occupied housing units.
HOUSEHOLD INCOME, 2013-2017Cicero Cook County CMAP Region
Count Percent Count Percent Count PercentLess than $25,000 5,102 22.9 438,544 22.4 578,549 18.7$25,000 to $49,999 7,365 33.0 406,538 20.8 601,924 19.4$50,000 to $74,999 4,820 21.6 321,931 16.5 511,185 16.5$75,000 to $99,999 2,360 10.6 234,621 12.0 392,259 12.7$100,000 to $149,999 2,026 9.1 278,593 14.2 499,882 16.2$150,000 and Over 629 2.8 276,334 14.1 511,294 16.5Median Income $44,110 $59,426 $67,619
Source: 2013-2017 American Community Survey five-year estimates. Universe: Occupied housing units.
5
Community Data Snapshot: Cicero
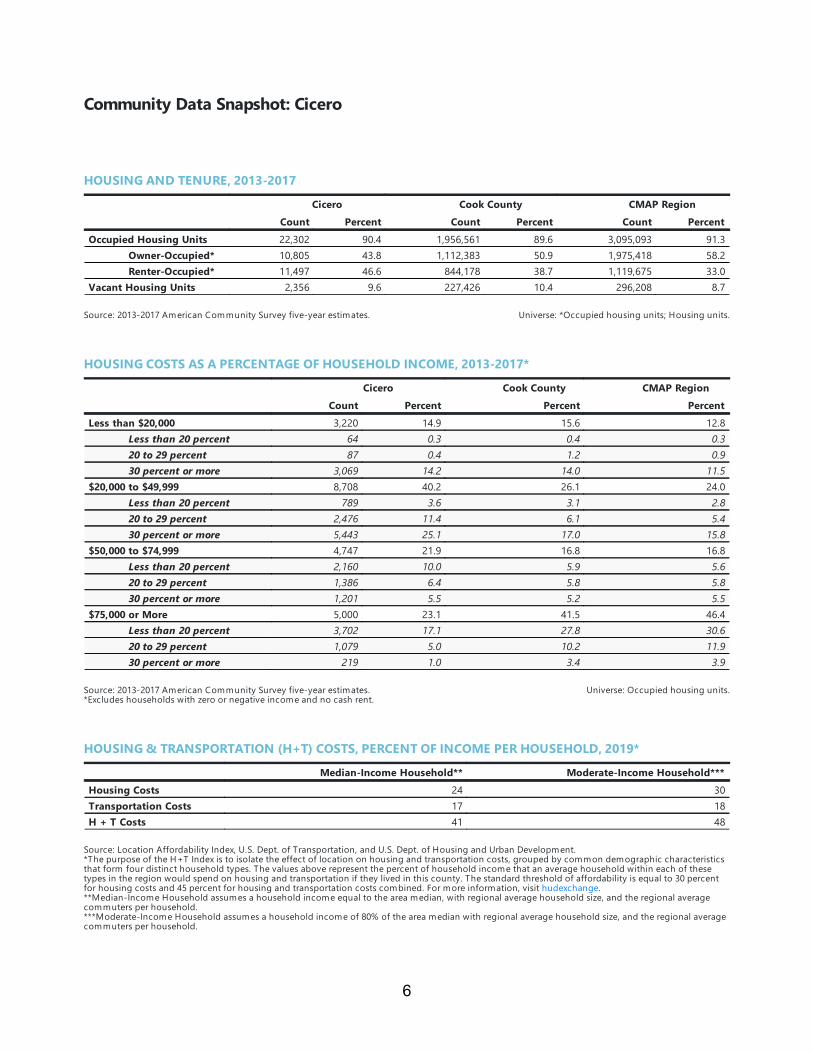
HOUSING AND TENURE, 2013-2017Cicero Cook County CMAP Region
Count Percent Count Percent Count PercentOccupied Housing Units 22,302 90.4 1,956,561 89.6 3,095,093 91.3
Owner-Occupied* 10,805 43.8 1,112,383 50.9 1,975,418 58.2Renter-Occupied* 11,497 46.6 844,178 38.7 1,119,675 33.0
Vacant Housing Units 2,356 9.6 227,426 10.4 296,208 8.7
Source: 2013-2017 American Community Survey five-year estimates. Universe: *Occupied housing units; Housing units.
HOUSING COSTS AS A PERCENTAGE OF HOUSEHOLD INCOME, 2013-2017*Cicero Cook County CMAP Region
Count Percent Percent PercentLess than $20,000 3,220 14.9 15.6 12.8
Less than 20 percent 64 0.3 0.4 0.320 to 29 percent 87 0.4 1.2 0.930 percent or more 3,069 14.2 14.0 11.5
$20,000 to $49,999 8,708 40.2 26.1 24.0Less than 20 percent 789 3.6 3.1 2.820 to 29 percent 2,476 11.4 6.1 5.430 percent or more 5,443 25.1 17.0 15.8
$50,000 to $74,999 4,747 21.9 16.8 16.8Less than 20 percent 2,160 10.0 5.9 5.620 to 29 percent 1,386 6.4 5.8 5.830 percent or more 1,201 5.5 5.2 5.5
$75,000 or More 5,000 23.1 41.5 46.4Less than 20 percent 3,702 17.1 27.8 30.620 to 29 percent 1,079 5.0 10.2 11.930 percent or more 219 1.0 3.4 3.9
Source: 2013-2017 American Community Survey five-year estimates.*Excludes households with zero or negative income and no cash rent.
Universe: Occupied housing units.
HOUSING & TRANSPORTATION (H+T) COSTS, PERCENT OF INCOME PER HOUSEHOLD, 2019*Median-Income Household** Moderate-Income Household***
Housing Costs 24 30Transportation Costs 17 18H + T Costs 41 48
Source: Location Affordability Index, U.S. Dept. of Transportation, and U.S. Dept. of Housing and Urban Development.*The purpose of the H+T Index is to isolate the effect of location on housing and transportation costs, grouped by common demographic characteristicsthat form four distinct household types. The values above represent the percent of household income that an average household within each of thesetypes in the region would spend on housing and transportation if they lived in this county. The standard threshold of affordability is equal to 30 percentfor housing costs and 45 percent for housing and transportation costs combined. For more information, visit hudexchange.**Median-Income Household assumes a household income equal to the area median, with regional average household size, and the regional averagecommuters per household.***Moderate-Income Household assumes a household income of 80% of the area median with regional average household size, and the regional averagecommuters per household.
6
Community Data Snapshot: Cicero
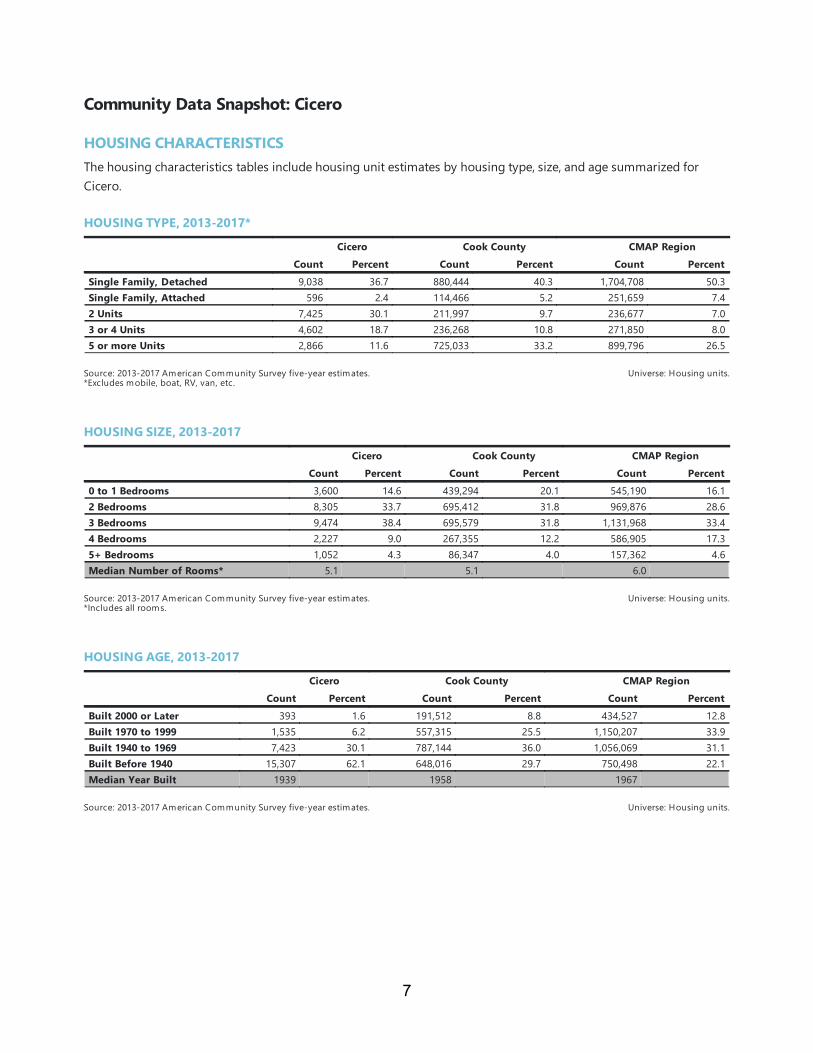
HOUSING CHARACTERISTICSThe housing characteristics tables include housing unit estimates by housing type, size, and age summarized forCicero.
HOUSING TYPE, 2013-2017*Cicero Cook County CMAP Region
Count Percent Count Percent Count PercentSingle Family, Detached 9,038 36.7 880,444 40.3 1,704,708 50.3Single Family, Attached 596 2.4 114,466 5.2 251,659 7.42 Units 7,425 30.1 211,997 9.7 236,677 7.03 or 4 Units 4,602 18.7 236,268 10.8 271,850 8.05 or more Units 2,866 11.6 725,033 33.2 899,796 26.5
Source: 2013-2017 American Community Survey five-year estimates.*Excludes mobile, boat, RV, van, etc.
Universe: Housing units.
HOUSING SIZE, 2013-2017Cicero Cook County CMAP Region
Count Percent Count Percent Count Percent0 to 1 Bedrooms 3,600 14.6 439,294 20.1 545,190 16.12 Bedrooms 8,305 33.7 695,412 31.8 969,876 28.63 Bedrooms 9,474 38.4 695,579 31.8 1,131,968 33.44 Bedrooms 2,227 9.0 267,355 12.2 586,905 17.35+ Bedrooms 1,052 4.3 86,347 4.0 157,362 4.6Median Number of Rooms* 5.1 5.1 6.0
Source: 2013-2017 American Community Survey five-year estimates.*Includes all rooms.
Universe: Housing units.
HOUSING AGE, 2013-2017Cicero Cook County CMAP Region
Count Percent Count Percent Count PercentBuilt 2000 or Later 393 1.6 191,512 8.8 434,527 12.8Built 1970 to 1999 1,535 6.2 557,315 25.5 1,150,207 33.9Built 1940 to 1969 7,423 30.1 787,144 36.0 1,056,069 31.1Built Before 1940 15,307 62.1 648,016 29.7 750,498 22.1Median Year Built 1939 1958 1967
Source: 2013-2017 American Community Survey five-year estimates. Universe: Housing units.
7
Community Data Snapshot: Cicero
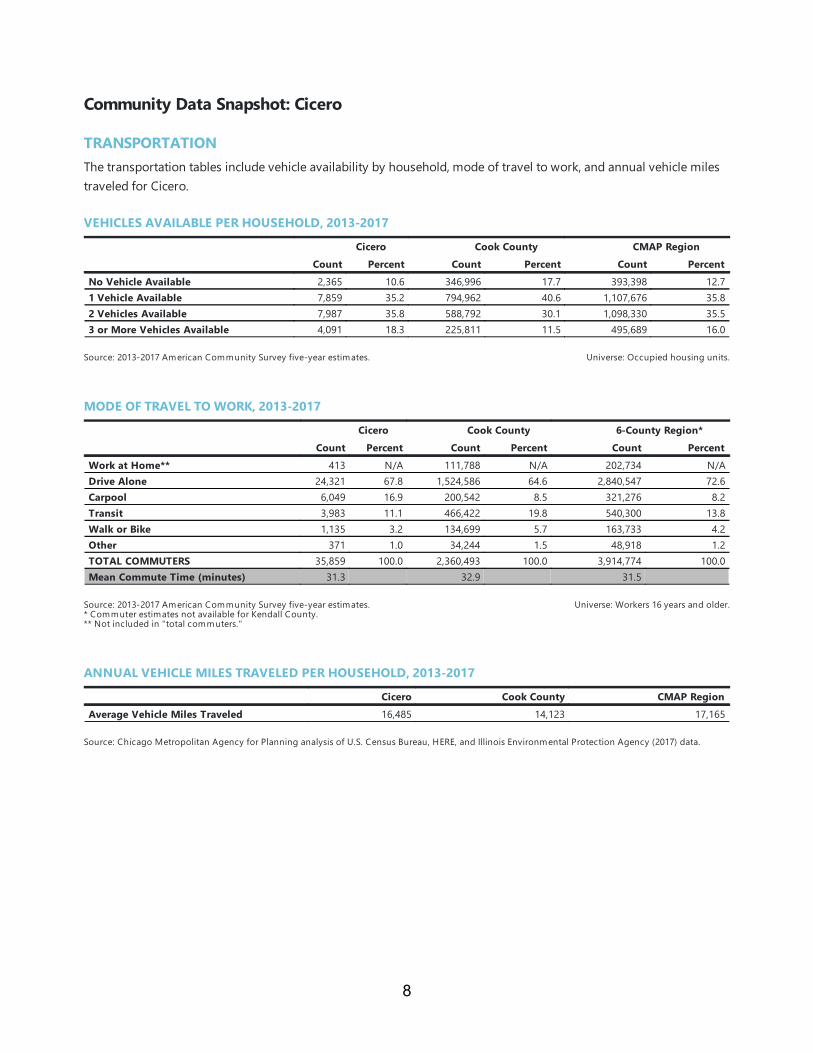
TRANSPORTATIONThe transportation tables include vehicle availability by household, mode of travel to work, and annual vehicle milestraveled for Cicero.
VEHICLES AVAILABLE PER HOUSEHOLD, 2013-2017Cicero Cook County CMAP Region
Count Percent Count Percent Count PercentNo Vehicle Available 2,365 10.6 346,996 17.7 393,398 12.71 Vehicle Available 7,859 35.2 794,962 40.6 1,107,676 35.82 Vehicles Available 7,987 35.8 588,792 30.1 1,098,330 35.53 or More Vehicles Available 4,091 18.3 225,811 11.5 495,689 16.0
Source: 2013-2017 American Community Survey five-year estimates. Universe: Occupied housing units.
MODE OF TRAVEL TO WORK, 2013-2017Cicero Cook County 6-County Region*
Count Percent Count Percent Count PercentWork at Home** 413 N/A 111,788 N/A 202,734 N/ADrive Alone 24,321 67.8 1,524,586 64.6 2,840,547 72.6Carpool 6,049 16.9 200,542 8.5 321,276 8.2Transit 3,983 11.1 466,422 19.8 540,300 13.8Walk or Bike 1,135 3.2 134,699 5.7 163,733 4.2Other 371 1.0 34,244 1.5 48,918 1.2TOTAL COMMUTERS 35,859 100.0 2,360,493 100.0 3,914,774 100.0Mean Commute Time (minutes) 31.3 32.9 31.5
Source: 2013-2017 American Community Survey five-year estimates.* Commuter estimates not available for Kendall County.** Not included in "total commuters."
Universe: Workers 16 years and older.
ANNUAL VEHICLE MILES TRAVELED PER HOUSEHOLD, 2013-2017Cicero Cook County CMAP Region
Average Vehicle Miles Traveled 16,485 14,123 17,165
Source: Chicago Metropolitan Agency for Planning analysis of U.S. Census Bureau, HERE, and Illinois Environmental Protection Agency (2017) data.
8
Community Data Snapshot: Cicero
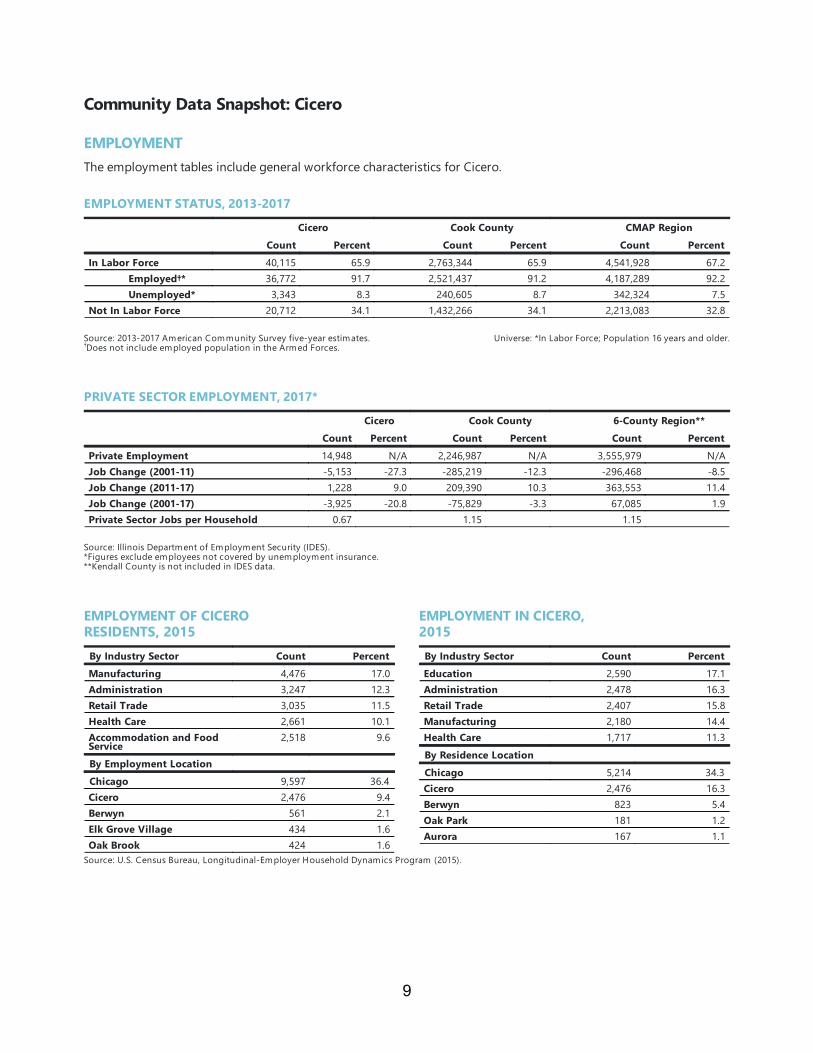
EMPLOYMENTThe employment tables include general workforce characteristics for Cicero.
EMPLOYMENT STATUS, 2013-2017Cicero Cook County CMAP Region
Count Percent Count Percent Count PercentIn Labor Force 40,115 65.9 2,763,344 65.9 4,541,928 67.2
Employed†* 36,772 91.7 2,521,437 91.2 4,187,289 92.2Unemployed* 3,343 8.3 240,605 8.7 342,324 7.5
Not In Labor Force 20,712 34.1 1,432,266 34.1 2,213,083 32.8
Source: 2013-2017 American Community Survey five-year estimates.Does not include employed population in the Armed Forces.†
Universe: *In Labor Force; Population 16 years and older.
PRIVATE SECTOR EMPLOYMENT, 2017*Cicero Cook County 6-County Region**
Count Percent Count Percent Count PercentPrivate Employment 14,948 N/A 2,246,987 N/A 3,555,979 N/AJob Change (2001-11) -5,153 -27.3 -285,219 -12.3 -296,468 -8.5Job Change (2011-17) 1,228 9.0 209,390 10.3 363,553 11.4Job Change (2001-17) -3,925 -20.8 -75,829 -3.3 67,085 1.9Private Sector Jobs per Household 0.67 1.15 1.15
Source: Illinois Department of Employment Security (IDES).*Figures exclude employees not covered by unemployment insurance.**Kendall County is not included in IDES data.
EMPLOYMENT OF CICERO RESIDENTS, 2015By Industry Sector Count PercentManufacturing 4,476 17.0Administration 3,247 12.3Retail Trade 3,035 11.5Health Care 2,661 10.1Accommodation and FoodService 2,518 9.6
By Employment LocationChicago 9,597 36.4Cicero 2,476 9.4Berwyn 561 2.1Elk Grove Village 434 1.6Oak Brook 424 1.6
EMPLOYMENT IN CICERO, 2015By Industry Sector Count PercentEducation 2,590 17.1Administration 2,478 16.3Retail Trade 2,407 15.8Manufacturing 2,180 14.4Health Care 1,717 11.3By Residence LocationChicago 5,214 34.3Cicero 2,476 16.3Berwyn 823 5.4Oak Park 181 1.2Aurora 167 1.1
Source: U.S. Census Bureau, Longitudinal-Employer Household Dynamics Program (2015).
9
Community Data Snapshot: Cicero
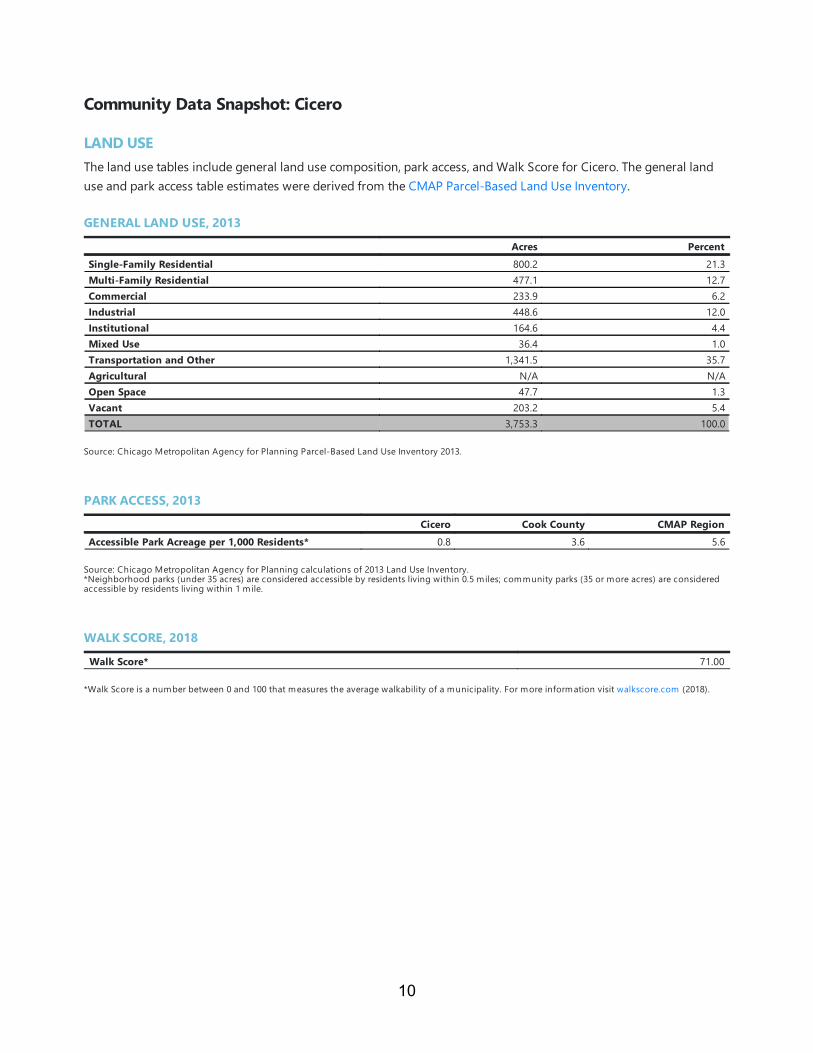
LAND USEThe land use tables include general land use composition, park access, and Walk Score for Cicero. The general landuse and park access table estimates were derived from the CMAP Parcel-Based Land Use Inventory.
GENERAL LAND USE, 2013Acres Percent
Single-Family Residential 800.2 21.3Multi-Family Residential 477.1 12.7Commercial 233.9 6.2Industrial 448.6 12.0Institutional 164.6 4.4Mixed Use 36.4 1.0Transportation and Other 1,341.5 35.7Agricultural N/A N/AOpen Space 47.7 1.3Vacant 203.2 5.4TOTAL 3,753.3 100.0
Source: Chicago Metropolitan Agency for Planning Parcel-Based Land Use Inventory 2013.
PARK ACCESS, 2013Cicero Cook County CMAP Region
Accessible Park Acreage per 1,000 Residents* 0.8 3.6 5.6
Source: Chicago Metropolitan Agency for Planning calculations of 2013 Land Use Inventory.*Neighborhood parks (under 35 acres) are considered accessible by residents living within 0.5 miles; community parks (35 or more acres) are consideredaccessible by residents living within 1 mile.
WALK SCORE, 2018Walk Score* 71.00
*Walk Score is a number between 0 and 100 that measures the average walkability of a municipality. For more information visit walkscore.com (2018).
10
Community Data Snapshot: Cicero
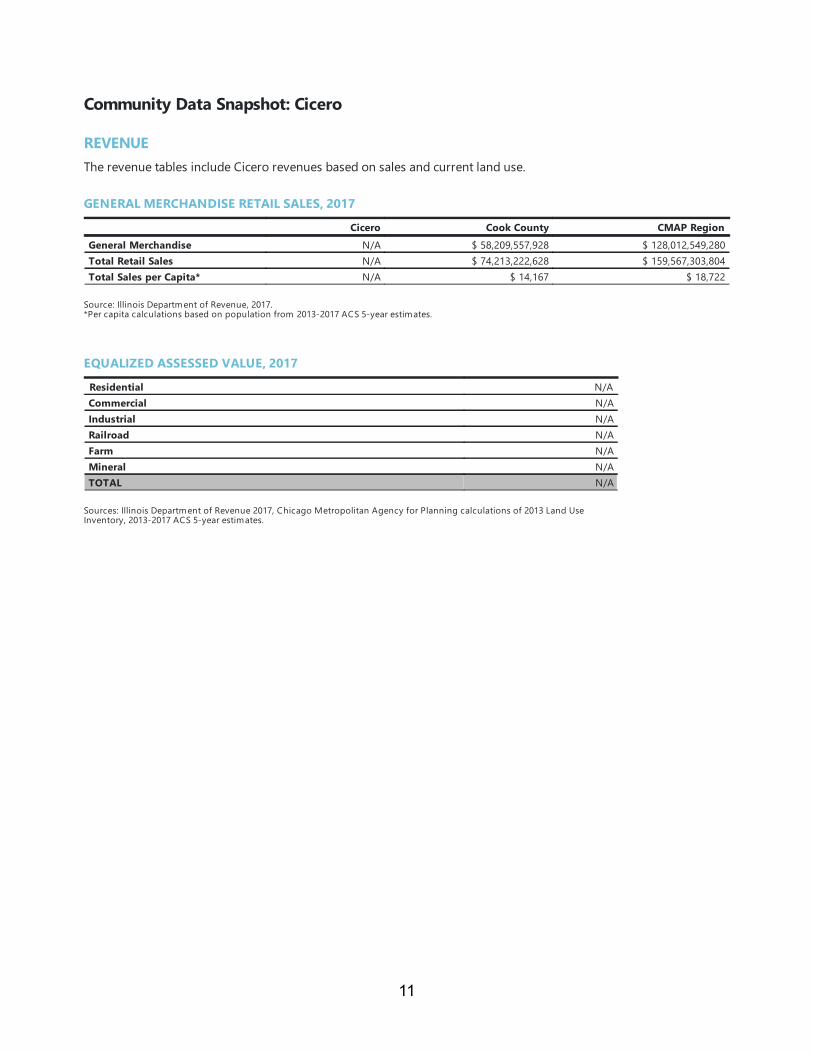
REVENUEThe revenue tables include Cicero revenues based on sales and current land use.
GENERAL MERCHANDISE RETAIL SALES, 2017Cicero Cook County CMAP Region
General Merchandise N/A $ 58,209,557,928 $ 128,012,549,280Total Retail Sales N/A $ 74,213,222,628 $ 159,567,303,804Total Sales per Capita* N/A $ 14,167 $ 18,722
Source: Illinois Department of Revenue, 2017.*Per capita calculations based on population from 2013-2017 ACS 5-year estimates.
EQUALIZED ASSESSED VALUE, 2017Residential N/ACommercial N/AIndustrial N/ARailroad N/AFarm N/AMineral N/ATOTAL N/A
Sources: Illinois Department of Revenue 2017, Chicago Metropolitan Agency for Planning calculations of 2013 Land UseInventory, 2013-2017 ACS 5-year estimates.
11
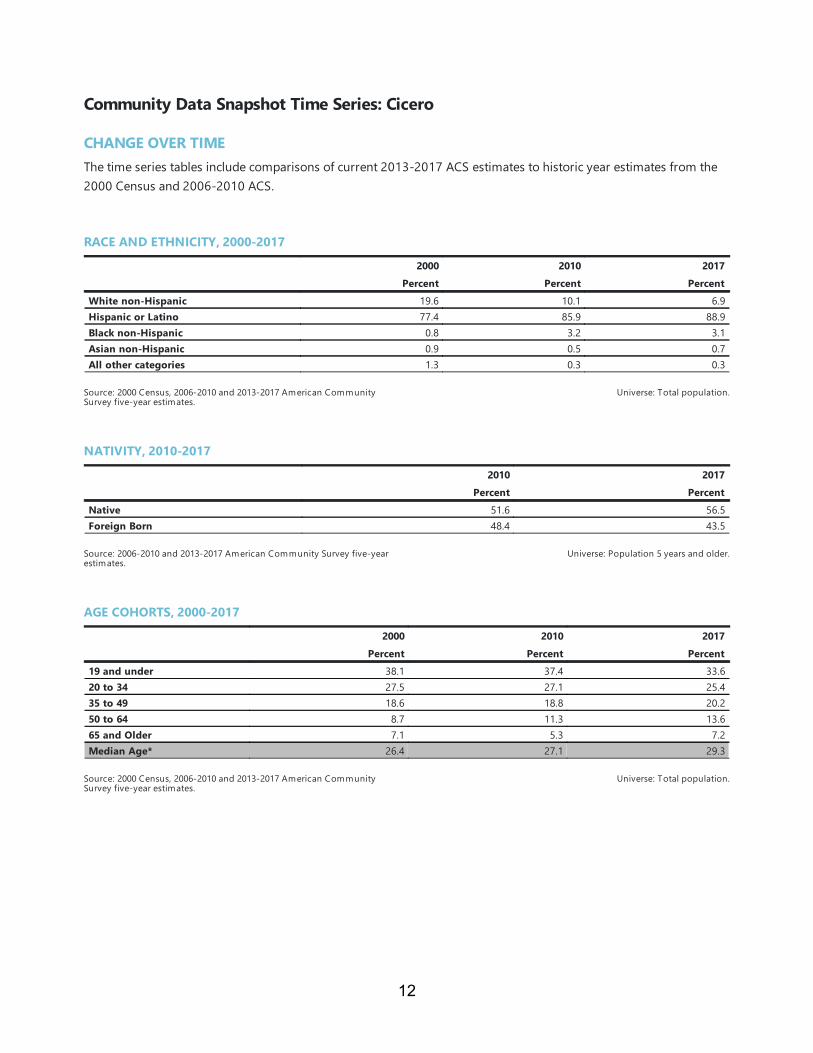
Community Data Snapshot Time Series: Cicero
CHANGE OVER TIMEThe time series tables include comparisons of current 2013-2017 ACS estimates to historic year estimates from the2000 Census and 2006-2010 ACS.
RACE AND ETHNICITY, 2000-20172000 2010 2017
Percent Percent PercentWhite non-Hispanic 19.6 10.1 6.9Hispanic or Latino 77.4 85.9 88.9Black non-Hispanic 0.8 3.2 3.1Asian non-Hispanic 0.9 0.5 0.7All other categories 1.3 0.3 0.3
Source: 2000 Census, 2006-2010 and 2013-2017 American CommunitySurvey five-year estimates.
Universe: Total population.
NATIVITY, 2010-20172010 2017
Percent PercentNative 51.6 56.5Foreign Born 48.4 43.5
Source: 2006-2010 and 2013-2017 American Community Survey five-yearestimates.
Universe: Population 5 years and older.
AGE COHORTS, 2000-20172000 2010 2017
Percent Percent Percent19 and under 38.1 37.4 33.620 to 34 27.5 27.1 25.435 to 49 18.6 18.8 20.250 to 64 8.7 11.3 13.665 and Older 7.1 5.3 7.2Median Age* 26.4 27.1 29.3
Source: 2000 Census, 2006-2010 and 2013-2017 American CommunitySurvey five-year estimates.
Universe: Total population.
12
Community Data Snapshot Time Series: Cicero
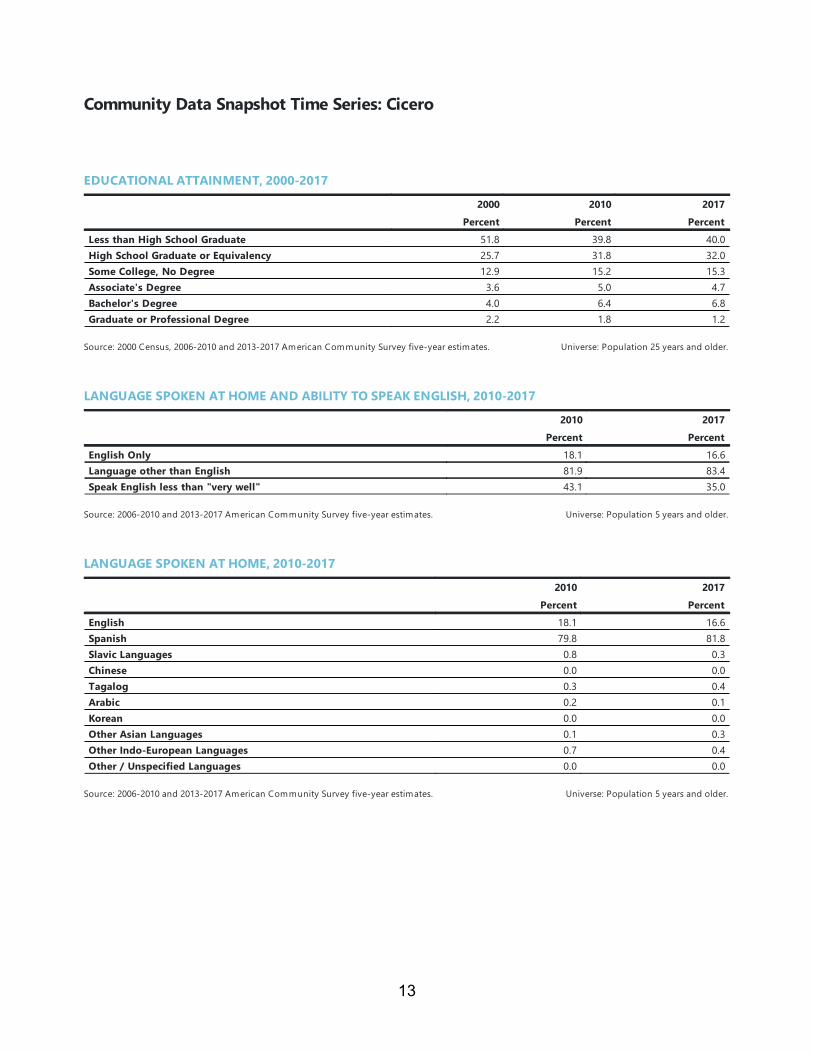
EDUCATIONAL ATTAINMENT, 2000-20172000 2010 2017
Percent Percent PercentLess than High School Graduate 51.8 39.8 40.0High School Graduate or Equivalency 25.7 31.8 32.0Some College, No Degree 12.9 15.2 15.3Associate's Degree 3.6 5.0 4.7Bachelor's Degree 4.0 6.4 6.8Graduate or Professional Degree 2.2 1.8 1.2
Source: 2000 Census, 2006-2010 and 2013-2017 American Community Survey five-year estimates. Universe: Population 25 years and older.
LANGUAGE SPOKEN AT HOME AND ABILITY TO SPEAK ENGLISH, 2010-20172010 2017
Percent PercentEnglish Only 18.1 16.6Language other than English 81.9 83.4Speak English less than "very well" 43.1 35.0
Source: 2006-2010 and 2013-2017 American Community Survey five-year estimates. Universe: Population 5 years and older.
LANGUAGE SPOKEN AT HOME, 2010-20172010 2017
Percent PercentEnglish 18.1 16.6Spanish 79.8 81.8Slavic Languages 0.8 0.3Chinese 0.0 0.0Tagalog 0.3 0.4Arabic 0.2 0.1Korean 0.0 0.0Other Asian Languages 0.1 0.3Other Indo-European Languages 0.7 0.4Other / Unspecified Languages 0.0 0.0
Source: 2006-2010 and 2013-2017 American Community Survey five-year estimates. Universe: Population 5 years and older.
13
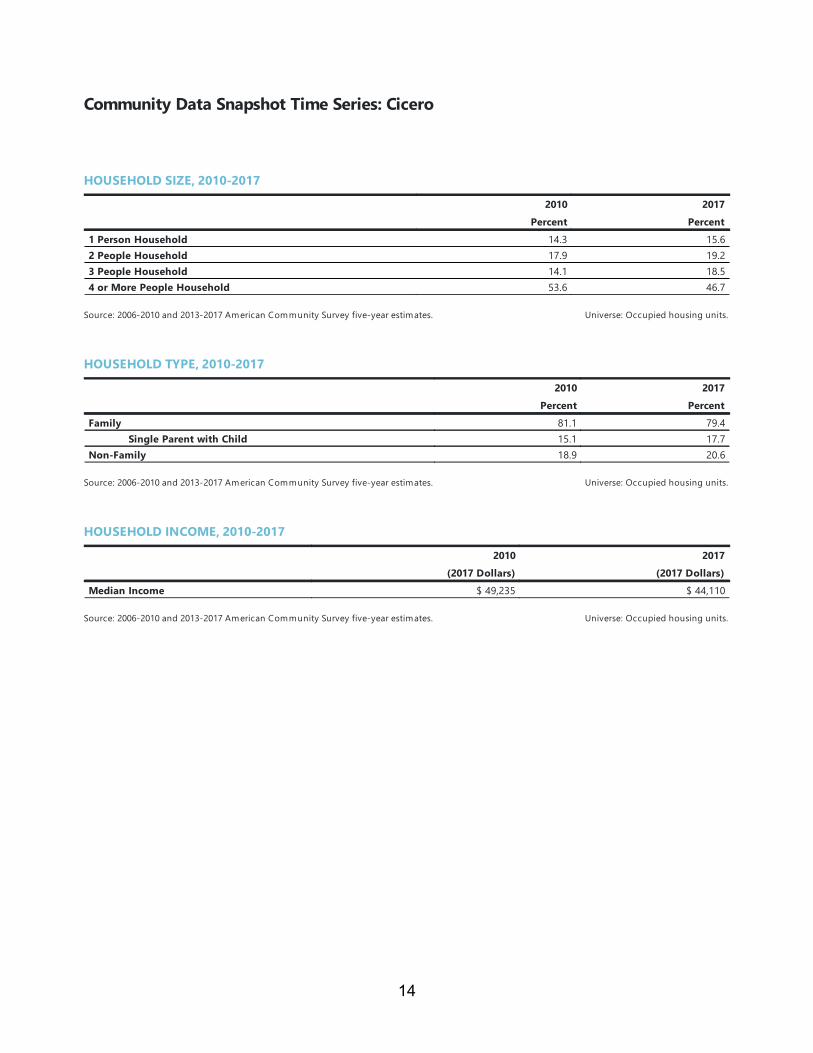
Community Data Snapshot Time Series: Cicero
HOUSEHOLD SIZE, 2010-20172010 2017
Percent Percent1 Person Household 14.3 15.62 People Household 17.9 19.23 People Household 14.1 18.54 or More People Household 53.6 46.7
Source: 2006-2010 and 2013-2017 American Community Survey five-year estimates. Universe: Occupied housing units.
HOUSEHOLD TYPE, 2010-20172010 2017
Percent PercentFamily 81.1 79.4
Single Parent with Child 15.1 17.7Non-Family 18.9 20.6
Source: 2006-2010 and 2013-2017 American Community Survey five-year estimates. Universe: Occupied housing units.
HOUSEHOLD INCOME, 2010-20172010 2017
(2017 Dollars) (2017 Dollars)Median Income $ 49,235 $ 44,110
Source: 2006-2010 and 2013-2017 American Community Survey five-year estimates. Universe: Occupied housing units.
14
Community Data Snapshot Time Series: Cicero
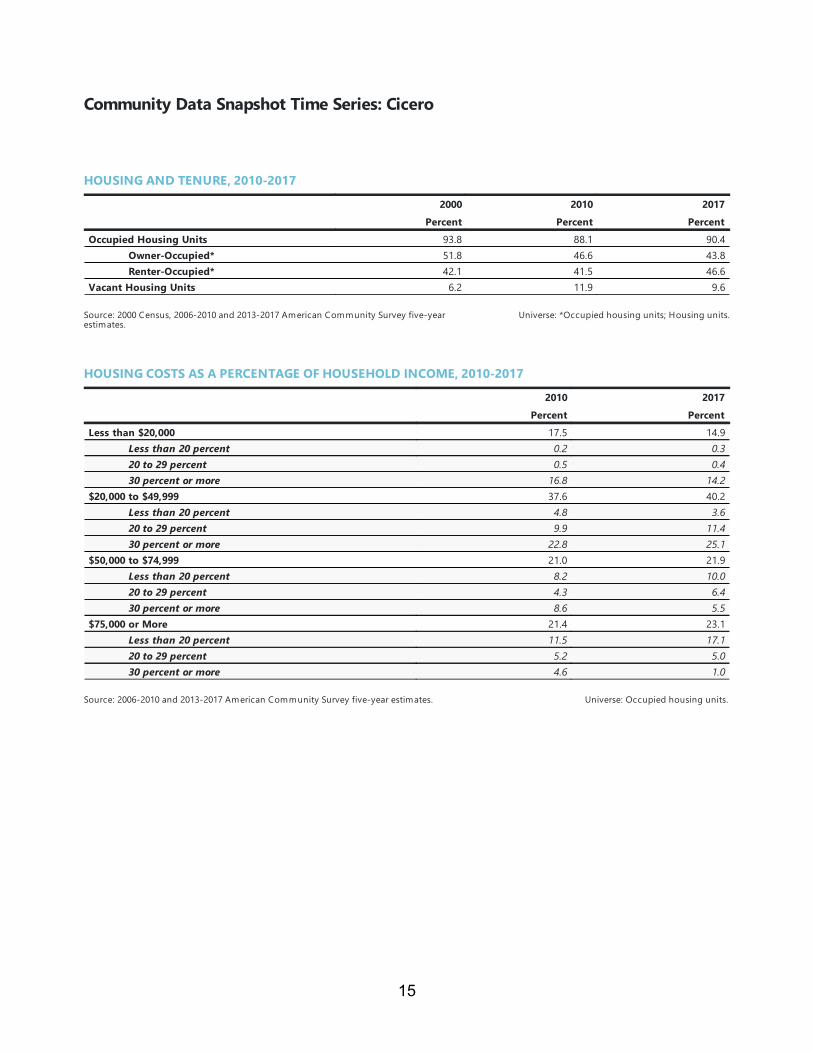
HOUSING AND TENURE, 2010-20172000 2010 2017
Percent Percent PercentOccupied Housing Units 93.8 88.1 90.4
Owner-Occupied* 51.8 46.6 43.8Renter-Occupied* 42.1 41.5 46.6
Vacant Housing Units 6.2 11.9 9.6
Source: 2000 Census, 2006-2010 and 2013-2017 American Community Survey five-yearestimates.
Universe: *Occupied housing units; Housing units.
HOUSING COSTS AS A PERCENTAGE OF HOUSEHOLD INCOME, 2010-20172010 2017
Percent PercentLess than $20,000 17.5 14.9
Less than 20 percent 0.2 0.320 to 29 percent 0.5 0.430 percent or more 16.8 14.2
$20,000 to $49,999 37.6 40.2Less than 20 percent 4.8 3.620 to 29 percent 9.9 11.430 percent or more 22.8 25.1
$50,000 to $74,999 21.0 21.9Less than 20 percent 8.2 10.020 to 29 percent 4.3 6.430 percent or more 8.6 5.5
$75,000 or More 21.4 23.1Less than 20 percent 11.5 17.120 to 29 percent 5.2 5.030 percent or more 4.6 1.0
Source: 2006-2010 and 2013-2017 American Community Survey five-year estimates. Universe: Occupied housing units.
15
Community Data Snapshot Time Series: Cicero
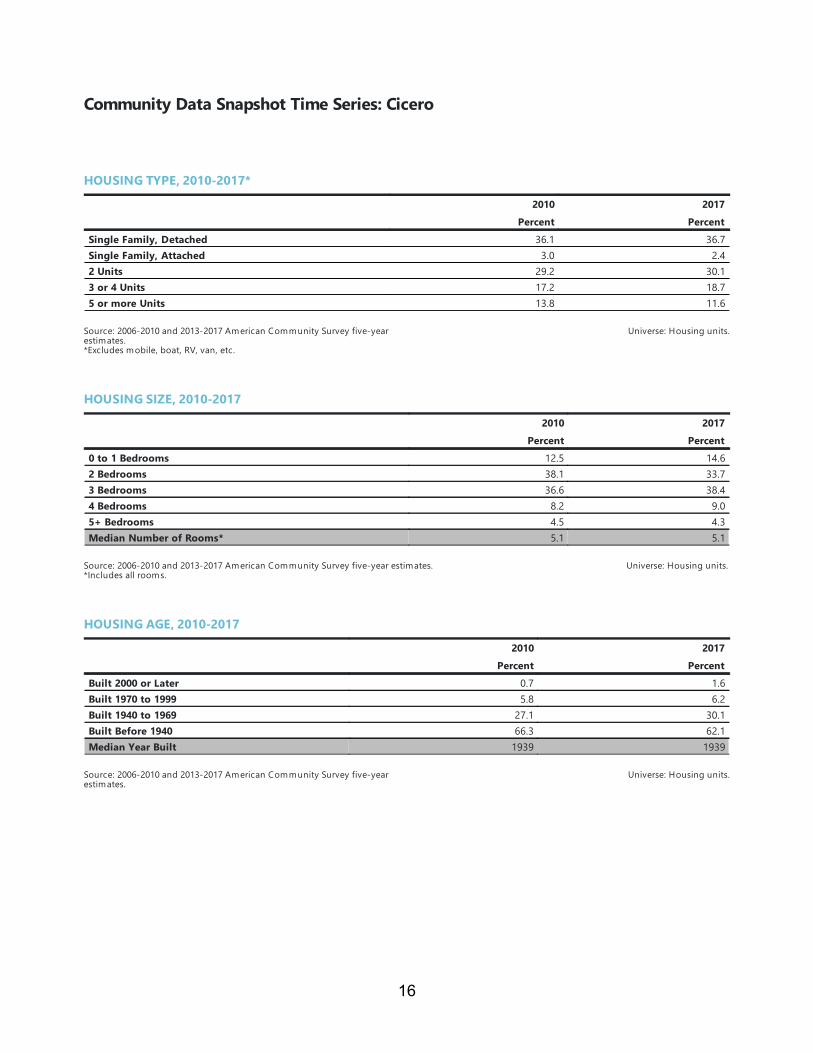
HOUSING TYPE, 2010-2017*2010 2017
Percent PercentSingle Family, Detached 36.1 36.7Single Family, Attached 3.0 2.42 Units 29.2 30.13 or 4 Units 17.2 18.75 or more Units 13.8 11.6
Source: 2006-2010 and 2013-2017 American Community Survey five-yearestimates.*Excludes mobile, boat, RV, van, etc.
Universe: Housing units.
HOUSING SIZE, 2010-20172010 2017
Percent Percent0 to 1 Bedrooms 12.5 14.62 Bedrooms 38.1 33.73 Bedrooms 36.6 38.44 Bedrooms 8.2 9.05+ Bedrooms 4.5 4.3Median Number of Rooms* 5.1 5.1
Source: 2006-2010 and 2013-2017 American Community Survey five-year estimates.*Includes all rooms.
Universe: Housing units.
HOUSING AGE, 2010-20172010 2017
Percent PercentBuilt 2000 or Later 0.7 1.6Built 1970 to 1999 5.8 6.2Built 1940 to 1969 27.1 30.1Built Before 1940 66.3 62.1Median Year Built 1939 1939
Source: 2006-2010 and 2013-2017 American Community Survey five-yearestimates.
Universe: Housing units.
16
Community Data Snapshot Time Series: Cicero
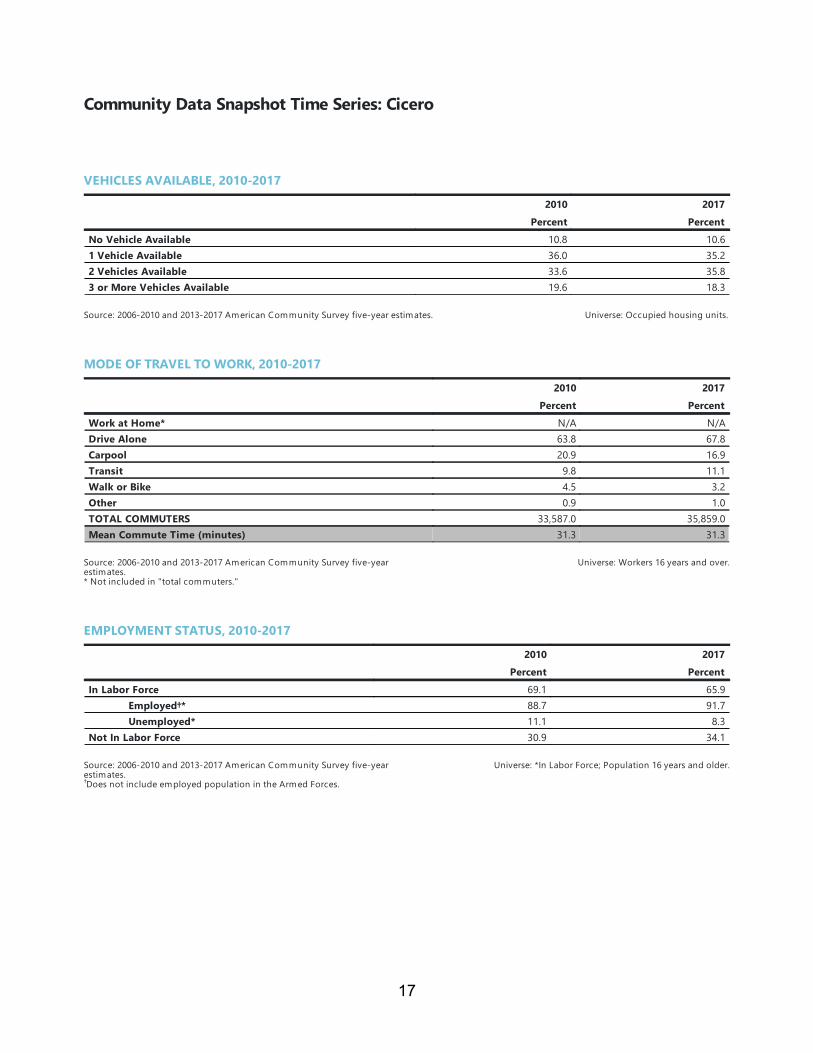
VEHICLES AVAILABLE, 2010-20172010 2017
Percent PercentNo Vehicle Available 10.8 10.61 Vehicle Available 36.0 35.22 Vehicles Available 33.6 35.83 or More Vehicles Available 19.6 18.3
Source: 2006-2010 and 2013-2017 American Community Survey five-year estimates. Universe: Occupied housing units.
MODE OF TRAVEL TO WORK, 2010-20172010 2017
Percent PercentWork at Home* N/A N/ADrive Alone 63.8 67.8Carpool 20.9 16.9Transit 9.8 11.1Walk or Bike 4.5 3.2Other 0.9 1.0TOTAL COMMUTERS 33,587.0 35,859.0Mean Commute Time (minutes) 31.3 31.3
Source: 2006-2010 and 2013-2017 American Community Survey five-yearestimates.* Not included in "total commuters."
Universe: Workers 16 years and over.
EMPLOYMENT STATUS, 2010-20172010 2017
Percent PercentIn Labor Force 69.1 65.9
Employed†* 88.7 91.7Unemployed* 11.1 8.3
Not In Labor Force 30.9 34.1
Source: 2006-2010 and 2013-2017 American Community Survey five-yearestimates.Does not include employed population in the Armed Forces.†
Universe: *In Labor Force; Population 16 years and older.
17
Community Data Snapshot Water Supply: Cicero
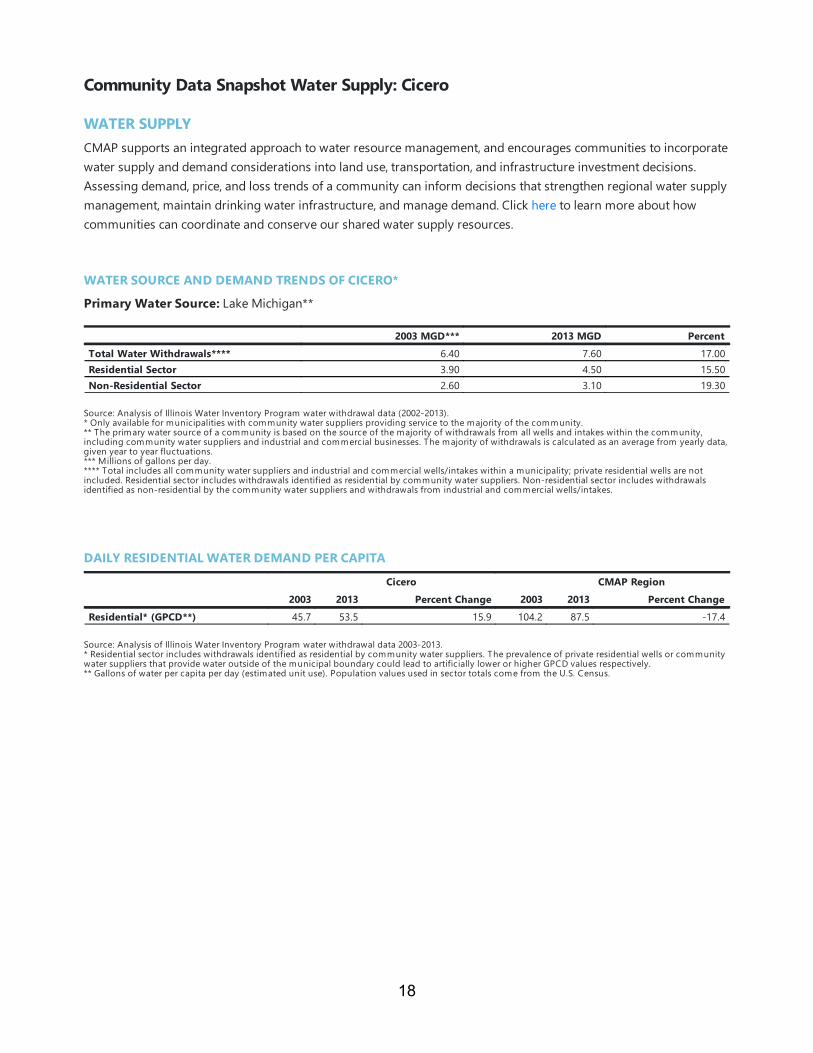
WATER SUPPLYCMAP supports an integrated approach to water resource management, and encourages communities to incorporatewater supply and demand considerations into land use, transportation, and infrastructure investment decisions.Assessing demand, price, and loss trends of a community can inform decisions that strengthen regional water supplymanagement, maintain drinking water infrastructure, and manage demand. Click here to learn more about howcommunities can coordinate and conserve our shared water supply resources.
WATER SOURCE AND DEMAND TRENDS OF CICERO*Primary Water Source: Lake Michigan**
2003 MGD*** 2013 MGD PercentTotal Water Withdrawals**** 6.40 7.60 17.00Residential Sector 3.90 4.50 15.50Non-Residential Sector 2.60 3.10 19.30
Source: Analysis of Illinois Water Inventory Program water withdrawal data (2002-2013).* Only available for municipalities with community water suppliers providing service to the majority of the community. ** The primary water source of a community is based on the source of the majority of withdrawals from all wells and intakes within the community,including community water suppliers and industrial and commercial businesses. The majority of withdrawals is calculated as an average from yearly data,given year to year fluctuations. *** Millions of gallons per day. **** Total includes all community water suppliers and industrial and commercial wells/intakes within a municipality; private residential wells are notincluded. Residential sector includes withdrawals identified as residential by community water suppliers. Non-residential sector includes withdrawalsidentified as non-residential by the community water suppliers and withdrawals from industrial and commercial wells/intakes.
DAILY RESIDENTIAL WATER DEMAND PER CAPITACicero CMAP Region
2003 2013 Percent Change 2003 2013 Percent ChangeResidential* (GPCD**) 45.7 53.5 15.9 104.2 87.5 -17.4
Source: Analysis of Illinois Water Inventory Program water withdrawal data 2003-2013.* Residential sector includes withdrawals identified as residential by community water suppliers. The prevalence of private residential wells or communitywater suppliers that provide water outside of the municipal boundary could lead to artificially lower or higher GPCD values respectively. ** Gallons of water per capita per day (estimated unit use). Population values used in sector totals come from the U.S. Census.
18
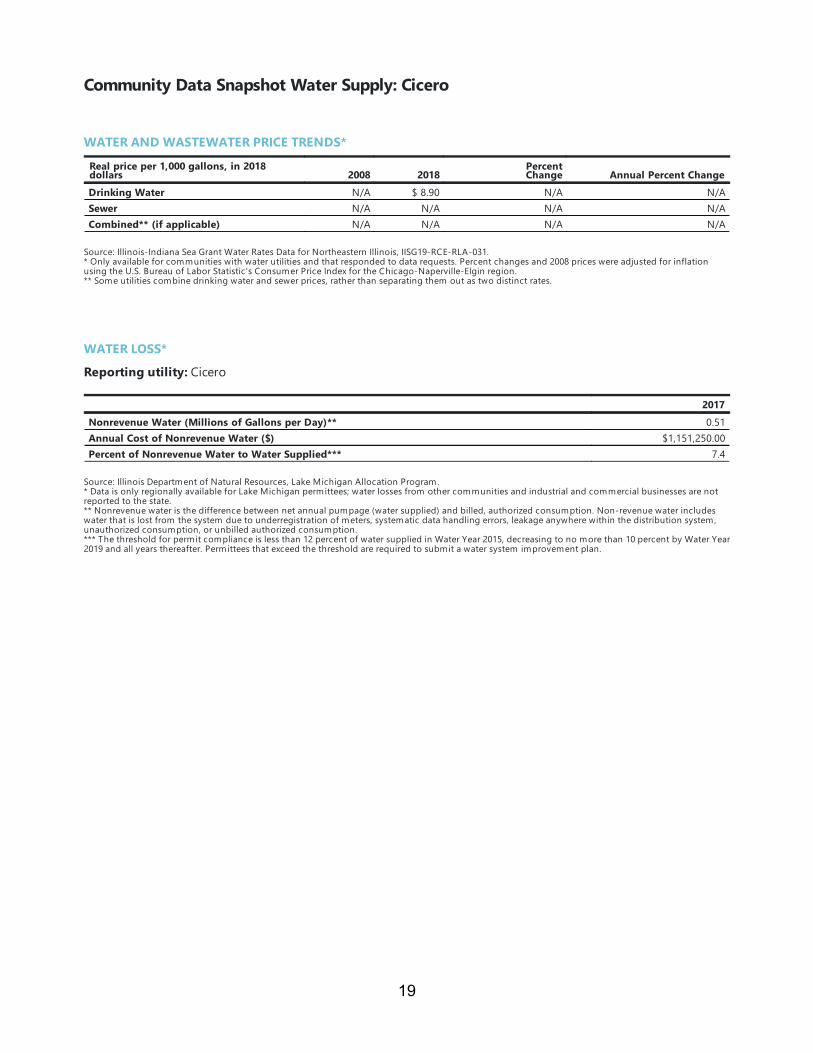
Community Data Snapshot Water Supply: Cicero
WATER AND WASTEWATER PRICE TRENDS*Real price per 1,000 gallons, in 2018dollars 2008 2018 PercentChange Annual Percent ChangeDrinking Water N/A $ 8.90 N/A N/ASewer N/A N/A N/A N/ACombined** (if applicable) N/A N/A N/A N/A
Source: Illinois-Indiana Sea Grant Water Rates Data for Northeastern Illinois, IISG19-RCE-RLA-031.* Only available for communities with water utilities and that responded to data requests. Percent changes and 2008 prices were adjusted for inflationusing the U.S. Bureau of Labor Statistic's Consumer Price Index for the Chicago-Naperville-Elgin region.** Some utilities combine drinking water and sewer prices, rather than separating them out as two distinct rates.
WATER LOSS*Reporting utility: Cicero
2017Nonrevenue Water (Millions of Gallons per Day)** 0.51Annual Cost of Nonrevenue Water ($) $1,151,250.00Percent of Nonrevenue Water to Water Supplied*** 7.4
Source: Illinois Department of Natural Resources, Lake Michigan Allocation Program.* Data is only regionally available for Lake Michigan permittees; water losses from other communities and industrial and commercial businesses are notreported to the state. ** Nonrevenue water is the difference between net annual pumpage (water supplied) and billed, authorized consumption. Non-revenue water includeswater that is lost from the system due to underregistration of meters, systematic data handling errors, leakage anywhere within the distribution system,unauthorized consumption, or unbilled authorized consumption.*** The threshold for permit compliance is less than 12 percent of water supplied in Water Year 2015, decreasing to no more than 10 percent by Water Year2019 and all years thereafter. Permittees that exceed the threshold are required to submit a water system improvement plan.
19
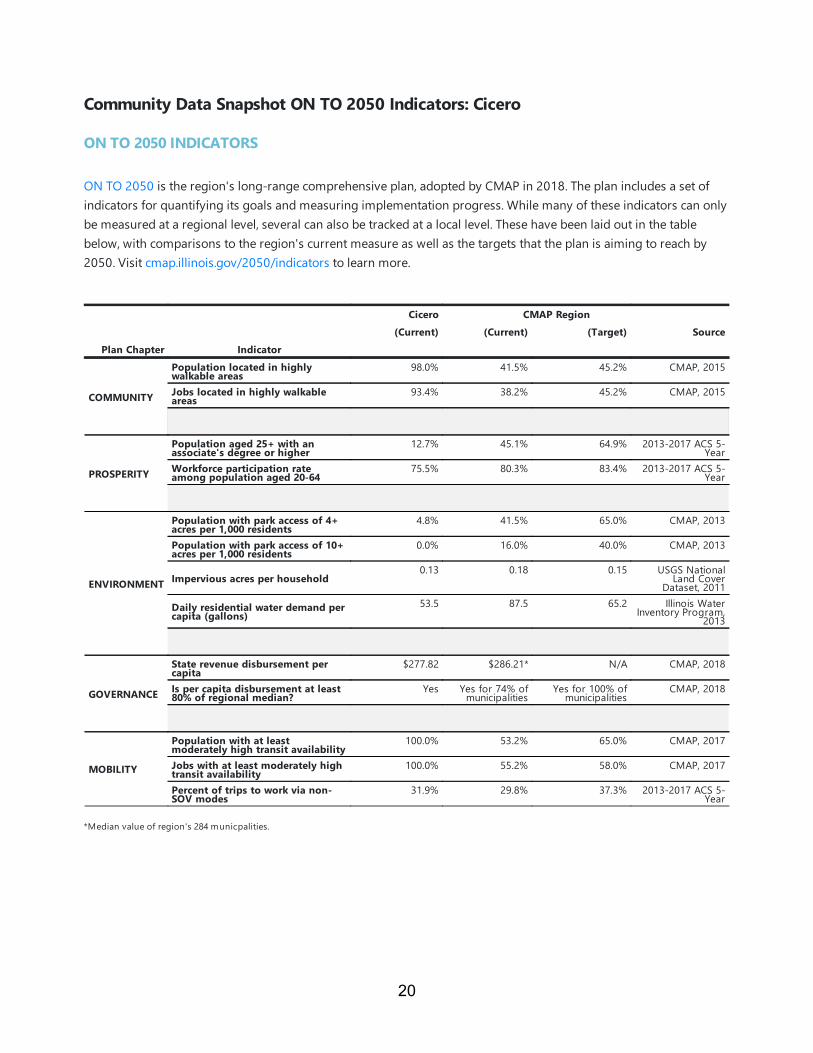
Community Data Snapshot ON TO 2050 Indicators: Cicero
ON TO 2050 INDICATORS
ON TO 2050 is the region's long-range comprehensive plan, adopted by CMAP in 2018. The plan includes a set ofindicators for quantifying its goals and measuring implementation progress. While many of these indicators can onlybe measured at a regional level, several can also be tracked at a local level. These have been laid out in the tablebelow, with comparisons to the region's current measure as well as the targets that the plan is aiming to reach by2050. Visit cmap.illinois.gov/2050/indicators to learn more.
Cicero CMAP Region(Current) (Current) (Target) Source
Plan Chapter Indicator
COMMUNITY
Population located in highlywalkable areas 98.0% 41.5% 45.2% CMAP, 2015
Jobs located in highly walkableareas 93.4% 38.2% 45.2% CMAP, 2015
PROSPERITY
Population aged 25+ with anassociate's degree or higher 12.7% 45.1% 64.9% 2013-2017 ACS 5-Year
Workforce participation rateamong population aged 20-64 75.5% 80.3% 83.4% 2013-2017 ACS 5-Year
ENVIRONMENT
Population with park access of 4+acres per 1,000 residents 4.8% 41.5% 65.0% CMAP, 2013
Population with park access of 10+acres per 1,000 residents 0.0% 16.0% 40.0% CMAP, 2013
Impervious acres per household 0.13 0.18 0.15 USGS NationalLand Cover
Dataset, 2011Daily residential water demand percapita (gallons)
53.5 87.5 65.2 Illinois WaterInventory Program,
2013
GOVERNANCE
State revenue disbursement percapita $277.82 $286.21* N/A CMAP, 2018
Is per capita disbursement at least80% of regional median? Yes Yes for 74% ofmunicipalities
Yes for 100% ofmunicipalities
CMAP, 2018
MOBILITY
Population with at leastmoderately high transit availability 100.0% 53.2% 65.0% CMAP, 2017
Jobs with at least moderately hightransit availability 100.0% 55.2% 58.0% CMAP, 2017
Percent of trips to work via non-SOV modes 31.9% 29.8% 37.3% 2013-2017 ACS 5-Year
*Median value of region's 284 municpalities.
20
Community Data Snapshot: Cicero
For More Information Last updated June 2019
To improve the Community Data Snapshots in the future, CMAP wants to hear from you. Please take a quick surveyto describe how you use this data and what you'd like to see in next year's snapshots.
Please direct inquiries to [email protected]. To access other Community Data Snapshots for municipalities andcounties in the Chicago Metropolitan Agency for Planning’s seven-county northeastern Illinois region, visithttp://www.cmap.illinois.gov/data/community-snapshots.
21