Community-based Monitoring of Butterflies in the City of Kitchener, Ontario, Canada
81
Testing the Effectiveness of Citizen Science Using a Volunteer Butterfly Monitoring Program by Charlotte Moore A thesis presented to the University of Waterloo in fulfillment of the thesis requirements for the degree of Master of Environmental Studies in Environment and Resource Studies Waterloo, Ontario, Canada, 2014 © Charlotte Moore 2014
Transcript of Community-based Monitoring of Butterflies in the City of Kitchener, Ontario, Canada

Testing the Effectiveness of Citizen Science Using a Volunteer Butterfly Monitoring Program
by
Charlotte Moore
A thesis presented to the University of Waterloo
in fulfillment of the thesis requirements for the degree of
Master of Environmental Studies in
Environment and Resource Studies
Waterloo, Ontario, Canada, 2014
© Charlotte Moore 2014

ii
Author’s Declaration
I hereby declare that I am the sole author of this thesis. This is the true copy of the thesis, including any required revisions, as accepted by my examiners. I understand that my thesis may be made electronically available to the public.

iii
Abstract
An increasingly popular method of collecting scientific data is to use citizen scientists in community-based monitoring programs. Numerous formal and community-based monitoring programs use butterflies as indicator species to detect and understand changes in ecosystems. A butterfly monitoring program was established with the City of Kitchener in 2012, in order to measure the effectiveness of citizen science observations in identifying butterfly assemblages. Two monitoring sites were used: Lakeside Park contained relatively simple butterfly habitats, and Huron Natural Area which included complex butterfly habitats. The program consisted of training volunteers to collect data on the butterfly assemblages. Volunteers were given the choice to monitor an established trail at either natural area once every two weeks from the beginning of May to the end of August using the modified Pollard method. It was important to train volunteers how to monitor butterflies, so they were required to attend an instruction workshop to learn the methods to be employed, identification of butterflies, use of the recording form, and proper net and butterfly handling techniques. Quality control measures were another important component of the program, and included comparing volunteer observations at each natural area to those collected by an expert. Each species observation was reviewed to determine the likelihood of the species observation. The species and its habitat were compared to the information and status recorded in The Butterflies of Waterloo Region. The data collected by the participants was analyzed separately by study site and included the calculation of species richness, Shannon-Wiener Diversity Index (H), evenness value, Simpson Index (D), and Simpson Reciprocal (1/D) values. A two-tailed t-test was conducted to compare the data (as represented by Shannon indexes) collected by volunteers and the expert. The species richness for Lakeside Park was 29, which was slightly higher than the 26 species identified at Huron Natural Area. However, the Shannon-Wiener Diversity Index (H), evenness value (E), Simpson Diversity Index (D), and Simpson Reciprocal Index (1/D) all demonstrated that there was a more even and diverse butterfly population at Huron Natural Area than at Lakeside Park. A high level of validity of volunteer observations was found during this study, as 93% of submitted observations at Lakeside Park and 94% of submitted observations at Huron Natural Area passed the review process. Based on the high level of validity of observations it was determined that the volunteers were successful in characterizing butterfly assemblages, and establishing baseline conditions at each site. The City of Kitchener will be collecting long-term butterfly data, which they can compare over time to provide insight into the diversity at these natural areas. This research program has contributed to the field of science and to the literature by establishing a review process for citizen science, particularly for butterfly programs. It has also provided further validation of citizen science data.

iv
Acknowledgements
I would like to thank my advisor Stephen Murphy and my committee member David Stephenson for their guidance and review of this paper. I would also like to thank the City of Kitchener and Josh Shea, for without them this program would not exist. Also, I would like to thank all the volunteers who donated their time to be part of this program - your efforts are truly appreciated! Finally, I would like to thank my parents, Susan and Steven Moore, my second parents, Don and Cathy Teat, and Bryan Teat who have all loved and supported me throughout this process. I couldn’t have done it without you!

v
Table of Contents Author’s Declaration ..................................................................................................... ii Abstract ......................................................................................................................... iii Acknowledgements ...................................................................................................... iv Table of Contents .......................................................................................................... v List of Figures………………………………………………………………………………...vii List of Tables .............................................................................................................. viii Chapter 1 Introduction to Community-based Monitoring .................................... 1
1.1 Using Butterflies as Indicator Species ................................................... 2
1.2 Need for Community-based Monitoring Programs................................ 3
1.3 Research Objective .................................................................................. 5
1.4 Study Sites ................................................................................................ 5
Chapter 2 Methods ................................................................................................ 10
2.1 Volunteer Recruitment ........................................................................... 10
2.2 Volunteer Training .................................................................................. 10
2.3 Butterfly Monitoring Methods ............................................................... 12
2.4 Quality Control Measures ...................................................................... 14
2.5 Data Analysis .......................................................................................... 16
Chapter 3 Results .................................................................................................. 18
3.1 Volunteer Retention ............................................................................... 18
3.1.1 Lakeside Park .......................................................................................... 18
3.1.2 Huron Natural Area .................................................................................. 19
3.2 Testing the Validity of Data ................................................................... 19
3.2.1 High Validity of Lakeside Park Data ....................................................... 19 3.2.2 High Level of Validity of Huron Natural Area Data................................ 21
3.3 Butterfly Monitoring Results ................................................................. 22
3.3.1 Lakeside Park .......................................................................................... 22 3.3.2 Huron Natural Area .................................................................................. 25
Chapter 4 Discussion ............................................................................................ 34
4.1 Volunteer Data was Effective ................................................................ 34
4.1.1 Validity of Data Collected at Lakeside Park .......................................... 37 4.1.2 Validity of Data Collected at Huron Natural Area .................................. 38
4.2 Establishment of Baseline Conditions ................................................. 40
4.2.1 Poor Diversity at Lakeside Park ............................................................. 40 4.2.2 Rich Diversity at Huron Natural Area ..................................................... 41
4.3 Ensuring the Success of the Program ............................................................. 45
4.4 Contribution to Research, the Community and the Broader Public ............. 51 4.5 Concluding Remarks ......................................................................................... 56
References.... ………………………………………………………………………………….58 Appendices Appendix I Training Manual………………………………………………………………….68

vi
Appendix II Standard Monitoring Form……………………………………………………...71 Appendix III Beaufort Wind Scale……………………………………………………………73

vii
List of Figures Figure 1. Lakeside Park Vegetation Communities ..................................................................... 8 Figure 2. Huron Natural Area Vegetation Communities ............................................................. 9

viii
List of Tables Table 1. Lakeside Park Vegetation Communities Within and Bordering the Study Site ............. 6 Table 2. Huron Natural Area Vegetation Communities Within and Bordering the Study Site ..... 6 Table 3. Weeks Monitored by Volunteers in 2012 ....................................................................13 Table 4. Volunteer Retention at Lakeside Park .........................................................................18 Table 5. Volunteer Retention at Huron Natural Area ................................................................19 Table 6. Lakeside Park Complete List of Butterflies Observed in 2012. ...................................22 Table 7. Lakeside Park Final List of Butterflies Observed in 2012 ............................................24 Table 8. Lakeside Park Data Results .......................................................................................25 Table 9. Huron Natural Area Complete List of Butterflies Observed in 2012. ...........................26 Table 10. Huron Natural Area Final List of Butterflies Observed in 2012 ..................................27 Table 11. Huron Natural Area Data Results .............................................................................28 Table 12. Comparison Between Expert Observations and the Final List of Volunteer
Observations at the Huron Natural Area .............................................................................29 Table 13. Summary of Butterflies Observed by NRSI at the Huron Natural Area in 2010-2012,
Compared to Observations made by Volunteers in 201 ......................................................31 Table 14. Shannon Index, Simpson Index and Two-tailed T-test Comparing Huron Natural Area
Data from 2010-2012 and CBM Data in 2012 .....................................................................33

1
Chapter 1 Introduction to Community-based Monitoring
One method of monitoring ecosystems is to use citizen scientists, who are volunteers
collecting data for scientific research (Kruger & Shannon, 2000). Citizen science
programs are implemented for several different reasons, including scientific data
collection, education, and community participation in conservation (Matteson et al.,
2012). A program that utilizes citizen scientists is known as community-based
monitoring (CBM). The use of CBM is increasing in Canada, as the function and
importance of this kind of monitoring is acknowledged (Conrad & Daoust, 2008;
Devictor et al., 2010; Dickson et al., 2010; Conrad & Hilchey, 2011; Pollock & Whitelaw,
2005). CBM can be useful for filling gaps in existing data sets (Conrad & Hichey, 2011),
which can be a consequence of widespread cutbacks in municipal, provincial and
federal government environmental programs (Pollock & Whitelaw, 2005; Savan et al.,
2003).
Community-based monitoring can also introduce challenges to programs. These
challenges can include issues with program organization, data accuracy and
communication of program results (Whitelaw et al., 2003). For the purposes of this
program, accuracy refers to the ability of volunteers to correctly identify butterfly
species. Other concerns include lack of validation of the data collected by volunteers,
as well as issues with incompleteness and comparability of data (Gouveia et al., 2004;
Bradshaw, 2003). The definition of validation is the ability to confirm species
identification through a review process. These challenges can lead to difficulties in
justifying the data as useful to decision-makers (Milne et al., 2006; Conrad & Daoust,
2008).
This study utilized community-based monitoring of butterflies in the City of Kitchener
(Ontario, Canada) to analyze the contribution of volunteer observations in identifying
butterfly assemblages at two sites; Huron Natural Area and Lakeside Park.

2
To date, there are relatively few studies that evaluate the contribution of citizen
scientists to monitoring butterfly assemblages in North America, particularly in an urban
landscape where citizen scientists may be the most useful for detecting species’ trends
(Matteson et al., 2012; Cooper et al., 2007).
1.1 Using Butterflies as Indicator Species
Butterflies use a wide variety of habitats and larval food plants (Ehrlich & Raven, 1964),
which make this taxa appropriate for monitoring in many different types of ecosystems.
Butterfly assemblages can be used as an indicator of change, including changes
resulting from anthropogenic influences on landscapes. Human developments
frequently cause habitat fragmentation and isolation, which reduces the size of many
animal populations (Shippers et al., 1996; Richter-Dyn & Goel, 1972). As fragmentation
occurs, the probability of the disappearance of local populations increases because of
limited dispersal from one population to another (Shippers et al., 1996; Richter-Dyn &
Goel, 1972). Habitat protection and connectivity of habitat are vital to butterfly
populations (Smallidge & Leopold, 1997) because human development – especially
roads and buildings - have altered and destroyed habitats used in their larval and adult
stages and have reduced connectivity among habitats (Forister et al., 2010).
Concentrated human developments, such as urban landscapes, present a particular
threat to butterfly populations along with pollution, the introduction of exotic species,
natural succession and road mortality (Smallidge & Leopold, 1997). Butterflies are
affected by urbanization because they are sensitive to change as a result of
development (Gilbert, 1980; Pyle, 1980; Brown 1982; Murphy et al., 1990; Kremen,
1992), and studies have demonstrated a decrease in butterfly species in areas that are
intensely developed (Blair & Launer, 1997; Yamamoto, 1977; Dennis & Hardy, 2001;
Ruszczyk, & De Araujo, 1992; Ruszczyk, 1986). Although, it has been demonstrated
that diverse butterfly communities can exist in urbanized habitats if suitable habitats are
created and maintained (Hogsden & Hutchinson, 2004). As well, moderate levels of
disturbance in urban areas can increase the species richness of certain butterflies
(Hogsden & Hutchinson, 2004).
3
Butterflies can provide indications of other taxa, as butterflies have a complex life cycle,
providing a good indication of the health of herbaceous communities (Ehrlich & Raven,
1964), herbivorous arthropods and other taxonomic groups (Waltz & Covington, 2004;
Fleishman et al., 2005). Butterflies are useful indicators because they are sensitive to
changes in local climate and light levels (Gilbert, 1980; Pyle 1980; Brown, 1982; Murphy
et al., 1990; Kremen, 1992; Watt et al., 1968; Ehrlich et al., 1972; Weiss et al., 1987). In
addition, butterflies are a useful indicator species for this program in terms of their
charismatic ability to engage people in their environment. Butterflies are fairly easy to
identify, have a high level of interest to the public and have a well-known life history
(Blair, 1999). Butterflies are the most frequent conservation targets among
invertebrates and can foster public sympathy for conservation (Samways, 1994; New,
1997).
Finally, studies show that some species of butterflies are expanding their northern range
in Canada as changes in climate occur (Dennis, 1993; Kharouba et al., 2009; Roy et al.,
2001). Butterflies can be used to track changes in vegetation communities, predict
future composition and provide evidence for adapting natural area boundaries (Lemieux
& Scott, 2005). For these reasons, butterflies were the target species in this monitoring
program.
1.2 Need for Community-based Monitoring Programs
Community-based monitoring programs are needed to conduct scientific investigation,
increase citizen and community education, and to enhance community participation in
conservation (Matteson et al., 2012). Education and knowledge of the diversity of
ecosystems are the first phase of conservation (Niell et al., 2007). Citizen science can
also be a method of empowering people to become involved in environmental issues
that are of interest to them (Kim et al., 2011). There is a need to test the effectiveness
of volunteer programs, as to date, very few studies have examined the reliability of this
type of data (Newman et al., 2003).

4
Urban areas present an opportunity for community-based monitoring programs to
collect scientific data because they contain a large number of potential volunteers
(Cooper et al., 2007; Devictor et al., 2010; Dickinson et al., 2010). A considerable
amount of data can be gathered in reasonably short periods of time using volunteers to
conduct ecological surveys (Foster-Smith & Evans, 2003). As well, citizen science is
useful for the newly developed field of urban ecology and to further the outlook of
coupled systems research (Dickinson et al., 2010; Lepczyk et al., 2009; McCaffrey,
2005; Machlis et al., 1997). Within urban and suburban ecosystems, citizen science
can pair ecological monitoring data with information on human activities, including
residential habitat management, in order to recognize the effects of humans on
environmental response variables (Dickinson et al., 2010; Field et al., 2010).
Citizen science programs provide opportunities to collect data to supplement and/or
replace (due to cutbacks) government-funded environmental monitoring programs.
CBM is an economical method for the City of Kitchener to monitor their natural areas, as
this program can contribute to a long-term data set (Pollock & Whitelaw, 2005) at very
little cost to the city.
CBM may also facilitate the democratization of science by sharing information between
scientists (researchers) and non-scientists (public members) (Conrad & Hilchey, 2011).
Carr (2004) stated that it is necessary to include the community in scientific interests
and inappropriate to allow institutions to solely manage scientific activities.
Furthermore, citizen science can play an important role in environmental education, as
scientific literacy has been shown to increase when participants actively engage in
scientific activities (Conrad & Hilchey, 2011). Social capital is the value of social
linkages and societal norms, which has been shown to expand when community
members are involved in environmental projects, which can increase public support for
conservation (Schwartz, 2006). Social capital has been measured in terms of increases
in levels of trust, harmony and cooperation in communities that participate in CBM
activities (Sultana & Abeyasekera, 2008). Increases in social capital have led to an

5
increase in volunteer engagement, agency connection, leadership building, problem
solving and identification of resources (Whitelaw et al., 2003). Along with these
benefits, CBM has been documented to engage community members in local issues,
which leads to increased community development and influence on policy-makers
(Whitelaw et al., 2003; Pollock & Whitelaw, 2005; Lynam et al., 2007).
The reasons outlined above demonstrate the need to implement community-based
monitoring programs, especially in urban areas.
1.3 Research Objective
The objective of my research was to analyze the usefulness of volunteer observations in
establishing baseline conditions for each site. The effectiveness of observations was
determined by comparing participant observations to expert observations and reviewing
the volunteer data for unlikely observations. A long-term goal of this CBM program is to
analyze changes that occur in butterfly assemblages over time and provide insight into
diversity within City of Kitchener natural areas.
1.4 Study Sites
Two study sites were monitored by the expert and volunteers. The Lakeside Park study
site contains simple, homogenous habitat and Huron Natural contains complex,
heterogeneous habitats. These two natural areas were chosen because they are
located close to residential areas and have an existing volunteer base to conduct
butterfly monitoring.
Lakeside Park is a 10.1 hectare (ha) natural area that consists mainly of forest
ecosystems (City of Kitchener, 2010b), although the study area for this program
consisted mostly of mowed parkland. This natural area is located near residential areas
and has an active volunteer base to participate in the program. Lakeside Park consists
of 12 vegetation communities, while the study site within this natural area consists
mainly of parkland (CGL-2), as well as forest, marsh and plantation (NRSI, 2010). See
Table 1 for a full list of vegetation communities within and bordering the study site. See

6
Figure 1 for a map of Lakeside Park, including the delineation of all 12 vegetation
communities.
Table 1. Lakeside Park Vegetation Communities Within and Bordering the Study
Site
ELC Code1 Vegetation Community Distance to Study Site
CGL_2 Parkland Within SAF_1-1 Water lily-bullhead lily floating leaved shallow aquatic Bordering FODM4 Dry-fresh upland deciduous forest Within TAGM2 Coarse mineral mixed plantation Within MAMM1 Graminoid mineral meadow marsh Within MAMM1-3 Reed canary grass graminoid mineral meadow marsh Within SWTM3 Willow mineral deciduous thicket swamp Bordering 1Data collected by Natural Resources Solutions Inc. (NRSI, 2010)
Huron Natural Area is the City of Kitchener’s largest natural area, which consists of 107
ha of land (City of Kitchener, 2010a). This land contains Strasburg Creek, Provincially
Significant Wetlands, forests, meadows and significant species (City of Kitchener,
2010a). Based on the southern Ontario Ecological Land Classification (ELC) system
(Lee, 2008), there are 63 different vegetation communities within the boundaries of
Huron Natural Area, including forests, marshes, meadows, aquatic areas, swamps,
thickets and woodlands, as well as green/parkland, sewage and water treatment and
stormwater management areas (NRSI 2011). The study site within the Huron Natural
Area consisted of heterogeneous dry-fresh forb meadow that is bordered by 13 different
vegetation communities, including a plantation, forests, marshes and thickets (see
Table 2). See Figure 2 for a map of the study site, including the delineation of all 63
vegetation communities.
Table 2. Huron Natural Area Vegetation Communities Within and Bordering the Study Site
ELC Code1 Vegetation Community Distance to Study Site
FOCM3-1 Fresh-moist hemlock coniferous forest Bordering
FOCM6-2 Dry-fresh red pine naturalized coniferous plantation
Bordering
FODM3-1 Dry-fresh poplar deciduous forest Bordering
FODM4-8 Dry-fresh black cherry deciduous forest Bordering
FODM5-1 Dry-fresh sugar maple deciduous forest Bordering
FODM5-7 Dry-fresh sugar maple-black cherry Bordering

7
ELC Code1 Vegetation Community Distance to Study Site
deciduous forest
MAMM2-4 Mixed forb mineral meadow marsh Bordering
MASM2-1 Forb mineral shallow marsh Bordering
MEFM1 Dry-fresh forb meadow Within
THDM2-1 Sumac deciduous shrub thicket Bordering
SWCO1-2 White cedar conifer organic coniferous swamp
Bordering
WOCM1-3 Dry-fresh white pine coniferous forest Bordering
WODM5-3 Fresh-moist Manitoba maple deciduous woodland
Bordering
WOMM3 Dry-fresh mixed woodland Bordering 1Data collected by Natural Resource Solutions Inc. (NRSI 2011)

LAKESIDE DR
STIR
LING
AVE
S
MAUSSER AVE
LORNE AVE
HEIMAN ST
PERTH RD
HOMER WATSON BLVD
ASPEN AVE
SOUTH DR
GATEWOOD RD
FOREST HILL DR
BELMONT AVE E
PLEASANT AVE
HUGO CRES
BLUERIDGE AVE
MEADOW CRES
BROADLEAF PL
HIGHLAND RD E
GOTTSCHEER CRT
ST CLAIR AVE
CORAL CRES
VISTA CRES
BURNSIDE AVE
GREENBROOK DR
GLEN
RD
LORNE CRES
FODM7-4
SAF_1-1
SVDM3
FODM4
TAGM2
TAGM2MAM01-3
FODM7-2
CGL_2
TAGM2
MAMM2-1
MAMM1-3
MAMM1-3
SW TM3
SW TM3
MAMM1-3
540100
540100
540200
540200
540300
540300
540400
540400
540500
540500
540600
540600
540700
540700
540800
540800
540900
540900
541000
541000
541100
541100
541200
541200
4808
600
4808
600
4808
700
4808
700
4808
800
4808
800
4808
900
4808
900
4809
000
4809
000
4809
100
4809
100
4809
200
4809
200
4809
300
4809
300
N RSI_0958_Kitc henerELC_Lakesid eP ark_ELC_2010_07_27_GCS
Lakeside ParkDec em b er 4, 2013
P rojec t N o: N RSI-0958N AD 83 UTM Z one 17Sc ale: 1:3000 (11x17")
Vegetation Communities
Map Produced by Natural Resource Solutions Inc.This m ap is p rop rietary and c onfid ential and m ust not b e d up lic atedor d istrib uted b y any m eans without the exp ress written p erm issionof N atural Resource Solutions Inc .P rod uc ed using inform ation (inc lud ing airp hotos from 2006) und er lic ense with the Grand River Conservation Authority, cop yright theGrand River Conservation Authority.
LegendEc ologic al Land Classific ation
(CGL_2) P arkland
(FODM4) Dry – Fresh Up land Dec id uous Forest Ec osite
(FODM7-2) Fresh – Moist Green Ash - Hard wood Lowland Dec id uous Forest Typ e
(FODM7-4) Fresh – Moist Blac k W alnut Lowland Dec id uous Forest Typ e
(MAM01-3) Reed -c anary Grass Gram inoid Organic Mead ow Marsh Typ e
(MAMM1) Gram inoid Mineral Mead ow Marsh Ec osite
(MAMM1-3) Reed -c anary Grass Gram inoid Mineral Mead ow Marsh Typ e
(MAMM2-1) Jewelweed Forb Mineral Mead ow Marsh Typ e
(SAF_1_1) W ater Lily – Bullhead Lily Floating-leaved Shallow Aquatic Typ e
(SVDM3) Dry - Fresh Dec id uous Savanna Ec osite
(SW TM3) W illow Mineral Dec id uous Thic ket Swam p Ec osite
(TAGM2) Coarse Mineral Mixed P lantation Typ e

FODM5-2
MEFM1
MASM2-1
FOCM6
SWCO1-2
FOCM6-2
FOCM6-2OAO
SWDO2-3
FODM4-8
MEMM3
MEGM3MAMM3-1
FOCM3-1
FOCM6-1
SWMO2-2
FODM7
WOMM3
MEMM3
FOMM2-2
FOMM6-1
FOCM6-1
WOMM3
FODM5-2
SAF_1-3
FODM6-5
FODM7-4
FOCM6
MASM1-1
MEMF1-1
FODM3-1
FODM6-5
FOMM6-2
MEGM3
FODM3-1FODM5-7
FOCM6
WODM5-3
FODM1-1
FOCM4-1
FODM3-1
FODM5-1
FOMM3-2
FODM5-1
MEFM1
SWMO3-1
SWM01-1
FOCM3-1
CVI_3
FODM3-1
FODM3-1
FODM7-3
FODM3-1
FOMM7-2
MEMF1
FODM5-3
FODM5-7
FOCM4-1
OAO
FODM5-1
CGL_2FOMM7-2
WOCM1-3
THDM2-1
MEGM3-5
MEFM1
FODM5-1
FOMM7-2
MASO1-1
SWCM1-1
FODM4-8
WOCM1-3
FODM4-8
OAO
MEFM1-1
OAO
MEMM3
CGL
MAMM2-4
FODM3-1
SAF_1-3
MAMM1-14
MAS
SAF_1-3
SAF1-3
WODM4-2
MAMM2
MASO1MASO1
CGL_2
MEFM1-1
MAMO2-1
THD
MASM1-1MEFM1-1
MAMM2-4 MAMM2-4
CGL_2CGL_2
TRILLIUM DR
PARKVALE DR
MCBRINE DR
MCINTYRE DRBLEAMS RD
WASHBURN DR
FISCHER HALLMAN RD
HURON RD
WOODBINE AVE
MCBRINE PL
SORRENTO ST
STRASBURG RD
BIANCA CRT
BRITTANIA CRES
POMP
EII S
T
WOODBINE AVE
541000
541000
541500
541500
542000
542000
542500
542500
4804
500
4804
500
4805
000
4805
000
4805
500
4805
500
0 100 200 30050m
NRSI_ 1190_ Kitc hen erELC_ Huron Na tura lArea V egCom m un ities_ 6K_ 2011_ 09_ 14_ SW M
Huron Natural AreaDec em b er 4, 2013
Projec t No: NRSI-1190NAD 83 UTM Zon e 17Sc a le: 1:6 500 (11x17")
Vegetation Communities
Legen dHuron Na tura l Area Boun da ryEc ologic a l La n d Cla ssific a tion
(CGL) Green la n ds(CGL_ 2) Pa rkla n d/ Green la n ds(CV I_ 3) Sewa ge a n d W a ter Trea tm en t(FO CM 3-1) Fresh- M oist Hem loc k Con iferous Forest type(FO CM 4-1) Fresh - M oist W hite Ceda r Con iferous Forest Type(FO CM 6) Na tura lized Con iferous Pla n ta tion(FO CM 6-1) Dry- Fresh W hite Pin e Na tura liza ted Con iferous Pla n a ta tion(FO CM 6-2) Dry- Fresh Red Pin e Na tura lized Con iferious Pla n ta tion Type(FO DM 1-1) Dry-Fresh O a k Dec iduous Forest Type(FO DM 3-1) Dry- Fresh Popla r Dec iduous Forest Type(FO DM 4-8) Dry- Fresh Bla c k Cherry Dec iduous Forest Type(FO DM 5-1) Dry-Fresh Suga r M a ple Dec iduous Forest Type(FO DM 5-2) Dry - Fresh Suga r M a ple - Beec h Dec iduous Forest Type(FO DM 5-3) Dry – Fresh Suga r M a ple – O a k Dec iduous Forest Type(FO DM 5-7) Dry - Fresh Suga r M a ple - Bla c k Cherry Dec iduous Forest Type(FO DM 6-5) Fresh - M oist Suga r M a ple - Ha rdwood Dec iduous Forest Type(FO DM 7) Fresh- M oist Lowla n d Dec iduous Forest Ec osite(FO DM 7-3) Fresh - M oist W illow Lowla n d Dec iduous Forest Type(FO DM 7-4) Fresh-M oist Bla c k W a ln ut Lowla n d Dec iduous Forest type(FO M M 2-2) Dry - Fresh W hite Pin e -Suga r M a ple M ixed Forest Type(FO M M 3-2) Dry – Fresh Suga r M a ple – Hem loc k M ixed Forest Type(FO M M 6-1) Fresh - M oist Suga r M a ple - Hem loc k M ixed Forest Type(FO M M 6-2) Fresh-M oist Hem loc k - Ha rdwood M ixed Forest type(FO M M 7-2) Fresh - M oist W hite Ceda r Ha rdwood M ixed Forest Type(M AM M 1-14) Ric e Cut Cra ss Gra m in oid M in era l M ea dow M a rsh(M AM M 2) Forb M in era l M ea dow M a rsh Ec osite(M AM M 2-4) M ixed Forb M in era l M ea dow M a rsh Type(M AM M 3-1) M ixed M in era l Dea dow M a rsh Type(M AM O 2-1) Jewelweed Forb O rga n ic M ea dow M a rsh Type(M AS) Sha llow M a rsh(M ASM 1-1) Ca tta il M in era l Sha llow M a rsh Type(M ASM 2-1) Forb M in era l Sha llow M a rsh Type(M ASO 1) Gra m in oid M a rsh(M ASO 1-1) Ca tta il O rga n ic Sha llow M a rsh Type(M EFM 1) Dry - Fresh Forb M ea dow Ec osite(M EFM 1-1) Golden rod Ford M ea dow(M EGM 3) Dry - Fresh Gra m in oid M ea dow Ec osite(M EGM 3-5) Sm ooth Brom e Gra m in oid M ea dow Type(M EM F1) O pen Aqua tic(M EM F1-1) Golden rod Forb M ea dow Type(M EM M 3) Dry - Fresh M ixed M ea dow Ec osite(O AO ) O pen Aqua tic(SAF1-3) Duc kweed Floa tin g Lea ved Sha llow Aqua tic Type(SW CM 1-1) W hite Ceda r M in era l Con iferous Swa m p Type(SW CO 1-1) W hite Ceda r O rga n ic Con iferous Swa m p Type(SW CO 1-2) W hite Ceda r - Con ifer O rga n ic Con iferous Swa m p Type(SW DM 2-3) Silver M a ple M in era l Dec iduous Swa m p(SW M ) Storm W a ter M a n a gem en t Pon d(SW M 01-1) W hite Ceda r - Ha rdwood O rga n ic M ixed Swa m p(SW M O 2-2) M ixed M a ple - Con ifer Swa m p(SW M O 3-1) Yellow Birc h - Con ifer M ixed Swa m p Type(THD) Dec iduous Thic ket(THDM 2-1) Sum a c Dec iuous Shrub Thic ket Type(W O CM 1-3) Dry Fresh W hite Pin e Con iferous W oodla n d Type(W O DM 4-2) W hite Ash Dec iduous W oodla n d Type(W O DM 5-3) Fersh - M oist M a n itob a M a ple Dec iduous W oodla n d Type(W O M M 3) Dry - Fresh M ixed W oodla n d Ec osite
Map Produced by Natural Resource Solutions Inc.This m a p is proprieta ry a n d c on fiden tia l a n d m ust n ot b e duplic a ted or distrib uted b y a n y m ea n s without the express written perm ission of Na tura l Resourc e Solution s In c .Produc ed usin g in form a tion (in c ludin g a irphotos from 2006) un der lic en se with the Gra n d River Con serva tion Authority, c opyright the Gra n d River Con serva tion Authority.

10
Chapter 2 Methods
2.1 Volunteer Recruitment
Community-based monitoring projects rely on a strong volunteer base in order to
provide accurate and representative scientific observations. The City of Kitchener
Natural Areas Program has approximately 60 existing volunteers that were contacted to
participate in this program, including volunteers who participated in the Huron Natural
Area Annual Butterfly Count in 2011. A group of community members who live near
Lakeside Park voiced an interest in monitoring and were contacted to monitor that
natural area.
Volunteer recruitment information was distributed to other local environmental groups,
including: Kitchener-Waterloo Field Naturalist (KWFN) Club, rare Charitable Research
Reserve and the Toronto Entomologists’ Association. I attended the KWFN public
meeting on April 23, 2012 and announced the volunteer opportunity, as well as
published a notice in the May 2012 issue of the KWFN Newsletter, the Heron.
Information regarding this monitoring program was handed out at the butterfly booth set-
up at the Earth Day event held at Huron Natural Area on April 21, 2012. This event was
attended by hundreds of people and included a wider range of community members
than those already involved in local environmental clubs and groups.
2.2 Volunteer Training
For this monitoring program, volunteers were trained during a half-day workshop that
produced 25 sets (some gathered data in pairs) of trained individuals who could collect
data on multiple days in a week with acceptable accuracy. This method was chosen
rather than one expert surveying once every two weeks for the entire monitoring period.
Before data collection could begin in either natural area, volunteers were trained to
collect monitoring observations. Training included attendance at a workshop, which
was held on May 6, 2012. The workshop included a presentation that reviewed the

11
training manual (see Appendix I) that was given to each volunteer, and explained how
to correctly fill out the data sheets.
The training manual outlines the reasons why butterflies are being monitored in the City
of Kitchener, which educates participants on the importance of the data they are
collecting. The manual details the appropriate time of year and time of day to monitor
butterflies, as well as the ideal weather conditions in which monitoring will generally
occur. The manual explains how often and how long monitoring should be conducted,
as well as how to record observations using the data form. At the end of the manual
there is a section of helpful tips and reminders to ensure consistency among volunteers,
and a thank you to volunteers for their contribution to the City of Kitchener and the
University of Waterloo. The final page of the manual contains the Beaufort Wind Scale,
which is used to determine the strength of wind to record on the data sheet during
monitoring.
All monitoring observations were recorded on a standard monitoring form (see Appendix
II). During the workshop, volunteers were shown a sample and a blank data sheet.
Each blank space was filled in to demonstrate how to properly complete a data form for
monitoring. The recording form includes the following information: date, recorder’s
name, site name, start time, end time, start temperature (ºC), end temperature (ºC), sun
(percentage of open sky) and wind speed (it should be between 0-5 on the Beaufort
Wind Scale).
Volunteers were educated about the butterfly life cycle and basic butterfly morphology in
order to ensure volunteers understood the different parts of a butterfly that contain key
identification features. The general differences between moths and butterflies were
outlined, as this is a common question regarding Lepidoptera and important for
volunteers to understand when making identifications in the field. The volunteers were
trained on identification of different butterfly species, particularly species that are
common to the area and likely to be encountered during monitoring. The presentation

12
ended with suggestions for effective net techniques and how to handle and release
butterflies.
Before going into the field, volunteers received a butterfly field guide and net to aid in
field identification. Volunteers participated in a hands-on species identification program
along the Huron Natural Area meadow trail to demonstrate how to conduct butterfly
monitoring. This included species identification, proper net handling and release
techniques, as well as proper use of the recording form and instruction on how to
accurately count the number of individual butterflies present in a given area. During this
portion of the training session volunteers caught and identified butterflies, which were
placed in jars to be viewed by the group. In total, eight species were caught and viewed
by the participants on the training day.
2.3 Butterfly Monitoring Methods
Butterfly survey methods follow a modified Pollard transect methodology (Pollard,
1977). These methods included walking an established trail at Lakeside Park or Huron
Natural Area and making counts of butterflies. These counts occurred during suitable
weather conditions from the beginning of May to the end of August. Limiting a transect
to a trail is preferred as the boundaries of the trail are normally obvious (Pollard, 1977).
The Pollard transect method is a widely used and accepted method of assessing
butterfly populations and detecting changes in butterfly assemblages over time (Pollard,
1977; Thomas, 1983; Pollard & Yates, 1993; Caldas & Robbins, 2003). The methods
are easily replicable from year to year and therefore produce reliable data that can be
compared over time (Pollard, 1977; Swengel, 1998; Simonson et al., 2001; Croxton et
al., 2005).
Volunteers monitored the meadow trail at Huron Natural Area or the community trail at
Lakeside Park a minimum of once every two weeks from May to August in 2012. The
trails are relatively short, as the meadow trail at Huron Natural Area is 0.6 kilometres
(km) and the community trail at Lakeside Park is 1.0 km. Each trail takes less than one
hour to walk and consists of relatively easy terrain. Each volunteer chose to monitor on

13
the first and third weeks of the month, or the second and fourth weeks. Volunteers were
asked to pick a day of the week when they would conduct monitoring and it was
recommended to consistently monitor on that day whenever possible. If the volunteer
was not available or the weather conditions were inadequate on that day, it was
recommended to monitor as close to that day as possible.
The first week of observations began on Sunday May 6, 2012, following the training
workshop. The last week of monitoring was the week of August 19, with the week of
August 26 being an optional week of monitoring. See Table 3 for a breakdown of these
weeks (denoted from Sunday to Saturday).
Table 3. Weeks Monitored by Volunteers in 2012
1st and 3rd Weeks 2nd and 4th Weeks
May 6-12/May 20-26 May 13-19/May 27-June 2
June 3-9/June 17-23 June 10-16/June 24-30
July 1-7/July 15-21 July 8-14/July 22-28
July 29-August 4/August 12-18 August 5-11/August 19-25
Participants were instructed to walk at an even pace and observe butterflies along the
way, while stops were allowed to identify or catch butterflies as they walked the trail
(Pollard, 1977). There was no minimum or maximum time allotted for monitoring the
trail. Volunteers were asked to conduct monitoring on warm (at least 20º C) and fairly
sunny days, with low wind speeds (Pollard, 1977). The Beaufort Wind Scale (see
Appendix III) was utilized for this monitoring program as a method for volunteers to
assess wind conditions. This wind scale ranks wind speeds from 0-12, ranging from
calm to hurricane, and are assessed based on specifications for use on land, such as
observing the movement of tree branches.
Volunteers also received guidance on the best time of day to monitor butterflies, which
is generally between 10 am and 4 pm, during the appropriate weather conditions. The
daily timing window can be extended, either earlier or later in the day, if the temperature
is above 25º C. Since not all volunteers may be available on days with optimal weather
conditions or during the ideal timing window, volunteers were instructed to monitor

14
during the best conditions when they were available. As well, because the monitoring
season is during the summer months when people often take vacations, the participants
were advised to monitor every two weeks when possible and if they were away or
unavailable for a period longer than two-weeks, they should monitor before they leave
and as soon as they can when they return. If a volunteer was only available on one day
within their two-week session, and that day had poor weather conditions, they were
asked to monitor on that day instead of skipping that monitoring session.
The volunteer monitoring data from Huron Natural Area was compared to data collected
for the City of Kitchener by an environmental consulting company, Natural Resource
Solutions Inc. (NRSI). On each visit, two NRSI biologists conducted systematic area
searches of the meadow habitat for at least 1.5 hours while actively searching for
butterflies at the Huron Natural Area (NRSI, 2012). Surveys were conducted on May
27, July 16, and August 20 in 2010; on May 20, June 17, and July 9 in 2011; and on
May 31 and June 20 in 2012. The 2011 and 2012 data also includes the observations
made during the annual butterfly count in each of those years. In 2011, the count took
place on July 9 and in 2012, the count was on July 7. All surveys were completed in
suitable weather conditions, including days with more than 50% sun versus cloud cover,
low wind, and with air temperatures over 20o C (NRSI, 2012).
2.4 Quality Control Measures
Studies show that errors are made by recorders whether they are volunteers or
experienced scientists, and have recommended that all ecological studies include
quality control, regardless of the experience level of the recorder (Foster-Smith &
Evans, 2003).
The first quality control measure implemented for this program was to have volunteers
only monitor one site, as it has been shown that it is effective for trained volunteers to
monitor a small number of sites to assess changes over time (Matterson et al., 2012).
Along with volunteer observations, I monitored the trail at each natural area once every
two weeks in order to provide a comparison for the data collected by volunteers. These

15
observations were compared to those collected by citizen scientists in order to
determine the validity and value of monitoring observations collected by volunteers.
As well, each observation that was submitted was reviewed to verify the collected data.
This review compared observations to The Butterflies of Waterloo Region (Linton,
2012), which classifies butterflies as very common, common, uncommon, rare, possibly
extirpated or unknown. Any observation that contained a species listed as uncommon,
rare, possibly extirpated or unknown received a secondary review. The secondary
review included a review of the number of occurrences in The Butterflies of Waterloo
Region (Linton, 2012), as well as a habitat assessment of the area where the butterfly
was observed, in order to determine the likelihood of the observation. As well, the
species range, as per The Ontario Butterfly Atlas (Jones et al., 2012), was consulted to
determine if the species occurrence is likely within the City of Kitchener. This review
followed methods similar to other CBM projects, such as the Ontario Field
Ornithologists’ Ontario Bird Records Committee (Ontario Birds, 2010), and eButterfly
(eButterfly, 2013).
Observations that were accompanied by written reports, photographs, prints, field notes
or sketches were reviewed (Ontario Birds, 2010), whereas records with little to no
documentation did not pass the secondary review, and therefore were not included in
the final data set. The review also took into account the number of years of experience
the observer had in butterfly identification. Those who were proficient in butterfly
identification might observe an uncommon, rare, possibly extirpated or unknown
butterfly species without further documentation, provided that the observer is certain of
accurate species identification. Observations made by participants who were
inexperienced or unsure of their butterfly identification needed to provide proper
documentation of the species, including one or more of the records mentioned above in
order to continue with the secondary review and have the potential to be included in the
final data set.

16
These quality control measures were necessary to ensure accurate data was collected
throughout the program, which can often be an issue in community-based monitoring
programs.
2.5 Data Analysis
Data from each site were analyzed separately as the level of effort at each natural area
differed. Furthermore, there was data available for butterfly surveys completed at the
Huron Natural Area in 2010, 2011 and 2012, which were compared to the data collected
by the community-based monitoring program. There was no comparative data for the
Lakeside Park site and therefore there was less statistical analysis of this area.
Data analysis for each site included calculating species richness, which was calculated
as the number of species observed at each site (Blair & Launer, 1997; Neill et al.,
2007). Statistical analysis for both CBM data sets, and the 2010-2012 Huron Natural
Area data, included analyzing species diversity and evenness. This was done using the
Shannon-Wiener Diversity Index (H) that combined the number of species within a site
in relation to the relative abundance of each species (Shannon & Weaver, 1949;
Magurran, 1988; Blair & Launer, 1997), and the Simpson Index (D), as well as the
Simpson Reciprocal (1/D) value. The Simpson Index demonstrates the contribution of
each species by giving the probability that it will be chosen in a random sample of two
individuals from the population (Smith & Grassle, 1977). The Simpson Reciprocal value
calculates the number of uniformly common groups that make up the Simpson Index
(Steele et al., 2005). The Shannon Diversity Index and Simpson Index were chosen
because they are the two most widely used (Schulte & Buongiorno, 1998; Marurran,
1988).
A two-tailed t-test was conducted to compare the H values of the community-based
monitoring data and the 2010-2012 data collected at the Huron Natural Area. As well,
this test was used to measure the impact of the quality control conducted by the expert
throughout the monitoring period. The complete observations from each natural area
(including the expert observations) were compared to those of just the volunteers

17
(excluding the expert), in order to determine the impact of the expert observations on
the overall data set.
18
Chapter 3 Results
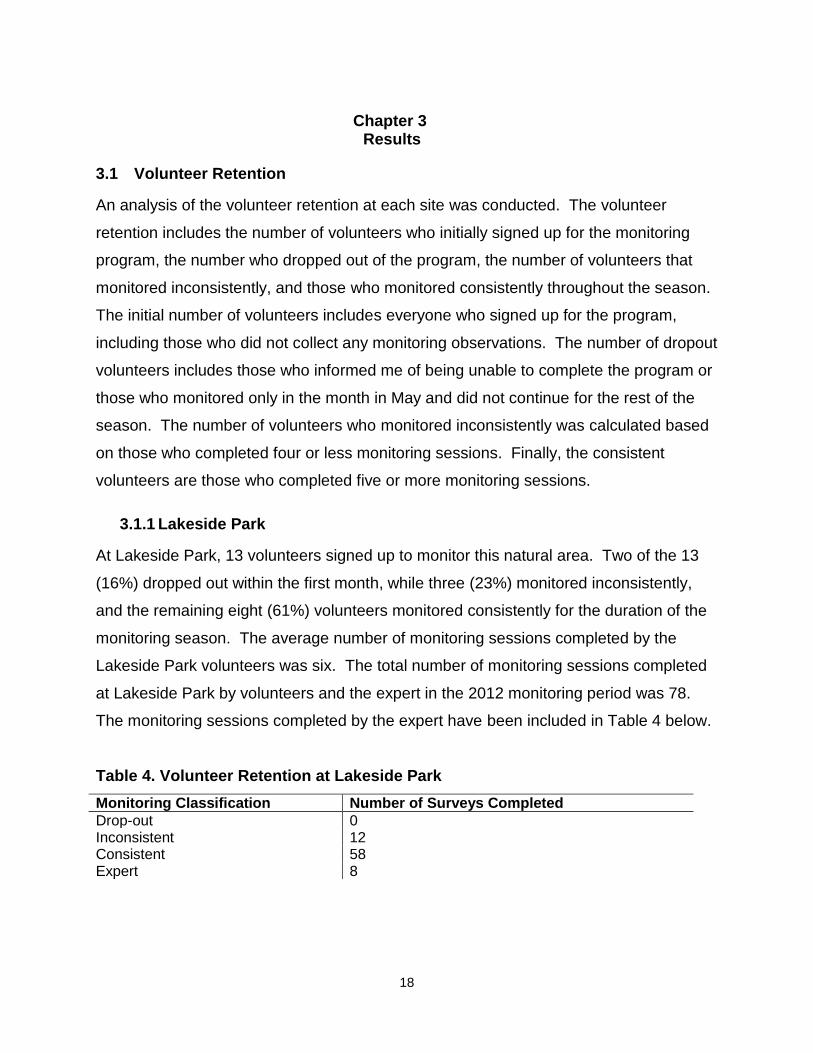
3.1 Volunteer Retention
An analysis of the volunteer retention at each site was conducted. The volunteer
retention includes the number of volunteers who initially signed up for the monitoring
program, the number who dropped out of the program, the number of volunteers that
monitored inconsistently, and those who monitored consistently throughout the season.
The initial number of volunteers includes everyone who signed up for the program,
including those who did not collect any monitoring observations. The number of dropout
volunteers includes those who informed me of being unable to complete the program or
those who monitored only in the month in May and did not continue for the rest of the
season. The number of volunteers who monitored inconsistently was calculated based
on those who completed four or less monitoring sessions. Finally, the consistent
volunteers are those who completed five or more monitoring sessions.
3.1.1 Lakeside Park
At Lakeside Park, 13 volunteers signed up to monitor this natural area. Two of the 13
(16%) dropped out within the first month, while three (23%) monitored inconsistently,
and the remaining eight (61%) volunteers monitored consistently for the duration of the
monitoring season. The average number of monitoring sessions completed by the
Lakeside Park volunteers was six. The total number of monitoring sessions completed
at Lakeside Park by volunteers and the expert in the 2012 monitoring period was 78.
The monitoring sessions completed by the expert have been included in Table 4 below.
Table 4. Volunteer Retention at Lakeside Park
Monitoring Classification Number of Surveys Completed
Drop-out 0 Inconsistent 12 Consistent 58 Expert 8

19
3.1.2 Huron Natural Area
At the Huron Natural Area, 12 volunteers initially signed up to monitor the natural area.
Five of the 12 (42%) dropped out within the first month and gave no notification of
leaving the program. One volunteer monitored inconsistently (8%) and the remaining
six (50%) volunteers monitored consistently for the duration of the monitoring season.
The average number of monitoring sessions completed by the Huron Natural Area
volunteers was four. The total number of monitoring sessions completed at this natural
area by all volunteers over the 2012 monitoring period was 43. The monitoring
sessions completed by the expert have not been included in Table 5 below as the
expert data was excluded from the final analysis of the Huron Natural Area site.
Table 5. Volunteer Retention at Huron Natural Area
Monitoring Classification Number of Surveys Completed
Drop-out 3
Inconsistent 2 Consistent 38
3.2 Testing the Validity of Data
Quality control measures for this monitoring program included a review process for each
observation that was submitted, as well as comparison to expert observations to
determine the validity of observations and if there was a significant difference between
the expert and volunteer observations.
3.2.1 High Validity of Lakeside Park Data
In total, there were 38 unconfirmed butterfly species identified at Lakeside Park,
including several categories of individuals that could not be identified to the species
level. Of these observations, 29 species were confirmed through the review process.
The total number of individual butterflies observed at Lakeside Park by the expert and
volunteers was 1,282 and of these observations, 1,193 passed the review process,
which resulted in 93% of submitted observations passing the review process.
Species that did not pass the review process include those that could not be identified
to the species level, including the categories: unknown, Duskywing sp. (Erynnis sp.) and

20
Skipper spp. The list of species that follows did not pass the review process as it was
submitted without any further documentation and could not be confirmed based on the
rarity of their occurrence in the Region of Waterloo.
An excluded species was the Common Roadside Skipper (Amblyscirtes vialis), which
has only been observed twice in the Region of Waterloo, and not since 1967, so this
species was excluded from the Regional Status Assignment (Linton, 2012). Another
butterfly that did not pass the review process was the Juvenal's Duskywing (Erynnis
juvenalis), which is designated as rare and has not been observed in the Region of
Waterloo since the 1960s, until 2010 (Linton, 2012). A third species that was not
included in the analysis was the Common Sootywing (Pholisora catullus), which is
locally common in southern Ontario and listed as provincially imperiled (S3) and rare in
the Region of Waterloo (Linton, 2012). This species has been historically documented
in Kitchener occasionally, but in recent years has only been observed in Cambridge
(Linton, 2012) and thus was not included in the final list of species. The Northern
Cloudywing (Thorybes pylades) species was excluded from the final results of this study
as this species is listed as rare in the Region of Waterloo and has only been
documented in the Region four times (Linton, 2012).
Another species that was not included in the analysis was the Harvester (Feniseca
tarquinius), which is ranked as rare within the Region of Waterloo, as it has been
recorded only eight times in the Region and not since 1990 at a site in Cambridge
(Linton, 2012). Lastly, the Banded Hairstreak (Satyrium calanus) is listed as uncommon
in the Region of Waterloo and has not been included in the confirmed list of butterflies
as individuals of the Satyrium genus can be easily confused with each other. The six
species listed above, plus the three categories of individuals that were not identified to
the species level, have not passed the review stage and are not included in the final
data analysis for Lakeside Park. These species have not passed the review process
because of the rarity of occurrences documented in the Region or length of time since
the last observation, which indicates the unlikelihood of the species occurring at
Lakeside Park.
21
Generally, the data collected by volunteers at Lakeside Park was valid, as indicated by
the high number of observations that passed the review process.
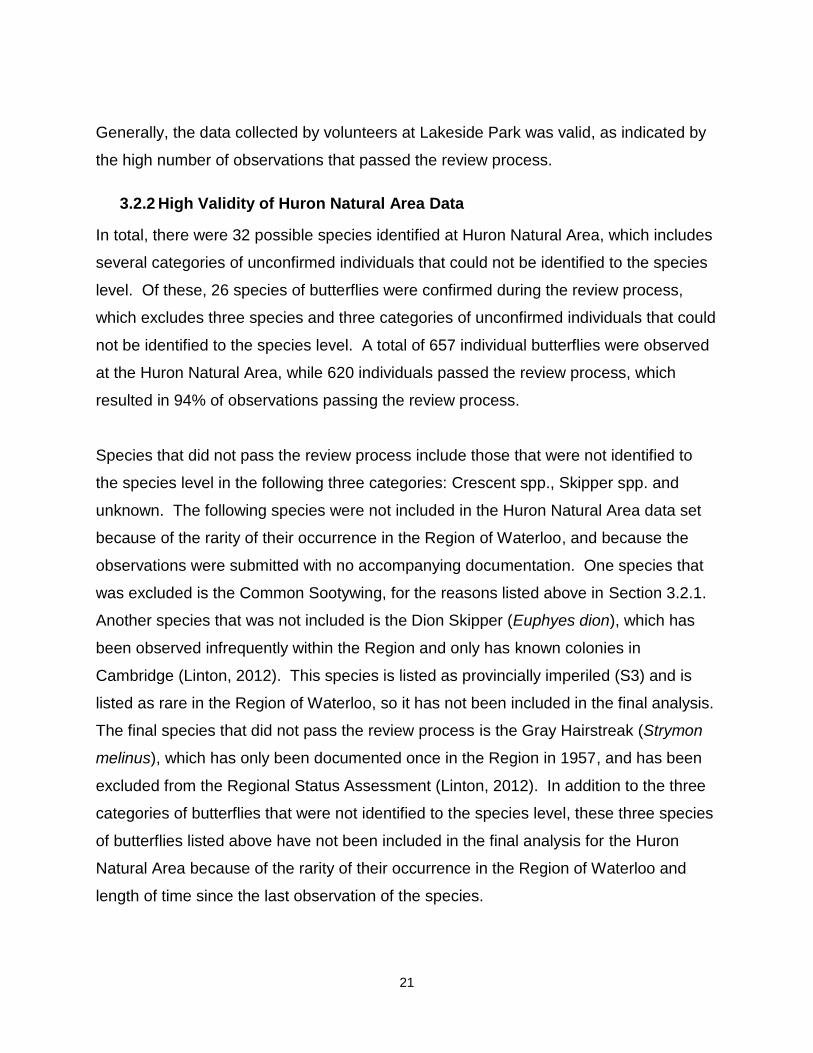
3.2.2 High Validity of Huron Natural Area Data
In total, there were 32 possible species identified at Huron Natural Area, which includes
several categories of unconfirmed individuals that could not be identified to the species
level. Of these, 26 species of butterflies were confirmed during the review process,
which excludes three species and three categories of unconfirmed individuals that could
not be identified to the species level. A total of 657 individual butterflies were observed
at the Huron Natural Area, while 620 individuals passed the review process, which
resulted in 94% of observations passing the review process.
Species that did not pass the review process include those that were not identified to
the species level in the following three categories: Crescent spp., Skipper spp. and
unknown. The following species were not included in the Huron Natural Area data set
because of the rarity of their occurrence in the Region of Waterloo, and because the
observations were submitted with no accompanying documentation. One species that
was excluded is the Common Sootywing, for the reasons listed above in Section 3.2.1.
Another species that was not included is the Dion Skipper (Euphyes dion), which has
been observed infrequently within the Region and only has known colonies in
Cambridge (Linton, 2012). This species is listed as provincially imperiled (S3) and is
listed as rare in the Region of Waterloo, so it has not been included in the final analysis.
The final species that did not pass the review process is the Gray Hairstreak (Strymon
melinus), which has only been documented once in the Region in 1957, and has been
excluded from the Regional Status Assessment (Linton, 2012). In addition to the three
categories of butterflies that were not identified to the species level, these three species
of butterflies listed above have not been included in the final analysis for the Huron
Natural Area because of the rarity of their occurrence in the Region of Waterloo and
length of time since the last observation of the species.

22
Overall, the data collected by volunteers at Huron Natural Area was valid, based on 620
of a possible 657 records that passed the review process.
3.3 Butterfly Monitoring Results
As there was a difference in the monitoring effort at each natural area, direct
comparisons of the data sets from Lakeside Park and the Huron Natural Area have not
been made. Lakeside Park had 14 observers (including the expert), nine of which
monitored consistently throughout the season, while Huron Natural Area had 12
observers, of which six were considered to have monitored consistently during the
monitoring season. Lakeside Park had 78 visits between May and August, while the
Huron Natural Area had 43.
3.3.1 Lakeside Park
Overall, there were 1,282 individual butterflies observed at Lakeside Park during the
2012 community-based monitoring program. This includes confirmed observations of
29 species and 1,193 individual butterflies, while nine species or categories of
unknowns that could not be identified to the species level have been excluded from the
final species numbers. See Table 6 for a complete list of butterflies observed; note that
those followed by an asterisk (*) have not been included in the final number of species
or any subsequent analysis. See Table 7 for the final list of butterflies confirmed at
Lakeside Park.
A two-tailed t-test found there was no significant difference (p-value 0.94) between the
observations collected by volunteers and the expert. Therefore, the expert observations
have been included in the analysis for Lakeside Park in order to present a valid season
of baseline data.
Table 6. Lakeside Park Complete List of Butterflies Observed in 2012. Note: this
table includes observations that did not pass the review process and have been excluded in the Final List of Butterflies. Those that are excluded have been marked with an *.
Scientific Name Common Name SRANK1 Waterloo Regional Status2
Total # of Individuals Observed
Unknown* - - 58
Hesperiidae

23
Scientific Name Common Name SRANK1 Waterloo Regional Status2
Total # of Individuals Observed
Amblyscirtes vialis* Common Roadside Skipper S4 Not included 1
Ancyloxypha numitor
Least Skipper S5 Uncommon 17
Erynnis juvenalis* Juvenal's Duskywing S5 Rare 1
Erynnis sp.* Duskywing sp. - 1
Euphyes vestris Dun Skipper S5 Very Common 1
Hylephila phyleus Fiery Skipper SNA Rare 8
Pholisora Catullus* Common Sootywing S3 Rare 1
Poanes hobomok Hobomok Skipper S5 Common 1
Polites peckius Peck's Skipper S5 Very Common 7
Thorybes pylades* Northern Cloudywing S5 Rare 6
Thymelicus lineola European Skipper SNA Very Common 4
Wallengrenia egeremet
Northern Broken-dash S5 Common 2
Skipper spp.* - - 19
Papilionidae
Papilio cresphontes Giant Swallowtail S3 Uncommon 1
Papilio glaucus Eastern Tiger Swallowtail S5 Very Common 8
Papilio polyxenes Black Swallowtail S5 Very Common 2
Pieridae
Colias eurytheme Orange Sulphur S5 Very Common 20
Colias philodice Clouded Sulphur S5 Very Common 128
Pieris rapae Cabbage White SNA Very Common 848
Lycaenidae
Celastrina neglecta Summer Azure S5 Very Common 6
Cupido comyntas Eastern Tailed Blue S5 Uncommon 1
Feniseca tarquinius* Harvester S4 Rare 1
Lycaena hyllus Bronze Copper S5 Very Common 2
Satyrium calanus* Banded Hairstreak S4 Uncommon 1
Nymphalidae
Coenonympha tullia Common Ringlet S5 Common 11
Danaus plexippus Monarch S2N, S4B
Very Common 19
Limenitis archippus Viceroy S5 Very Common 3
Limenitis arthemis astyanax
Red-spotted Purple S5 Common 1
Megisto cymela Little Wood-satyr S5 Very Common 11
Nymphalis antiopa Mourning Cloak S5 Very Common 5
Phyciodes cocyta Northern Crescent S5 Uncommon 1
Phyciodes tharos Pearl Crescent S4 Common 5
Polygonia comma Eastern Comma S5 Very Common 1
Polygonia interrogationis
Question Mark S5 Very Common 14
Speyeria cybele Great Spangled Fritillary S5 Very Common 3
Vanessa atalanta Red Admiral S5 Very Common 57

24
Scientific Name Common Name SRANK1 Waterloo Regional Status2
Total # of Individuals Observed
Vanessa cardui Painted Lady S5 Common 6
TOTAL - - - 1282
1 OMNR, 2012
S5 Very Common S4 Common S4B Common (Breeding Habitat) S3 Vulnerable S2N Imperiled (Non-breeding Habitat) SNA Not Applicable 2Linton, 2012
Table 7. Lakeside Park Final List of Butterflies Observed in 2012. Note: this table
only includes observations that passed the review process.
Scientific Name Common Name SRANK1 Waterloo Regional Status2
Total # of Individuals Observed
Hesperiidae
Ancyloxypha numitor Least Skipper S5 Uncommon 17
Euphyes vestris Dun Skipper S5 Very Common 1
Hylephila phyleus Fiery Skipper SNA Rare 8
Poanes hobomok Hobomok Skipper S5 Common 1
Polites peckius Peck's Skipper S5 Very Common 7
Thymelicus lineola European Skipper SNA Very Common 4
Wallengrenia egeremet Northern Broken-dash S5 Common 2
Papilionidae
Papilio cresphontes Giant Swallowtail S3 Uncommon 1
Papilio glaucus Eastern Tiger Swallowtail
S5 Very Common 8
Papilio polyxenes Black Swallowtail S5 Very Common 2
Pieridae
Colias eurytheme Orange Sulphur S5 Very Common 20
Colias philodice Clouded Sulphur S5 Very Common 128
Pieris rapae Cabbage White SNA Very Common 848
Lycaenidae
Celastrina neglecta Summer Azure S5 Very Common 6
Cupido comyntas Eastern Tailed Blue S5 Uncommon 1
Lycaena hyllus Bronze Copper S5 Very Common 2
Nymphalidae
Coenonympha tullia Common Ringlet S5 Common 11
Danaus plexippus Monarch S2N, S4B
Very Common 19
Limenitis archippus Viceroy S5 Very Common 3
Limenitis arthemis astyanax
Red-spotted Purple S5 Common 1
Megisto cymela Little Wood-satyr S5 Very Common 11

25
Scientific Name Common Name SRANK1 Waterloo Regional Status2
Total # of Individuals Observed
Nymphalis antiopa Mourning Cloak S5 Very Common 5
Phyciodes cocyta Northern Crescent S5 Uncommon 1
Phyciodes tharos Pearl Crescent S4 Common 5
Polygonia comma Eastern Comma S5 Very Common 1
Polygonia interrogationis Question Mark S5 Very Common 14
Speyeria cybele Great Spangled Fritillary
S5 Very Common 3
Vanessa atalanta Red Admiral S5 Very Common 57
Vanessa cardui Painted Lady S5 Common 6
TOTAL - - - 1193
1 OMNR, 2012
S5 Very Common
S4 Common S4B Common (Breeding Habitat) S3 Vulnerable S2N Imperiled (Non-breeding Habitat) SNA Not Applicable 2Linton, 2012
The data analysis results for Lakeside Park can be found below in Table 8. The species
richness for Lakeside Park was 29, while the Shannon-Wiener Diversity Index (H) was
1.28, with an evenness value (E) of 0.38 and a variance of 0.0022. The Simpson
Diversity Index (D) was 0.52, while the Simpson Reciprocal Index (1/D) was 1.92.
These numbers were generated based on the data found in Table 7, which only
includes observations that passed the review process.
Table 8. Lakeside Park Data Results
Shannon-Wiener Value Simpson Diversity Value
H 1.28 D 0.52 E 0.38 1/D 1.92 Variance .0022
3.3.2 Huron Natural Area
In total, there were 29 species and 657 individual butterflies observed at the Huron
Natural Area by the volunteers during the monitoring program in the 2012 season. The
total number of confirmed species of butterflies was 26, which was comprised of 620
individuals. The confirmed butterfly list excludes three species that could not be

26
confirmed and does not include three categories of butterflies that could not be
identified to the species level. See Table 9 for a complete list of butterflies observed at
this natural area; note that those with an asterisk (*) have been excluded from the final
list of species and have not been incorporated in any succeeding data analysis. Table
10 contains all volunteer butterfly observations that passed the review process.
A two-tailed t-test found there was a significant difference (p-value 0.02) between the
confirmed observations collected by volunteers and the expert. Therefore, the expert
observations have not been included in Table 9, Table 11 or in the data analysis for
Huron Natural Area. A comparison of volunteer and expert observations can be found
below in Section 3.3.2.1.
Table 9. Huron Natural Area Complete List of Butterflies Observed in 2012. Note:
this table includes observations that did not pass the review process and have been excluded in the Final List of Butterflies. Those that are excluded have been marked with an *.
Scientific Name Butterfly Species Common Name
SRANK1 Waterloo Regional Status2
Total Individuals Observed
Unknown* - - 17
Hesperiidae Euphyes dion* Dion Skipper S3 Rare 1
Pholisora catullus* Common Sooty wing S3 Rare 1
Poanes hobomok Hobomok Skipper S5 Common 2
Thymelicus lineola European Skipper SNA Very Common 3
- Skipper spp.* - - 3
Papilionidae
Papilio glaucus Eastern Tiger Swallowtail S5 Very Common 9
Papilio polyxenes Black Swallowtail S5 Very Common 4
Pieridae
Colias eurytheme Orange Sulphur S5 Very Common 37
Colias philodice Clouded Sulphur S5 Very Common 109
Pieris rapae Cabbage White SNA Very Common 189
Lycaenidae
Celastrina ladon Spring Azure S5 Common 3
Celastrina neglecta Summer Azure S5 Very Common 3
Cupido comyntas Eastern Tailed Blue S5 Uncommon 4
Strymon melinus* Gray Hairstreak S4 N/A 9
Nymphalidae Cercyonis pegala Common Wood-nymph S5 Very Common 24
Coenonympha tullia Common Ringlet S5 Common 80
Danaus plexippus Monarch S2N, S4B Very Common 25
Enodia anthedon Northern Pearly-eye S5 Common 1

27
Scientific Name Butterfly Species Common Name
SRANK1 Waterloo Regional Status2
Total Individuals Observed
Junonia coenia Common Buckeye SNA Uncommon 3
Limenitis archippus Viceroy S5 Very Common 6
Limenitis arthemis arthemis
White Admiral S5 Uncommon 1
Nymphalis antiopa Mourning Cloak S5 Very Common 4
Phyciodes spp.* Crescent spp. 6
Phyciodes cocyta Northern Crescent S5 Uncommon 12
Phyciodes tharos Pearl Crescent S4 Common 2
Polygonia comma Eastern Comma S5 Very Common 1
Polygonia interrogationis Question Mark S5 Very Common 17
Speyeria cybele Great Spangled Fritillary S5 Very Common 1
Vanessa atalanta Red Admiral S5 Very Common 59
Vanessa cardui Painted Lady S5 Common 16
Vanessa virginiensis American Lady S5 Common 5
TOTAL - - - 657
1 OMNR, 2012
S5 Very Common S4 Common S4B Common (Breeding Habitat) S3 Vulnerable S2N Imperiled (Non-breeding Habitat) SNA Not Applicable 2Linton, 2012
Table 10. Huron Natural Area Final List of Butterflies Observed in 2012. Note: this
table only includes observations that passed the review process.
Scientific Name Butterfly Species Common Name
SRANK1 Waterloo Regional Status2
Total Individuals Observed
Hesperiidae
Poanes hobomok Hobomok Skipper S5 Common 2
Thymelicus lineola European Skipper SNA Very Common 3
Papilionidae
Papilio glaucus Eastern Tiger Swallowtail
S5 Very Common 9
Papilio polyxenes Black Swallowtail S5 Very Common 4
Pieridae
Colias eurytheme Orange Sulphur S5 Very Common 37
Colias philodice Clouded Sulphur S5 Very Common 109
Pieris rapae Cabbage White SNA Very Common 189
Lycaenidae
Celastrina ladon Spring Azure S5 Common 3
Celastrina neglecta Summer Azure S5 Very Common 3
Cupido comyntas Eastern Tailed Blue S5 Uncommon 4
Nymphalidae

28
Scientific Name Butterfly Species Common Name
SRANK1 Waterloo Regional Status2
Total Individuals Observed
Cercyonis pegala Common Wood-nymph
S5 Very Common 24
Coenonympha tullia Common Ringlet S5 Common 80
Danaus plexippus Monarch S2N, S4B Very Common 25
Enodia anthedon Northern Pearly-eye S5 Common 1
Junonia coenia Common Buckeye SNA Uncommon 3
Limenitis archippus Viceroy S5 Very Common 6
Limenitis arthemis arthemis
White Admiral S5 Uncommon 1
Nymphalis antiopa Mourning Cloak S5 Very Common 4
Phyciodes cocyta Northern Crescent S5 Uncommon 12
Phyciodes tharos Pearl Crescent S4 Common 2
Polygonia comma Eastern Comma S5 Very Common 1
Polygonia interrogationis
Question Mark S5 Very Common 17
Speyeria cybele Great Spangled Fritillary
S5 Very Common 1
Vanessa atalanta Red Admiral S5 Very Common 59
Vanessa cardui Painted Lady S5 Common 16
Vanessa virginiensis American Lady S5 Common 5
TOTAL - - - 620
1 OMNR, 2012
S5 Very Common S4 Common S4B Common (Breeding Habitat) S2N Imperiled (Non-breeding Habitat) SNA Not Applicable 2Linton, 2012
The results of the data analysis for the Huron Natural Area can be found in Table 11.
The species richness was 26, while the Shannon-Wiener Diversity Index was 2.27, with
an evenness value of 0.70 and a variance of 0.0021. The Simpson Diversity Index was
0.16, while the Simpson Reciprocal Index was 6.36. These numbers were generated
based on the results in Table 10, which only includes observations that passed the
review process.
Table 11. Huron Natural Area Data Results
Shannon-Wiener Value Simpson Diversity Value
H 2.27 D .16 E .70 1/D 6.36 Variance .0021

29
3.3.2.1 Comparison to Expert Observations
There was a significant difference (p-value <0.5) between the confirmed volunteer
observations and the expert observations. Table 12 presents the differences between
the data sets. Overall, there were 26 species observed by volunteers, while the expert
observed 22 species during the monitoring period. Species that were observed by the
volunteers but not by the expert include: Hobomok Skipper (Poanes hobomok), Viceroy
(Limenitis archippus), White Admiral (Limenitis arthemis), Northern Crescent (Phyciodes
cocyta), Eastern Comma (Polygonia comma), and Painted Lady (Vanessa cardui).
Species that were observed by the expert and not by the volunteers include: Wild Indigo
Duskywing (Erynnis baptisiae), and Juvenal’s Duskywing (Erynnis juvenalis).
Table 12. Comparison Between Expert Observations and the Final List of Volunteer Observations at the Huron Natural Area. Note: this table only includes
confirmed observations that passed the review process.
Scientific Name Butterfly Species Common Name
SRANK Waterloo Regional
Status
Volunteer Total
Individuals Observed
Expert Total Individuals Observed
Hesperiidae
Erynnis baptisiae Wild Indigo Duskywing
S4 Unknown 0 13
Erynnis juvenalis Juvenal's Duskywing S5 Rare 0 4
Poanes hobomok Hobomok Skipper S5 Common 2 0
Thymelicus lineola European Skipper SNA Very Common 3 20
Papilionidae
Papilio glaucus Eastern Tiger Swallowtail
S5 Very Common 9 7
Papilio polyxenes Black Swallowtail S5 Very Common 4 2
Pieridae
Colias eurytheme Orange Sulphur S5 Very Common 37 10
Colias philodice Clouded Sulphur S5 Very Common 109 34
Pieris rapae Cabbage White SNA Very Common 189 78
Lycaenidae
Celastrina ladon Spring Azure S5 Common 3 1
Celastrina neglecta Summer Azure S5 Very Common 3 2
Cupido comyntas Eastern Tailed Blue S5 Uncommon 4 1
Nymphalidae
Cercyonis pegala Common Wood-nymph
S5 Very Common 24 24
Coenonympha tullia Common Ringlet S5 Common 80 21
Danaus plexippus Monarch S2N, S4B Very Common 25 7

30
Scientific Name Butterfly Species Common Name
SRANK Waterloo Regional
Status
Volunteer Total
Individuals Observed
Expert Total Individuals Observed
Enodia anthedon Northern Pearly-eye S5 Common 1 1
Junonia coenia Common Buckeye SNA Uncommon 3 1
Limenitis archippus Viceroy S5 Very Common 6 0
Limenitis arthemis arthemis
White Admiral S5 Uncommon 1 0
Nymphalis antiopa Mourning Cloak S5 Very Common 4 1
Phyciodes cocyta Northern Crescent S5 Uncommon 12 0
Phyciodes tharos Pearl Crescent S4 Common 2 12
Polygonia comma Eastern Comma S5 Very Common 1 0
Polygonia interrogationis
Question Mark S5 Very Common 17 6
Speyeria cybele Great Spangled Fritillary
S5 Very Common 1 4
Vanessa atalanta Red Admiral S5 Very Common 59 33
Vanessa cardui Painted Lady S5 Common 16 0
Vanessa virginiensis American Lady S5 Common 5 5
TOTAL - - - 620 287
1 OMNR, 2012
S5 Very Common S4 Common S4B Common (Breeding Habitat) S2N Imperiled (Non-breeding Habitat) SNA Not Applicable 2Linton, 2012
3.3.2.2 Comparison to NRSI Data
During the 2010 butterfly surveys conducted by NRSI, there were 18 species of
butterflies observed, while 22 species were observed during the 2011 surveys, and 21
species during the 2012 surveys. Overall, a total of 31 species were identified during
the NRSI surveys and the annual butterfly counts. In comparison, 26 species of
butterflies were identified by the community-based monitoring participants in one year of
data collection. One important note regarding the annual butterfly count data is that it
includes butterfly observations from areas other than the meadow habitat, while the
CBM data only includes data from the meadow trail.

31
Table 13 summarizes the observations from each year of data collection and compares
the results to those collected by the community-based monitoring program, which does
not include expert observations.
Table 13. Summary of Butterflies Observed by NRSI at the Huron Natural Area in 2010-2012, Compared to Observations made by Volunteers in 2012 Note: this table
only includes volunteer data that passed the review process.
Scientific Name Common
Name
SR
AN
K1
Waterloo Regional Status2
Total Individuals Observed By NRSI in
2010
Total Individuals Observed by NRSI in
2011
Total Individuals Observed by NRSI in
2012
Total Individuals Observed by CBM
Program in 2012
Hesperiidae
Anatrytone logan Delaware Skipper
S4 Common 0 2 2 0
Cartercephalus palaemon
Arctic Skipper
S5 Rare 3 0 0 0
Epargyreus clarus
Silver-spotted Skipper
S4 Unknown 0 0 1 0
Erynnis Baptisiae Wild Indigo Duskywing
S4 Unknown 7 0 8 0
Poanes hobomok Hobomok Skipper
S5 Common 0 0 0 2
Thymelicus lineola
European Skipper
SNA Very Common
0 25 4 3
Papilionidae Papilio cresphontes
Giant Swallowtail
S3 Uncommon 0 1 0 0
Papilio glaucus Eastern Tiger Swallowtail
S5 Very Common 0 4 8 9
Papilio polyxenes Black Swallowtail
S5 Unknown 0 0 1 4
Pieridae Colias eurytheme Orange
Sulphur S5 Very
Common 4 0 7 37
Colias philodice Common (Clouded) Sulphur
S5 Very Common 17 2 23 109
Pieris rapae Cabbage White
SNA Very Common
10 10 37 189
Lycaenidae Callophrys niphon
Eastern Pine Elfin
S5 Rare 1 0 0 0
Celastrina ladon Spring Azure
S5 Common 0 6 0 3

32
Scientific Name Common
Name
SR
AN
K1
Waterloo Regional Status2
Total Individuals Observed By NRSI in
2010
Total Individuals Observed by NRSI in
2011
Total Individuals Observed by NRSI in
2012
Total Individuals Observed by CBM
Program in 2012
Celastrina neglecta
Summer Azure
S5 Very Common
1 4 2 3
Everes comyntas Eastern Tailed Blue
S5 Uncommon 0 1 0 4
Nymphalidae
Cercyonis pegala Common Wood Nymph
S5 Very common 3 12 20 24
Coenonympha tullia
Common Ringlet
S5 Common 45 2 11 80
Coenonympha tullia inornata
Inornate Ringlet
SNA Unknown 0 23 0 0
Danaus plexippus
Monarch S2N, S4B
Very Common
1 3 6 25
Enodia anthedon Northern Pearly-Eye
S5 Common 0 3 1 1
Junonia coenia Common Buckeye
SNA Uncommon 0 0 0 3
Limenitis archippus
Viceroy S5 Very Common
3 0 0 6
Limentis arthemis arthemis
White Admiral
S5 Uncommon 0 0 0 1
Limentis arthemis astyanax
Red-Spotted Purple
S5 Common 2 1 1 0
Megisto cymela Little Wood-Satyr
S5 Very Common 1 4 1 0
Nymphalis antiopa
Mourning Cloak
S5 Very Common
0 1 1 4
Phyciodes pascoensis
Northern Crescent
S5 Uncommon 0 3 0 12
Phyciodes tharos Pearl Crescent
S4 Common 1 5 10 2
Polygonia comma
Eastern Comma
S5 Very Common
0 4 0 1
Polygonia interrogationis
Question Mark
S5 Very common 1 1 4 17
Speyeria cybele Great Spangled Fritillary
S5 Very Common 3 0 4 1
Vanessa atalanta Red Admiral
S5 Very Common
8 0 5 59

33
Scientific Name Common
Name
SR
AN
K1
Waterloo Regional Status2
Total Individuals Observed By NRSI in
2010
Total Individuals Observed by NRSI in
2011
Total Individuals Observed by NRSI in
2012
Total Individuals Observed by CBM
Program in 2012
Vanessa cardui Painted Lady
S5 Common 0 0 0 16
Vanessa virginiensis
American Painted Lady
S5 Common 1 3 0 5
TOTAL --- --- --- 112 120 157 620
1 OMNR, 2012
S5 Very Common S4 Common S4B Common (Breeding Habitat) S2N Imperiled (Non-breeding Habitat) SNA Not Applicable 2Linton, 2012
The results of the Shannon-Wiener Diversity Index, Simpson Index and two-tailed t-test
can be found in Table 14. The Shannon-Wiener Diversity Index for the 2010-2012 data
collected by NRSI and the data from the annual butterfly counts was 2.85, with an
evenness value of 0.8284 and a variance of .0023, while the data set collected by the
CBM program had an H value of 2.41, an evenness of .6977, and a variance of .0015.
The Simpson Index for the NRSI data was .08, with a Reciprocal Index of 12.66, while
the CBM data had a D value of .16 and a 1/D value of 6.36.
Table 14. Shannon Index, Simpson Index and Two-tailed T-test Comparing Huron Natural Area Data from 2010-2012 and CBM Data in 2012
2010-2012 NRSI Data CBM 2012 Data
Shannon Index (H) 2.85 2.41 Evenness (E) 0.8284 0.6977 Variance 0.0023 0.0015 Simpson Index (D) .08 .16 Reciprocal Index (1/D) 12.66 6.36 N 389 907 t-value 8.6214 Df 941.1306 p value 0.0000

34
Chapter 4 Discussion
The main objective of this short-term research was to analyze the usefulness of
volunteer observations in establishing baseline conditions at the study sites. As of
2013, the City of Kitchener has been managing the program and will be collecting long-
term data of the butterfly assemblages at these natural areas. The City of Kitchener’s
long-term goal of the broader program is to compare changes over time and provide
insight into the diversity of the ecosystems at each natural area.
4.1 Volunteer Data was Effective
Studies show that citizen scientists are a fundamental solution to restricted funding and
limited staffing (Delaney et al., 2008). This study demonstrated that with proper
training, citizen scientists were able to identify most butterfly species, and assist the City
of Kitchener by providing additional data on the butterfly populations in two natural
areas.
The long-term use of CBM programs demonstrates the effectiveness of this method of
data collection. Citizen science programs have been established as evidenced by the
Christmas Bird Count, which began in 1900, and currently more than 200 research
projects involve using volunteer citizens to collect scientific data (Cohn, 2008). Studies
show that citizen scientists can learn to operate equipment and collect data that is
accurate, usable, and as reliable as professional researchers (Cohn, 2008). An
important aspect of ensuring that citizen scientists collect usable data is to design
research projects and study protocols for volunteers (Cohn, 2008; Foster-Smith &
Evans, 2003). Program designers should ensure volunteers are recording the proper
amount of detail. Data that is too vague will not be useful for the research project, while
on the other hand, requiring volunteers to collect data that is too complex or detailed
may cause issues with accuracy and reliability of the data (Cohn, 2008).
Other citizen science studies have also demonstrated the difficulty in assigning complex
tasks to volunteers (Foster-Smith & Evans, 2003). In this case, volunteers had difficulty
identifying butterflies in the Hesperiidae family, which is an indication of a task too

35
complex for citizen scientists. Increased training on this family of butterflies, as well as
any rare species that may occur within the study areas, should be given in future years.
Increased training is likely to provide enough information to overcome problems of this
nature (Foster-Smith & Evans, 2003). In terms of rare species identification, volunteers
identified several butterfly species that are listed as unknown, uncommon or rare in The
Butterflies of Waterloo Region (Linton, 2012). With little or no supporting evidence for
their identification, these species were not included in the analysis. It should be noted
that although there was a lack of substantiating evidence, this does not mean that the
species were not present in the study sites (Lepcyzk, 2005). Species that were not
included in the final analysis will still be retained on the comprehensive list of butterflies
that may occur within the area, and further studies should be completed by an expert
before these species are definitively ruled out of occurring at the study sites.
Another way to avoid assigning overly complex tasks is to ensure the program is
designed for people with little to no scientific background and to provide adequate
training. Cohn (2008) pointed out that volunteers may have a background in science,
as those who volunteer often care about the environment and have some level of
awareness of the process. This can help increase the reliability of data, but it should
not be assumed that volunteers have a background or previous understanding of
scientific protocols.
The literature demonstrates that citizen science data can be validated and useful. With
proper training, studies show that volunteers can collect data with a high level of
accuracy (Delaney et al., 2008; Darwall & Dulvy, 1996; Fore et al., 2001; Boudreau &
Yan, 2004). The ability to collect accurate data makes citizen scientists an important
supply of information for early detection (Delaney et al., 2008; Lodge et al. 2006).
Overall, the average accuracy of volunteers at the two natural areas in this study was
93.75%. This is very high in comparison to other citizen science studies that have
found participants to have accuracy ratings of 80-95% (Delaney et al., 2008).

36
In particular, examples of volunteers successfully conducting butterfly surveys include
several European projects that monitor butterfly assemblages, such as the United
Kingdom Butterfly Monitoring Scheme and the France Butterfly Garden Observatory
(Matteson et al., 2012; Pollard & Yates, 1993; van Swaay et al., 2008). As well, there
are several programs in North America that record the migration and population trends
of the Monarch (Danaus plexippus) using citizen scientists, including Journey North,
Monarch Larva Monitoring Project and Monarch Watch (Matteson et al., 2012;
Oberhauser & Prysby, 2008; Howard & Davis, 2009).
Another example of a North American butterfly monitoring project is the newly launched
eButterfly program, which is an online tool for citizens to record butterflies they observe
in Canada or the United States. Social media tools are beneficial to citizen science
programs as demonstrated by eButterfly, which can help scientists to understand how
climate and environmental change impact the distribution of butterflies (Ogden, 2013;
ebutterfly, 2013). The review process for the eButterfly program is similar to the one
employed for this CBM project. Observations that are submitted in southern Ontario are
reviewed by a local expert who examines each individual record. The review process
includes analyzing the latitude and longitude of the location of each observation, the
date recorded and any photos of the specimen, if provided (M. Larrivée, personal
communication, April 30, 2013). Any observations that do not pass the review process
are not included in the eButterfly data set, as with this particular citizen science
program.
In order to evaluate the effectiveness of data, there are several factors to consider.
According to Newman et al. (2003), there are two primary questions to focus on when
evaluating volunteer data: are the survey methods that will be employed by or taught to
volunteers reliable (method calibration); and given that the methods are acceptably
reliable, how do amateurs compare with experts (data validation)? In the first place, the
transect methods employed for this program have been established by a butterfly expert
and used to assess butterfly populations since the early 1970s (Pollard et al., 1975).
This method has been validated over time and is a standard butterfly survey protocol

37
(Pollard, 1977; Thomas, 1983; Pollard & Yates, 1993; Caldas & Robbins, 2003).
Secondly, the review process for this program compared volunteer observations with
expert observations to validate the data. This process included a direct comparison of
observations, as well as comparison to expert documentation, such as The Butterflies of
Waterloo Region (Linton, 2012) and The Ontario Butterfly Atlas (Jones et al., 2012).
An analysis of the validity and effectiveness of the data collected at each site is found
below.
4.1.1 Validity of Data Collected at Lakeside Park
The first indication of the validity of data collected at Lakeside Park is the number of
observations that passed the review process. The number of unconfirmed individual
butterflies at Lakeside Park was 1,282, while the confirmed number of individual
butterflies was 1,193, which results in 93.1% of butterflies passing the review process
and being identified correctly to the species level. The percentage of correctly identified
individuals generally indicates the usefulness of the collected data. In this case, 93% of
the observations were confirmed. This high level of accuracy indicates the volunteers
were able to correctly identify the butterfly assemblages at Lakeside Park.
The Lakeside Park data is a useful year of baseline data for comparing future years of
data collection because of the high level of accuracy of observations. Of the nine
species that did not pass the review process, six were from the Hesperiidae family, two
from the Lycaenidae family, and one general category of unknown individuals. Of the
69 observations of Hesperiidae family that were reviewed, including one submission of
a Duskywing sp. and 19 Skipper spp., 40 passed the review process. These results
confirm the Hesperiidae family is especially difficult to correctly identify. This family of
butterflies is often overlooked due to their drab appearance (Linton, 2012), and can be
incredibly difficult to identify to the species level because of their small size and the
similarity between species.

38
Although identifying individuals in the Hesperiidae family was a difficult task for
volunteers, overall, the identification of other species was successful and consistent
with expert observations. The Shannon-Wiener Diversity Index value was 1.28 for this
site, which is fairly low and is likely a direct result of the majority of the study area
consisting of grassland park habitat. The low level of diversity at the site likely led to
easier identification of species for volunteers, as the majority of observations consisted
of a few common and easily identifiable butterflies, including the Cabbage White (Pieris
rapae) and Clouded Sulphur (Colias philodice), which together accounted for over 80%
of the individuals observed at the site. The ease of identification resulted in fairly
consistent observations by volunteers and the expert. A two-tailed t-test found there
was no significant difference (p-value 0.94) between the confirmed list of observations
collected by volunteers and the expert observations. The lack of significant difference
between the volunteer data set and the expert data set indicates both parties were
collecting similar data and that volunteers are as useful as one expert in collecting
butterfly assemblage data in a simple butterfly habitat.
The lack of significant difference between observations collected by citizen scientists
and the expert, as well as an accuracy level of 93.1% indicate the data collected by the
volunteers is valid. This data set indicates the effectiveness of using volunteers to
determine butterfly assemblages and characterize a site representing simple butterfly
habitats.
4.1.2 Validity of Data Collected at Huron Natural Area
An indication of the validity of data collected at the Huron Natural Area is the high
number of observations that passed the review process. The number of unconfirmed
individual butterflies at the Huron Natural Area was 657, while the confirmed number of
individual butterflies was 620, which results in 94.4% of butterflies passing the review
process and being correctly identified to the species level. This high level of accuracy
indicates the volunteers were able to correctly identify the butterfly assemblages at the
Huron Natural Area. Of the six species or categories of unknown individuals that did not
pass the review process, three were from the Hesperiidae family, one from the
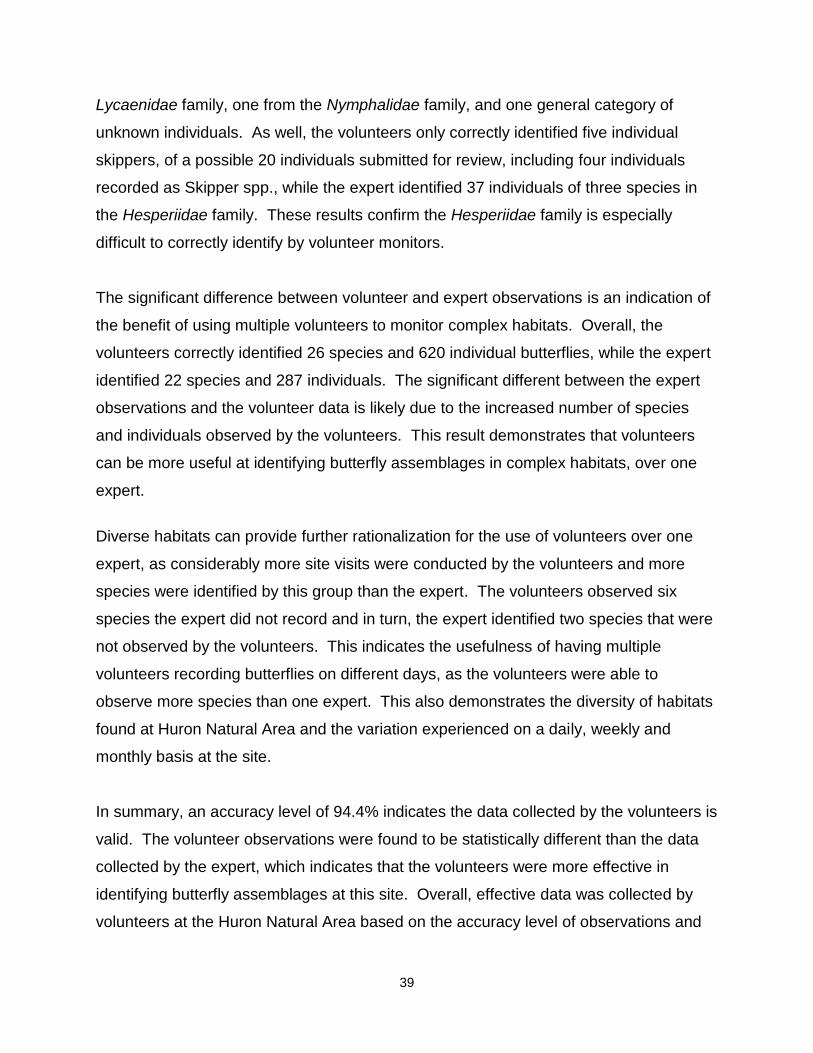
39
Lycaenidae family, one from the Nymphalidae family, and one general category of
unknown individuals. As well, the volunteers only correctly identified five individual
skippers, of a possible 20 individuals submitted for review, including four individuals
recorded as Skipper spp., while the expert identified 37 individuals of three species in
the Hesperiidae family. These results confirm the Hesperiidae family is especially
difficult to correctly identify by volunteer monitors.
The significant difference between volunteer and expert observations is an indication of
the benefit of using multiple volunteers to monitor complex habitats. Overall, the
volunteers correctly identified 26 species and 620 individual butterflies, while the expert
identified 22 species and 287 individuals. The significant different between the expert
observations and the volunteer data is likely due to the increased number of species
and individuals observed by the volunteers. This result demonstrates that volunteers
can be more useful at identifying butterfly assemblages in complex habitats, over one
expert.
Diverse habitats can provide further rationalization for the use of volunteers over one
expert, as considerably more site visits were conducted by the volunteers and more
species were identified by this group than the expert. The volunteers observed six
species the expert did not record and in turn, the expert identified two species that were
not observed by the volunteers. This indicates the usefulness of having multiple
volunteers recording butterflies on different days, as the volunteers were able to
observe more species than one expert. This also demonstrates the diversity of habitats
found at Huron Natural Area and the variation experienced on a daily, weekly and
monthly basis at the site.
In summary, an accuracy level of 94.4% indicates the data collected by the volunteers is
valid. The volunteer observations were found to be statistically different than the data
collected by the expert, which indicates that the volunteers were more effective in
identifying butterfly assemblages at this site. Overall, effective data was collected by
volunteers at the Huron Natural Area based on the accuracy level of observations and

40
the number of species that were observed by volunteers that the expert did not observe.
This data set demonstrates the usefulness of volunteers in characterizing complex
butterfly habitats and identifying butterfly assemblage at Huron Natural Area.
4.2 Establishment of Baseline Conditions
The butterfly assemblage data collected by the expert and volunteers has established
baseline data for these two natural areas. Once a long-term data set has been
collected, the City of Kitchener can analyze changes in butterfly assemblages over time
and analyze changes in diversity and evenness of the populations, while providing
insight into changes occurring in the ecosystems.
4.2.1 Poor Diversity at Lakeside Park
Analyzing the diversity of butterfly species over time can provide insight into the
ecosystems at Lakeside Park. The species richness at Lakeside Park was 29, while the
Shannon-Wiener Diversity Index for Lakeside Park was 1.28, which is a fairly low level
of diversity. The Simpson Diversity Index was 0.48, which indicates there is a 48%
chance that two randomly selected individuals in the sample will belong to the same
species. This level of probability indicates there is a low to moderate level of diversity in
the Lakeside Park butterfly community. The Simpson Reciprocal Index was 1.92, with a
potential maximum of 29. This index also indicates there is a low level of diversity
within the butterfly community.
The Shannon-Wiener Diversity Index and Simpson Index values indicate that Lakeside
Park has a low level of diversity of butterfly species and does not contain an even
distribution of species, as the Shannon Evenness value was 0.38. This site was largely
dominated by a few species of butterflies, including the Cabbage White, which
accounted for 71% of the population and the Clouded Sulphur, which made up 10% of
the population at Lakeside Park. All other individual species at the site accounted for
4% or less of the population, indicating a very uneven distribution of species.
The vegetation communities at Lakeside Park do not contain diverse habitats to support
butterfly species, as the study area contains mainly mowed parkland, which consists of
41
urban grass species (see Figure 1). The diversity of plant species is positively
correlated with species richness and diversity of butterflies (Hogsden & Hutchinson,
2004) and the plant community at Lakeside Park does not contain a high diversity of
plant species to support butterfly populations. Butterflies are excellent indicators of the
effects of urbanization, as the diversity of butterfly species decreases in sites that have
been developed (Blair, 1999; Blair & Launer, 1997; Yamamoto, 1977; Dennis & Hardy,
2001; Ruszczyk & De Araujo, 1992; Ruszczyk, 1986). The natural area is surrounded
by an urban area with very little connective habitat to support butterfly populations,
which limits the amount of dispersal between local populations (Schippers et al., 1996).
Furthermore, lack of connection to other habitats limits the ability of populations from
adjacent ecosystems to intersperse with this population should disappearance of local
functional groups occur at the site (Naeem, 1998). The low diversity and uneven
butterfly community at Lakeside Park indicate a lack of species redundancy (De Leo &
Levin, 1997; Naeem, 1998).
The simple habitat at Lakeside Park has resulted in a low level of diversity of butterfly
species. The City of Kitchener can use this baseline data to compare future data sets
and provide insight into the ecosystems at this site.
4.2.2 Rich Diversity at Huron Natural Area
An analysis of the diversity of butterfly species present over time at Huron Natural Area
can provide basic knowledge of ecosystems at the site. The species richness at Huron
Natural Area was 26, while the Shannon-Wiener Diversity Index for Huron Natural Area
was 2.27, which is a fairly high level of diversity and substantially higher than that
observed in Lakeside Park. The Simpson Diversity Index was 0.16, which indicates
there is a 16% chance that two randomly chosen individuals in the sample will belong to
the same species. This value demonstrates the high level of diversity of the Huron
Natural Area butterfly community. In comparison, the Lakeside Park value was 0.48,
which indicates that Huron Natural Area has a much higher level of diversity, although
the species richness observed by volunteers at Huron Natural Area was lower than at
Lakeside Park. The Simpson Reciprocal Index was 6.36, of a potential maximum of 26,

42
which also indicates a moderate to high level of diversity. The vegetation community
that was analyzed for this monitoring program consists of entirely meadow habitat and
contains a high level of diverse habitats to host a diverse population of butterflies in a
complex habitat.
The Shannon-Wiener Diversity Index and Simpson Index values demonstrate the
moderate to high level of diversity at the Huron Natural Area site, as a higher Shannon-
Wiener Diversity Index and Simpson Reciprocal value indicate the community has a
diverse number of species and an even distribution of species (Gomez-Alvarez et al.,
2007). The population at this site has a more even distribution than Lakeside Park, with
a Shannon Evenness value of 0.70. The site is dominated by Cabbage White, with 30%
of the butterfly population consisting of Cabbage White, 17% consisting of Clouded
Sulphurs, 12% consisting of Common Ringlets (Coenonympha tullia), 10% consisting of
Red Admirals (Vanessa atalanta), and 6% consisting of Orange Sulphurs (Colias
eurytheme), while the other 22 individual species made up 4% or less of the population.
These distributions indicate there is a more even butterfly population at Huron Natural
Area than at Lakeside Park.
As well as containing diverse butterfly habitats, Huron Natural Area also contains
connective habitat to other natural areas. It is a large naturalized park that consists of
107 ha of land, which is adjacent to other naturalized areas and provides connective
habitat for increased dispersal of butterflies. This park is located on the outskirts of the
City of Kitchener, and the butterfly population contains a higher level of diversity
compared to Lakeside Park, which contains less naturalized habitat and is almost
entirely surrounded by developed urban areas. At Huron Natural Area, the high level of
diversity and fairly even species distribution indicate there is likely a higher level of
species redundancy in this population than at Lakeside Park, as a higher level of
diversity demonstrates greater ecosystem stability (McArthur, 1955; Elton, 1958; Odum,
1959; Margalef, 1969; Tilman et al., 2006; May, 1973; Lehman & Tilman, 2000; Tilman,
1999).

43
The complex habitats at Huron Natural Area host a diverse and even population of
butterfly species. This year of data will be part of a long-term data set compiled by the
City of Kitchener to analyze changes over time to provide insight into the ecosystems at
Huron Natural Area.
4.2.2.1 Similarity of Professional Firm and Volunteer Results
It has been noted that the NRSI data includes data from two annual butterfly counts that
occurred in 2011 and 2012 and includes observations collected outside of the meadow
habitat where CBM data was collected. A comparison of data collected by NRSI and
the citizen scientists has been made to compare the diversity of observations and
provide insight into the likelihood of citizen scientists establishing valid baseline
conditions for Huron Natural Area.
A comparison of data collected by NRSI in 2010-2012 and data collected by citizen
scientists has been made. The overall species richness from 2010-2012 was 31, while
the species richness of the data collected by the volunteers in 2012 was 26. The
species richness from individual years of data collected by NRSI was lower than the
species richness collected by volunteers. The Shannon Diversity Index of the two data
sets was similar, although there was a larger difference between the Simpson Index
values for both data sets. The difference in Simpson values is likely due to the
increased survey period, consisting of three years of data collection, compared to one
year of citizen science data collection. The high Shannon Diversity and Simpson
Reciprocal values, along with low Simpson Index values of both data sets demonstrate
the high level of diversity found at a complex site, as explained in the section above.
In terms of differences between the data sets, there were seven species that were
observed by NRSI or during the Annual Butterfly Count, which were not observed during
the community-based monitoring program. These included the following species:
Silver-spotted Skipper (Epargyreus clarus), Red-spotted Purple (Limentis arthemis
astyanax), Little Wood Satyr (Megisto cymela), Arctic Skipper (Cartercephalus
palaemon), Giant Swallowtail (Papilio cresphontes), Eastern Pine Elfin (Callophrys

44
niphon) and Delaware Skipper (Anatrytone logan). Along with these species, the Wild
Indigo Duskywing (Erynnis baptisiae) was not observed by the volunteers, although this
species was included in the expert data set.
Two species observed during the 2012 Annual Butterfly Count were the Silver-spotted
Skipper and the Red-spotted Purple, both of which were observed along the Plantation
trail, which is northwest of the meadow habitat (C. Moore, personal observation, July 7,
2012). Also observed was the Little Wood Satyr, which is a forest dwelling butterfly
(Government of Canada, 2010), and it was likely observed in a forested part of the
natural area, not in the meadow habitat. Another butterfly, the Arctic Skipper, has a
Waterloo Regional Status of rare and has only been documented in seven locations
throughout the Region (Linton, 2012). This butterfly was observed in 2010 and has not
been observed at Huron Natural Area since that single observation. The Giant
Swallowtail had numerous sightings throughout the Region of Waterloo in 2011 (Linton,
2012), but only one individual was observed at the Huron Natural Area in 2011. This
species uses Northern Prickly Ash (Zanthoxylum americanum) and Common Hoptree
(Ptelea trifoliata) as larval host plants (Linton, 2012), which are not present in the Huron
Natural Area, indicating the single Giant Swallowtail observed was likely passing
through and does not breed at the site.
Another butterfly observed by NRSI was the Eastern Pine Elfin (Callophrys niphon),
which has only two records in the Region of Waterloo, including the sighting at Huron
Natural Area (Linton, 2012). This species uses White Pine (Pinus strobus) and Jack
Pine (Pinus banksiana) as a host plant (Government of Canada, 2010), and is likely
found in the Pine Plantation located northwest of the meadow. Lastly, the Delaware
Skipper was observed in 2011 and 2012 during the NRSI surveys and was not recorded
by the volunteers. This butterfly is found in dry meadows and uses various grasses as
a larval host plant (Government of Canada, 2010; Butterflies and Moths of North
America, 2013). The majority of these species were observed in areas other than the
meadow habitat where CBM surveys took place or consisted of migrant species for
which breeding habitat does not exist within Huron Natural Area.

45
In addition to the species observed by NRSI, the community-based monitoring
participants observed four species that were not documented during the 2010-2012
NRSI surveys or at the Annual Butterfly Counts. These species include: Hobomok
Skipper, Common Buckeye (Junonia coenia), White Admiral and Painted Lady. The
Hobomok Skipper is common in the Region of Waterloo and has been observed in
numerous locations in the last five years (Linton, 2012). The Common Buckeye is a
migrant butterfly in Canada, although it has been known to establish temporary
breeding colonies in favourable migration years. This species was observed at Huron
Natural Area in 2010 (Linton, 2012). The White Admiral is common throughout Canada,
although there are only five documented observations in the Region of Waterloo since
2001 (Linton, 2012). Finally, the Painted Lady is a common seasonal colonist of
southern Ontario and is common in the Region of Waterloo (Linton, 2012). These
species observed by the volunteers represent a mix of common and rare migrant
species in the Region of Waterloo.
Overall, there were different common and rare species observed by NRSI and the
citizen science volunteers at Huron Natural Area, although the similar species richness
of three years of NRSI data collection and one year of CBM data collection indicates the
accuracy of observations collected by citizen scientists. Both data sets demonstrated a
similar level of diversity and evenness at the site and this is an indication of the value of
volunteer data, which produced similar results as a professional biological firm. The
variation between species observations demonstrates the high diversity present in the
complex habitat at this site. The high Shannon Diversity, evenness and Simpson Index
values, coupled with the low Simpson Reciprocal values of both data sets indicate the
high level of diversity found at Huron Natural Area, as established by the community-
based monitoring program in their year of baseline data.
4.3 Ensuring the Success of the Program
Numerous steps were taken to ensure the success of this community-based monitoring
program, which included familiarization with common challenges of these types of
programs. These challenges can include problems with program organization and

46
data accuracy. Organizational issues can stem from a lack of volunteer interest and/or
networking opportunities, as well as funding and information access difficulties
(Whitelaw et al., 2003). Challenges that occur during the data collection process can
include data fragmentation, when data is not collected consistently and inaccuracy, as
well as lack of participant objectivity (Whitelaw et al., 2003). Other issues include a lack
of credibility for data collected by community members, as well as non-comparability
between data sets collected by volunteers and incompleteness of data (Gouveia et al.,
2004; Bradshaw, 2003). These last challenges often lead to difficulties in presenting the
data as useable and worthwhile to decision-makers (Milne et al., 2006; Conrad &
Daoust, 2008).
This research program was designed to overcome the challenges that are often faced
by CBM programs. First of all, the program was designed to maximize volunteer
retention. There are several recognized principles of volunteer retention, which include
establishing motivation and upholding connectedness (McCurley & Lynch, 1997).
Motivation and positive feedback were provided to volunteers to maintain interest in the
program and retain volunteers for the season and for future years. This included
responding to all data submissions with positive feedback regarding volunteer
performance and their contribution to research. As well, monthly emails were sent to
volunteers outlining species they were likely to observe in the coming month and
providing a summary of observations from the last month. Several volunteers
responded to these messages regarding the helpfulness of the emails in terms of
narrowing down the number of species they were likely to see, as well as aiding in
positive identification of individuals they had observed.
In order to establish connectedness and recognize volunteer efforts, a volunteer
appreciation event was held at Huron Natural Area on September 17, 2012. A
summary of observations from the monitoring period was presented, which encouraged
volunteers to analyze the abundance and diversity of butterflies observed at each
location. Preliminary results and analysis were presented, and an open discussion took
place to engage volunteers and encourage them to think analytically about the data they

47
had collected, including the implications of trends they had observed. Refreshments
were provided at this event and each volunteer was given a native plant from a local
nursery to plant at their home to attract butterflies and encourage native plant
gardening. This event provided connectedness between volunteers and the program
organizer as well as among participants, which is a valuable component of a successful
community-based monitoring program.
Other measures should be taken to retain volunteers in future years, as this can
increase the accuracy of species identification and improve the capacity for analyzing
data quality (Bell et al., 2008). There was a higher rate of consistent monitoring at
Lakeside Park than at Huron Natural Area. A reason for the difference in volunteer
retention may be that a group of citizens who live near Lakeside Park approached the
City of Kitchener to request butterfly monitoring occur in their natural area. This group
was actively seeking to be involved in monitoring activities and their proximity to the
natural area provides additional investment in the Lakeside Park monitoring. Although it
can be difficult to find volunteers with this type of investment in natural area monitoring,
it would be an asset to seek similar volunteers at Huron Natural Area in the future.
A recommendation from the literature is to have volunteers conduct monitoring over
multiple years in order to reduce “first-year” effects, as participants improve their data
collection skills over time (Dicksinson et al., 2010; Bas et al., 2008; Jiguet, 2009;
Kendall et al. 1996; Sauer et al., 1994; Schemeller et al., 2009). Therefore, moving
forward with the project it will be important to contact volunteers from the 2012 program
and attempt to recruit as many of these volunteers as possible to contribute to long-term
data collection for the City of Kitchener. In subsequent years, the program will be
managed by the City of Kitchener, who will be responsible for volunteer recruitment and
retention. The City has an existing volunteer base to draw from and will be encouraged
to reach out to other citizens who may not already be engaged in their natural areas.

48
Another suggestion for overcoming barriers to CBM programs is to assess volunteers’
skill sets and match their skills to appropriate tasks (Cuthill, 2000). For example, if a
volunteer was not able to meet the time commitment required for this program or was
not confident in their ability to identify butterflies, the volunteer was advised to
participate in the Huron Natural Area Annual Butterfly Count. This is an annual
volunteer opportunity in coordination with butterfly experts who help volunteers identify
butterfly species and is a much smaller time commitment for those who cannot commit
to a longer research program.
An additional suggestion to overcome challenges with volunteer programs is to create a
framework to convey information collected by the program to decision-makers (Pollock
& Whitelaw, 2005). It is recommended that the Project Manager present a formal report
to the City of Kitchener following each year of data collection to demonstrate the
usefulness of the monitoring program. It is recommended that this report is made
available to the public and is published in the Kitchener-Waterloo Field Naturalist
newsletter and the Lakeside Park newsletter. The Toronto Entomologists’ Association
should be approached in the future to publish the results, as well as other local
environmental organizations, such as the rare Charitable Research Reserve.
To ensure the success of a volunteer program, Yarnell & Gayton (2003) also proposed
that a program must continue to obtain funding; in terms of the current project, this is
supplied by the City of Kitchener, as of 2013. It is also suggested that experts be
involved in the design of the monitoring protocols (Conrad & Daoust, 2008). The
protocol for this program was designed by a butterfly expert. The protocol is also a well-
recognized method for analyzing butterfly assemblages. As well, methods should be
simple to understand, well tested and tailored to the local community (Pollock &
Whitelaw, 2005). Utilizing nation-wide protocols is useful for consistency and accuracy,
but small adjustments must be made to ensure the protocol is appropriate for the local
community members and the monitoring sites. The adapted Pollard method employed
for this program was used because it is a widely accepted method for butterfly
monitoring. This method was tailored to the local community and volunteers by

49
eliminating the point counts in the transect method, which were removed to ensure
consistency between volunteers.
It is also recommended that training of volunteers be undertaken in order to ensure that
consistent monitoring is completed (Au et al., 2000; Stokes et al., 1990). Citizen
science programs have demonstrated the importance of training volunteers in
monitoring techniques and protocols used in research, as well as in practical field
training and through demonstrations (Newman et al., 2003; Delaney et al., 2008;
Oscarson & Calhoun, 2007; Bonney et al., 2009). Training can be time-consuming,
although many volunteers can be trained simultaneously, which is a timely and cost-
effective method for increasing the number of trained people who will collect scientific
data (Newman et al., 2003). Training of volunteers was achieved during a hands-on
workshop and through a training manual. Both of these methods are further explained
above in the methods section.
Quality control is also a vital part of citizen science projects and is built into most studies
(Silvertown, 2009; Galloway et al., 2006; Delaney et al., 2008; Lepczyk, 2005; Butcher
et al., 1990; Foster-Smith & Evans, 2003; Newman et al., 2003). It is essential to
provide quality assurance and validation of data, by ensuring volunteers follow the
survey protocol. This will increase the likelihood of the scientific community recognizing
the research as valid, and the likelihood of the researcher effectively using the data
collected by volunteers (Delaney et al., 2008; Boudreau & Yan, 2004). Citizen science
programs have shown that volunteer effectiveness benefited significantly from a
substantial investment in feedback, training and professional supervision (Newman et
al., 2003). A formal review process was implemented for this program in order to
validate the data collected by citizen scientists, which can ensure the program is
recognized as useful.
The most successful CBM programs are those that are locally appropriate and adaptive
to the community, are conducted with strong coordination, offer meaningful
opportunities to volunteers, and establish mechanisms for information delivery (Pollock

50
& Whitelaw, 2005). This program was created specifically for this community and the
two natural areas that were monitored in 2012. The program was coordinated by myself
and Josh Shea, the Natural Areas Coordinator for the City of Kitchener, and the
program received positive feedback from the participants regarding its organization.
The volunteer opportunity to monitor butterflies is meaningful, as butterflies are a
charismatic species that interest volunteers and act as an indicator species. Finally, this
program has established a mechanism for information delivery with the
recommendation to prepare a summary report following each monitoring year, which
should be made available to the public and decision-makers.
The literature demonstrates the importance of communication in successful community-
based monitoring programs. In order to ensure efficient communication, information
should be delivered at all levels and stages of the program, which includes
communication among participants and to the media and the broader community
(Pollock & Whitelaw, 2005). This program strives to maintain participant engagement
and ensure the validity of monitoring data by communicating the understanding of
science and environmental education to the local community. Proper communication
expresses the need for collecting long-term data records and conveying the usefulness
of standard methodology (Pollock & Whitelaw, 2005).
Furthermore, it is important that data be compiled into a meaningful form that is easily
conveyed to the public and decision-makers (Pollock & Whitelaw, 2005). A successful
program should be formally connected to decision-makers to ensure the sustainability of
the program (Bens, 1994; Craig et al., 2003; Milne et al., 2006; Sharpe & Conrad,
2006). This program is formally connected to the City of Kitchener, who is now
managing this study as a long-term research project. Community-based monitoring
programs should also ensure relevant results of the project are communicated in a
usable, timely and accessible manner to inform decision-makers and the broader public
effectively (Vaughan et al., 2001). The monitoring summary report prepared each year
will communicate the results to decision-makers and convey information to the public. It

51
will also serve as a promotional tool for the program that can be used for volunteer
recruitment.
There are many components of a successful long-term community-based monitoring
program, as outlined above. Numerous steps were taken to ensure the success of this
program, including tailoring this particular program to the local community, using several
methods to convey volunteer appreciation and ensure their retention, and using
effective communication tools to convey the results of the monitoring program to
decision-makers and the broader community. As Blair (1999) has found, when these
issues can be addressed, the benefits of CBM far outweigh the challenges.
4.4 Contribution to Research, the Community and the Broader Public
Community-based monitoring programs using citizen scientists can collect scientific
data that may otherwise be unattainable. The use of volunteers in ecological studies
has turned into a mainstay of studies that are targeting biological conservation
(Dickinson et al., 2010). This section focuses on the specific contributions of this
community-based monitoring program to the scientific community, broader public and
local community.
The establishment of this program and the validation of volunteer data has benefitted
the scientific community and contributed to literature in several meaningful ways. First
of all, the program has established a review process for validating observations made
by volunteers. The review process consisted of an expert checking each observation
for the likelihood of occurrence within the site and within the larger landscape. This
particular review process included the comparison of species to the status provided in
The Butterflies of Waterloo Region (Linton, 2012), whereas other programs could
compare observations to a provincial atlas, a comparable document, or they could use a
local expert, as the eButterfly program does.
Furthermore, the validation of volunteer data through a review process is another
benefit to the scientific community, as there are few studies that analyze the accuracy of

52
citizen science data, especially in an urban environment (Matteson et al., 2012; Cooper
et al., 2007). Quality control is a mainstay of citizen science programs and it must be
sustained to validate the observations made by volunteers. This study has contributed
to the literature on citizen science, validation of volunteer data and the use of butterflies
as an indicator species. In general, citizen science is underrepresented in the literature,
and one study found that, as of January 2009, there were 56 articles in the ISI Web of
Knowledge database pertaining to “citizen science” (Silvertown, 2009). Of these
articles, the majority (80%) had been written in the last five years (Silvertown, 2009).
Delaney et al. (2008) indicate the scientific community is reluctant to acknowledge
citizen science because of a lack of certified audits to evaluate the authenticity of data
for use in academic research. This study has demonstrated the ease with which citizen
science observations can be reviewed and validated. Implementing this as a national
program could overcome the reluctance of the scientific community to accept this form
of data collection and provide further validation of volunteer data. If this project gave
rise to a national program, it could be implemented in other places in Canada and other
areas of the world. This project is easily transferable to other locations and areas of
study because of the widely recognized survey methods.
This study has contributed to the literature and the scientific community through the
establishment of a review process for citizen science programs, particularly for butterfly
programs. It has provided further validation of citizen science data, created a program
that is expandable to a national butterfly monitoring program, and further contributed to
the available literature on the use of butterflies as an indicator species.
This program has made a contribution to the broader public through the establishment
of a long-term monitoring program that can benefit other communities by setting an
example of municipal-level ecological management. As previously mentioned, the
monitoring protocol for this program is easily transferable to another location, and
another community could collect butterfly monitoring data using the established program
as a model. There are several things to consider when setting up a new program,
according to Sharpe & Conrad (2006), such as ensuring there is a mentoring program

53
for any new groups establishing the monitoring program. This includes having contact
with a person to advise on the protocol, study design and information management for
the program (Sharpe & Conrad, 2006).
This program would be beneficial to other communities, as it is to the City of Kitchener.
The program can increase citizen engagement in ecosystems, improve community
influence in the decision-making process, as well as establish participation in a program
that collects long-term data and helps the community and decision-makers understand
ecological change (Pollock & Whitelaw, 2005).
Furthermore, establishing butterfly monitoring programs in other communities can help
create networks in other regions and/or provinces. A network for community-based
monitoring is desperately needed in Canada because the Ecological Monitoring and
Assessment Network was disbanded in 2010, which had supported volunteer
monitoring programs throughout the country (Government of Canada, 2012). The
Canadian Community Monitoring Network was previously established by Whitelaw et al.
(2003), but also had its entire budget cut and no longer exists. In order to establish a
successful monitoring network, it is imperative to have stable funding and a wide range
of partnerships (Savan et al., 2003). In Canada, there is almost no government support
for citizen science and there is no network to link programs throughout the country, such
as the River Network in the northeastern United States (Savan et al., 2003). When the
EMAN network was in existence, there were programs in place to compile directories of
monitoring programs and groups, and methods for connecting these groups to allow
much needed communication among monitoring programs (Savan et al., 2003). Since
the disbandment of EMAN, there is a desperate need for a community-based monitoring
network in Canada to compile monitoring information and provide communication
between programs. The establishment of this program could lead to a connection of
monitoring programs, which would be a significant benefit to other communities.
Another benefit of a community-based monitoring network is the large pool of human,
financial and technical support for those involved. As well, there is the ability to provide

54
inspiration and encouragement from fellow volunteers who may be able to provide
insight into program setbacks and successes (Savan et al., 2003). Savan et al. (2003)
point out that maintaining a volunteer network with communication between programs
provides mutual learning, however, it is a difficult task that remains to be completed.
One suggestion is to use universities and their partnerships to create and maintain this
type of network, which can provide space, leadership, support for students, grant
services and credibility to establish collaboration with government, NGOs and scientific
institutions (Savan et al., 2003). Numerous benefits are provided to the broader public
with the establishment of a long-term ecological monitoring program, including setting
an example for other communities to follow.
The establishment of this program has benefitted the local community of Kitchener, its
citizens and the local government. The program has provided insight into several
ecosystems within the City of Kitchener. The health of these ecosystems is important
for the local community in maintaining a healthy environment for all living beings,
including humans. Ecosystem goods (such as food) and services (such as waste
assimilation) signify benefits to humans, whether direct or indirect, based on the
function of an ecosystem (Costanza et al., 1997). As well, the results of the citizen
science and NRSI surveys found that Huron Natural Area has a wider diversity of
butterfly species and naturalized habitat than Lakeside Park. As a result of the butterfly
program at Lakeside Park, a local community group has approached the City of
Kitchener and asked to be involved in a restoration program to naturalize their park and
increase the amount of butterfly habitat present (J. Shea, personal communication, April
11, 2013). This request demonstrates how the program educates volunteers on the
importance of naturalized areas and the benefits of diverse habitats and butterfly
populations. It also sustains volunteer engagement in the local community.
A benefit of community-based monitoring programs is that they often engage citizens in
their local natural areas by increasing their connection with the natural world, other
volunteers and agencies (Conrad & Hilchey, 2011; Whitelaw et al., 2003). The
volunteers became more educated (Pollock & Whitelaw, 2005; Cooper et al. 2007) and

55
confident in their butterfly species identification, which could be an important step in
career development. Volunteers were empowered by this program, as they were able
to demonstrate the need for habitat restoration, based on scientific data they had
collected themselves. An important aspect of community-based monitoring was fulfilled
through this engagement, as Kim et al. (2011) state that a program only has scientific
influence when the collected data is used for some purpose. These citizens took it upon
themselves to use the data they collected to prove there was a need for Lakeside Park
to improve its natural habitat.
Another substantial benefit to the local government is the economic savings of utilizing
volunteers to collect data, instead of employees or professional scientists. The City of
Kitchener has saved substantial amounts of money and gained benefits from collecting
scientific data on the state of their ecosystems. Dickinson et al. (2010) state that
creating a volunteer monitoring program is an exceptional method for inventorying
species, particularly for cost benefits. The program benefits from a continual source of
government funding for the meager amount of operating costs and the Project
Manager’s time. Other community-based monitoring projects have found that volunteer
Project Managers are unable to generate funding on top of fulfilling other program
requirements, such as day-to-day activities and management (Pollock & Whitelaw,
2005). These participants believed government support was necessary to fund a
significant portion of the cost of project operations and to provide expertise (Pollock &
Whitelaw, 2005). This program has government support for operations and expertise,
which will facilitate long-term data collection.
Finally, the establishment of a long-term monitoring program in the City of Kitchener has
multiple benefits for the community members. The City of Kitchener has taken over the
program and committed to collecting long-term data sets using citizen scientists. This
commitment ensures the continuation of the program and also acts as an important
connection between community members and decision-makers. Monitoring is a vital
component of environmental science and government agencies need to commit to long-
term data collection programs (Lovett et al., 2007). Long-term data collection is needed

56
as ecosystems change slowly over time, and continued monitoring of critical variables
provides a record of change (Lovett et al., 2007). The local community benefits from
this record of change as the City of Kitchener has the ability to adapt to changing
conditions observed during the long-term monitoring program.
In summary, the benefits to the local community from this program include the collection
of monitoring information in their local ecosystems, education and empowerment of the
community, economic benefits for citizens and local government, engagement of
citizens in their natural areas, and the establishment of a long-term monitoring program
for the City of Kitchener.
The establishment of this long-term monitoring program has resulted in numerous
benefits for the scientific community, the broader public and the local community. The
City of Kitchener has gained community support and will continue to monitor their
natural areas and act as an innovator for scientific data collection.
4.5 Concluding Remarks
The benefits and value of a community-based monitoring program has been
demonstrated throughout this study. There are also additional benefits that could be
provided by the program in the future if children and teachers become involved in the
program. This CBM program could contribute to increased environmental education
and engagement of children in natural areas in the community.
There are several recommendations that have come out of the establishment of this
program. The results of the program should be used to improve the management of
Lakeside Park and Huron Natural Area and any additional areas that are monitored as
part of the program in future years.
Specifically, it is recommended that the City of Kitchener continue to increase the
amount of naturalized habitat within Lakeside Park. Volunteers have voiced an interest
in restoring and creating additional butterfly habitat to increase the diversity of butterflies

57
fulfilling their life cycle in the park. Naturalizing additional habitat will have multiple
benefits to the community, park and surrounding habitat. Other species such as birds
and other insect pollinators will prosper from naturalized habitat, and the community will
benefit from the creation of a more diverse ecosystem in their neighbourhood.
The City of Kitchener should continue to promote the program in order to foster
community involvement and support. Engaging new volunteers and supporters of the
program will be vital to the success of the long-term monitoring program. New sources
of volunteers, such as environmental groups, students/teachers, and citizens not
already involved in community organizations should continue to be sought in order to
engage as many citizens as possible in their natural areas.
The results of the program must continue to be reported to participants and decision-
makers, on local and wider scales. Many studies show the usefulness of a monitoring
program is closely tied to the communication of the results. The results should be
posted on the City of Kitchener website for participants and non-participants to view and
should consider incorporation into the school curriculum.
As the program continues, ongoing evaluation by participants and decision-makers
should be undertaken to ensure adaptations are made, if necessary. It is important to
collect data that can be compared to other years, but also critical to continually evaluate
the program in order to avoid any fatal flaws.
Lastly, it is recommended that pre- and post-monitoring interviews be conducted with
participants to determine the amount of education that volunteers gain from the
program. These interviews could also be compared to random interviews conducted
with non-participants to determine the effectiveness of education in the monitoring
program.

58
References
Au, J., Bagchi, P., Chen, B., Martinez, R., Dudley, S.A., & Sorger, G.J. (2000). Methodology for public monitoring of total coliforms, Escherichia coli, and toxicity in waterways by Canadian high school students. Journal of Environmental Management, 58, 213-230.
Bas, Y., Devictor, V., Moussus, J.P., & Jiguet, F. (2008). Accounting for weather and time-of-day parameters when analyzing count data from monitoring programs. Biodiversity & Conservation, 17, 3403–3416.
Bell, S., Marzano, M., Reinert, H., Cent, J., Kobierska, H., Podjed, D., …& Mursic, R.
(2008). What counts? Volunteers and their organizations in the recording and monitoring of biodiversity. Biodiversity and Conservation, 17, 3443-3454.
Bens, C. (1994). Effective citizen involvement: how to make it happen. National Civic
Review, 32-39. Blair, R.B. (1999). Birds and Butterflies along an Urban Gradient: Surrogate Taxa for
Assessing Biodiversity? Ecological Applications, 9(1), 164-170. Blair, R.B., & Launer, A.E. (1997). Butterfly diversity and human land use: Species
assemblages along an urban gradient. Biological Conservation, 80, 113-125. Bonney, R., Cooper, C.B.,Dickinson, J., Kelling, S., Phillips, T., Rosenberg, K.V., &
Shirk, J. (2009). Citizen science: a developing tool for expanding science knowledge and scientific literacy. BioScience, 59(11), 977-984.
Boudreau, S., & Yan, N. (2004). Auditing the accuracy of a volunteer-based surveillance
program for an aquatic invader Bythotrephes. Environmental Monitoring and Assessment, 91, 17–26.
Bradshaw, B. (2003). Questioning the credibility and capacity of community-based
resource management. The Canadian Geographer, 47, 137–150. Brown, K.S. (1982). Paleoecology and regional patterns of evolution in neotropical
forest butterflies. Biological diversification in the tropics, ed. G.T. Prance. Columbia University Press: New York.
Butcher, G.S., Fuller, M.R., McAllister, L.S., & Geissler, P.H. (1990). An evaluation of
the Christmas Bird Count for monitoring population trends of selected species. Wildlife Society Bulletin, 18, 129–134.
Butterflies and Moths of North America. (2013). Attributes of Anatrytone logan.
Retrieved from http://www.butterfliesandmoths.org/species/Anatrytone-logan.

59
Caldas A., & Robbins, R. K. (2003). Modified Pollard transects for assessing tropical butterfly abundance and diversity. Biological Conservation, 110, 211–19.
Carr, A. (2004). Why do we all need community science? Society Natural Resources,
17, 841–849. City of Kitchener. (2010a). Parks, Trails, Natural areas. Retrieved from
http://www.kitchener.ca/en/livinginkitchener/ParksTrailsNaturalAreas.asp?_mid_=11842
City of Kitchener. (2010b). Parks Strategic Plan. City of Kitchener, September 2010. Cohn, J.P. (2008). Citizen Science: Can Volunteers Do Real Research? BioScience,
58(3), 192-197. Conrad, C.C., & Hilchey, K.G. (2011). A review of citizen science and community-based
environmental monitoring: issues and opportunities. Environmental Monitoring Assessment, 176, 273-291.
Conrad, C.T., & Daoust, T. (2008). Community-based monitoring frameworks:
Increasing the effectiveness of environmental stewardship. Environmental Management,41, 356–358.
Cooper, C.B., Dickinson, J., Philips, T., & Bonney, R. (2007). Citizen science as a tool
for conservation in residential ecosystems. Ecology and Society, 12(2), 11. Costanza, R., d’Arge, R., de Groot, R., Farberk, S., Grasso, M., Hannon, B.,
Limburg, K.,…& van den Belt, M. (1997). The value of the world’s ecosystem services and natural capital. Nature, 387, 253-260.
Craig, B., Whitelaw, G., Robinson, J., & Jongerden, P. (2003). Community-based Ecosystem Monitoring: A tool for developing and promoting ecosystem-based management and decision making in the Long Point World Biosphere Reserve. Proceedings of the Fifth Science and Management of Protected Areas Association Conference.
Croxton, P. J., Hann, J. P., Greatorex-Davies, J. N., & Sparks, T.H. (2005). Linear hotspots? The floral and butterfly diversity of green lanes. Biological Conservation, 121, 579–584.
Cuthill, M. (2000). An Interpretive Approach to Developing Volunteer-based Coastal
Monitoring Programs. Local Environment, 5(2), 127-137. Darwall, W.R.T., & Dulvy, N.K. (1996). An evaluation of the suitability of non-specialist
volunteer researchers for coral reef fish surveys. Mafia Island, Tanzania - A case study. Biological Conservation, 78(3), 223-231.
60
Delaney, D.G., Sperling, C.D., Adams, C.S., & Leung, B. (2008) Marine invasive species: validation of citizen science and implications for national monitoring networks. Biological Invasions, 10, 117–128.
De Leo, G.A., & Levin, S. (1997). The Multifaceted Aspects of Ecosystem Integrity.
Conservation Ecology [online], 1(1), 3. Dennis, L.H.R., & Hardy P.B. (2001). Loss rates of butterfly species with urban development. A test of atlas data and sampling artefacts at a fine scale.
Biodiversity and Conservation, 10, 1831-1837. Dennis, R.L. (1993). Butterflies and climate change. Manchester University Press,
Manchester, United Kingdom. Devictor, V., Whittaker, R.J. & Betrame, C. (2010). Beyond scarcity: citizen science
programmes as useful tools for conservation bio-geography. Diversity and Distributions, 16, 354-362.
Dickinson, J., Zuckerberg, B., & Bonter, D.N. (2010). Citizen science as an ecological
research tool: challenges and benefits. Annual Review of Ecology, Evolution, and Systematics, 41, 149-172.
eButterfly.org. (2013). Welcome to eButterfly. Retrieved from http://www.ebutterfly.ca Ehrlich, P. R., Breedlove, D.E., Brussard, P.E., & Sharp, M.A. (1972). Weather and the
"regulation" of subalpine populations. Ecology, 53, 243-247. Ehrlich, P.R., & Raven, P.H. (1964). Butterflies and plants: a study in coevolution.
Evolution, 18, 586-608. Elton, C. S. (1958). The ecology of invasions by animals and plants. Methuen, London. Field, D., Voss, P., Kuczenski, T., Hammer, R., & Radeloff, V. (2010). Reaffirming social
landscape analysis in landscape ecology: a conceptual framework. Society & Natural Resources, 16, 349–361.
Fleishman, E., Thomson, J.R., MacNally, R., Murphy, D.D., & Fay, P.F. (2005). Using
Indicator Species to Predict Species Richness of Multiple Taxonomic Groups. Conservation Biology, 19(4), 1125-1137.
Fore, L.S., Paulsen, K., & O’Laughlin, K. (2001). Assessing the performance of
volunteers in monitoring streams. Freshwater Biology, 46(1), 109-123. Forister, M.L., McCall, A.C., Sanders, N.J., Fordyce, J.A., Thorne, J.H., O’Brien, J., …&
Shapiro, A.M. (2010). Compounded effects of climate change and habitat alteration shift patterns of butterfly diversity. Proceedings of the National

61
Academy of Sciences, 107(5), 2088-2092. Foster-Smith, J., & Evans, S.M. (2003). The value of marine ecological data collected
by volunteers. Biological Conservation, 113, 199–213. Galloway, A.W.E., Tudor, M.T., & Vander Haegen, W.M. (2006). The reliability of citizen
science: a case study of Oregon white oak stand surveys. Wildlife Society Bulletin, 34, 1425–1429.
Gilbert, L.E. (1980). Food web organization and the conservation of neotropical
diversity. Conservation Biology: an evolutionary-ecological perspective, ed. M.E. Soule & B.A. Wilcox. Sinauer Associates: Sunderland, M.A.
Gomez-Alvarez, V., King, G.M., & Nusslein, K. (2007). Comparative bacterial diversity in
recent Hawaiian volcanic deposits of different ages. Federation of European Microbiological Sciences Microbiology Ecology, 60, 60–73.
Gouveia, C., Fonseca, A., Camara, A., & Ferrira, F. (2004). Promoting the use of
environmental data collected by concerned citizens through information and communication technologies. Journal of Environmental Management, 71, 135–154.
Government of Canada. (2010). Butterflies of Canada. Retrieved from
http://www.cbif.gc.ca/spp_pages/butterflies/index_e.php Government of Canada. (2012). Environment Canada – Science and Technology –
Ecology Monitoring. Retrieved from http://www.ec.gc.ca/faunescience-wildlifescience/default.asp?lang=En&n=B0D89DF1-1
Hogsden, K.L., & Hutchinson, T.C. (2004). Butterfly assemblages along a human
disturbance gradient in Ontario, Canada. Canadian Journal of Zoology, 82(5), 739-748.
Howard, E., & Davis, A.K. (2009). The fall migration flyways of monarch butterflies in
eastern North America revealed by citizen scientists. Journal of Insect Conservation, 13, 279–286.
Hunsberger C. (2004). Citizen environmental monitoring in Comox Valley, British
Columbia. Background paper prepared for the Canadian Environmental Assessment Agency Research and Development Program.
Jiguet, F. (2009). Method learning caused a first-time observer effect in a newly started
breeding bird survey. Bird Study, 56, 253–58. Jones, C.D., Layberry, R., & Macnaughton, A. (2012, April 10). The Ontario Butterfly
Atlas Online. Toronto Entomologists’ Association. Retrieved from

62
http://www.ontarioinsects.org/atlas_online.htm Kendall, W.L., Peterjohn, B.G., & Sauer, J.R. (1996). First-time observer effects in the
North American Breeding Bird Survey. Auk, 113, 823–829. Kharouba, H.M., Algar, A.C., & Kerr, J.T. (2009). Historically calibrated predictions of
butterfly species' range shift using global change as a pseudo-experiment. Ecology, 90(8), 2213-2222.
Kim, S., Robson, C., Zimmerman, T., Pierce, J., & Haber, E. M. (2011). Proceedings
from Human factors in computing systems 2011: Creek watch: pairing usefulness and usability for successful citizen science. ACM.
Kremen, C. (1992). Assessing the indicator properties of species assemblages for
natural areas monitoring. Ecological Applications, 2, 207-217. Kruger, L. E., & Shannon, M. A. (2000). Getting to know ourselves and our places
through participation in civic social assessment. Society and Natural Resources, 13, 461–478.
Lee, H.T. (2008). Southern Ontario Ecological Land Classification: Vegetation Type
List. Southern Information Management and Spatial Analysis Section, Onatio Ministry of Natural Resources.
Lehman, C.L., & Tilman, D. (2000). Biodiversity, stability, and productivity in competitive
communities. American Naturalist, 156(5), 534-552. Lemieux, C.J., & Scott, D.J. (2005). Climate change, biodiversity conservation and
protected areas planning in Canada. The Canadian Geographer, 49(4), 384-399. Lepczyk, C.A. (2005). Integrating published data and citizen science to describe bird
diversity across a landscape. Journal of Applied Ecology, 42, 672–677. Lepczyk, C.A., Boyle, O.D., Vargo, T.L., Gould, P., Jordan, R., Liebenberg, L., …&
Vaughan, H. (2009). Citizen science in ecology: the intersection of research and education. Bulletin of the Ecological Society of America, 308–317.
Linton, J.E. (2012). The Butterflies of Waterloo Region: An Annotated Checklist, a
Species Scarcity Ranking, and a Transect-Based Analysis of Urban vs. Rural Populations. Toronto: Toronto Entomologists Association.
Lodge, D.M., Williams, S., MacIsaac, H.J., Hayes, K.R., Leung, B., Reichard, S., …& McMichael, A. (2006). Biological invasions: recommendations for U.S. policy and management. Ecological Applications, 16, 2035.
Lovett, G.M., Burns, D.A., Driscoll, C.T., Jenkins, J.C., Mitchell, M.J., Rustad, L., …&
Haeuber, R. (2007). Who needs environmental monitoring? Frontiers in Ecology

63
and Environment, 5(5), 253-260. Lynam, T., Jong,W., Sheil, D., Kusumanto, T., & Evans, K. (2007). A review of tools for
incorporating community knowledge, preferences and values into decision making in natural resources management. Ecology and Society, 12, 5–18.
MacArthur, R. H. (1955). Fluctuations of animal populations and a measure of
community stability. Ecology, 36, 533-536. Machlis, G., Force, J., & Burch, W.J. (1997). The human ecosystem part I: the human
ecosystem as an organizing concept in ecosystem management. Society & Natural Resources, 10, 347–367.
Magurran, A.E. (1988). Ecological diversity and its measurement. Princeton University
Press: Princeton, NJ. Margalef, R. (1969). Diversity and stability: a practical proposal and a model of
interdependence. Pages 25–37 in Diversity and stability in ecological systems. Brookhaven Symposium in Biology 22. Brookhaven National Laboratory: Upton, N.Y.
Matteson, K.C., Taron, D.J. & Minor, E.S. (2012). Assessing citizen contributions to
butterfly monitoring in two large cities. Conservation Biology, 0, 1-8. May, R.M. (1973). Qualitative stability in model ecosystems. Ecology, 54(3), 638-641. McCaffrey, R. (2005). Using citizen science in urban bird studies. Urban Habitats, 3,1–
86. McCurley, S. & Lynch, R. (1997). Volunteer management. Downers Grove, Illinois:
Heritage Arts. Milne, R., Rosolen, S., Whitelaw, G., & Bennett, L. (2006). Multi-party monitoring in
Ontario: Challenges and emerging solutions. Environments, 34, 11–23. Murphy, D.D., Freas, K.E., & Weiss, S.B. (1990). An environment-metapopulation
approach to population viability analysis for a threatened invertebrate. Conservation Biology, 4, 41-51.
Naeem, S. (1998). Species Redundancy and Ecosystem Reliability. Conservation Biology, 12(1), 39-45.
Natural Resource Solutions Inc. (NRSI). (2010). Lakeside Park Vegetation
Communities. Waterloo, ON: Gerry Schaus. Natural Resource Solutions Inc. (NRSI). (2011). Huron Natural Area Vegetation

64
Communities. Waterloo, ON: Shawn MacDonald. Natural Resource Solutions Inc. (NRSI). (2012). City of Kitchener 2012 Butterfly Survey
Summary: Huron Natural Area. Waterloo, ON: Jessica Linton. New, T.R. (1997). Are Lepidoptera an effective ‘umbrella group‘ for biodiversity
conservation? Journal of Insect Conservation, 1(1), 5-12. Newman, C., Buesching, C.D., & Macdonald, D.W. (2003). Validating mammal
monitoring methods and assessing the performance of volunteers in wildlife conservation - ‘‘Sed quis custodiet ipsos custodies?’’. Biological Conservation, 113, 189–197.
Niell, R.S., Brussard, P.F., & Murphy, D.D. (2007). Butterfly community composition and
oak woodland vegetation response to rural residential development. Landscape and Urban Planning, 81, 235-245.
Oberhauser, K., & Prysby, M.D. (2008). Citizen science: creating a research army for
conservation. American Entomologist, 54, 103–104. Odum, E. P. (1959). Fundamentals of ecology. 2nd edition. Saunders, Philadelphia. Ogden, L.E. (2013). Tags, blogs, tweets: social media as science tool? BioScience,
63(2), 148. Ontario Birds. (2010). Ontario Bird Records Committee Report for 2009. Ontario Field
Ornithologists, 28(2), 58-86. Oscarson, D.B., & Calhoun, A.J.K. (2007). Developing vernal pool conservation plans at
the local level using citizen-scientists. Wetlands, 27(1), 80–95. Pollard, E. (1977). A method for assessing changes in the abundance of butterflies.
Biological Conservation, 12, 115-134. Pollard, E., Elias, D.O., Skelton, M.J., & Thomas, J.A. (1975). A method for assessing
the abundance of butterflies in Monk’s Wood National Nature Reserve in 1973. Entomologist’s Gazette, 26, 79-88.
Pollard, E., & Yates, T.J. (1993). Monitoring butterflies for ecology and conservation: the British Butterfly Monitoring scheme. Chapman and Hall: London.
Pollock, R. M., & Whitelaw, G.S. (2005). Community-based monitoring in support of
local sustainability. Local Environment, 10(3), 211-228. Pyle, R.M. (1980). Butterfly eco-geography and biological conservation in Washington.
Atala, 8, 1-26.
65
Richter-Dyn, N., & Goel, N. S. (1972). On the extinction of a colonizing species. Theoretical Population Biology, 3, 406-433.
Roy, D.B., Rothery, P., Moss, D., Pollard, E., & Thomas, J.A. (2001). Butterfly numbers
and weather: predicting historical trends in abundance and the future effects of climate change. Journal of Animal Ecology, 70(2), 201-217.
Ruszczyk, A. (1986). Distribution and abundance of butterflies in the urbanization zones
of Porto Alegre Brazil. Journal of Research of Lepidoptera, 25, 157-178. Ruszczyk, A., & De Araujo, A.M. (1992). Gradients in butterfly species diversity in an
urban area in Brazil. Journal of Lepidopterists Society, 46, 255-264. Samways, M.J. (1994). Insect Conservation Biology. London: Chapman & Hall. Sauer, J.R., Peterjohn, B.G., & Link, W.A. (1994). Observer differences in the North-
American breeding bird survey. Auk, 111, 50–62. Savan, B., Morgan, A.J., & Gore, C. (2003). Volunteer Environmental Monitoring and
the Role of the Universities: The Case of Citizens’ Environment Watch. Environmental Management, 31(5), 561-568.
Schippers, P., Verboom, J., Knaapen, J.P., & van Apeldoorn, R.C. (1996). Dispersal
and habitat connectivity in complex heterogeneous landscapes: an analysis with a GIS-based random walk model. Ecography, 19, 97-106.
Schmeller, D.S., Henry, P.Y., Julliard, R., Gruber, B., Clobert, J., Dziock, F., …& Henle,
K. (2009). Advantages of volunteer-based biodiversity monitoring in Europe. Conservation Biology, 23, 307–316.
Schulte, B.J., & Buongiorno, J. (1998). Effects of uneven-aged silviculture on the stand
structure, species composition, and economic returns of loblolly pine stands. Forest Ecology and Management, 111, 83-101.
Schwartz, M. W. (2006). How conservation scientists can help develop social capital for
biodiversity. Conservation Biology, 20, 1550–1552. Shannon, C. E., & Weaver, W. (1949). The mathematical theory of communication.
Urbana, Illinois, USA: University of Illinois Press. Sharpe, A., & Conrad, C. (2006). Community based ecological monitoring in Nova
Scotia: challenges and opportunities. Environmental Monitoring and Assessment, 113, 395-409.
Silvertown, J. (2009). A new dawn for citizen science. Trends in Ecology and Evolution,
24(9), 467-471.

66
Simonson, S. E., Opler, P. A., Stohlgren, T. J., & Chong, G. W. (2001). Rapid assessment of butterfly diversity in a montane landscape. Biodiversity & Conservation, 10, 1369–86.
Smallidge, P.J., & Leopold, D.J. (1997). Vegetation management for the maintenance
and conservation of butterfly habitats in temperate human-dominated landscapes. Landscape and Urban Planning, 38, 259-280.
Smith, W., & Grassle, J.F. (1977). Sampling Properties of a Family of Diversity
Measures. Biometrics, 33(2), 283-292. Steele, J.A., Ozis, F., Fuhrman, J.A., & Devinny, J.S. (2005). Structure of microbial
communities in ethanol biofilters. Chemical Engineering Journal, 113, 135–143. Stokes, P., Havas, M., & Bridges, T. (1990). Public participation and volunteer help in
monitoring programs: An assessment. Environmental Monitoring and Assessment, 15(3), 225-229.
Sultana, P., & Abeyasekera, S. (2008). Effectiveness of participatory planning for
community management of fisheries in Bangladesh. Journal of Environmental Management, 86, 201–213.
Swengel, A. B. (1998). Comparisons of butterfly richness and abundance measures in prairie and barrens. Biodiversity & Conservation, 7,1639–59.
Thomas, J.A. (1983). A quick method for estimating butterfly numbers during surveys.
Biological Conservation, 27(3), 195-211. Tilman, D. (1999). The Ecological Consequences of Changes in Biodiversity: A Search
for General Principles. Ecology, 80(5), 1455-1474. Tilman, D., Reich, P.B., & Knops, J,M.H. (2006). Biodiversity and ecosystem stability in
a decade-long grassland experiment. Nature, 441, 629-632. van Swaay, C. A. M., Nowicki, P., Settele, J., & van Strien, A.J. (2008). Butterfly
monitoring in Europe: methods, applications and perspectives. Biodiversity and Conservation, 17, 3455–3469.
Vaughan, H., Brydges, T., Fenech, A., & Lumb, A. (2001). Monitoring long-term
ecological changes through the ecological monitoring and assessment network: Science-based and policy relevant. Environmental Monitoring And Assessment, 67(1-2), 3-28.
Waltz, A.E.M., & Covington, W.W. (2004). Ecological Restoration Treatments
Increase Butterfly Richness and Abundance: Mechanisms of Response. Restoration Ecology, 12(1), 85-96.
67
Watt, W. B., Chew, F.S., Snyder, L.R.G., Watt, A.G., & Rothschild, D.E. (1968).
Population structure of pierid butterflies. I. numbers and movements of some montane Colias species. Oecologia (Berlin), 27,1-22.
Weiss, S. B., White, R.R., Murphy, D.D., & Ehrlich, P.R. (1987). Growth and dispersal of
larvae of the checkerspot butterfly Euphydryas editha. Oikos, 50, 161-166. Whitelaw, G., Vaughan, H., Craig, B., & Atkinson, D. (2003). Establishing the Canadian
Community Monitoring Network. Environmental Monitoring and Assessment, 88, 409–418.
Yamamoto, M. (1977). A comparison of butterflies assemblages in and near Sapporo
City, northern Japan. Journal of the Faculty of Science. Hokkaido University Ser. 6 Zoology, 20, 621-646.
Yarnel, P., & Gayton, D. V. (2003). Community-Based Ecosystem Monitoring in British
Columbia: A Survey and Recommendations for Extension. Kamloops: Forest Research Extension Partnership, FORREX Series 13.

68
Appendix I
Training Manual
Training Manual for Community-based Butterfly Monitoring in City of Kitchener Natural Areas
Acknowledgements I would like to thank the Ecological Monitoring and Assessment Network (EMAN) and Jessica Linton for providing information and materials for this training manual.
Why should we monitor butterflies in the City of Kitchener? Butterflies act as important indicators of environmental change. Monitoring the abundance of butterflies within the City of Kitchener can provide insight into the quantity and quality of butterfly habitat within the area. Butterflies have been chosen because they are generally easily recognized, observed, and identified. Short Life Spans Butterflies have short life spans, so changes in their populations over several generations can be detected in a short time period. Changes in Climate Butterflies are sensitive to changes in climate as they require a wing temperature of at least 25°C in order to fly. Cold periods, unexpected frosts and severe weather events can affect butterfly populations. New evidence indicates that butterflies are extending their northern range in Canada as climate changes increase areas of suitable habitat. Monitoring programs such as this one can help track these changes. How to Monitor Butterflies When Different species of butterflies begin to emerge at different times of the year. Some will come out in early spring (even as early as February!) and can remain in the area until as late as November or December, depending on the local weather conditions. We will be monitoring from May-August, as this period contains the flight time of the largest number of butterfly species in the area. The best weather conditions to monitor
butterflies are warm (at least 20C) and sunny days that are not too windy. The best time to monitor butterflies is generally between 10am and 4pm, during the appropriate weather conditions. This time window can be extended on sunny days if the
temperature is at least 25C. If there is a limited time period when you are available to go out (e.g. one day) and the weather conditions are poor, I would suggest monitoring anyways, instead of skipping that monitoring session. Where Each volunteer will chose to monitor one transect at either Huron Natural Area or Lakeside Park. Huron Natural Area

69
The transect at Huron Natural Area is the meadow trail, which is located south of the parking lot area. This trail is well marked on the trail map at the natural area. The meadow trail is a loop that contains natural and restored meadow communities, as well as shrubs and trees. Lakeside Park The transect at Lakeside Park is located along the community trail, which is a well maintained trail that runs northwest to southeast through the park. This trail contains grass on the south side, and trees and shrubs on the north side along the water. How Often? Volunteers should visit their site once every two weeks from May-August. You should choose to monitor during the 1st and 3rd weeks or the 2nd and 4th weeks of every month. If you are away for two weeks, try to monitor before you go and soon after you return. How Long? You should walk the trail at a regular walking pace, observing butterflies along the way. Feel free to stop along the way to identify butterflies or catch them with your net for closer observation (remember to bring your field guide!). There is no minimum or maximum time to spend along the trail. Recording Your Observations It is very important to carefully record your butterfly observations using the recording form provided. A completed sample form has been provided to demonstrate the type of information that is required. Please remember to fill in all blank spaces. When you have completed your data collection, please transfer the data to the blank data form using excel on your computer and email it to me. Or you can print a data form to fill out during your monitoring and scan and email the completed form to [email protected]. Helpful tips and reminders:
Please use your first and last name for the “recorder” entry
You can use the local weather observations from the weather station, newspaper, etc. for the start and end temperature of your survey
Please remember to include am or pm for the start and end time
See below for an explanation of the Beaufort Wind Scale – monitoring should occur on days with a 0-5 on this scale
Remember to record any species you observe, even if you do not know what it is - simply describe the colour, shape and size of the butterfly. It is very helpful to carry a camera and take pictures of specimens to examine later or send to Charlotte Moore or another volunteer for identification.
Information that is useful to include in the “notes” section would be observations of other taxa, such as plants or birds
Contribution to the City of Kitchener and the University of Waterloo

70
Thank you for taking time to help the City of Kitchener monitor species that are important to the city and its residents, as well as contributing to research for the University of Waterloo. I hope to see you out butterflying! Beaufort Wind Scale FORCE DESCRIPTION SPECIFICATIONS FOR USE ON LAND 0 Calm Calm; smoke rises vertically. 1 Light air Direction of wind shown by smoke drift, but not by wind vanes. 2 Light Breeze Wind felt on face; leaves rustle; ordinary vanes moved by wind. 3 Gentle Breeze Leaves and small twigs in constant motion; wind extends light flag. 4 Moderate Breeze Raises dust and loose paper; small branches are moved. 5 Fresh Breeze Small trees in leaf begin to sway; crested wavelets form on inland waters. 6 Strong Breeze Large branches in motion; whistling heard in telegraph wires; umbrellas
used with difficulty.
7 Near Gale Whole trees in motion; inconvenience felt when walking against the wind. 8 Gale Breaks twigs off trees; generally impedes progress. 9 Severe Gale Slight structural damage occurs chimney-pots and slates removed). 10 Storm Seldom experienced inland; trees uprooted; considerable structural
damage occurs. 11 Violent Storm Very rarely experienced; accompanied by wide-spread damage. 12 Hurricane --

71
Appendix II
Standard Monitoring Form

Total
72
Number of individuals Habitat descriptionSpecies Observed
End Temp (°C):
Butterfly Recording Form - City of Kitchener
Site Name:
Wind Speed (0-5 on the Beaufort Scale): Sun (% of sky):
Recorder:
Start Temp (°C):
Year:
End Time: Start Time:
Date:
Beaufort Wind Scale:
0 - Calm
1 - Light air
2 - Light breeze
3 - Gentle breeze
4 - Moderate breeze
5 - Fresh breeze
6 - Strong breeze
7 - Near Gale
8 - Gale
9 - Severe Gale
10 - Storm
11 - Violent storm
12 - Hurricane
Notes:
Total Butterflies

73
Appendix III
Beaufort Wind Scale
FORCE DESCRIPTION SPECIFICATIONS FOR USE ON LAND 0 Calm Calm; smoke rises vertically. 1 Light air Direction of wind shown by smoke drift, but not by wind vanes. 2 Light Breeze Wind felt on face; leaves rustle; ordinary vanes moved by wind. 3 Gentle Breeze Leaves and small twigs in constant motion; wind extends light flag. 4 Moderate Breeze Raises dust and loose paper; small branches are moved. 5 Fresh Breeze Small trees in leaf begin to sway; crested wavelets form on inland waters. 6 Strong Breeze Large branches in motion; whistling heard in telegraph wires; umbrellas
used with difficulty.
7 Near Gale Whole trees in motion; inconvenience felt when walking against the wind. 8 Gale Breaks twigs off trees; generally impedes progress. 9 Severe Gale Slight structural damage occurs chimney-pots and slates removed). 10 Storm Seldom experienced inland; trees uprooted; considerable structural
damage occurs. 11 Violent Storm Very rarely experienced; accompanied by wide-spread damage. 12 Hurricane --