Types of Capital Debt Preferred Stock Common Equity New Common Stock Retained Earnings.
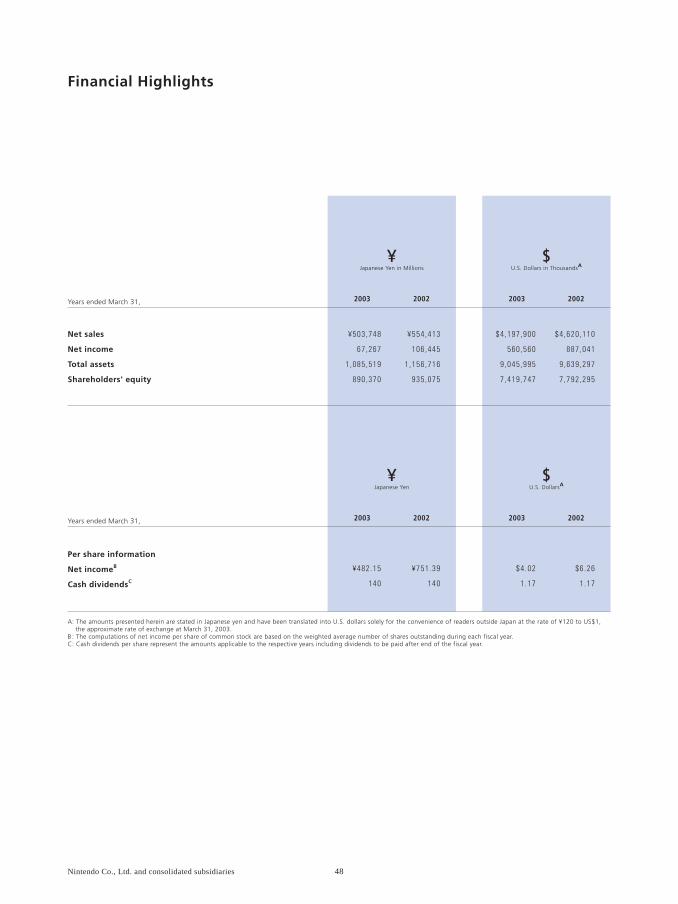
Net sales
Net income
Total assets
Shareholders' equity
¥503 ,748
67 ,267
1 ,085 ,519
890 ,370
¥554 ,413
106 ,445
1 ,156 ,716
935 ,075
$4 ,197 ,900
560 ,560
9 ,045 ,995
7 ,419 ,747
$4 ,620 ,110
887 ,041
9 ,639 ,297
7 ,792 ,295
Japanese Yen in Millions¥
U.S. Dollars in ThousandsA$
Years ended March 31,
Financial Highlights
Per share information
Net incomeB
Cash dividendsC
¥482 .15
140
¥751 .39
140
$4 .02
1 .17
$6 .26
1 .17
Japanese Yen¥
U.S. DollarsA$
2003 2002 2003 2002
2003 2002 2003 2002Years ended March 31,
A: The amounts presented herein are stated in Japanese yen and have been translated into U.S. dollars solely for the convenience of readers outside Japan at the rate of ¥120 to US$1, the approximate rate of exchange at March 31, 2003.B : The computations of net income per share of common stock are based on the weighted average number of shares outstanding during each fiscal year.C: Cash dividends per share represent the amounts applicable to the respective years including dividends to be paid after end of the fiscal year.
48Nintendo Co., Ltd. and consolidated subsidiaries

Common Stock Information
Japanese Yen¥
U.S. DollarsA$
High Low High Low
High Low High Low
2003 2002
2003 2002
First Quarter
Second Quarter
Third Quarter
Fourth Quarter
First Quarter
Second Quarter
Third Quarter
Fourth Quarter
¥20 ,750
17 ,760
14 ,100
11 ,890
$172 .92
148 .00
117 .50
99 .08
$131 .83
111 .08
84 .67
71 .50
$207 .50
204 .50
197 .08
195 .83
$152 .50
108 .08
141 .67
150 .42
¥15 ,820
13 ,330
10 ,160
8 ,580
¥24 ,900
24 ,540
23 ,650
23 ,500
¥18 ,300
12 ,970
17 ,000
18 ,050
Years ended March 31,
Years ended March 31,
The preceding table sets forth the high and low sale prices during Fiscal 2003 and 2002 for Nintendo Co., Ltd. common stock, as reported on the Osaka Stock Exchange, Section 1. Nintendo's stock is also traded on the Tokyo Stock Exchange, Section 1.
A: The amounts presented herein are stated in Japanese yen and have been translated into U.S. dollars solely for the convenience of readers outside Japan at the rate of ¥120 to US$1, the approximate rate of exchange at March 31, 2003.
49Nintendo Co., Ltd. and consolidated subsidiaries

Analysis of Operations and Financial Review
It has been twenty years since the birth of Nintendo’s “Family Computer System” in Japan --- today the video game industry has expanded into a world-wide market. Since that time, hardware capabilities have significantly advanced and in many respects it has become much easier for game creators to present their ideas in software. At the same time, there have been dramatic changes in users’ expectations, and new excitement in software is constantly demanded. More recently, hardware manufacturers have engaged in fierce price competition while, at the same time, a larger number of software titles flooded the market, increasing both game development costs and marketing costs. However, a significant portion of recent software sales have been concentrated in only a handful of these titles, resulting into a severe business environment. Under such circumstances, Nintendo Co., Ltd. (the “Company”) and its subsidiaries (together with the Company, “Nintendo”) have been striving to provide unprecedented entertainment experiences through its game development “know-how” acquired over the many years of experience in both the home entertainment market as well as the handheld market. During the fiscal year ended March 31, 2003, Nintendo launched NINTENDO GAMECUBE in Europe, along with GAME BOY ADVANCE SP worldwide, and GAME BOY PLAYER, which enables users to enjoy GAME BOY software on the television screen, in Japan. Captivating software such as POCKET MONSTERS RUBY & SAPPHIRE, SUPER MARIO SUNSHINE, and THE LEGEND OF ZELDA: THE WIND WAKER were also released. As a result, consolidated net sales for the fiscal year ended March 31, 2003 were ¥503.7 billion ($4,198 million) which represents a 9% decrease compared with the previous fiscal year. Operating income in Fiscal 2003 decreased by 16% compared with the previous fiscal year to ¥100.3 billion ($835 million). Net income in Fiscal 2003 decreased by 37% compared with the previous fiscal year to ¥67.3 billion ($561 million).
Overview
Released in Japan in November 2002, and in the Americas in March 2003, POCKET MONSTERS RUBY & SAPPHIRE gained popularity as the latest POKÉMON software release, which features new characters and new game ideas. Within a short period of time, the game sold more than a combined total of 6.6 million pieces in the Japanese and American markets, which proved that POKÉMON software which is a fundamental and a core product in the POKÉMON business is yet highly regarded. Other GAME BOY ADVANCE software such as YOSHI’S ISLAND: SUPER MARIO ADVANCE 3, KIRBY: NIGHTMARE IN DREAM LAND, THE LEGEND OF ZELDA: A LINK TO THE PAST / FOUR SWORDS also sold strongly. GAME BOY ADVANCE SP, which is an improved version of GAME BOY ADVANCE, gathered support from a wide range of age groups and got off to a good start in the Japanese, American, and European markets. GAME BOY ADVANCE SP and GAME BOY ADVANCE sold a combined total of 15.65 million units in the fiscal year ended March 31, 2003, with life-to-date unit sales reaching 33.81 million units. As for NINTENDO GAMECUBE software, creative software such as SUPER MARIO SUNSHINE (a game with plenty of action where Mario freely moves around 3D space), METROID PRIME (a multi-award winning first person adventure game which was highly regarded in Europe and America), and THE LEGEND OF ZELDA: THE WIND WAKER (where users can experience the feel of virtually moving a cartoon character) were released to further enhance the software lineup. Furthermore, in the Americas, ANIMAL CROSSING was released during this fiscal year and received top ratings as a most innovative game. The NINTENDO GAMECUBE wireless game controller WAVEBIRD which enables users to enjoy new freedom was also well received. However, effected by the impact of price cuts on hardware initiated by the Company’s competitors, NINTENDO GAMECUBE hardware resulted in a slowdown in sales. As a result, consolidated net sales in Fiscal 2003 were ¥503.7 billion ($4,198 million). Gross margin was ¥195.6 billion ($1,630 million). The gross margin ratio decreased by 1% compared with the previous fiscal year to 39%. Selling, general and administrative expenses amounted to ¥95.4 billion ($795 million). Operating income was ¥100.3 billion ($835 million). The operating income ratio decreased by 2% compared with the previous fiscal year to 20%. Along with interest income of ¥15.9 billion ($133 million), the Company reported gain on sales of investments in affiliates of ¥19.1 billion ($159 million). Although, because of the trend of yen appreciation, foreign exchange loss was ¥22.6 billion ($189 million). Due to such factors, net income was ¥67.3 billion ($561 million). The net income ratio decreased by 6% compared with the previous fiscal year to 13%.
Revenue and Expenses
50Nintendo Co., Ltd. and consolidated subsidiaries

At March 31, 2003, Nintendo’s cash and cash equivalents were ¥748.6 billion ($6,238 million). Net cash used in operating activities was ¥23.6 billion ($196 million) which was ¥79.8 billion less than the previous fiscal year. The decrease in net income, and the increase of inventories contributed to the overall decrease. Net cash provided by investing activities was ¥36.1 billion ($301 million) which was an increase of ¥41.2 billion compared with the previous fiscal year. Proceeds from time deposits and the sale of stock of the Company’s affiliates during this period contributed to the overall increase. Net cash used in financing activities was ¥102.6 billion ($855 million) which was ¥85.5 billion less than the previous fiscal year due mainly to buyback of treasury stock.
Cash Flow
Nintendo’s financial position continues to be very strong. At March 31, 2003 total liabilities were ¥195.0 billion ($1,625 million), and the current ratio was 5.21:1. The balance of cash and cash equivalents was 3.84 times total liabilities. Working capital was ¥783.3 billion ($6,527 million). The number of days’ sales in receivables increased by 1 day compared with the previous fiscal year to 34 days. Inventories were ¥104.5 billion ($871 million). The number of days’ sales in inventories was 76 days. Liabilities-to-equity ratio was 0.22:1 at March 31, 2003.
Financial Position
During the fiscal year ended March 31, 2003, the Nikkei stock average declined 28% to ¥7,972.71 ($66.44). The Company’s stock price ended the year at ¥9,600 ($80.00). The Company maintained its annual dividend level at ¥140 ($1.17) per share for Fiscal 2003. On a consolidated basis, the dividend payout ratio was approximately 29%. Foreign shareholders constituted 30% of total outstanding shares at March 31, 2003.
(Note) The amounts presented herein are stated in Japanese yen and have been translated into U.S. dollars solely for the convenience of readers outside Japan at the rate of ¥120 to US$1, the approximate rate of exchange at March 31, 2003.
Common Stock Activity
51Nintendo Co., Ltd. and consolidated subsidiaries
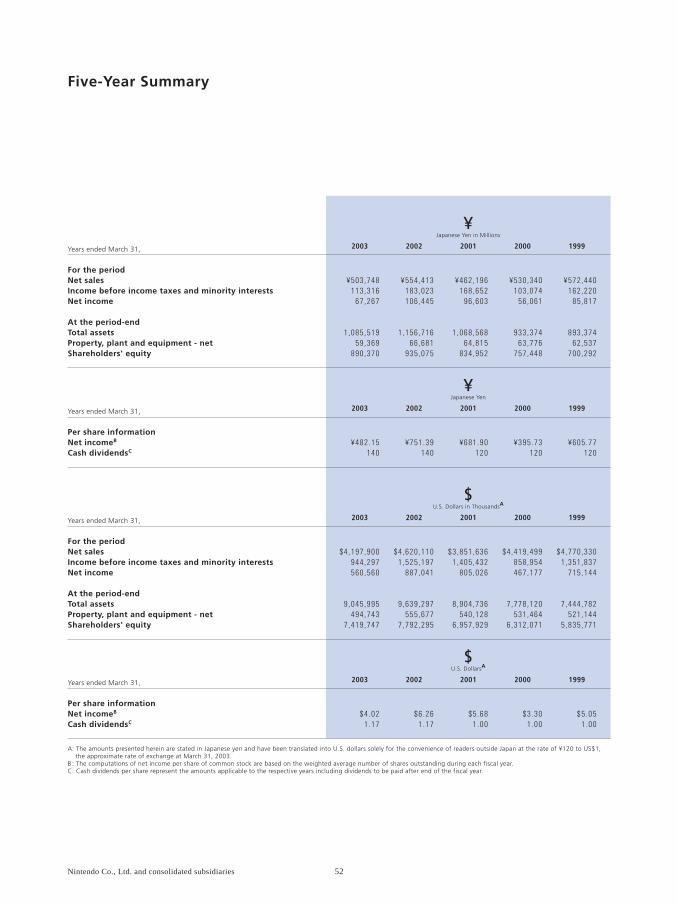
For the periodNet salesIncome before income taxes and minority interestsNet income
At the period-endTotal assetsProperty, plant and equipment - netShareholders' equity
Japanese Yen in Millions¥
Years ended March 31,
Five-Year Summary
¥503 ,748 113 ,316
67 ,267
1 ,085 ,519 59 ,369
890 ,370
2003
¥554 ,413 183 ,023 106 ,445
1 ,156 ,716 66 ,681
935 ,075
2002
¥462 ,196 168 ,652
96 ,603
1 ,068 ,568 64 ,815
834 ,952
2001
¥530 ,340 103 ,074
56 ,061
933 ,374 63 ,776
757 ,448
2000
¥572 ,440 162 ,220
85 ,817
893 ,374 62 ,537
700 ,292
1999
Per share informationNet incomeB
Cash dividendsC
Japanese Yen¥
Years ended March 31,
¥482 .15 140
2003
¥751 .39 140
2002
¥681 .90 120
2001
¥395 .73 120
2000
¥605 .77 120
1999
For the periodNet salesIncome before income taxes and minority interestsNet income
At the period-endTotal assetsProperty, plant and equipment - netShareholders' equity
U.S. Dollars in ThousandsA$
Years ended March 31,
$4 ,197 ,900 944 ,297 560 ,560
9 ,045 ,995 494 ,743
7 ,419 ,747
2003
$4 ,620 ,110 1 ,525 ,197
887 ,041
9 ,639 ,297 555 ,677
7 ,792 ,295
2002
$3 ,851 ,636 1 ,405 ,432
805 ,026
8 ,904 ,736 540 ,128
6 ,957 ,929
2001
$4 ,419 ,499 858 ,954 467 ,177
7 ,778 ,120 531 ,464
6 ,312 ,071
2000
$4 ,770 ,330 1 ,351 ,837
715 ,144
7 ,444 ,782 521 ,144
5 ,835 ,771
1999
Per share informationNet incomeB
Cash dividendsC
U.S. DollarsA$
Years ended March 31,
$4 .02 1 .17
2003
$6 .26 1 .17
2002
$5 .68 1 .00
2001
$3 .30 1 .00
2000
$5 .05 1 .00
1999
A: The amounts presented herein are stated in Japanese yen and have been translated into U.S. dollars solely for the convenience of readers outside Japan at the rate of ¥120 to US$1, the approximate rate of exchange at March 31, 2003.B : The computations of net income per share of common stock are based on the weighted average number of shares outstanding during each fiscal year.C: Cash dividends per share represent the amounts applicable to the respective years including dividends to be paid after end of the fiscal year.
52Nintendo Co., Ltd. and consolidated subsidiaries

Report of Independent Accountants
To the Board of Directors and Shareholders of Nintendo Co., Ltd.
We have audited the accompanying consolidated balance sheets of Nintendo Co., Ltd. and its subsidiaries as of March 31, 2003 and 2002, and the related consolidated statements of income, shareholders’ equity, and cash flows for the years then ended, all expressed in Japanese Yen. These consolidated financial statements are the responsibility of the Company’s management. Our responsibility is to express an opinion on these consolidated financial statements based on our audits. We conducted our audits in accordance with auditing standards, procedures and practices generally accepted and applied in Japan. Those standards require that we plan and perform the audit to obtain reasonable assurance about whether the consolidated financial statements are free of material misstatement. An audit includes examining, on a test basis, evidence supporting the amounts and disclosures in the consolidated financial statements. An audit also includes assessing the accounting principles used and significant estimates made by management, as well as evaluating the overall consolidated financial statement presentation. We believe that our audits provide a reasonable basis for our opinion.
In our opinion, the consolidated financial statements referred to above present fairly, in all material respects, the consolidated financial position of Nintendo Co., Ltd. and its subsidiaries as of March 31, 2003 and 2002, and the consolidated results of their operations and their cash flows for the years then ended in conformity with accounting principles and practices generally accepted in Japan (see Note 1).
The amounts expressed in U.S. dollars, which are provided solely for the convenience of the reader, have been translated on the basis set forth in Note 1 to the accompanying consolidated financial statements.
ChuoAoyama Audit CorporationKyoto, JapanJune 27, 2003
53Nintendo Co., Ltd. and consolidated subsidiaries

Japanese Yen in Millions¥
U.S. Dollars in Thousands (Note 1)
$As of March 31,
Consolidated Balance Sheets
2003 2002 2003 2002
See notes to consolidated financial statements.
AssetsCurrent Assets
Cash and cash equivalents
Short-term investments
Receivables -
Notes and trade accounts receivable
Allowance for doubtful accounts
Inventories (Note 5)
Deferred income taxes (Note 8)
Other current assets
Total current assets
Property, Plant and Equipment
Land
Buildings and structures
Machinery, equipment and automobiles
Construction in progress
Total
Accumulated depreciation
Property, plant and equipment - net
Investments and Other Assets
Investments in securities (Note 3)
Deferred income taxes (Note 8)
Other assets
Total investments and other assets
Total
¥748 ,600
8 ,316
49 ,085
(5 ,463 )
104 ,525
31 ,158
33 ,088
969 ,309
33 ,135
40 ,138
21 ,077
7
94 ,357
(34 ,988 )
59 ,369
38 ,552
14 ,712
3 ,577
56 ,841
¥1 ,085 ,519
¥863 ,116
41 ,540
45 ,861
(6 ,252 )
43 ,869
34 ,467
15 ,169
1 ,037 ,770
35 ,045
42 ,888
22 ,277
1
100 ,211
(33 ,530 )
66 ,681
32 ,590
12 ,497
7 ,178
52 ,265
¥1 ,156 ,716
$6 ,238 ,336
69 ,301
409 ,045
(45 ,531 )
871 ,039
259 ,653
275 ,732
8 ,077 ,575
276 ,124
334 ,487
175 ,639
61
786 ,311
(291 ,568 )
494 ,743
321 ,266
122 ,602
29 ,809
473 ,677
$9 ,045 ,995
$7 ,192 ,635
346 ,166
382 ,177
(52 ,096 )
365 ,573
287 ,226
126 ,402
8 ,648 ,083
292 ,043
357 ,399
185 ,642
11
835 ,095
(279 ,418 )
555 ,677
271 ,581
104 ,141
59 ,815
435 ,537
$9 ,639 ,297
54Nintendo Co., Ltd. and consolidated subsidiaries
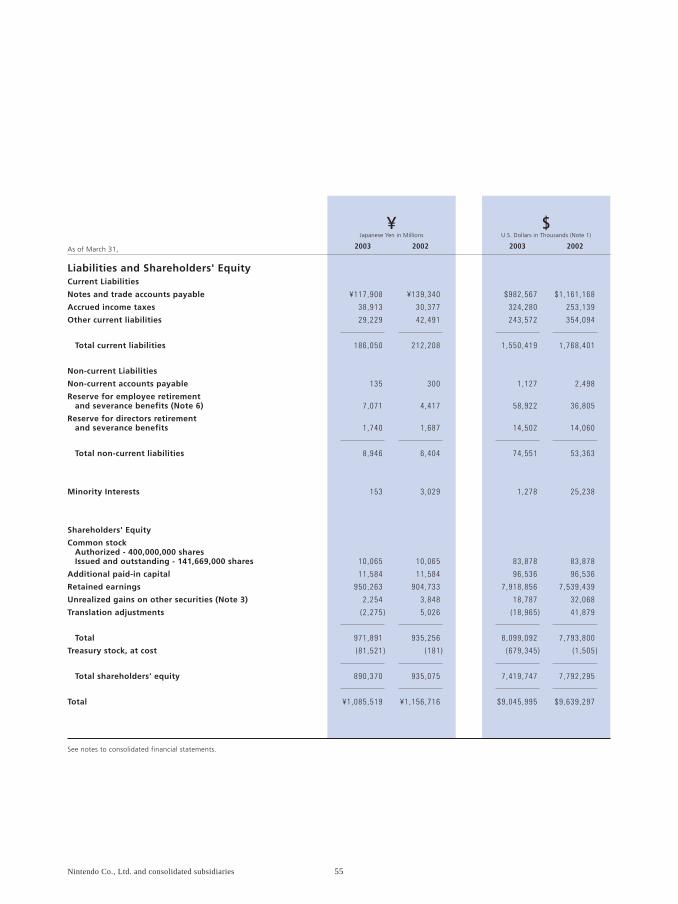
Liabilities and Shareholders' EquityCurrent Liabilities
Notes and trade accounts payable
Accrued income taxes
Other current liabilities
Total current liabilities
Non-current Liabilities
Non-current accounts payable
Reserve for employee retirement and severance benefits (Note 6)
Reserve for directors retirement and severance benefits
Total non-current liabilities
Minority Interests
Shareholders' Equity
Common stock Authorized - 400,000,000 shares Issued and outstanding - 141,669,000 shares
Additional paid-in capital
Retained earnings
Unrealized gains on other securities (Note 3)
Translation adjustments
Total
Treasury stock, at cost
Total shareholders' equity
Total
Japanese Yen in Millions¥
U.S. Dollars in Thousands (Note 1)
$As of March 31,
¥117 ,908
38 ,913
29 ,229
186 ,050
135
7 ,071
1 ,740
8 ,946
153
10 ,065
11 ,584
950 ,263
2 ,254
(2 ,275 )
971 ,891
(81 ,521 )
890 ,370
¥1 ,085 ,519
2003
¥139 ,340
30 ,377
42 ,491
212 ,208
300
4 ,417
1 ,687
6 ,404
3 ,029
10 ,065
11 ,584
904 ,733
3 ,848
5 ,026
935 ,256
(181 )
935 ,075
¥1 ,156 ,716
2002
$982 ,567
324 ,280
243 ,572
1 ,550 ,419
1 ,127
58 ,922
14 ,502
74 ,551
1 ,278
83 ,878
96 ,536
7 ,918 ,856
18 ,787
(18 ,965 )
8 ,099 ,092
(679 ,345 )
7 ,419 ,747
$9 ,045 ,995
2003
$1 ,161 ,168
253 ,139
354 ,094
1 ,768 ,401
2 ,498
36 ,805
14 ,060
53 ,363
25 ,238
83 ,878
96 ,536
7 ,539 ,439
32 ,068
41 ,879
7 ,793 ,800
(1 ,505 )
7 ,792 ,295
$9 ,639 ,297
2002
See notes to consolidated financial statements.
55Nintendo Co., Ltd. and consolidated subsidiaries

Net sales
Cost of sales (Notes 5 and 7)
Gross margin
Selling, general and administrative expenses (Note 7)
Operating income
Other income (expenses)
Interest income
Foreign exchange gain (loss) - net
Gain on sales of investments in affiliates
Unrealized loss on investments in securities (Note 3)
Other - net
Income before income taxes and minority interests
Income taxes (Note 8)
Current
Deferred
Total income taxes
Minority interests
Net income
Japanese Yen in Millions¥
U.S. Dollars in Thousands (Note1)
$Years ended March 31,
Consolidated Statements of Income
¥503 ,748
308 ,124
195 ,624
95 ,372
100 ,252
15 ,943
(22 ,620 )
19 ,082
(865 )
1 ,524
113 ,316
45 ,019
955
45 ,974
75
¥67 ,267
2003
¥554 ,413
334 ,187
220 ,226
100 ,619
119 ,607
22 ,905
43 ,419
-
(4 ,458 )
1 ,550
183 ,023
74 ,351
2 ,446
76 ,797
(219 )
¥106 ,445
2002
$4 ,197 ,900
2 ,567 ,701
1 ,630 ,199
794 ,763
835 ,436
132 ,856
(188 ,501 )
159 ,018
(7 ,207 )
12 ,695
944 ,297
375 ,156
7 ,957
383 ,113
624
$560 ,560
2003
$4 ,620 ,110
2 ,784 ,891
1 ,835 ,219
838 ,495
996 ,724
190 ,873
361 ,829
-
(37 ,152 )
12 ,923
1 ,525 ,197
619 ,597
20 ,381
639 ,978
(1 ,822 )
$887 ,041
2002
See notes to consolidated financial statements.
Per share information
Net income (Note 2M)
Cash dividends (Note 2M)
Japanese Yen¥
U.S. Dollars (Note 1)
$Years ended March 31,
¥482 .15
140
2003
¥751 .39
140
2002
$4 .02
1 .17
2003
$6 .26
1 .17
2002
56Nintendo Co., Ltd. and consolidated subsidiaries

Consolidated Statements of Shareholders' Equity
Balance, April 1, 2001 Net income Cash dividends Directors' bonuses Unrealized gains on other securities Translation adjustments Net changes in treasury stock
Balance, March 31, 2002 Net income Cash dividends Directors' bonuses Decrease in retained earnings due to exclusion of affiliate with equity method applied Unrealized gains on other securities Translation adjustments Net changes in treasury stock
Balance, March 31, 2003
Japanese Yen in Millions¥
Years ended March 31, 2003 and 2002
¥(4,576)
9,602
5,026
(7,301)
¥(2,275)
Translationadjustments
¥2,438
1,410
3,848
(1,594)
¥2,254
Unrealizedgains on
other securities
¥815,458 106,445 (17,000)
(170)
904,733 67,267
(21,249)(170)
(318)
¥950,263
Retainedearnings
¥11,584
11,584
¥11,584
Additionalpaid-incapital
¥10,065
10,065
¥10,065
Commonstock
141,669
141,669
141,669
Number ofcommon shares
in thousands
¥(17)
(164)
(181)
(81,340)
¥(81,521)
Treasurystock at cost
See notes to consolidated financial statements.
Balance, April 1, 2001 Net income Cash dividends Directors' bonuses Unrealized gains on other securities Translation adjustments Net changes in treasury stock
Balance, March 31, 2002 Net income Cash dividends Directors' bonuses Decrease in retained earnings due to exclusion of affiliate with equity method applied Unrealized gains on other securities Translation adjustments Net changes in treasury stock
Balance, March 31, 2003
U.S. Dollars in Thousands (Note1)
$
Years ended March 31, 2003 and 2002
$(38,146)
80,025
41,879
(60,844)
$(18,965)
Translationadjustments
$20,320
11,748
32,068
(13,281)
$18,787
Unrealizedgains on
other securities
$6,795,482 887,041
(141,667)(1,417)
7,539,439 560,560
(177,073)(1,417)
(2,653)
$7,918,856
Retainedearnings
$96,536
96,536
$96,536
Additionalpaid-incapital
$83,878
83,878
$83,878
Commonstock
$(140)
(1,365)
(1,505)
(677,840)
$(679,345)
Treasurystock at cost
57Nintendo Co., Ltd. and consolidated subsidiaries

Cash Flows from Operating Activities Net income Depreciation and amortization Increase in allowance for doubtful accounts Increase in reserve for employee retirement and severance benefits Deferred income taxes Foreign exchange losses (gains) Unrealized loss on investments in securities Gain on sales of investments in affiliates Decrease (increase) in notes and trade accounts receivable Decrease (increase) in inventories Increase (decrease) in notes and trade accounts payable Increase (decrease) in accrued income taxes Other, net
Net cash provided by (used in) operating activities
Cash Flows from Investing Activities Payments for short-term investments Proceeds from short-term investments Payments for purchase of property, plant and equipment Payments for investments in securities Proceeds from investments in securities Sales of business entities Other, net
Net cash provided by (used in) investing activities
Cash Flows from Financing Activities Proceeds from stock issued to minority interests Payments for purchase of treasury stock Proceeds from sale of treasury stock Cash dividends paid
Net cash used in financing activities
Effect of exchange rate changes on cash and cash equivalents
Net increase (decrease) of cash and cash equivalents
Cash and cash equivalents at beginning of year
Decrease in cash and cash equivalents due to change in scope of consolidation
Cash and cash equivalents at end of year
Japanese Yen in Millions¥
U.S. Dollars in Thousands (Note 1)
$Years ended March 31,
Consolidated Statements of Cash Flows
¥67 ,267 4 ,712
105 2 ,885
955 20 ,226
865 (19 ,082 )
(4 ,841 )(58 ,671 )(15 ,445 )
8 ,483 (31 ,016 )
(23 ,557 )
(199 ,149 )229 ,229
(2 ,138 )(17 ,528 )
8 ,659 17 ,266
(250 )
36 ,089
- (81 ,388 )
- (21 ,233 )
(102 ,621 )
(24 ,207 )
(114 ,296 )
863 ,116
(220 )
¥748 ,600
2003 2002 2003 2002
Additional Cash Flow Information Interest paid Income taxes paid
Japanese Yen in Millions¥
U.S. Dollars in Thousands (Note 1)
$Years ended March 31,
¥ 2 36 ,536
2003
¥ 0 109 ,774
2002
$ 16 304 ,468
2003
$ 3 914 ,780
2002
See notes to consolidated financial statements.
¥106 ,445 5 ,639
249 214
2 ,446 (42 ,093 )
4 ,458 -
10 ,983 (21 ,309 )22 ,189
(35 ,422 )2 ,435
56 ,234
(200 ,706 )214 ,259 (13 ,096 )(24 ,033 )17 ,968
- 490
(5 ,118 )
5 (270 )113
(16 ,995 )
(17 ,147 )
43 ,155
77 ,124
785 ,992
-
¥863 ,116
$560 ,560 39 ,271
879 24 ,040
7 ,957 168 ,547
7 ,207 (159 ,018 )
(40 ,343 )(488 ,927 )(128 ,711 )
70 ,688 (258 ,461 )
(196 ,311 )
(1 ,659 ,578 )1 ,910 ,241
(17 ,818 )(146 ,065 )
72 ,158 143 ,881
(2 ,080 )
300 ,739
- (678 ,231 )
- (176 ,941 )
(855 ,172 )
(201 ,719 )
(952 ,463 )
7 ,192 ,635
(1 ,836 )
$6 ,238 ,336
$887 ,041 46 ,992
2 ,072 1 ,781
20 ,381 (350 ,779 )
37 ,152 -
91 ,525 (177 ,572 )184 ,913
(295 ,182 )20 ,297
468 ,621
(1 ,672 ,551 )1 ,785 ,493
(109 ,134 )(200 ,275 )149 ,734
- 4 ,084
(42 ,649 )
42 (2 ,250 )
943 (141 ,624 )
(142 ,889 )
359 ,617
642 ,700
6 ,549 ,935
-
$7 ,192 ,635
58Nintendo Co., Ltd. and consolidated subsidiaries

Years ended March 31, 2003 and 2002
Notes to Consolidated Financial Statements
A. Principles of ConsolidationThe accompanying consolidated financial statements include the accounts of the Company and all subsidiaries (total 21 in 2003 and 24 in 2002) except for two. The equity method of accounting has been applied to one of the non-consolidated subsidiaries and to all affiliates (total 10 in 2003 and 14 in 2002) except for three. The remaining subsidiary and affiliates are immaterial and investments in them are carried at cost in the accompanying consolidated balance sheets. The principal consolidated subsidiaries and the principal affiliate for which the equity method of accounting was used for the year ended March 31, 2003 were as follows:
Investment costs in excess of underlying net assets of consolidated subsidiaries and affiliates acquired are charged to income for the year as incurred. All significant intercompany transactions, accounts and unrealized profits have been eliminated in consolidation. The amounts of certain subsidiaries have been included on the basis of fiscal periods ended within three months prior to March 31.
Note 2. Significant Accounting Policies
The accompanying consolidated financial statements are prepared from the consolidated financial statements issued in Japan for domestic reporting purposes. Nintendo Co., Ltd. (the “Company”) and its subsidiaries in Japan maintain their accounts and records in accordance with the provisions set forth in the Japanese Commercial Code and the Securities and Exchange Law, and in conformity with generally accepted accounting principles and practices in Japan, which are different in certain respects from the application and disclosure requirements of International Accounting Standards. Its overseas consolidated subsidiaries maintain their accounts in conformity with the generally accepted accounting principles and practices prevailing in the respective countries of domicile and no adjustment has been made to their financial statements in consolidation, as allowed under accounting principles and practices generally accepted in Japan. The consolidated financial statements are not intended to present the consolidated financial position, results of operations and cash flows in accordance with accounting principles and practices generally accepted in countries and jurisdictions other than Japan. In preparing the accompanying consolidated financial statements, certain reclassifications have been made to the consolidated financial statements issued domestically in order to present them in a form which is more familiar to readers outside Japan. The consolidated financial statements presented herein are stated in Japanese yen, the currency of the country in which the Company is incorporated and operates. The translations of Japanese yen amounts into U.S. dollar amounts are included solely for the convenience of readers outside Japan and have been made at the rate of ¥120 to US$1, the approximate rate of exchange at March 31, 2003. These translations should not be construed as representations that the Japanese yen amounts have been, could have been or could in the future be, converted into U.S. dollars at this or any other rate of exchange.
Note 1. Basis of Presenting Consolidated Financial Statements
Nintendo o f Amer ica Inc .Nintendo Bene lux B .V.Nintendo España, S .A .Nintendo F rance S .A .R .L .
Nintendo Aust ra l ia P ty . L td .Nintendo o f Canada L td .Nintendo o f Europe GmbH
Consolidated subsidiaries
Affiliate
The Pokémon Company
59Nintendo Co., Ltd. and consolidated subsidiaries

Years ended March 31, 2003 and 2002
Notes to Consolidated Financial Statements
B. Translation of Foreign Currency ItemsIn accordance with the Japanese accounting standard, short-term and long-term monetary receivables and payables denominated in foreign currencies are translated into Japanese yen at the exchange rate in effect at the balance sheet date. The foreign exchange gains and losses from translation are recognized in the statements of income to the extent that they are not hedged by forward exchange contracts. With respect to financial statements of overseas subsidiaries, the balance sheet accounts are translated into Japanese yen at the exchange rates in effect at the balance sheet date except for shareholders' equity, which are translated at the historical rates. The average exchange rates for the fiscal period are used for translation of revenue and expenses. The differences resulting from translation in this manner are included in “Minority Interests” and “Translation adjustments” which are listed in Shareholders’ Equity in the accompanying consolidated balance sheets.
C. Cash and Cash EquivalentsCash and cash equivalents include cash on hand, deposit which can be withdrawn on demand, time deposit with an original maturity of three months or less and certain investments. Investments are defined as those that are easily accessible, with little risk of fluctuation in value and the maturity date is within three months of the acquisition date.
D. Financial InstrumentsDerivativesAll derivatives are stated at fair value, with changes in fair value included in net profit or loss for the period in which they arise.
SecuritiesHeld-to-maturity debt securities are stated at cost after accounting for premium or discount on acquisition, which is amortized over the period to maturity. Equity securities of non-consolidated subsidiary and affiliated companies with equity method non-applied are stated at cost. Other securities for which market quotations are available are stated at fair value. Unrealized gains on other securities are reported as “Unrealized gains on other securities” in Shareholders’ Equity at a net-of-tax amount, while unrealized losses on other securities are included in net profit or loss for the period. Other securities for which market quotations are unavailable are stated at cost, determined by the moving average method except as stated in the paragraph below. In case where the fair value of held-to-maturity debt securities, equity securities issued by non-consolidated subsidiaries and affiliates, or other securities has declined significantly and such impairment of the value is not deemed temporary, those securities are written down to the fair value and the resulting losses are included in net profit or loss for the period. Under the Japanese accounting standard, trading securities and debt securities due within one year are presented as “current” and all the other securities are presented as “non-current.”
E. InventoriesInventories are stated at the lower of cost, determined by the moving average method, or market.
60Nintendo Co., Ltd. and consolidated subsidiaries
F. Property, Plant and EquipmentProperty, plant and equipment are stated at cost. The Company and its consolidated subsidiaries in Japan compute depreciation by the declining balance method over the estimated useful lives. The straight-line method of depreciation is used for buildings, except for structures, acquired on or after April 1, 1998. Overseas consolidated subsidiaries compute depreciation of assets by applying the straight-line method over the period of estimated useful lives. Estimated useful lives of the principal assets are as follows: Buildings and structures: 3 to 60 years
G. Income TaxesDeferred income taxes are recorded to reflect the impact of temporary differences between assets and liabilities recognized for financial reporting purposes and such amounts recognized for tax purposes. These deferred taxes are measured by applying currently enacted tax laws to the temporary differences.
H. Retirement and Severance Benefits and Pension PlanThe Company and certain consolidated subsidiaries are calculating the reserve for employee retirement and severance benefits with actuarially calculated amounts on the basis of the cost of retirement benefit and plan assets at end of fiscal year. Benefits under the plan are generally based on the current rate of base salary, length of service and certain other factors when the termination occurs. Directors and corporate auditors customarily receive lump-sum payments upon termination of their services subject to shareholders’ approval. The Company provides for the reserve for lump-sum severance benefits for directors and corporate auditors at the estimated amount required if all retired at the fiscal year-end.
I. Research and Development and Computer SoftwareExpenses relating to research and development activities are charged to income as incurred. Computer software for the internal use included in other assets is amortized using the straight-line method over the estimated useful lives.
J. Leases All leases are accounted for as operating leases. Under Japanese accounting standards for leases, finance leases that are deemed to transfer ownership of the leased assets to the lessee are to be capitalized, while other finance leases are permitted to be accounted for as operating lease transactions if certain “as if capitalized” information is disclosed in the notes to the lessee’s financial statements.
K. Treasury stock and Legal reservesFrom the year ended March 31, 2003, the Company and its subsidiaries in Japan adopted the new Japanese Accounting Standards for Treasury stock and Legal reserves. The effect on net profit or loss of this application is minor.
L. Appropriations of Retained EarningsAppropriations of retained earnings are reflected in the consolidated financial statements for the following year upon shareholders’ approval.
M. Per Share InformationThe computations of net income per share of common stock are based on the weighted average number of shares outstanding during each fiscal year. The average number of common stock used in the computation for the years ended March 31, 2003 and 2002 were 139,162 thousand and 141,665 thousand, respectively. From the year ended March 31, 2003, the Company and its consolidated subsidiaries in Japan adopted the new Japanese Accounting Standard for net income per share of common stock. The effect on net income per share of common stock is minor. Cash dividends per share represent the amounts applicable to the respective years including dividends to be paid after end of the fiscal year.
61Nintendo Co., Ltd. and consolidated subsidiaries

Other securities with market value included in Investments in securities as of March 31, 2003 and 2002 were as follows:
Note 3. Market Value Information on Securities
Japanese Yen in Millions¥
Equity securities
Total
¥13 ,173
¥13 ,173
¥3 ,789
¥3 ,789
¥307
¥307
¥16 ,655
¥16 ,655
As of March 31, 2003Cost Fair value
Grossunrealized
losses
Grossunrealized
gains
Japanese Yen in Millions¥
Equity securities
Total
¥13 ,848
¥13 ,848
¥6 ,635
¥6 ,635
¥122
¥122
¥20 ,361
¥20 ,361
As of March 31, 2002Cost Fair value
Grossunrealized
losses
Grossunrealized
gains
U.S. Dollars in Thousands (Note 1)
$
Equity securities
Total
$109 ,773
$109 ,773
$31 ,575
$31 ,575
$2 ,558
$2 ,558
$138 ,790
$138 ,790
As of March 31, 2003Cost Fair value
Grossunrealized
losses
Grossunrealized
gains
U.S. Dollars in Thousands (Note 1)
$
Equity securities
Total
$115 ,399
$115 ,399
$55 ,290
$55 ,290
$1 ,016
$1 ,016
$169 ,673
$169 ,673
As of March 31, 2002Cost Fair value
Grossunrealized
losses
Grossunrealized
gains
62Nintendo Co., Ltd. and consolidated subsidiaries
Years ended March 31, 2003 and 2002
Notes to Consolidated Financial Statements

Only the Company enters into foreign exchange forward contracts and currency option contracts. It is the Company’s policy to enter into derivative transactions within the limits of foreign currency deposits, and not for speculative purposes. The Company has foreign exchange forward contracts to reduce risk of exchange rate fluctuations and currency option contracts to reduce risk of exchange rate fluctuations and yield improvement of short-term financial assets. Foreign exchange forward contracts and currency option contracts bear risks resulting from exchange rate fluctuations. Counterparties to derivative transactions are limited to high confidence level financial institutions. The Company does not anticipate any risk due to default. Derivative transactions entered into by the Company are made only by the treasury department under approval by the president and a director in charge of those transactions.
Note 4. Derivatives
Losses incurred from the application of the lower of cost or market valuation of inventories have been charged to cost of sales in the accompanying consolidated statements of income. These losses amounted to ¥12,515 million ($104,290 thousand) and ¥9,878 million ($82,319 thousand) for the years ended March 31, 2003 and 2002, respectively.
Note 5. Inventories
63Nintendo Co., Ltd. and consolidated subsidiaries
The Company had no derivative contracts outstanding at March 31, 2003 and 2002.

As of March 31,
¥ (18 ,055 )
9 ,053
(9 ,002 )
1 ,118
813
¥ (7 ,071 )
¥ (15 ,550 )
9 ,931
(5 ,619 )
921
281
¥ (4 ,417 )
$ (150 ,460 )
75 ,443
(75 ,017 )
9 ,322
6 ,773
$ (58 ,922 )
$ (129 ,585 )
82 ,760
(46 ,825 )
7 ,673
2 ,347
$ (36 ,805 )
. Retirement benefit obligation
. Plan assets
. Unfunded retirement benefit obligation
. Unrecognized actuarial difference
. Unrecognized prior service cost (decrease of obligation)
. Reserve for employee retirement and severance benefits
a
b
c
d
e
f
. Service cost
. Interest cost
. Expected return on plan assets
. Amortization of actuarial difference
. Amortization of prior service cost
. Retirement benefit cost
a
b
c
d
e
f
Years ended March 31,
¥1 ,125
548
(255 )
2 ,706
218
¥4 ,342
¥1 ,095
551
(282 )
613
511
¥2 ,488
$9 ,375
4 ,567
(2 ,127 )
22 ,551
1 ,814
$36 ,180
$9 ,126
4 ,591
(2 ,351 )
5 ,112
4 ,257
$20 ,735
Retirement benefit obligations as of March 31, 2003 and 2002 were as follows:
Retirement benefit cost for the years ended March 31, 2003 and 2002 were as follows:
The Company has a tax approved pension scheme and lump-sum severance payments plan which is a defined benefit plan. It may also pay extra retirement allowance to employees who have distinguished services. Certain overseas consolidated subsidiaries have defined contribution plans as well as defined benefit plans.
Note 6. Retirement and Severance Benefits and Pension Plan
Japanese Yen in Millions¥
2003 2002
Japanese Yen in Millions¥
2003 2002
U.S. Dollars in Thousands (Note 1)
$2003 2002
U.S. Dollars in Thousands (Note 1)
$2003 2002
64Nintendo Co., Ltd. and consolidated subsidiaries
Years ended March 31, 2003 and 2002
Notes to Consolidated Financial Statements
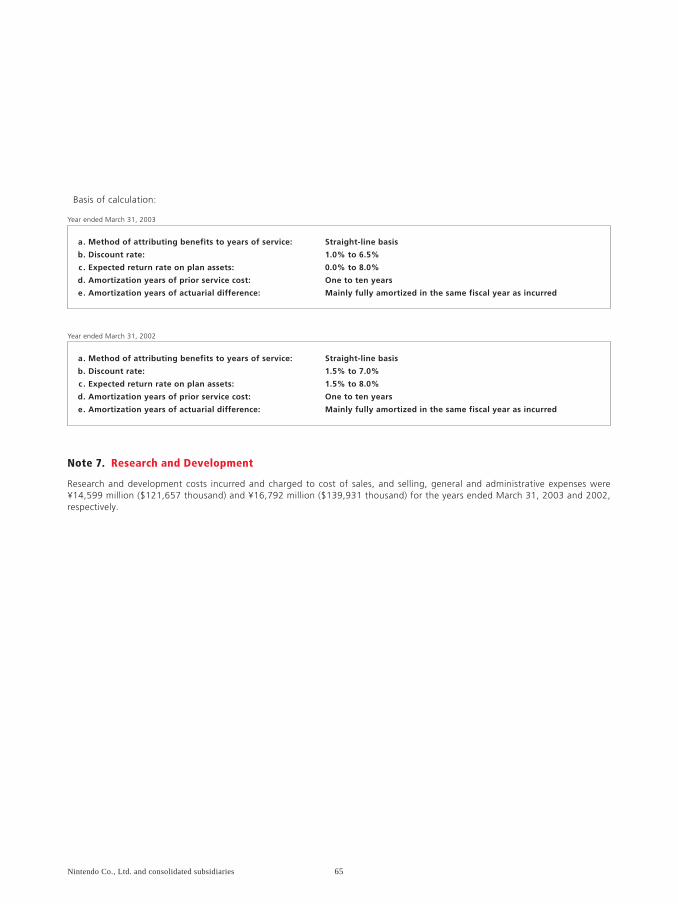
Research and development costs incurred and charged to cost of sales, and selling, general and administrative expenses were ¥14,599 million ($121,657 thousand) and ¥16,792 million ($139,931 thousand) for the years ended March 31, 2003 and 2002, respectively.
Note 7. Research and Development
a
b
c
d
e
. Method of attributing benefits to years of service:
. Discount rate:
. Expected return rate on plan assets:
. Amortization years of prior service cost:
. Amortization years of actuarial difference:
Straight-line basis
1.0% to 6.5%
0.0% to 8.0%
One to ten years
Mainly fully amortized in the same fiscal year as incurred
Year ended March 31, 2003
. Method of attributing benefits to years of service:
. Discount rate:
. Expected return rate on plan assets:
. Amortization years of prior service cost:
. Amortization years of actuarial difference:
a
b
c
d
e
Straight-line basis
1.5% to 7.0%
1.5% to 8.0%
One to ten years
Mainly fully amortized in the same fiscal year as incurred
Year ended March 31, 2002
Basis of calculation:
65Nintendo Co., Ltd. and consolidated subsidiaries
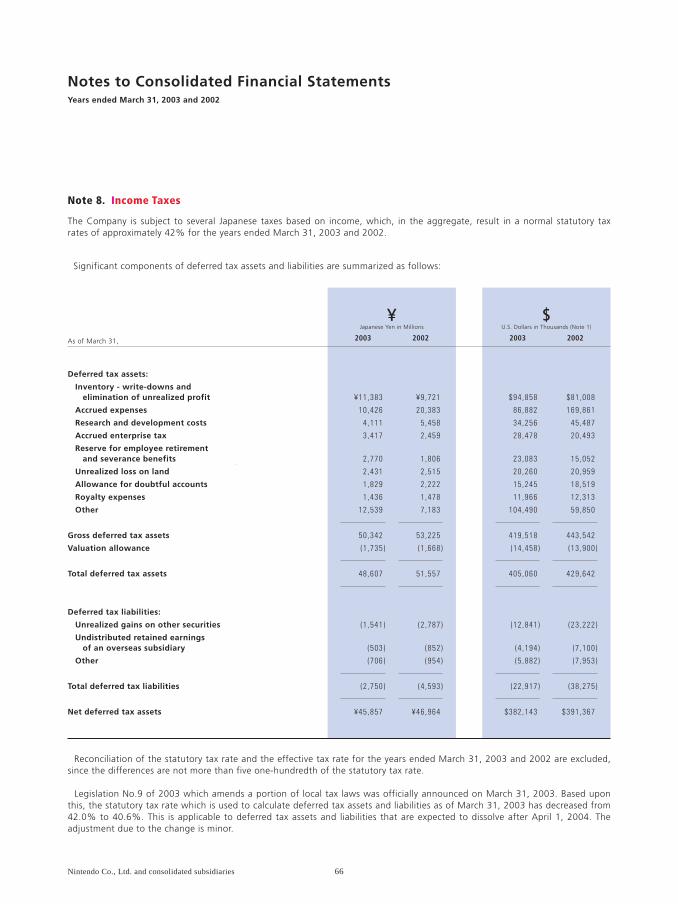
Reconciliation of the statutory tax rate and the effective tax rate for the years ended March 31, 2003 and 2002 are excluded, since the differences are not more than five one-hundredth of the statutory tax rate.
Legislation No.9 of 2003 which amends a portion of local tax laws was officially announced on March 31, 2003. Based upon this, the statutory tax rate which is used to calculate deferred tax assets and liabilities as of March 31, 2003 has decreased from 42.0% to 40.6%. This is applicable to deferred tax assets and liabilities that are expected to dissolve after April 1, 2004. The adjustment due to the change is minor.
The Company is subject to several Japanese taxes based on income, which, in the aggregate, result in a normal statutory tax rates of approximately 42% for the years ended March 31, 2003 and 2002.
Note 8. Income Taxes
Deferred tax assets:
Inventory - write-downs and elimination of unrealized profit
Accrued expenses
Research and development costs
Accrued enterprise tax
Reserve for employee retirement and severance benefits
Unrealized loss on land
Allowance for doubtful accounts
Royalty expenses
Other
Gross deferred tax assets
Valuation allowance
Total deferred tax assets
Deferred tax liabilities:
Unrealized gains on other securities
Undistributed retained earnings of an overseas subsidiary
Other
Total deferred tax liabilities
Net deferred tax assets
Japanese Yen in Millions¥
U.S. Dollars in Thousands (Note 1)
$As of March 31,
¥11 ,383
10 ,426
4 ,111
3 ,417
2 ,770
2 ,431
1 ,829
1 ,436
12 ,539
50 ,342
(1 ,735 )
48 ,607
(1 ,541 )
(503 )
(706 )
(2 ,750 )
¥45 ,857
2003
¥9 ,721
20 ,383
5 ,458
2 ,459
1 ,806
2 ,515
2 ,222
1 ,478
7 ,183
53 ,225
(1 ,668 )
51 ,557
(2 ,787 )
(852 )
(954 )
(4 ,593 )
¥46 ,964
2002
$94 ,858
86 ,882
34 ,256
28 ,478
23 ,083
20 ,260
15 ,245
11 ,966
104 ,490
419 ,518
(14 ,458 )
405 ,060
(12 ,841 )
(4 ,194 )
(5 ,882 )
(22 ,917 )
$382 ,143
2003
$81 ,008
169 ,861
45 ,487
20 ,493
15 ,052
20 ,959
18 ,519
12 ,313
59 ,850
443 ,542
(13 ,900 )
429 ,642
(23 ,222 )
(7 ,100 )
(7 ,953 )
(38 ,275 )
$391 ,367
2002
Significant components of deferred tax assets and liabilities are summarized as follows:
66Nintendo Co., Ltd. and consolidated subsidiaries
Years ended March 31, 2003 and 2002
Notes to Consolidated Financial Statements

The Company and certain consolidated subsidiaries lease computer equipment and other assets. Total lease payments under finance leases not deemed to transfer ownership of the leased assets to the lessee for the years ended March 31, 2003 and 2002 were ¥269 million ($2,239 thousand) and ¥215 million ($1,789 thousand), respectively.
Pro forma amounts of obligations under finance leases that do not transfer ownership of the leased assets to the lessee on an “as if capitalized” basis as of March 31, 2003 and 2002 were as follows:
Note 9. Leases
Acquisition cost
Accumulated depreciation
Net leased assets
¥1 ,033
579
¥454
¥830
412
¥418
$8 ,610
4 ,823
$3 ,787
$6 ,912
3 ,432
$3 ,480
U.S. Dollars in Thousands (Note 1)
$Japanese Yen in Millions
¥
U.S. Dollars in Thousands (Note 1)
$Japanese Yen in Millions
¥
U.S. Dollars in Thousands (Note 1)
$Japanese Yen in Millions
¥
As of March 31, 2003 2002 2003 2002
Due within one year
Due after one year
Total
¥237
217
¥454
¥221
197
¥418
$1 ,974
1 ,813
$3 ,787
$1 ,841
1 ,639
$3 ,480
As of March 31, 2003 2002 2003 2002
Due within one year
Due after one year
Total
¥621
4 ,336
¥4 ,957
¥459
4 ,225
¥4 ,684
$5 ,175
36 ,131
$41 ,306
$3 ,827
35 ,205
$39 ,032
As of March 31, 2003 2002 2003 2002
Pro forma information of leased assets under finance leases that do not transfer ownership of the leased assets to the lessee on an “as if capitalized” basis as of March 31, 2003 and 2002 was as follows:
The minimum rental commitments under noncancelable operating leases at March 31, 2003 and 2002 were as follows:
67Nintendo Co., Ltd. and consolidated subsidiaries

At the annual general meeting held on June 27, 2003, shareholders of the Company approved the year-end cash dividends and directors' bonuses proposed by the Board of Directors of the Company as follows:
At the same meeting, the Company was authorized to acquire its own shares after June 27, 2003, upon resolution of the Board of Directors, to a maximum of 14,000 thousand shares at the purchase cost of less than ¥110,000 million ($916,667 thousand).
A. Segment Information by Business CategoriesBecause the Company and its consolidated subsidiaries operate predominantly in one industry segment which accounts for over 90% of total net sales, operating income and assets, this information is not required.
Note 11. Subsequent Events
Note 12. Segment Information
Japanese Yen in Millions¥
Year-end cash dividends, ¥70 ($0.58) per share
Directors' bonuses
¥9 ,403
170
$78 ,362
1 ,417
U.S. Dollars in Thousands (Note 1)
$
The Company and its consolidated subsidiaries have been strengthening their compliance with corrective measures. Their past trade practices in Europe were internally investigated and the result of the investigation was reported to Commission of the European Communities in January 1998. Then the Commission announced to impose a fine of EUR149 million on October 30, 2002 after issuing Statement of Objections in April 2000 referring that the acts fell upon “limitation of competition within the EU common market” which is prohibited by Article 81 in the EU treaty. The Company and its consolidated subsidiary found this fine to be unjustly high and appealed to the Court of First Instance of the European Communities on January 16, 2003.
Note 10. Litigation
68Nintendo Co., Ltd. and consolidated subsidiaries
Years ended March 31, 2003 and 2002
Notes to Consolidated Financial Statements

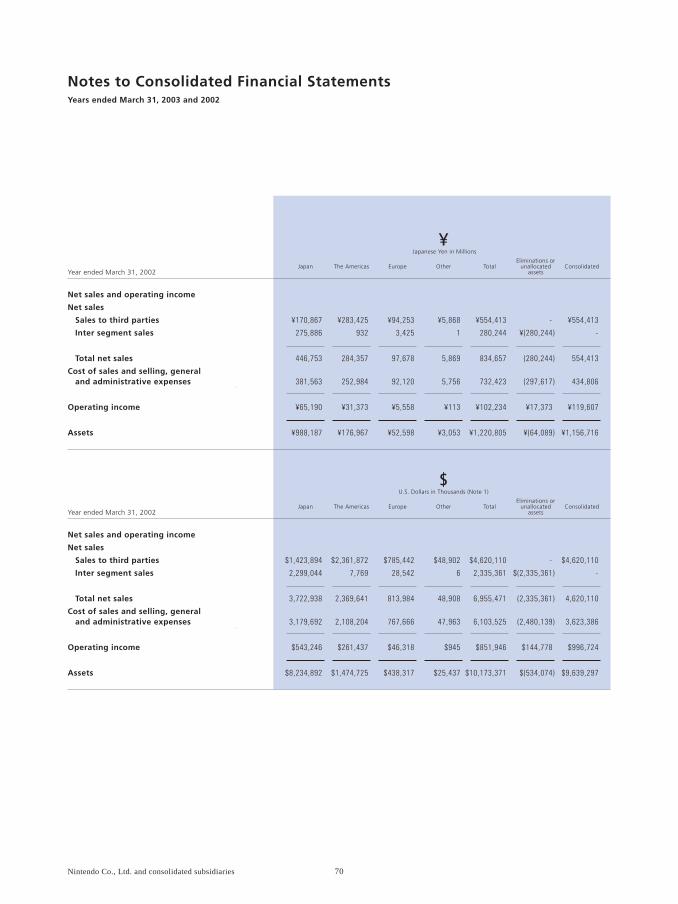
B. Segment Information by Seller’s Location
Net sales and operating income
Net sales
Sales to third parties
Inter segment sales
Total net sales
Cost of sales and selling, general and administrative expenses
Operating income
Assets
Japanese Yen in Millions¥
Year ended March 31, 2003
-
¥(353,303)
(353,303)
(357,446)
¥4,143
¥(94,090)
Eliminations orunallocated
assets
¥503,748
353,303
857,051
760,942
¥96,109
¥1,179,609
Total
¥5,454
-
5,454
5,878
¥(424)
¥3,907
Other
¥121,172
20
121,192
120,990
¥202
¥85,153
Europe
¥245,724
2,397
248,121
237,662
¥10,459
¥166,493
The Americas
¥131,398
350,886
482,284
396,412
¥85,872
¥924,056
Japan
¥503,748
-
503,748
403,496
¥100,252
¥1,085,519
Consolidated
Net sales and operating income
Net sales
Sales to third parties
Inter segment sales
Total net sales
Cost of sales and selling, general and administrative expenses
Operating income
Assets
U.S. Dollars in Thousands (Note 1)
$
Year ended March 31, 2003
-
$(2,944,195)
(2,944,195)
(2,978,723)
$34,528
$(784,083)
Eliminations orunallocated
assets
$4,197,900
2,944,195
7,142,095
6,341,187
$800,908
$9,830,078
Total
$45,453
-
45,453
48,990
$(3,537)
$32,567
Other
$1,009,772
164
1,009,936
1,008,249
$1,687
$709,605
Europe
$2,047,696
19,978
2,067,674
1,980,517
$87,157
$1,387,444
The Americas
$1,094,979
2,924,053
4,019,032
3,303,431
$715,601
$7,700,462
Japan
$4,197,900
-
4,197,900
3,362,464
$835,436
$9,045,995
Consolidated
69Nintendo Co., Ltd. and consolidated subsidiaries
Net sales and operating income
Net sales
Sales to third parties
Inter segment sales
Total net sales
Cost of sales and selling, general and administrative expenses
Operating income
Assets
U.S. Dollars in Thousands (Note 1)
$
Year ended March 31, 2002
-
$(2,335,361)
(2,335,361)
(2,480,139)
$144,778
$(534,074)
Eliminations orunallocated
assets
$4,620,110
2,335,361
6,955,471
6,103,525
$851,946
$10,173,371
Total
$48,902
6
48,908
47,963
$945
$25,437
Other
$785,442
28,542
813,984
767,666
$46,318
$438,317
Europe
$2,361,872
7,769
2,369,641
2,108,204
$261,437
$1,474,725
The Americas
$1,423,894
2,299,044
3,722,938
3,179,692
$543,246
$8,234,892
Japan
$4,620,110
-
4,620,110
3,623,386
$996,724
$9,639,297
Consolidated
Net sales and operating income
Net sales
Sales to third parties
Inter segment sales
Total net sales
Cost of sales and selling, general and administrative expenses
Operating income
Assets
Japanese Yen in Millions¥
Year ended March 31, 2002
-
¥(280,244)
(280,244)
(297,617)
¥17,373
¥(64,089)
Eliminations orunallocated
assets
¥554,413
280,244
834,657
732,423
¥102,234
¥1,220,805
Total
¥5,868
1
5,869
5,756
¥113
¥3,053
Other
¥94,253
3,425
97,678
92,120
¥5,558
¥52,598
Europe
¥283,425
932
284,357
252,984
¥31,373
¥176,967
The Americas
¥170,867
275,886
446,753
381,563
¥65,190
¥988,187
Japan
¥554,413
-
554,413
434,806
¥119,607
¥1,156,716
Consolidated
70Nintendo Co., Ltd. and consolidated subsidiaries
Years ended March 31, 2003 and 2002
Notes to Consolidated Financial Statements

Japanese Yen in Millions¥
Sales for overseas customers
Consolidated net sales
¥246 ,879 ¥121 ,181 ¥9 ,178 ¥377 ,238
¥503 ,748
Year ended March 31, 2003The Americas TotalOtherEurope
Japanese Yen in Millions¥
Sales for overseas customers
Consolidated net sales
¥284 ,518 ¥116 ,155 ¥10 ,621 ¥411 ,294
¥554 ,413
Year ended March 31, 2002The Americas TotalOtherEurope
U.S. Dollars in Thousands (Note 1)
$
Sales for overseas customers
Consolidated net sales
$2,057 ,329 $1 ,009 ,843 $76 ,482 $3 ,143 ,654
$4 ,197 ,900
Year ended March 31, 2003The Americas TotalOtherEurope
U.S. Dollars in Thousands (Note 1)
$
Sales for overseas customers
Consolidated net sales
$2,370 ,984 $967 ,962 $88 ,508 $3 ,427 ,454
$4 ,620 ,110
Year ended March 31, 2002The Americas TotalOtherEurope
C. Sales for Overseas Customers
71Nintendo Co., Ltd. and consolidated subsidiaries