Information Diffusion Effects in Individual Investors ...€¦ · Information Diffusion Effects in...
31
Information Diffusion Effects in Individual Investors’ Common Stock Purchases: Covet Thy Neighbors’ Investment Choices Zoran Ivkovi´ c Michigan State University Scott Weisbenner University of Illinois at Urbana-Champaign and NBER We study the relation between households’ stock purchases and stock purchases made by their neighbors. A ten percentage point increase in neighbors’ purchases of stocks from an industry is associated with a two percentage point increase in households’ own purchases of stocks from that industry. The effect is considerably larger for local stocks and among households in more social states. Controlling for area sociability, households’ and neighbors’ investment style preferences, and the industry composition of local firms, we attribute approximately one-quarter to one-half of the correlation between households’ stock purchases and stock purchases made by their neighbors to word-of-mouth communication. (JEL D14, D83, G11) Although individuals collectively hold about one-half of the U.S. stock market, information diffusion effects among individual investors—the relation between the investment choices made by an individual investor’s neighborhood and the investor’s own investment choices—have received relatively little attention in the academic literature, probably because of the lack of detailed data. If present, such effects undoubtedly can affect individual investors’ asset allocation decisions. Moreover, trades based on information diffusion might be sufficiently correlated and condensed in time to affect stock prices. In the domain of institutional investors, Hong, Kubik, and Stein (2005) study word-of-mouth effects among mutual fund managers and find that ‘‘... a manager is more likely to hold (or buy, or sell) a particular stock We extend our gratitude to an anonymous discount broker for providing the data on individual investors’ positions, trades, and demographics. Special thanks go to Terry Odean for his help in obtaining and understanding the data set. Both authors acknowledge the financial support from the College Research Board at the University of Illinois at Urbana-Champaign. We thank Jean Roth of the NBER for assistance with the 1990 Census data. Finally, we thank seminar participants at the University of Florida and the University of Illinois for their comments and feedback. The views expressed herein are those of the authors and not necessarily those of the National Bureau of Economic Research. Address correspondence to Zoran Ivkovic, Department of Finance, The Eli Broad Graduate School of Management, Michigan State University, 315 Eppley Center, East Lansing, MI 48824-1121, or e-mail: [email protected] or Scott Weisbenner, Department of Finance, University of Illinois at Urbana-Champaign, 340 Wohlers Hall, 1206 South Sixth Street, Champaign, IL 61820, or e-mail: [email protected]. The Author 2007. Published by Oxford University Press on behalf of The Society for Financial Studies. All rights reserved. For Permissions, please email: [email protected]. doi:10.1093/rfs/hhm009 Advance Access publication January 29, 2007
-
Upload
phamnguyet -
Category
Documents
-
view
219 -
download
0
Transcript of Information Diffusion Effects in Individual Investors ...€¦ · Information Diffusion Effects in...

Information Diffusion Effects in IndividualInvestors’ Common Stock Purchases: CovetThy Neighbors’ Investment Choices
Zoran IvkovicMichigan State University
Scott WeisbennerUniversity of Illinois at Urbana-Champaign and NBER
We study the relation between households’ stock purchases and stock purchases madeby their neighbors. A ten percentage point increase in neighbors’ purchases of stocksfrom an industry is associated with a two percentage point increase in households’own purchases of stocks from that industry. The effect is considerably larger for localstocks and among households in more social states. Controlling for area sociability,households’ and neighbors’ investment style preferences, and the industry compositionof local firms, we attribute approximately one-quarter to one-half of the correlationbetween households’ stock purchases and stock purchases made by their neighbors toword-of-mouth communication. (JEL D14, D83, G11)
Although individuals collectively hold about one-half of the U.S. stockmarket, information diffusion effects among individual investors—therelation between the investment choices made by an individual investor’sneighborhood and the investor’s own investment choices—have receivedrelatively little attention in the academic literature, probably because ofthe lack of detailed data. If present, such effects undoubtedly can affectindividual investors’ asset allocation decisions. Moreover, trades based oninformation diffusion might be sufficiently correlated and condensed intime to affect stock prices.
In the domain of institutional investors, Hong, Kubik, and Stein (2005)study word-of-mouth effects among mutual fund managers and find that‘‘. . . a manager is more likely to hold (or buy, or sell) a particular stock
We extend our gratitude to an anonymous discount broker for providing the data on individual investors’positions, trades, and demographics. Special thanks go to Terry Odean for his help in obtaining andunderstanding the data set. Both authors acknowledge the financial support from the College ResearchBoard at the University of Illinois at Urbana-Champaign. We thank Jean Roth of the NBER for assistancewith the 1990 Census data. Finally, we thank seminar participants at the University of Florida and theUniversity of Illinois for their comments and feedback. The views expressed herein are those of theauthors and not necessarily those of the National Bureau of Economic Research. Address correspondenceto Zoran Ivkovic, Department of Finance, The Eli Broad Graduate School of Management, MichiganState University, 315 Eppley Center, East Lansing, MI 48824-1121, or e-mail: [email protected] or ScottWeisbenner, Department of Finance, University of Illinois at Urbana-Champaign, 340 Wohlers Hall,1206 South Sixth Street, Champaign, IL 61820, or e-mail: [email protected].
The Author 2007. Published by Oxford University Press on behalf of The Society for Financial Studies. All rightsreserved. For Permissions, please email: [email protected]:10.1093/rfs/hhm009 Advance Access publication January 29, 2007

The Review of Financial Studies / v 20 n 4 2007
in any quarter if other managers in the same city are holding (or buy-ing, or selling) that same stock.’’ This study complements their work byascertaining whether such trading patterns are a broader phenomenon.For example, individual investors may seek to reduce search costs andcircumvent their lack of expertise by relying on word-of-mouth commu-nication with those around them. Indeed, Hong, Kubik, and Stein (2004)present a model in which stock market participation may be influencedby social interaction. Such social interaction can serve as a mechanismfor information exchange via ‘‘word-of-mouth’’ and/or ‘‘observationallearning’’ [Banerjee (1992), Ellison and Fudenberg (1993, 1995)]. Dufloand Saez (2002, 2003) present evidence of peer effects in the context ofretirement plans. They find that an employee’s participation in retirementplans and choices within those plans are affected by participation decisionsand choices made by other employees in the same department.
In the international arena, Feng and Seasholes (2004) present evidence ofherding effects among individual investors who hold individual brokerageaccounts in the People’s Republic of China. A unique feature of their data(investors seeking to place trades in person can do so only in the brokeragehouse in which they had opened their accounts) enables Feng and Seasholesto disentangle word-of-mouth effects from common reaction to releases ofpublic information. They find that common reaction to public information(trades placed across branches in the same region, local to the company),rather than word-of-mouth effects (trades placed in the same branch),seems to be a primary determinant of herding in that context.
Grinblatt and Keloharju (2001) find that proximity to corporateheadquarters, the language of communication with investors, and thecompany’s CEO’s cultural origin are important determinants of Finnishhouseholds’ stock investments. Whereas these findings could be consistentwith word-of-mouth effects influencing portfolio choice, they could alsoreflect households’ tastes for familiarity—preference to invest in compa-nies that disseminate annual financial reports in their native tongues orfeature a CEO with the same origin.
We study information diffusion effects among U.S. individual investorsby using a detailed data set of common-stock investments 35,673 U.S.households made through a large discount brokerage in the period from1991 to 1996. Throughout the article, we loosely refer to the correla-tion between households’ investments and their neighbors’ investmentsas ‘‘information diffusion.’’ This term is intended to encapsulate severalpotential reasons why such correlation exists—word-of-mouth effects,similarity in preferences, as well as common local reaction to news. Tofurther characterize information diffusion and word-of-mouth effects, weconsider state-level measures of sociability and find that the level of socia-bility prevailing in the state to which the household belongs (likely astrong correlate of the presence of word-of-mouth effects) can explain a
1328
Information Diffusion Effects in Individual Investors’ Common Stock Purchases
significant portion of the overall diffusion effect. Moreover, we disentanglethe diffusion into the influences of common preferences, structure of thelocal industry, and word-of-mouth effects.
Putting our results in perspective and comparing them with the findingsfrom Feng and Seasholes (2004) delivers a new, richer understanding of thedifferent mechanisms that govern individuals’ investment decisions acrossvarious societies. Indeed, whereas Feng and Seasholes (2004) report thatindividual investors’ correlated investment decisions are driven by com-mon reaction to locally available news, with no evidence of word-of-moutheffects among Chinese investors, our estimates suggest that word-of-moutheffects among U.S. investors are strong, particularly in more social areas.This discrepancy is consistent with the differences in the fundamental char-acteristics of the two societies. Freedom House, which has been producingannual ratings of political and civil rights for more than 200 countries forthe past three decades [Freedom House (2004)], has ranked the UnitedStates among the highest and the People’s Republic of China amongthe lowest along the dimension of civil liberties. An essential ingredientof the civil liberties score is prevalence of open and free discussion (orabsence thereof). Coupled with the fact that many, if not most, companiesin the People’s Republic of China are at least partly government-owned,it is very plausible that exchanging investment-relevant information in asociety deprived of open and free discussion and many other civil libertiesis rare and modest.
Even within the United States there is variation in sociability (e.g., mem-bership in clubs, trust in other people). If word-of-mouth is an importantcontributor to households’ stock purchases, the observed correlation in ahousehold’s portfolio allocation and that of its neighbors should be higherin the more social areas. Other explanations for information diffusioneffects, such as correlated preferences and common local reaction to news,should not vary with the sociability of the community. Using state-levelvariation in sociability measures enables us to differentiate among thecompeting hypotheses that can explain trading patterns of U.S. investors.
Overall, we find a strong information diffusion effect (‘‘neighborhoodeffect’’): a ten percentage point increase in purchases of stocks from anindustry made by a household’s neighbors is associated with an increaseof two percentage points in the household’s own purchases of stocks fromthat industry. We pay particular attention to the differentiation betweeninformation diffusion effects related to local stocks (defined as companiesheadquartered within 50 miles from the household) and the effects relatedto nonlocal stocks. Whereas the key neighborhood effects—similarity inpreferences, the impact of the structure of the local industry, and word-of-mouth—can prevail among the investments both local and nonlocal tothe household, most of those effects will likely be far more pronouncedamong local investments because, as demonstrated for both professional
1329

The Review of Financial Studies / v 20 n 4 2007
money managers [Coval and Moskowitz (2001)] and individual investors[Ivkovic and Weisbenner (2005)], the flow of value-relevant informationregarding local companies appears to be higher and of better quality thanthe comparable flow regarding remote, nonlocal companies.
Not surprisingly, we indeed find that information diffusion effectsare considerably stronger for local purchases than for nonlocal ones. Forexample, if the neighborhood’s allocation of local purchases to a particularindustry increases by ten percentage points, a household tends to increaseits own allocation of local purchases to the industry by a comparableamount. This result adds another dimension to the already documentedhigh degrees of individual investors’ locality, both in the United States[Ivkovic and Weisbenner (2005), Zhu (2002)] and abroad [Grinblatt andKeloharju (2001), Massa and Simonov (2006)]: not only do investors tenddisproportionately to invest locally, but there are also strong informationdiffusion effects in their neighborhood.
We further find that a household’s sensitivity to neighbors’ investmentchoices increases with the population of the household’s community. Suchdiffusion in stock trading affects individual investors’ asset allocationdecisions. For example, although residents in larger metropolitan areashave substantially more diverse investment opportunities and tend toinvest more in local stocks, we find that their local stock investments tendto remain just as concentrated as those made by residents of less populatedcommunities (who have a significantly smaller pool of potential localinvestments). This tendency is consistent with the notion that residentsin more populous geographic areas might be exposed to word-of-moutheffects to a higher degree than residents in less highly populated areas.
Finally, to disentangle the contributions of correlated preferences andthe structure of the local economy to the observed correlation betweenindividual investors’ stock purchases and those of their neighbors from‘‘word-of-mouth’’ effects, we conduct two tests. First, we consider the levelof sociability of the state to which the household belongs and find that therelation between industry-level household purchases and neighborhoodpurchases is substantially stronger among households in the more sociablestates. Second, we consider the households’ own preferences (as revealedby the composition of their respective portfolios across industries atthe beginning of each quarter), preferences of the households’ respectiveneighborhoods (as revealed by the composition of the neighborhoods’aggregate portfolios), as well as the composition of local firms and workersby industry. We find that one-quarter to one-half of the overall diffusioneffect among both local and nonlocal investments cannot be attributedto these sources. We regard the remaining portions of the diffusioneffect as a conservative lower bound on the impact of word-of-mouthcommunication effects on household trading decisions. Disentangling theoverall information diffusion effect into word-of mouth communication
1330

Information Diffusion Effects in Individual Investors’ Common Stock Purchases
and other diffusion effects potentially yields further insight as to howcorrelated trading among individuals may influence stock prices.
Our results complement and extend those of Hong, Kubik, and Stein(2005), suggesting that word-of-mouth effects are a broad phenomenonthat affects financial decisions made by both mutual fund managersand individual investors. The two studies provide evidence supportive ofword-of-mouth effects using different techniques, thereby adding to therobustness of the overall finding. Hong, Kubik, and Stein (2005) ruleout alternative explanations for correlated trading patterns by examiningtrading activity before and after Regulation FD and by focusing on tradesin stocks for which investor relations are unlikely to be a contributingfactor (stocks not local to the managers and small stocks). In this article,we disentangle possible explanations for correlated trading patterns byexploiting differences in sociability of communities across the UnitedStates as well as introducing several controls for similarity in investmentpreferences within the community (as manifested by previous householdinvestment decisions) and the composition of the local economy.
The remainder of this article is organized as follows. Section 1 describesthe data and summary statistics. We present our basic findings concerninginformation diffusion, the impact of the size of the population residingin the household’s community, and dissipation of diffusion effects withdistance from the household in Section 2. We examine the role of sociabilityand identify the contributions of correlated preferences, the structure of thelocal economy, and word-of-mouth communication to overall diffusion inindividuals’ investment choices in Section 3. Section 4 concludes.
1. Data and Descriptive Statistics
1.1 DataThe primary data set, obtained from a large discount broker, consists ofindividual investors’ monthly positions and trades over a 6-year periodfrom 1991 to 1996. It covers the investments that 78,000 households madethrough the discount broker, including common stocks, mutual funds,and other securities. Each household could have as few as 1 and asmany as 21 accounts (the median number of accounts per household is2). The information associated with each trade includes the account inwhich the trade was made. A separate data file contains the informationassociated with each account, including the household to which the accountbelongs. This structure of the data allows us to associate with each tradethe household that made it. For further details see Barber and Odean(2000).
In this article we focus on the common stocks traded on the NYSE,AMEX, and Nasdaq exchanges. Common stock investments constituteroughly three-quarters of the total value of household investments through
1331
The Review of Financial Studies / v 20 n 4 2007
the brokerage house in the sample. We use the Center for Research inSecurity Prices (CRSP) database to obtain information on stock prices andreturns and COMPUSTAT to obtain several firm characteristics, includingcompany headquarters location (identified by its state and county codes).We use the headquarters location as opposed to the state of incorporationbecause firms often do not have most of their operations in their state ofincorporation.1
We exclude the stocks that we could not match with CRSP andCOMPUSTAT; they were most likely listed on smaller exchanges. Wealso exclude stocks not headquartered in the continental United States.The resulting ‘‘market’’—the universe of stocks about which we couldobtain the necessary characteristics and information—is representative ofthe overall market. For example, at the end of 1991 the ‘‘market’’ consistsof 5,478 stocks that cover 89% of the overall market capitalization at thetime.
The sample of households used in this study is a subset of the entirecollection of households for which we could ascertain their zip code andthus determine their location. We obtain the latitude and longitude foreach of the zip codes from the Gazetteer Place and Zip Code Database [U.S.Census Bureau (1990)]. Company locations come from the COMPUSTATAnnual Research Files, which contain the information regarding companyheadquarters’ county codes. Finally, we identify the latitude and longitudefor each county from the Gazetteer Place and Zip Code Database [U.S.Census Bureau (1990)] as well. We use the standard formula for computingthe distance d(a,b) in statutory miles between two points a and b as follows:
d(a,b) = arccos{cos(a1)cos(a2)cos(b1)cos(b2) + cos(a1)
sin(a2)cos(b1)sin(b2) + sin(a1)sin(b1)}r (1)
where a1 and b1 (a2 and b2) are the latitudes (longitudes) of the two points(expressed in radians), respectively, and r denotes the radius of the Earth(approximately 3,963 statutory miles).
The sample size necessitates two adjustments. First, instead offitting regressions on the basis of individual stocks, we aggregateall the buys in each quarter by assigning firms to one of thefollowing 14 industry groups on the basis of their SIC (StandardIndustrial Classification) codes: mining, oil and gas, construction, food,basic materials, medical/biotechnology, manufacturing, transportation,telecommunications, utilities, retail/wholesale trade, finance, technology,and services. Moreover, although 35,673 households purchased common
1 Whereas this is a somewhat imprecise measure, to our knowledge the data that detail the geographicdistribution of employees for each company are not available. Moreover, most value-relevant, strategicallyimportant information is likely concentrated at the company headquarters.
1332

Information Diffusion Effects in Individual Investors’ Common Stock Purchases
stocks at some point during the sample period, in each quarter we consideronly the households that made some purchases during the quarter. In sum,there are 23 complete quarters in the sample period (1991:1 to 1996:3),14 industries, and 7,000 to 9000 households that made stock purchasesin a quarter. This leads to a total of 2,678,004 observations, where eachobservation has several control variables, as well as 322 industry-quarterdummy variables (14 industries × 23 quarters).
In most analyses, we relate the industry composition of a household’spurchases during a quarter to the industry composition of all the purchasesof the household’s neighbors (households located within 50 miles) madeduring the quarter, plus appropriate controls. We choose this distancebecause there is evidence that 50 miles captures most of one’s socialinteractions.2
Finally, in some analyses we relate the extent of information diffusionto the sociability that prevails in the area surrounding the household. Tocapture sociability, we use state-level values of the Comprehensive SocialCapital Index, as collected and presented in Putnam (2000).3 We classifyhouseholds according to their state’s Comprehensive Social Capital Indexand split the sample of households into sociable and nonsociable ones,where the breakpoint is the sociability measure of the median householdin the sample.4
1.2 Summary statisticsTable 1 summarizes quarterly household stock purchases at the industrylevel. Summary statistics are reported annually, as well as for the entiresample period (bottom row of the table). The first column presents thenumber of household-quarter-industry (h, t, i) combinations in a givenyear such that household h made at least one purchase in quarter t inindustry i. The second column tallies the number of distinct householdsappearing in the sample in a given year. The third column lists averagedollar values of households’ quarterly purchases, where median valuesare reported in parentheses underneath the mean values. The last columnbreaks down the purchases according to their distances from the household(i.e., whether the firm headquarters is located within 50 miles of the
2 For example, according to the 1990 Census, 88% of the population lives within 25 miles of work (98% livewithin 50 miles). Moreover, if two co-workers each live only 25 miles from work, they may live as manyas 50 miles apart.
3 Robert D. Putnam’s ‘‘Bowling Alone’’ (2000) features 14 state-level measures of social capital, suchas time spent visiting friends, number of organizations per capita, number of group memberships, andtrust in people, along with the specific measure we use in the article, the Comprehensive Social CapitalIndex. Details are described in their book (see Table 4 and pp. 290–291). The data are available fromhttp://www.bowlingalone.com/data.php3.
4 To date, researchers have employed a few different sociability measures. For example, in their study ofthe relation between social interaction and stock market participation, Hong, Kubik, and Stein (2004) usechurch attendance as a proxy for sociability.
1333

The Review of Financial Studies / v 20 n 4 2007
Table 1Quarterly purchases of stock by households
Mean quarterly purchase# Purchases # Distinct HHs (in $) [median] Local (%)
1991 36,250 20,366 23,242 [7,113] 16.41992 36,270 20,300 23,576 [7,500] 17.01993 34,377 18,894 25,150 [7,500] 16.41994 28,726 16,307 25,418 [7,388] 17.41995 30,299 16,134 38,540 [9,313] 17.81996 (Q1–Q3) 25,364 15,483 42,277 [9,725] 17.5
TOTAL 191,286 35,673 28,922 [7 949] 17.1
This table summarizes quarterly household stock purchases at the industry level. Summarystatistics are reported annually from 1991 to 1996, as well as for the entire sample period (bottomrow of the table). The first column presents the number of household, quarter, industry (h, t, i)combinations in a given year such that household h made at least one purchase in quarter t inindustry i. The second column tallies the number of distinct households appearing in the samplein a given year. The third column lists average dollar values of households’ quarterly purchases,where median values are reported in parentheses directly underneath the mean values. The lastcolumn breaks down the purchases according to their distance from the household (i.e., whetherthe firm headquarters is located within 50 miles of the household).
household). There are a total of 191,286 ‘‘purchases’’—household-quarter-industry (h, t, i) combinations for which there was a purchase by householdh in quarter t in industry i —with 16,000–20,000 households makingpurchases each year, for a total of 35,673 distinct households throughoutthe sample period. The distribution of the dollar values of quarterlypurchases is skewed; whereas the mean quarterly purchase was around$29,000, the median value was substantially smaller, around $8,000. Thefourth column shows individual investors’ disproportionate preference forlocal stocks (17.1% of all purchases), a phenomenon studied in Ivkovicand Weisbenner (2005) and Zhu (2002).
2. Information Diffusion Effects
2.1 Basic regression specificationWe begin by classifying individual stock purchases made by householdh in quarter t into industries i = 1, 2, . . . , 14 and compute fh,t,i , thedollar-weighted share of a household’s quarterly buys in each industry.5
In various analyses, the aggregation into 14 industries is done acrossall stock purchases, local purchases only, and nonlocal purchases only.Moreover, for each household h and each quarter t we also computeF 50
−h,t,i , i = 1, 2, . . . , 14, that is, the proportion of buys made by allneighboring households within 50 miles from household h (excludinghousehold h) in each of the 14 industries. For presentational convenience,throughout the article the household industry shares fh,t,i are expressed inpercentage points (that is, they are multiplied by 100), whereas neighboring
5 Note that, by construction, for every h and every t, �i=1,. . .,14 fh,t,I = 100.
1334
Information Diffusion Effects in Individual Investors’ Common Stock Purchases
household industry shares are not. Finally, we employ industry-quartereffects to allow for marketwide variation in demand across industries andtime by defining 322 dummy variables Dt,i, t = 1, . . . , 23 (from quarter1991:1 to 1996:3), and i = 1, 2, . . . , 14. These controls ensure that ourresults are not driven by, for example, technology stocks beating analysts’expectations, which belong to the common information set that mayaffect buying patterns of all investors, but rather reflect the differencesin households’ propensity to purchase technology stocks across differentcommunities. In sum, the basic regression is:
fh,t,i = β F 50−h,t,i +
23∑t=1
14∑i=1
γ t,iDt,i+ εh,t,i (2)
For the basic specification without controls other than the 322 dummyvariables, the null hypothesis is that information diffusion effects(‘‘neighborhood effects’’) do not exist, that is, that the coefficient β iszero. A positive β would suggest the presence of information diffusioneffects.
We next address the correlation structure of the error term: observationsare independent neither within each household-quarter combination(industry shares necessarily need to add up to one) nor across time(households’ preferences are unlikely to change at quarterly frequency).It follows that the OLS regression estimation, although consistent, wouldproduce biased standard errors. Thus, we report the standard errors andresulting tests of statistical significance on the basis of a robust estimatorthat clusters observations at the household-quarter level for all regressions.
There are several reasons why U.S. individuals’ investment choicesmight be related to those made by their neighbors. At the outset, we notethat individual investors might be reacting to the same publicly availableinformation to which their neighbors are reacting. Such tendencies maycause correlated trading. Indeed, Barber, Odean, and Zhu (2006) documentthat trading patterns are correlated across individual investors, and Barberand Odean (2005) find that individual investors are inclined to buystocks that have attracted attention. These correlated trading patternsare not necessarily surprising in light of exposure to (the same) publiclyavailable information, as well as to the pronounced presence of thedisposition effect [Odean (1998)], tax-motivated trading [Ivkovic, Poterba,and Weisbenner (2005)], or other behavioral phenomena that might prevailamong individual investors, yet need not be driven by information diffusioneffects. Our basic set of 322 industry-quarter dummy variables seeks tocontrol for these and other trading factors that do not vary acrosscommunities (e.g., when a stock price reaches an all-time high, it doesso for all investors) and thereby to allow our specifications to pick upinformation diffusion effects.
1335
The Review of Financial Studies / v 20 n 4 2007
2.2 Information diffusion effects for purchasesWe present the results of fitting the regression from Equation (2) in PanelA of Table 2. Within the panel, each row pertains to a different dependentvariable. The first row of the panel pertains to the industry share breakdownfh,t,i computed across all buys. Running the basic regression, withoutany controls other than the 322 industry-quarter dummies, produces thehighly statistically significant estimate of 20.7 and thus suggests that a10 percentage point change in the neighbors’ allocation of purchases inan industry is associated with a nearly 2.1 percentage point change in thehousehold’s own allocation of purchases in the industry.6
As discussed in the introduction, information diffusion that prevailsamong local and nonlocal stocks may be different. Similarity in preferences,the structure of the local industry, and word-of-mouth effects are likelystronger among local investments. This inquiry is also motivated by studiesof local bias among both institutional investors Coval and Moskowitz(1999) and individual investors [Ivkovic and Weisbenner (2005) and Zhu(2002)]. These studies find that both groups of investors are biased towardholding disproportionately more local stocks in their portfolios. Moreover,Coval and Moskowitz (2001) and Ivkovic and Weisbenner (2005) presentevidence that local investments outperformed nonlocal ones among mutualfund managers and individual investors, respectively.
Separate consideration of local purchases7 and nonlocal purchases,reported in the next two rows of Table 2, Panel A, indeed reveals that localinformation diffusion effects are larger than the nonlocal ones by an orderof magnitude (119.3 vs. 8.4). For example, if the neighborhood’s allocationof purchases to a particular industry increases by ten percentage points,a household tends to increase its own allocation of local purchases to theindustry by a comparable amount. This result adds another dimensionto the already documented high degrees of individual investors’ locality,both in the United States [Ivkovic and Weisbenner (2005), Zhu (2002)] andoverseas [Grinblatt and Keloharju (2001), Massa and Simonov (2006)] bysuggesting the possibility that strong information diffusion effects couldcontribute to individual investors’ local bias.
2.3 Information diffusion effects for sales and positionsIn Panels B and C of Table 2 we also examine the extent to whichhouseholds’ sale and holding decisions are correlated with those of their
6 If regressions are estimated for each quarter separately, in which case each quarterly regression only has14 dummy variables for the industry effects, the estimated coefficient β is highly statistically significantin all twenty-three regressions. Quarterly regressions suggest that information diffusion effects are strongthroughout the sample period, with point estimates ranging from 13.6 to 28.3 across the 23 quarters.
7 In the regressions for local buys we discarded all the h, t, i observations for which there were no firmsin industry i within 50 miles from household h in quarter t because household h simply could not haveinvested into industry i locally.
1336
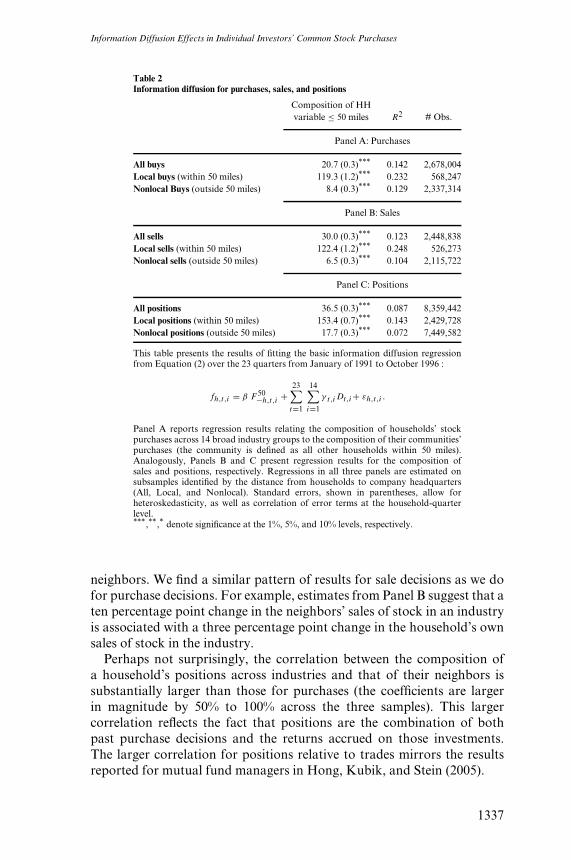
Information Diffusion Effects in Individual Investors’ Common Stock Purchases
Table 2Information diffusion for purchases, sales, and positions
Composition of HHvariable ≤ 50 miles R2 # Obs.
Panel A: Purchases
All buys 20.7 (0.3)*** 0.142 2,678,004Local buys (within 50 miles) 119.3 (1.2)*** 0.232 568,247Nonlocal Buys (outside 50 miles) 8.4 (0.3)*** 0.129 2,337,314
Panel B: Sales
All sells 30.0 (0.3)*** 0.123 2,448,838Local sells (within 50 miles) 122.4 (1.2)*** 0.248 526,273Nonlocal sells (outside 50 miles) 6.5 (0.3)*** 0.104 2,115,722
Panel C: Positions
All positions 36.5 (0.3)*** 0.087 8,359,442Local positions (within 50 miles) 153.4 (0.7)*** 0.143 2,429,728Nonlocal positions (outside 50 miles) 17.7 (0.3)*** 0.072 7,449,582
This table presents the results of fitting the basic information diffusion regressionfrom Equation (2) over the 23 quarters from January of 1991 to October 1996 :
fh,t,i = β F 50−h,t,i +
23∑t=1
14∑i=1
γ t,iDt,i+ εh,t,i .
Panel A reports regression results relating the composition of households’ stockpurchases across 14 broad industry groups to the composition of their communities’purchases (the community is defined as all other households within 50 miles).Analogously, Panels B and C present regression results for the composition ofsales and positions, respectively. Regressions in all three panels are estimated onsubsamples identified by the distance from households to company headquarters(All, Local, and Nonlocal). Standard errors, shown in parentheses, allow forheteroskedasticity, as well as correlation of error terms at the household-quarterlevel.***,**,* denote significance at the 1%, 5%, and 10% levels, respectively.
neighbors. We find a similar pattern of results for sale decisions as we dofor purchase decisions. For example, estimates from Panel B suggest that aten percentage point change in the neighbors’ sales of stock in an industryis associated with a three percentage point change in the household’s ownsales of stock in the industry.
Perhaps not surprisingly, the correlation between the composition ofa household’s positions across industries and that of their neighbors issubstantially larger than those for purchases (the coefficients are largerin magnitude by 50% to 100% across the three samples). This largercorrelation reflects the fact that positions are the combination of bothpast purchase decisions and the returns accrued on those investments.The larger correlation for positions relative to trades mirrors the resultsreported for mutual fund managers in Hong, Kubik, and Stein (2005).
1337

The Review of Financial Studies / v 20 n 4 2007
For the remainder of the article, we focus on households’ purchasedecisions because they are unconstrained, that is, households are freeto purchase any stock, and they represent households’ active financialdecisions. By contrast, in the absence of short selling, sale decisions arelimited to the stocks already held (essentially no investors in our samplesold stocks short). Thus, a correlation in selling activity could simplyrepresent an underlying correlation in the original buying activity of thosestocks. Moreover, a correlation in positions could in part simply reflecthouseholds’ inertia, as households could hold similar stocks over a longperiod of time (and thus experience similar movements in the value of theirportfolio positions).8
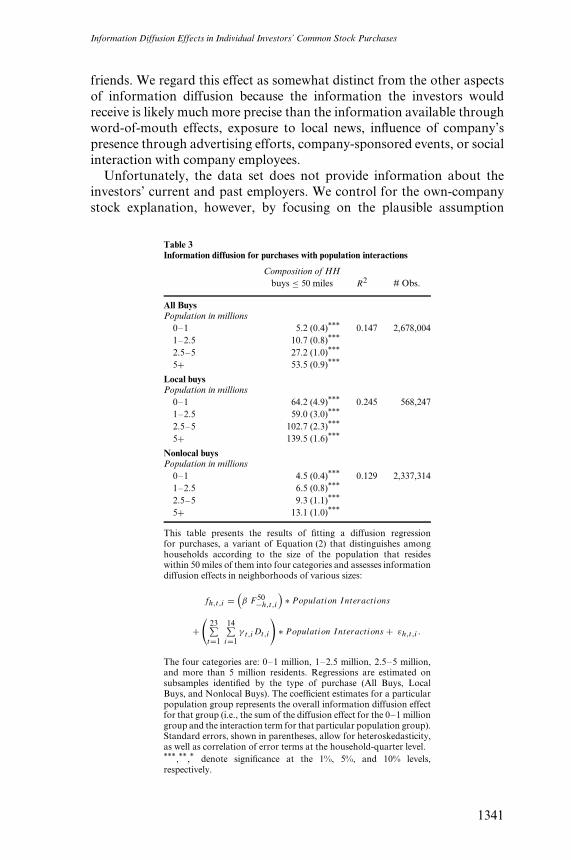
2.4 Information diffusion effects and local population sizeIn this section, we stratify households according to the size of thepopulation that resides within 50 miles from the household. We define fourcategories: 0–1 million residents, 1–2.5 million residents, 2.5–5 millionresidents, and more than 5 million residents. Not surprisingly, the size of thelocal population and the diversity of local companies are positively related(i.e., local population and the Herfindahl index of industry concentrationare negatively correlated). Specifically, the Herfindahl index of the industrycomposition of firms local to the average household decreases from around0.5 to around 0.2 as the population increases from 0–1 million localresidents to more than 5 million local residents.9 Yet, although the averagedollar amount of quarterly purchases of local individual stocks increasesfrom $13,000 to $22,400 as the size of the local population increasesfrom 0–1 million to more than 5 million local residents, the Herfindahlindex of households’ local purchases across industries remains virtuallyunchanged—it drops only very slightly from 0.99 to 0.95. Thus, althoughresidents in larger metropolitan areas have substantially more diverseinvestment opportunities and tend to invest more into local stocks, theytend to remain very focused in their industry allocation. This tendencyis consistent with the notion that residents in more populous geographicareas might be exposed to information diffusion effects to a higher degreethan residents in less highly populated areas. To confirm this intuition,we run a simple modification of the basic regression from Equation (2)on subsamples selected by the type of purchase (all buys, local buys,and nonlocal buys), wherein information diffusion effects are interactedwith indicator variables representing local population size (0–1 million,1–2.5 million, 2.5–5 million, more than 5 million). The coefficient estimate
8 In unreported analyses, we have verified that conclusions drawn for the subsequent analyses in the articleregarding households’ purchase decisions hold for sales and holdings as well (results available uponrequest).
9 Firms are divided into 14 industry groups. Thus, a community with equal representation across allindustries would have a local firm Herfindahl index of 0.07.
1338

Information Diffusion Effects in Individual Investors’ Common Stock Purchases
presented in the table for a particular population group represents the totalinformation diffusion effect for that group (i.e., the sum of the diffusioneffect for the 0–1 million group and the interaction term for that particularpopulation group).
Across all three regressions presented in Table 3, information diffusioneffects in purchases increase with population size. Stronger effects in largermetropolitan areas may stem from a greater flow of investment-relevantinformation through increased availability of information sources (e.g.,business-oriented magazines and newspapers) and advertising efforts, bothof which are subject to economies of scale and are typically more substantialin larger metropolitan areas.
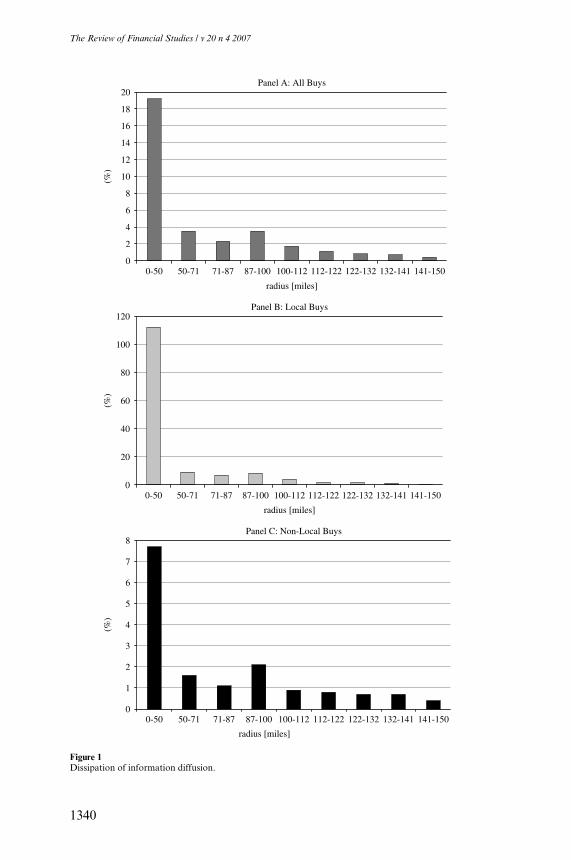
2.5 Dissipation of information diffusion effects with distance from thehouseholdOne would expect information diffusion effects to dissipate as the dis-tance from the household increases. To test this hypothesis, we defineregions surrounding the household at increasingly larger distances as fol-lows: 0–50 miles, 50–70.7 miles, 70.7–86.6 miles, 86.6–100 miles, . . .,141.4–150 miles. These regions each cover a geographic area of the samesize (502π = 7, 854 square miles). We then run a regression similar toEquation (2), except, instead of having one information diffusion regres-sor F 50
−h,t,i , the specification now has nine (F 50−h,t,i , F 50– 71
h,t,i , F 71– 87h,t,i , F 87– 100
h,t,i ,F 100– 112
h,t,i , F 112– 122h,t,i , F 122– 132
h,t,i , F 132– 141h,t,i , and F 141– 150
h,t,i ). The results are pre-sented graphically in Figure 1. Across all three panels, that is, for all buys,local buys, and non-local buys, the pattern is the same: there is a rapid andfairly steady exponential decline of the information diffusion coefficientswith distance from the household. As one might suspect, a household’spurchases of non-local stocks are relatively more sensitive to the decisionsmade by members of more distant communities than its purchases oflocal stocks are. That is, going beyond the 50-mile community leads to asubstantially faster decline in information diffusion effects in the domainof local stocks than in the domain of non-local stocks.
The Figure illustrates dissipation of information diffusion effects withdistance from the household. Regions surrounding the household atincreasingly larger distances have the same geographic area (502π = 7, 854square miles). The regression specification is similar to Equation (2),except, instead of having one information diffusion regressor, thespecification now has nine—one for each geographic area
2.6 Robustness checksAn issue of potential concern for local information diffusion is that theeffect might be driven by some form of inside trading: those who workfor a company may be trading in their own company stock and maybe selectively releasing pertinent information to their relatives and close
1339
The Review of Financial Studies / v 20 n 4 2007
0
1
2
3
4
5
6
7
8
0-50 50-71 71-87 87-100 100-112 112-122 122-132 132-141 141-150
(%)
0
2
4
6
8
10
12
14
16
18
20
0-50 50-71 71-87 87-100 100-112 112-122 122-132 132-141 141-150
(%)
0
20
40
60
80
100
120
0-50 50-71 71-87 87-100 100-112 112-122 122-132 132-141 141-150
(%)
Panel A: All Buys
radius [miles]
Panel B: Local Buys
radius [miles]
Panel C: Non-Local Buys
radius [miles]
Figure 1Dissipation of information diffusion.
1340
Information Diffusion Effects in Individual Investors’ Common Stock Purchases
friends. We regard this effect as somewhat distinct from the other aspectsof information diffusion because the information the investors wouldreceive is likely much more precise than the information available throughword-of-mouth effects, exposure to local news, influence of company’spresence through advertising efforts, company-sponsored events, or socialinteraction with company employees.
Unfortunately, the data set does not provide information about theinvestors’ current and past employers. We control for the own-companystock explanation, however, by focusing on the plausible assumption
Table 3Information diffusion for purchases with population interactions
Composition of HHbuys ≤ 50 miles R2 # Obs.
All BuysPopulation in millions
0–1 5.2 (0.4)*** 0.147 2,678,0041–2.5 10.7 (0.8)***
2.5–5 27.2 (1.0)***
5+ 53.5 (0.9)***
Local buysPopulation in millions
0–1 64.2 (4.9)*** 0.245 568,2471–2.5 59.0 (3.0)***
2.5–5 102.7 (2.3)***
5+ 139.5 (1.6)***
Nonlocal buysPopulation in millions
0–1 4.5 (0.4)*** 0.129 2,337,3141–2.5 6.5 (0.8)***
2.5–5 9.3 (1.1)***
5+ 13.1 (1.0)***
This table presents the results of fitting a diffusion regressionfor purchases, a variant of Equation (2) that distinguishes amonghouseholds according to the size of the population that resideswithin 50 miles of them into four categories and assesses informationdiffusion effects in neighborhoods of various sizes:
fh,t,i =(β F 50
−h,t,i
)∗ Population Interactions
+(
23∑t=1
14∑i=1
γ t,iDt,i
)∗ Population Interactions + εh,t,i .
The four categories are: 0–1 million, 1–2.5 million, 2.5–5 million,and more than 5 million residents. Regressions are estimated onsubsamples identified by the type of purchase (All Buys, LocalBuys, and Nonlocal Buys). The coefficient estimates for a particularpopulation group represents the overall information diffusion effectfor that group (i.e., the sum of the diffusion effect for the 0–1 milliongroup and the interaction term for that particular population group).Standard errors, shown in parentheses, allow for heteroskedasticity,as well as correlation of error terms at the household-quarter level.***,**,* denote significance at the 1%, 5%, and 10% levels,respectively.
1341
The Review of Financial Studies / v 20 n 4 2007
that, if a household’s local purchase is motivated by inside information,it is likely to be the household’s largest local trade in that quarter.Accordingly, we compute for each household h in quarter t the industrycomposition of local purchases excluding the single largest stock purchasemade by household h in quarter t . In unreported analyses, we find that thisspecification yields estimates of the local information diffusion effect thatare even somewhat larger than the estimates based on the full sample oflocal investments (152.5 vs. 119.3). Therefore, we do not find evidence thattrading in own-company stock drives the estimated information diffusioneffects among local investments.
Another issue of potential concern is that the estimates of localinformation diffusion may be induced by the dominant presence of acompany (or industry) in a household’s neighborhood. Taking a drasticexample, suppose there is only one company (or multiple companies allbelonging to the same industry) local to the household. The opportunityset for local investments is therefore very focused and the inability toinvest locally in any other industry may bias the results. To assess theimpact of industry dominance in the local opportunity set, in unreportedanalyses we estimate regressions for local purchases on a subsample ofpurchases—household-quarter-industry (h, t, i) combinations for whichthe weight of industry i in the portfolio of firms local to household h doesnot exceed the threshold of 50%, that is, the observations not plagued bythe domination of a single company (or industry) in the community. Theregression coefficient remains essentially the same; it declines only veryslightly, from 119.3 to 111.3, which suggests that the ‘‘one-company town’’issue does not drive local information diffusion.
3. Disentangling Information Diffusion Effects
The results presented in Section 2 suggest that the stock purchases madeby households are strongly related to those made by their neighbors,consistent with word-of-mouth effects playing a strong role in householdinvestment decisions. However, such a correlation in trading activitycould also reflect an underlying similarity in preferences or the industrycomposition of local firms. In regard to U.S. investors, studies havefound correlated trading patterns both for institutional investors [Hong,Kubik, and Stein (2005)] and individual investors [Barber, Odean, and Zhu(2006)]. Hong, Kubik, and Stein (2005) consider alternative interpretationsto their finding that mutual fund managers engage in word-of-mouthcommunication and tilt their portfolios accordingly. They use three setsof tests to assess the possibility that their results might be driven by insideinformation obtained by the money managers directly from companyexecutives (which they term the ‘‘local-investor-relations’’ activity). First,their results are unaffected even if all local stocks are excluded from
1342
Information Diffusion Effects in Individual Investors’ Common Stock Purchases
their regressions. Second, their results are robust among smaller stocks(which, on average, have fewer resources at their disposal to pursue‘‘local-investor-relations’’ activities). Finally, Hong, Kubik, and Stein(2005) consider the post-Regulation FD period and show that their resultspersist in the aftermath of explicit regulation that prohibits companies toengage in selective dissemination of information, suggesting once againthat ‘‘local-investor-relations’’ strategies do not drive their regressionresults.
As Hong, Kubik, and Stein (2005) point out, none of these ‘‘local-investor-relations’’ alternative explanations are likely to dominate thearena of individual investors. In fact, Feng and Seasholes (2004) reportthat Chinese individual investors’ correlated investment decisions aredriven by common reaction to locally available news, with no evidenceof word-of-mouth effects on stock trades. However, given the differencesin the fundamental characteristics of the U.S. and Chinese societies (i.e.,differences in civil liberties such as open and free discussion), it is plausiblethat motivations for stock purchases could also be substantially differentacross the two cultures.
Moreover, it is important to differentiate among competing sources ofthe overall information diffusion effect among U.S. individual investorsbecause they likely have different levels of influence on the market. Forexample, word-of-mouth effects may create a more dynamic exchangeof information that may lead to a ripple effect of further informationdissemination, which in turn may have an impact on stock prices.
Thus, we devise two alternative strategies to disentangle the sources ofthe observed correlation between a household’s stock purchases and thoseof its neighbors. The first strategy considers the sociability of a household’sstate. Using the comprehensive statewide sociability measure from Putnam(2000) (available for all 50 states except Alaska and Hawaii), we assigna certain level of sociability to every household in our sample, and thendefine a dummy variable associated with each household that labels it asa household in either a high or a low sociability area. We interact thatdummy variable with the neighborhoods’ industry-level purchases. Withinthe United States, there is variation in sociability (i.e., membership inclubs, trust in other people, etc.) across states. If word-of-mouth is animportant contributor to a household’s stock purchases, then the observedcorrelation in a household’s portfolio allocation and that of their neighborsshould be higher in more social areas. Other explanations for informationdiffusion effects, such as correlated preferences and common local reactionto news, should not vary with the sociability of the community. Weinterpret the coefficients associated with sociability, which represent theincreased influence of neighbors’ investment choices on an individual’s ownportfolio in social areas relative to less social communities, as measures ofthe word-of-mouth effects.
1343

The Review of Financial Studies / v 20 n 4 2007
The second strategy considers three key contributions to the overallinformation diffusion effect, namely, word-of-mouth communication,correlated preferences (which may incorporate common local reactionto news events), and the structure of the local economy. We use thecomposition of the neighborhood’s aggregate portfolio to reveal theneighborhood’s preferences and the accumulation of their reactions topast news. Analogously, we use the composition of a household’s ownportfolio position to reveal its own preferences and accumulated reactionsto past news. We further use the degree of conformity of the householdportfolio composition to the portfolio composition of the neighborhoodto identify households with preferences and reactions similar to theirneighbors’, as well as those whose preferences and reactions are verydifferent from their neighbors’. Upon controlling for the compositionof households’ neighborhood portfolios and households’ own portfoliocompositions, as well as the structure of the local economy, we viewthe correlation between the household’s stock purchases and those of itsneighbors that survives such rigid controls as a conservative lower boundon the magnitude of the word-of-mouth effect.
Strikingly, our estimates of the contribution of word-of-mouthcommunication are very similar across households that conformed to theirneighbors very closely and those that held very disparate portfolios. Thisfinding is reassuring because it suggests that the strategy we employed tocontrol for the effect of common preferences and the cumulative commonreactions to news did not lead to materially different estimates of theword-of-mouth effect across the two sets of households.
3.1 Controlling for word-of-mouth effects: the area sociability proxyIn this section we report the results of the analyses in which we identifya proxy for the word-of-mouth effect and interact that measure withdiffusion coefficients in a regression specification very similar to that fromEquation (2). Our proxy for the word-of-mouth effect is the sociabilityof the area surrounding a household. To capture sociability, we usestate-level values of the Comprehensive Social Capital Index, as collectedand presented in Putnam (2000).10 We define a dummy variable thatindicates high and low area sociability levels by classifying householdsaccording to their state’s Comprehensive Social Capital Index (Putnam,2000) and splitting the households into sociable and non-sociable ones(the breakpoint is the sociability measure of the median household inthe sample). Further recognizing that sociability effects may be strongerin the areas with more population, we also develop a specification in
10 In some robustness checks we also consider key components of the overall social capital index suchas measures of the time spent visiting friends, number of organizations per capita, number of groupmemberships, and trust in people. Results are highly consistent with those based on the specifications thatemploy the Comprehensive Social Capital Index.
1344
Information Diffusion Effects in Individual Investors’ Common Stock Purchases
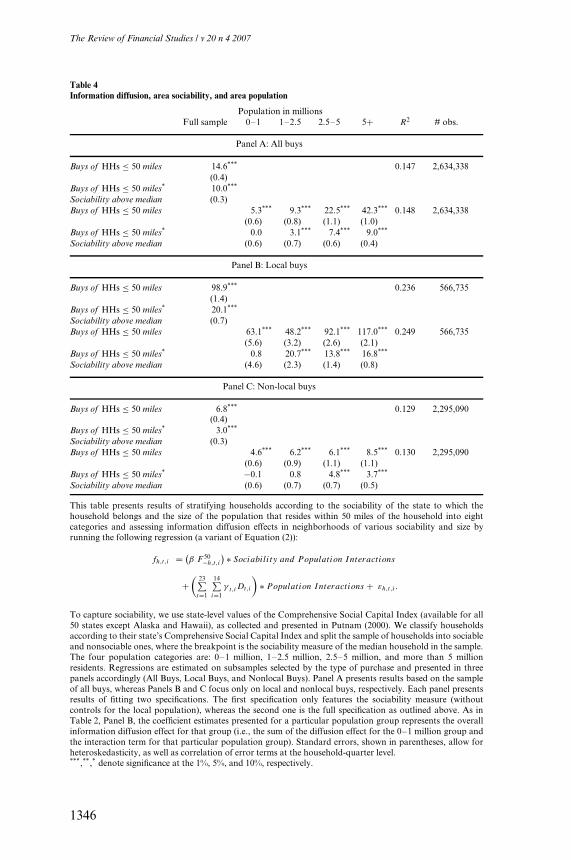
which we interact the diffusion coefficient with both the sociabilitydummy and the population measures (as defined in Section 2.4 andTable 3).
Table 4 presents the results of both analyses across all buys, local buys,and nonlocal buys (Panels A, B, and C, respectively). Within each panel,the first section reports regression results for specifications involving areasociability measures only, whereas the second section reports results ofthe more complicated specifications that also include interactions withpopulation measures.
Focusing first on the specifications without population interactions,diffusion effects are considerably stronger among households located inthe more sociable areas. A ten percentage point increase in neighbors’purchases of stocks from an industry is associated with a 1.5 percentagepoint increase in the household’s own purchases of stocks from thatindustry in nonsocial areas, while the diffusion effect increases to2.5 percentage points for households in social states. Thus, the correlationin household purchases is significantly stronger in the states that aremore sociable (i.e., in the states in which individuals are more inclined,e.g., to be members of clubs and to trust each other). For all buys andnonlocal buys, the increased influence of neighbors’ investment choices onan individual’s own portfolio in more social areas relative to less socialareas (a proxy for the word-of-mouth effect) is 40% (10.0/24.6 and 3.0/9.8,respectively) of the total information diffusion effect. For local buys, the‘‘word-of-mouth’’ share of the total correlation between neighborhoodand household purchases is 17% (20.1/119).
Specifications that also incorporate population interactions yield similarrelative increases across all population groups, with the exception of thehouseholds located in the smallest communities (surrounded by fewerthan 1 million people within a 50-mile radius), for which increasedsociability does not translate into any statistically significant changes ininformation diffusion. Parallel to the results from Table 3, the correlationin stock picks increases with the increase of population, and, broadlyspeaking, so does the incremental contribution of area sociability (thecoefficients in the bottom row of each of the six analyses reported inTable 4).
These results suggest that word-of-mouth communication is animportant contributor to information diffusion effects, amounting toperhaps one to two-fifths of the overall correlation between individual andcommunity stock purchases.
3.2 Controlling for correlated preferences and structure of local economy3.2.1 The role of correlated preferences. A potential source of correlatedpurchases among households in a geographic area is that those householdsmay have similar preferences. Individual investors might be influenced
1345
The Review of Financial Studies / v 20 n 4 2007
Table 4Information diffusion, area sociability, and area population
Population in millionsFull sample 0–1 1–2.5 2.5–5 5+ R2 # obs.
Panel A: All buys
Buys of HHs ≤ 50 miles 14.6*** 0.147 2,634,338(0.4)
Buys of HHs ≤ 50 miles* 10.0***
Sociability above median (0.3)Buys of HHs ≤ 50 miles 5.3*** 9.3*** 22.5*** 42.3*** 0.148 2,634,338
(0.6) (0.8) (1.1) (1.0)Buys of HHs ≤ 50 miles* 0.0 3.1*** 7.4*** 9.0***
Sociability above median (0.6) (0.7) (0.6) (0.4)
Panel B: Local buys
Buys of HHs ≤ 50 miles 98.9*** 0.236 566,735(1.4)
Buys of HHs ≤ 50 miles* 20.1***
Sociability above median (0.7)Buys of HHs ≤ 50 miles 63.1*** 48.2*** 92.1*** 117.0*** 0.249 566,735
(5.6) (3.2) (2.6) (2.1)Buys of HHs ≤ 50 miles* 0.8 20.7*** 13.8*** 16.8***
Sociability above median (4.6) (2.3) (1.4) (0.8)
Panel C: Non-local buys
Buys of HHs ≤ 50 miles 6.8*** 0.129 2,295,090(0.4)
Buys of HHs ≤ 50 miles* 3.0***
Sociability above median (0.3)Buys of HHs ≤ 50 miles 4.6*** 6.2*** 6.1*** 8.5*** 0.130 2,295,090
(0.6) (0.9) (1.1) (1.1)Buys of HHs ≤ 50 miles* −0.1 0.8 4.8*** 3.7***
Sociability above median (0.6) (0.7) (0.7) (0.5)
This table presents results of stratifying households according to the sociability of the state to which thehousehold belongs and the size of the population that resides within 50 miles of the household into eightcategories and assessing information diffusion effects in neighborhoods of various sociability and size byrunning the following regression (a variant of Equation (2)):
fh,t,i = (β F 50
−h,t,i
) ∗ Sociability and Population Interactions
+(
23∑t=1
14∑i=1
γ t,iDt,i
)∗ Population Interactions + εh,t,i .
To capture sociability, we use state-level values of the Comprehensive Social Capital Index (available for all50 states except Alaska and Hawaii), as collected and presented in Putnam (2000). We classify householdsaccording to their state’s Comprehensive Social Capital Index and split the sample of households into sociableand nonsociable ones, where the breakpoint is the sociability measure of the median household in the sample.The four population categories are: 0–1 million, 1–2.5 million, 2.5–5 million, and more than 5 millionresidents. Regressions are estimated on subsamples selected by the type of purchase and presented in threepanels accordingly (All Buys, Local Buys, and Nonlocal Buys). Panel A presents results based on the sampleof all buys, whereas Panels B and C focus only on local and nonlocal buys, respectively. Each panel presentsresults of fitting two specifications. The first specification only features the sociability measure (withoutcontrols for the local population), whereas the second one is the full specification as outlined above. As inTable 2, Panel B, the coefficient estimates presented for a particular population group represents the overallinformation diffusion effect for that group (i.e., the sum of the diffusion effect for the 0–1 million group andthe interaction term for that particular population group). Standard errors, shown in parentheses, allow forheteroskedasticity, as well as correlation of error terms at the household-quarter level.***,**,* denote significance at the 1%, 5%, and 10%, respectively.
1346

Information Diffusion Effects in Individual Investors’ Common Stock Purchases
by their neighbors’ investment choices because they wish to conformand keep pace with their neighbors’ wealth and investment habits[Bernheim (1994), Campbell and Cochrane (1999), and Shore and White(2003)]. Moreover, to the extent that individuals choose their place ofresidence according to their preferences, and those tend to be correlatedamong the residents of the same geographic area, it is possible thatsimilar tastes might govern investment decisions even without explicitcommunication with their neighbors. Finally, it is plausible that individualinvestors’ own preferences are correlated over time; individuals mighthave an inclination to conform to some of their previous investmentchoices (e.g., favoring stocks from the same industry as they previouslydid).
To explore the effect of correlated preferences, we define two variablesfor each (h, t) observation. First, we define the industry compositionof stock positions of neighboring households (excluding household h
itself) at the end of quarter t − 1. Second, we define the industrycomposition of stock positions of the household itself at the end ofquarter t − 1. The inclusion of these two position-related variables in thespecification explicitly accounts for any underlying correlation in tradingactivity attributable to a similarity in preferences within a community thatmanifests itself in a similarity of stock purchases within the community or asimilarity in an individual’s own stock preferences over time. This approachrequires merging purchases in quarter t with positions at the end of quartert − 1. Although there is substantial overlap between household identifiersfor trades and positions in the database, the matching is imperfect and itallowed us to retain around two-thirds of the original observations usedin previous analyses.
3.2.2 The structure of the local economy. Companies routinely seekto generate a certain presence in the local community. One immediateeffect of such endeavors is investors’ enhanced familiarity with localcompanies, generated through social interaction with employees andcompany efforts such as local advertising and sponsoring local events.Investors’ propensity to invest in the companies (industries) they arefamiliar with, and perhaps even informed about, undoubtedly constitutesone important facet of information diffusion. Moreover, the local presenceof a company may enhance the probability of circulation of veryprecise, inside information, an issue we addressed to a certain extentin Section 2.
To capture the impact of the structure of the local economy, we definevariables that characterize the distribution of the local economy and locallabor force across industries. Specifically, for each (h, t, i) observationwe define two variables: the fraction of market value of publicly tradedcompanies local to household h in quarter t in industry i and the fraction
1347

The Review of Financial Studies / v 20 n 4 2007
of the labor force local to household h in quarter t employed in industryi.11
Including these two variables should pick up both the effects that stemfrom familiarity with local companies and the potential direct company-stock effect. For example, if there are many employees working forconstruction companies in the area, a household’s propensity to investin construction firms could stem from word-of-mouth effects—socialinteraction between these employees and other households—or from thoseemployees’ propensity to invest in their own company stock (company-stock effects).
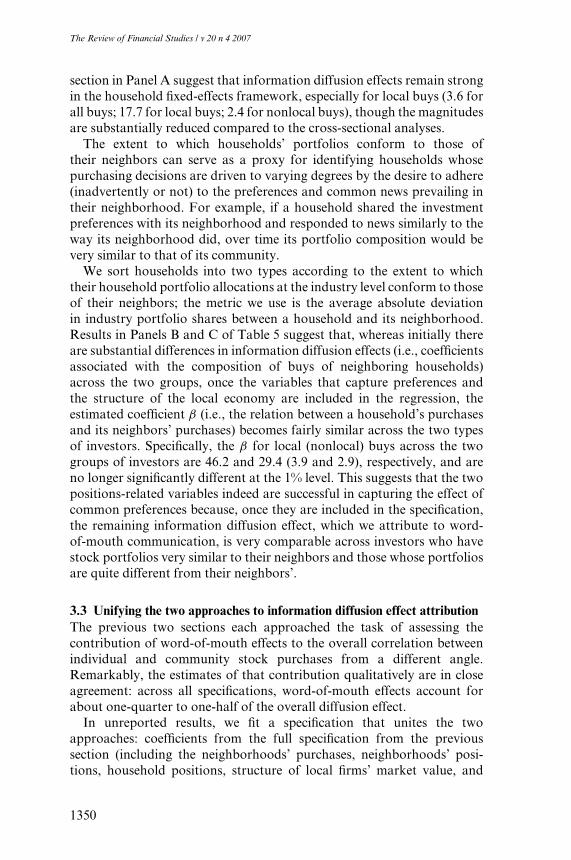
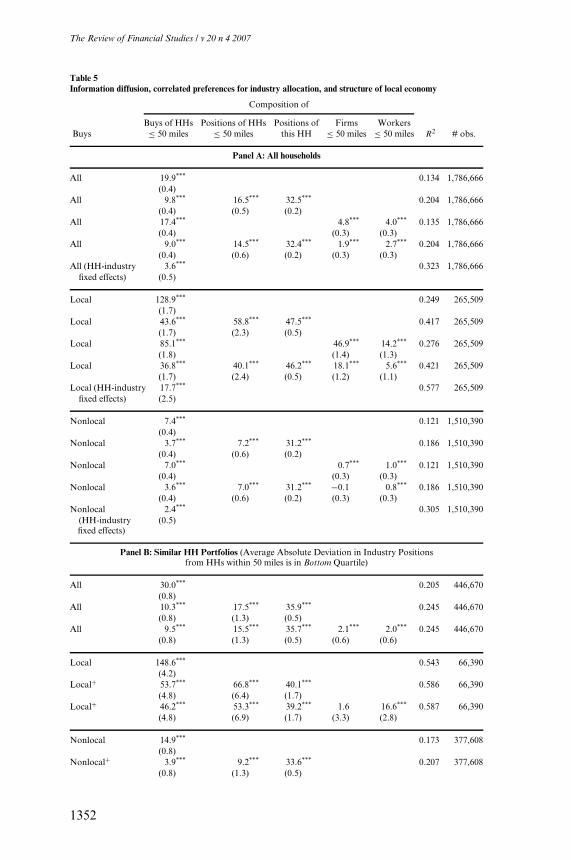
3.2.3 The results. The results of relating the industry compositionof a household’s investments to the neighborhood’s preferences, thehousehold’s own preferences, and the structure of the local economyare presented in Table 5. Panel A has three sections, containing estimatesfor all buys, local buys, and nonlocal buys, respectively. Within eachsection, we first show the baseline result, which is aligned very closely withthe corresponding baseline result in Table 2, Panel A.12 The followingrow in each section shows the results with the two additional independentvariables that capture preferences for industry allocation. Both variablesare statistically significant, which suggests that households’ purchasesacross industries are related to the common preferences that prevail in theirneighborhoods, as well as their own revealed preferences (as described bytheir current stock positions). For example, the point estimates suggest thathouseholds entering the quarter with a stock portfolio fully concentratedin a particular industry allocate 31 to 48 percentage points more oftheir quarterly purchases to that same industry. The point estimate of β,interpreted as the information diffusion effect unrelated to such preferences(i.e., the word-of-mouth component), is equal to one-half of the magnitudeof the estimated effect of the overall information diffusion for all buys andnonlocal buys, and to one-third for local buys.
The third row in each section of Panel A includes the variables thatcapture the structure of the local economy. Both local-economy variablesare positively related to the allocation of household purchases acrossindustries and are statistically significant, although they tend to attenuatethe estimate of β to a much lesser degree than the two variables relatedto preferences. Whereas the effect of the structure of the local economy is
11 Our measure of the industry composition of the local labor force is based on the composition of employeesat publicly traded companies, which we obtain from COMPUSTAT. For the purpose of this analysiswe assume that all the company’s employees are employed in the same county in which the companyheadquarters is located. This is a somewhat imprecise measure, but, to our knowledge, more precise paneldata regarding the geographic distribution of the employees for each company are not available.
12 We attribute the small discrepancies between the point estimates (e.g., 19.9 in Table 5 vs. 20.7 in Table 2for all buys) to the differing numbers of observations, that is, to the different samples employed in therespective analyses.
1348

Information Diffusion Effects in Individual Investors’ Common Stock Purchases
present for all the subsamples, the impact is by far the strongest for localbuys. Specifically, a 10 percentage point change in the presence of a certainindustry (as measured by firm values) is associated with a 4.7 percentagepoint change in the allocation of a local household’s local purchasesacross industries. The impact of the industry-level structure of the locallabor force is also noticeable (1.4 percentage point change), though it isnot as strong. The higher correlations of the local economy variableswith local buys could partially reflect company-stock issues, namely, thepropensity to invest in a firm for which household members work (orhave worked). On the other hand, the significant correlations of the localeconomy variables with nonlocal buys likely do not reflect this concern;instead, they likely reflect the notion that households’ familiarity with localinvestment opportunities influences households’ nonlocal investments aswell.
The fourth row in each section features the results of relating theindustry composition of a household’s investments to both preferences(the neighborhood’s and the household’s own) and the structure of thelocal economy. Estimates of the effects of all the four variables arepositive and statistically significant. Most importantly, the point estimateof β, interpreted as the information diffusion effect unrelated to eitherpreferences or the structure of the local economy, approximately equalsone-half of the magnitude of the estimated effect of the overall informationdiffusion for all buys and non-local buys, and one-third for local buys.13
The final analysis reported in Panel A of Table 5 seeks to capturedifferences among households along unobservable characteristics byrunning the baseline regression from Equation (2) with the inclusionof household-industry-level fixed effects. This is a very rigorous testbecause it presents a higher standard than the baseline specification: itrelates the change in a household’s allocation of purchases to an industryfrom its time series average allocation of purchases to the industry withthe change in its neighborhood’s allocation of purchases to the industryfrom the neighborhood’s time series average allocation of purchases tothe industry. For example, an investor who likes technology stocks mayhappen to live in an area in which others independently also happento invest in technology stocks. Such a noncausal correlation would leadtoward the detection of diffusion effects in a cross-sectional regression evenif investors acted independently. By contrast, to identify diffusion effectsin a panel regression requires that, in response to a change in communitytechnology stock investment, the household should change its allocationto technology stocks in the same direction. Results in the last row of each
13 This is a very robust estimate. Inspection of quarterly estimates (unreported for brevity) suggests thatword-of-mouth communication accounts for 40 to 50% of the overall information diffusion effect (i.e.,correlation of household stock purchases with that of their neighbors) in the vast majority of quarters,with a range of 21 to 56%.
1349
The Review of Financial Studies / v 20 n 4 2007
section in Panel A suggest that information diffusion effects remain strongin the household fixed-effects framework, especially for local buys (3.6 forall buys; 17.7 for local buys; 2.4 for nonlocal buys), though the magnitudesare substantially reduced compared to the cross-sectional analyses.
The extent to which households’ portfolios conform to those oftheir neighbors can serve as a proxy for identifying households whosepurchasing decisions are driven to varying degrees by the desire to adhere(inadvertently or not) to the preferences and common news prevailing intheir neighborhood. For example, if a household shared the investmentpreferences with its neighborhood and responded to news similarly to theway its neighborhood did, over time its portfolio composition would bevery similar to that of its community.
We sort households into two types according to the extent to whichtheir household portfolio allocations at the industry level conform to thoseof their neighbors; the metric we use is the average absolute deviationin industry portfolio shares between a household and its neighborhood.Results in Panels B and C of Table 5 suggest that, whereas initially thereare substantial differences in information diffusion effects (i.e., coefficientsassociated with the composition of buys of neighboring households)across the two groups, once the variables that capture preferences andthe structure of the local economy are included in the regression, theestimated coefficient β (i.e., the relation between a household’s purchasesand its neighbors’ purchases) becomes fairly similar across the two typesof investors. Specifically, the β for local (nonlocal) buys across the twogroups of investors are 46.2 and 29.4 (3.9 and 2.9), respectively, and areno longer significantly different at the 1% level. This suggests that the twopositions-related variables indeed are successful in capturing the effect ofcommon preferences because, once they are included in the specification,the remaining information diffusion effect, which we attribute to word-of-mouth communication, is very comparable across investors who havestock portfolios very similar to their neighbors and those whose portfoliosare quite different from their neighbors’.
3.3 Unifying the two approaches to information diffusion effect attributionThe previous two sections each approached the task of assessing thecontribution of word-of-mouth effects to the overall correlation betweenindividual and community stock purchases from a different angle.Remarkably, the estimates of that contribution qualitatively are in closeagreement: across all specifications, word-of-mouth effects account forabout one-quarter to one-half of the overall diffusion effect.
In unreported results, we fit a specification that unites the twoapproaches: coefficients from the full specification from the previoussection (including the neighborhoods’ purchases, neighborhoods’ posi-tions, household positions, structure of local firms’ market value, and
1350

Information Diffusion Effects in Individual Investors’ Common Stock Purchases
structure of the local labor force) are interacted with the dummyvariable capturing neighborhoods’ sociability used in Section 3.1. Forthe subsample of all buys, for example, the coefficient associatedwith buys of neighboring households from Table 5, 9.0, translatesinto 6.1 among households located in less sociable neighborhoodsand 11.2 among households located in more sociable neighbor-hoods.
There also is a stark contrast between the impact of area sociability onthe coefficients associated with the structure of local firm market value(as defined by the share of market capitalization of local firms across the14 industries) and those associated with the structure of the local laborforce (as defined by the share of employees across the 14 industries in thearea). Whereas high area sociability reduces the importance of the share oflocal firm market value in a particular industry on household investmentchoice, it increases the influence of the fraction of local employees in aparticular industry. Among households in less sociable states, the fractionof local firm market value in a particular industry is a more importantpredictor of the fraction of a household’s stock purchases in that sameindustry than the local employee share is. However, among householdsin more sociable states, the fraction of local firm market value in aparticular industry is uncorrelated with the fraction of a household’sstock purchases in that same industry, whereas the industry-compositionof local workers has increased importance over household stock picks.These findings further suggest that the state-level measure of sociabilitywe employ is useful in isolating the word-of-mouth effect on investmentdecisions.
3.4 Do lagged purchases in one neighborhood predict purchases in anotherneighborhood?In our final analysis, we explore whether lagged purchases in oneneighborhood predict the purchases in another neighborhood. Up tothis point, we focused primarily on relating household investmentdecisions to those made by their immediate neighbors. Figure 1 showsthat purchases made by a household are related not only to thosemade in the immediate community but also, to some extent, to thosemade in more distant communities. However, as one might suspect,and as is confirmed in Figure 1, a household’s purchases of nonlocalstocks are more sensitive to the decisions made by members of moredistant communities than its purchases of local stocks are. That is, goingbeyond the 50-mile community leads to a substantially faster declinein information diffusion effects in the domain of local stocks than inthe domain of nonlocal stocks. Simply put, households are relativelyless likely to be influenced by nonlocals when making their local stockpicks.
1351
The Review of Financial Studies / v 20 n 4 2007
Table 5Information diffusion, correlated preferences for industry allocation, and structure of local economy
Composition of
Buys of HHs Positions of HHs Positions of Firms WorkersBuys ≤ 50 miles ≤ 50 miles this HH ≤ 50 miles ≤ 50 miles R2 # obs.
Panel A: All households
All 19.9*** 0.134 1,786,666(0.4)
All 9.8*** 16.5*** 32.5*** 0.204 1,786,666(0.4) (0.5) (0.2)
All 17.4*** 4.8*** 4.0*** 0.135 1,786,666(0.4) (0.3) (0.3)
All 9.0*** 14.5*** 32.4*** 1.9*** 2.7*** 0.204 1,786,666(0.4) (0.6) (0.2) (0.3) (0.3)
All (HH-industry 3.6*** 0.323 1,786,666fixed effects) (0.5)
Local 128.9*** 0.249 265,509(1.7)
Local 43.6*** 58.8*** 47.5*** 0.417 265,509(1.7) (2.3) (0.5)
Local 85.1*** 46.9*** 14.2*** 0.276 265,509(1.8) (1.4) (1.3)
Local 36.8*** 40.1*** 46.2*** 18.1*** 5.6*** 0.421 265,509(1.7) (2.4) (0.5) (1.2) (1.1)
Local (HH-industry 17.7*** 0.577 265,509fixed effects) (2.5)
Nonlocal 7.4*** 0.121 1,510,390(0.4)
Nonlocal 3.7*** 7.2*** 31.2*** 0.186 1,510,390(0.4) (0.6) (0.2)
Nonlocal 7.0*** 0.7*** 1.0*** 0.121 1,510,390(0.4) (0.3) (0.3)
Nonlocal 3.6*** 7.0*** 31.2*** −0.1 0.8*** 0.186 1,510,390(0.4) (0.6) (0.2) (0.3) (0.3)
Nonlocal 2.4*** 0.305 1,510,390(HH-industryfixed effects)
(0.5)
Panel B: Similar HH Portfolios (Average Absolute Deviation in Industry Positionsfrom HHs within 50 miles is in Bottom Quartile)
All 30.0*** 0.205 446,670(0.8)
All 10.3*** 17.5*** 35.9*** 0.245 446,670(0.8) (1.3) (0.5)
All 9.5*** 15.5*** 35.7*** 2.1*** 2.0*** 0.245 446,670(0.8) (1.3) (0.5) (0.6) (0.6)
Local 148.6*** 0.543 66,390(4.2)
Local+ 53.7*** 66.8*** 40.1*** 0.586 66,390(4.8) (6.4) (1.7)
Local+ 46.2*** 53.3*** 39.2*** 1.6 16.6*** 0.587 66,390(4.8) (6.9) (1.7) (3.3) (2.8)
Nonlocal 14.9*** 0.173 377,608(0.8)
Nonlocal+ 3.9*** 9.2*** 33.6*** 0.207 377,608(0.8) (1.3) (0.5)
1352

Information Diffusion Effects in Individual Investors’ Common Stock Purchases
Table 5(continued)
Composition of
Buys of HHs Positions of HHs Positions of Firms WorkersBuys ≤ 50 miles ≤ 50 miles this HH ≤ 50 miles ≤ 50 miles R2 # obs.
Nonlocal+ 3.9*** 9.1*** 33.6*** 0.3 0.0 0.207 377,608(0.8) (1.3) (0.5) (0.6) (0.6)
Panel C: Disparate HH Portfolios (Average Absolute Deviation in Industry Positionsfrom HHs within 50 miles is in Top Quartile)
All 4.5*** 0.067 446,670(0.7)
All 6.4*** 7.2*** 27.8*** 0.143 446,670(0.7) (0.9) (0.3)
All 5.7*** 5.7*** 27.8*** 2.2*** 2.0*** 0.143 446,670(0.7) (0.9) (0.3) (0.5) (0.5)
Local 60.6*** 0.064 66,390(3.2)
Local+ 40.6*** 52.4*** 45.7*** 0.265 66,390(3.1) (4.1) (0.7)
Local+ 29.4*** 29.1*** 43.9*** 30.0*** 3.4 0.275 66,390(3.0) (4.0) (0.8) (2.2) (2.3)
Nonlocal 0.1 0.063 377,608(0.7)
Nonlocal+ 3.1*** 2.3*** 27.1*** 0.135 377,608(0.7) (0.9) (0.3)
Nonlocal+ 2.9*** 2.0** 27.1*** 0.1 0.8 0.135 377,608(0.7) (0.9) (0.3) (0.5) (0.6)
This table presents results of assessing the contribution of word-of-mouth effects to the overall informationdiffusion effect (i.e., correlation of household stock purchases with those made by of their neighbors).Accordingly, we regress households’ industry-level purchases on neighbors’ purchases, variables capturingcorrelated preferences for industry allocation, variables capturing the structure of the local economy, and322 industry-time dummy variables (a variant of Equation (2)). Two variables for each (h, t) observationare used to capture correlated preferences. First, we define the industry composition of stock positions ofneighboring households (excluding household h itself) at the end of quarter t − 1. Second, we define theindustry composition of stock positions of the household itself at the end of quarter t − 1. To capture theimpact of the structure of the local economy, for each (h, t, i) observation we define two variables: the fractionof market value of companies local to household h in quarter t in industry i and the fraction of the labor forcelocal to household h in quarter t employed in industry i. In this framework, estimates of β are conservativelower bounds on the contribution of word-of-mouth effects to the overall information diffusion effect. PanelA has three sections, containing estimates for all buys, local buys, and nonlocal buys, respectively. Withineach section, we first show the baseline result (i.e., Equation (2)). The following row in each section shows theresults with the two additional independent variables that seek to capture preferences for industry allocation.The third row in each section of Panel A includes the variables that capture the structure of the local economy.The fourth row in each section features the results of relating the industry composition of a household’sinvestments to both preferences (the neighborhood’s and own) and the structure of the local economy.The final analysis, reported in the fifth row in each section, seeks to capture differences among householdsalong unobservable characteristics by running the baseline regression from Equation (2) with the inclusionof household-industry-level fixed effects. Panels B and C show results of replicating the key analyses fromPanel A on two subsamples of households. Specifically, we sort households into two types according to theextent to which their household portfolio allocations at the industry level conform to those of their neighbors;the metric we use is the average absolute deviation in industry portfolio shares between a household and itsneighborhood. Standard errors, shown in parentheses, allow for heteroskedasticity, as well as correlation oferror terms at the household-quarter level.***,**,* denote significance at the 1%, 5%, and 10% levels, respectively.+ denotes that the difference in coefficients across the similar and disparate samples is not significant at theone percent level.
1353

The Review of Financial Studies / v 20 n 4 2007
Thus, a natural place to look for dissemination of information acrosscommunities is in a household’s purchase of nonlocal stocks. In particular,do the financial decisions of nearby households have less of an effectover time, whereas the decisions made by more distant households haveincreasing influence over time? To examine this issue, we use the same150-mile area surrounding a given household we employed to produce theresults in Figure 1. We relate the composition of a household’s quarterlypurchases of nonlocal stocks across industries to the contemporaneouspurchases and prior purchases (with a one-quarter and two-quarter lag)made by the households in the immediate 50-mile neighborhood as wellas those located 50–150 miles away (for simplicity, we divide these moredistant households into two rings of equal area around the immediate50-mile community).
Figure 2 illustrates information diffusion effects across distance fromthe household and time since purchase. Whereas the effects of theimmediate 50-mile community and the households contained in the firstring surrounding the immediate community decline monotonically overtime, the influence of the purchases made by the households contained inthe second ring (the area farthest from the household) actually increaseover time. In other words, whereas the contemporaneous purchases madeby a household’s closest neighbors have a larger impact on one’s own
2-Quarter Lag
1-Quarter Lag
Contemporaneous
50-MileCommunityFirst Ring
Around theCommunity
Second RingAround theCommunity
5.35
4.00
3.49
7.34
6.95
3.91
2.01
4.41
4.56
0.00
1.00
2.00
3.00
4.00
5.00
6.00
7.00
8.00
50-Mile Community First Ring Around the Community Second Ring Around the Community
(%)
Figure 2Information diffusion effects associated with investments in nonlocal stocks those made by time and space.
1354

Information Diffusion Effects in Individual Investors’ Common Stock Purchases
purchases than the decisions made by those neighbors one or two quartersago, the reverse is true for the effect of more distant households’ investmentchoices on a given household—the purchases made by the more distanthouseholds one and two quarters ago have a larger effect on a givenhousehold’s purchases this quarter than those made by the householdsfrom distant communities contemporaneously. Indeed, our unreportedtests suggest that the difference over time in the information diffusioneffects of both the immediate 50-mile community and the first ring arestatistically different from those of the more distant second ring.14
To be clear, a household’s immediate neighbors always have a biggerinfluence on its purchases than distant neighbors do (whether measuredcontemporaneously, with a one-quarter lag, or with a two-quarter lag).However, the pattern of information diffusion effects across time and spaceis broadly consistent with a gradual dissemination of information fromone community to another.
The Figure illustrates information diffusion effects by distance from thehousehold and time since purchase. The regression specification underlyingthe Figure is similar to Equation (2). However, instead of focusing only oncontemporaneous purchases made by other households within 50 miles,we now relate the composition of a given household’s purchases notonly to those made by other households within 50 miles but also tothose located 50–150 miles away (for simplicity, divided into two ringsof equal area around the immediate 50-mile community). The regressionspecification allows purchases made by surrounding communities to affecta given household’s purchase of nonlocal stocks contemporaneously, witha one-quarter lag, and with a two-quarter lag.
14 The regression specification underlying the results displayed in Figure 2 is similar to Equation (2).However, instead of focusing only on contemporaneous purchases made by other households within 50miles, we now relate the composition of a given household’s purchases not only to those made by otherhouseholds within 50 miles but also to those located 50–150 miles away (for simplicity, divided intotwo rings of equal area around the immediate 50-mile community). The regression specification allowspurchases made by surrounding communities to affect a given household’s purchase of nonlocal stockscontemporaneously, with a one-quarter lag, and with a two-quarter lag:
fh,t,i = β50,Contemporaneous F 50−h,t,i + β50, 1−quarter lag F 50
−h,t−1,i+ β50, 2−quarter lag F 50
−h,t−2,i
+β1st Ring,Contemporaneous F1st Ring−h,t,i
+ β1st Ring,1−quarter lag F1st Ring−h,t−1,i
+β1st Ring,2−quarter lag F1st Ring−h,t−2,i
+ β2nd Ring,Contemporaneous F2nd Ring−h,t,i
+β2nd Ring,1−quarter lag F2nd Ring−h,t−1,i
+ β2nd Ring,2−quarter lag F2nd Ring−h,t−2,i
+23∑t=1
14∑i=1
γ t,iDt,i+ εh,t,i . (3)
1355
The Review of Financial Studies / v 20 n 4 2007
4. Conclusion
We focus on the relation between the investment choices made by anindividual investor’s neighborhood (households located within 50 milesfrom the investor) and the investor’s own investment choices. Using adetailed set of common-stock investments that nearly 36,000 householdsmade in the period from 1991 to 1996, we find strong evidence ofinformation diffusion: baseline estimates suggest that a ten percentage-point increase in purchases of stocks from an industry made by ahousehold’s neighbors is associated with a two percentage point increasein the household’s own purchases of stocks from that industry, with theeffect larger for local stock purchases.
The findings are robust to controls for inside information effects,domination of a single company (industry) in the neighborhood, andhousehold fixed effects. In sum, there is strong evidence that individuals’stock purchase decisions are related to those made by their neighbors. Thestrength of the information diffusion effect is considerable; for example,investors in more populous areas, where, on average, there are many morelocal investment choices, still are very concentrated in their purchases. Tothe extent that their investment choices are related to their neighbors’,the information diffusion effect is likely at least partially responsible forindividual investors’ lack of diversification.
Putting our results in perspective and comparing them with the findingsfrom Feng and Seasholes (2004) delivers a new, richer understanding ofthe different mechanisms that govern individuals’ investment decisionsacross various societies. Whereas Feng and Seasholes (2004) reportthat individual investors’ correlated investment decisions are drivenby common reaction to locally available news, with no evidence ofword-of-mouth effects among Chinese investors, our estimates suggestthat word-of-mouth effects among U.S. individual investors are strong,particularly in the more social areas. This discrepancy likely reflectsdifferences in civil liberties and in the extent of presence of open andfree discussion across the two societies. Exploring the role of societalcharacteristics in portfolio decisions appears to be a fruitful area forfurther research.
Our results, in conjunction with those of Hong, Kubik, and Stein (2005),suggest that word-of-mouth effects are a broad phenomenon that affectsfinancial decisions made by both mutual fund managers and individualinvestors. Because word-of-mouth effects may create a dynamic exchangeof information that could lead to a ripple effect of further informationdissemination, which in turn may have an impact on stock prices, under-standing the interplay between individual and institutional trading acrosstime and space might yield insights into price dynamics in the stockmarket.
1356

Information Diffusion Effects in Individual Investors’ Common Stock Purchases
ReferencesBanerjee, A., 1992, ‘‘A Simple Model of Herd Behavior,’’ Quarterly Journal of Economics, 107, 797–817.
Barber, B., and T. Odean, 2000, ‘‘Trading is Hazardous to Your Wealth: The Common Stock InvestmentPerformance of Individual Investors,’’ Journal of Finance, 55, 773–806.
Barber, B., and T. Odean, 2007, ‘‘All That Glitters: The Effect of Attention and News on the BuyingBehavior of Individual and Institutional Investors,’’ Review of Financial Studies, forthcoming.
Barber, B., T. Odean, and N. Zhu, 2006, ‘‘Systematic Noise,’’ Working paper, UC Davis and UC Berkeley.
Bernheim, B. D., 1994, ‘‘A Theory of Conformity,’’ Journal of Political Economy, 102, 841–877.
Campbell, J. Y., and J. H. Cochrane, 1999, ‘‘By Force of Habit: A Consumption-Based Explanation ofAggregate Stock Market Behavior,’’ Journal of Political Economy, 107, 205–251.
Coval, J. D., and T. J. Moskowitz, 1999, ‘‘Home Bias at Home: Local Equity Preference in DomesticPortfolios,’’ Journal of Finance, 54, 1–39.
Coval, J. D., and T. J. Moskowitz, 2001, ‘‘The Geography of Investment: Informed Trading and AssetPrices,’’ Journal of Political Economy, 109, 811–841.
Duflo, E., and E. Saez, 2002, ‘‘Participation and Investment Decisions in a Retirement Plan: The Influenceof Colleagues’ Choices,’’ Journal of Public Economics, 85, 121–148.
Duflo, E., and E. Saez, 2003, ‘‘The Role of Information and Social Interactions in Retirement PlanDecisions: Evidence from a Randomized Experiment,’’ The Quarterly Journal of Public Economics, 118,815–842.
Ellison, G., and D. Fudenberg, 1993, ‘‘Rules of Thumb for Social Learning,’’ Journal of Political Economy,101, 93–126.
Ellison, G., and D. Fudenberg, 1995, ‘‘Word of Mouth Communication and Social Learning,’’ QuarterlyJournal of Economics, 110, 93–125.
Feng, F., and M. Seasholes, 2004, ‘‘Correlated Trading and Location,’’ Journal of Finance, 59, 2117–2144.
Freedom House, 2004, ‘‘Freedom in the World Country Ratings,’’ available athttp://www.freedomhouse.org/ratings/allscore04.xls.
Grinblatt, M., and M. Keloharju, 2001, ‘‘How Distance, Language, and Culture Influence Stockholdingsand Trades,’’ Journal of Finance, 56, 1053–1073.
Hong, H., J. D. Kubik, and J. C. Stein, 2004, ‘‘Social Interaction and Stock-Market Participation,’’Journal of Finance, 59, 137–163.
Hong, H., J. D. Kubik, and J. C. Stein, 2005, Thy Neighbor’s Portfolio: Word-of-Mouth Effects in theHoldings and Trades of Money Managers,’’ Journal of Finance, 60, 2801–2824.
Ivkovic, Z., J. Poterba, and S. Weisbenner, 2005, ‘‘Tax-Motivated Trading by Individual Investors,’’American Economic Review, 95, 1605–1630.
Ivkovic, Z., and S. Weisbenner, 2005, ‘‘Local Does as Local is: Information Content of the Geography ofIndividual Investors’ Common Stock Investments,’’ Journal of Finance, 60, 267–306.
Massa, M., and A. Simonov, 2006, ‘‘Hedging, Familiarity and Portfolio Choice,’’ Review of FinancialStudies, 19, 633–685.
Odean, T., 1998, ‘‘Are Investors Reluctant to Realize their Losses?’’ Journal of Finance, 53, 1775–1798.
Putnam, R. D., 2000, Bowling Alone: The Collapse and Revival of American Community, Simon andSchuster, New York.
Shore, S. H., and J. White, 2003, ‘‘External Habit Formation and the Home Bias Puzzle,’’ Working Paper,Harvard University.
U.S. Census Bureau, 1990, Gazetteer Place and Zip Code Database.
Zhu, N., 2002, ‘‘The Local Bias of Individual Investors,’’ Working paper, Yale School of Management.
1357