Commodity ROAD MAP - BFAR On-line Information System · The continuous study ... Intensify...
6
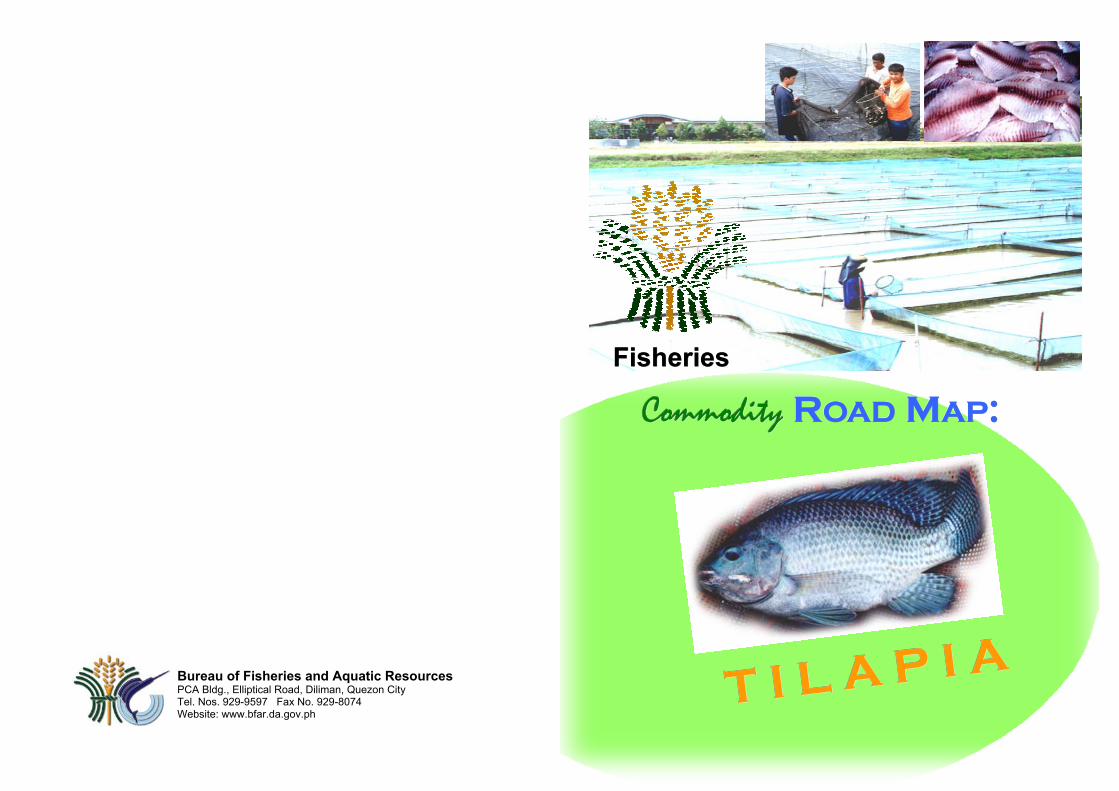
Bureau of Fisheries and Aquatic Resources PCA Bldg., Elliptical Road, Diliman, Quezon City Tel. Nos. 929-9597 Fax No. 929-8074 Website: www.bfar.da.gov.ph Commodity Commodity Commodity R R R OAD OAD OAD M M M AP AP AP : : : Fisheries Fisheries Fisheries T I L A P I A T I L A P I A T I L A P I A
Transcript of Commodity ROAD MAP - BFAR On-line Information System · The continuous study ... Intensify...
Bureau of Fisheries and Aquatic Resources PCA Bldg., Elliptical Road, Diliman, Quezon City Tel. Nos. 929-9597 Fax No. 929-8074 Website: www.bfar.da.gov.ph
CommodityCommodityCommodity RRROADOADOAD MMMAPAPAP: : :
FisheriesFisheriesFisheries
T I L A P I AT I L A P I AT I L A P I A

Prepared by: Fisheries Policy and Economics Division Bureau of Fisheries and Aquatic Resources 2008

Figure 3. Target for Agribusiness Lands ‐ 2007
I. EXECUTIVE SUMMARY
Tilapia is the second most important fish cultured in the Philippines
next to milkfish. In 2006, of the total fisheries production (4,408,472 MT), tilapia contributed 202,040.56MT or 22 %. Increased tilapia production is eminent over the last five years. The continuous study on the development of tilapia species and the use of a number of different culture technologies contributed to this steady increase in tilapia production. Region III lead the production of tilapia, having produced a total of 101,233.74 metric tons and sold some 73,900.63 metric tons or 73% of the total production to other regions with tilapia supply shortage. The government developed and launched a new tilapia strain, the GET EXCEL Tilapia. This is expected to further increase tilapia production in the country, increase income and provide livelihood opportunities among local fisherfolks. The establishment of central hatcheries in strategic areas nationwide assured the success of this intervention.
4 ROADMAP COMMODITY : T i l a p i a
II. Overview of the Industry
A. Accomplishments
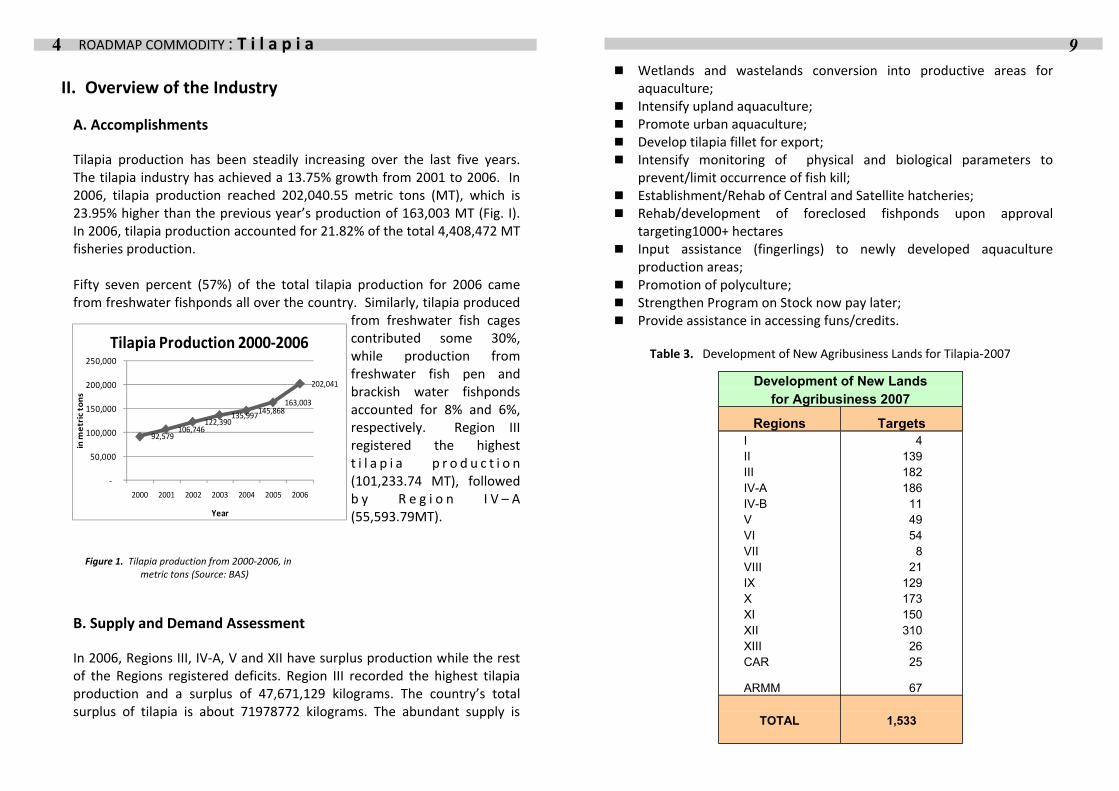
Tilapia production has been steadily increasing over the last five years. The tilapia industry has achieved a 13.75% growth from 2001 to 2006. In 2006, tilapia production reached 202,040.55 metric tons (MT), which is 23.95% higher than the previous year’s production of 163,003 MT (Fig. I). In 2006, tilapia production accounted for 21.82% of the total 4,408,472 MT fisheries production. Fifty seven percent (57%) of the total tilapia production for 2006 came from freshwater fishponds all over the country. Similarly, tilapia produced
from freshwater fish cages contributed some 30%, while production from freshwater fish pen and brackish water fishponds accounted for 8% and 6%, respectively. Region III registered the highest t i l a p i a p r o d u c t i o n (101,233.74 MT), followed b y R e g i o n I V – A(55,593.79MT).
Figure 1. Tilapia production from 2000‐2006, in metric tons (Source: BAS)
B. Supply and Demand Assessment
In 2006, Regions III, IV‐A, V and XII have surplus production while the rest of the Regions registered deficits. Region III recorded the highest tilapia production and a surplus of 47,671,129 kilograms. The country’s total surplus of tilapia is about 71978772 kilograms. The abundant supply is
92,579 106,746
122,390 135,997 145,868
163,003
202,041
‐
50,000
100,000
150,000
200,000
250,000
2000 2001 2002 2003 2004 2005 2006
in m
etr
ic t
ons
Year
Tilapia Production 2000‐2006
9 Wetlands and wastelands conversion into productive areas for
aquaculture; Intensify upland aquaculture; Promote urban aquaculture; Develop tilapia fillet for export; Intensify monitoring of physical and biological parameters to
prevent/limit occurrence of fish kill; Establishment/Rehab of Central and Satellite hatcheries; Rehab/development of foreclosed fishponds upon approval
targeting1000+ hectares Input assistance (fingerlings) to newly developed aquaculture
production areas; Promotion of polyculture; Strengthen Program on Stock now pay later; Provide assistance in accessing funs/credits.
Table 3. Development of New Agribusiness Lands for Tilapia‐2007
Development of New Lands for Agribusiness 2007
Regions Targets I 4 II 139 III 182 IV-A 186 IV-B 11 V 49 VI 54 VII 8 VIII 21 IX 129 X 173 XI 150 XII 310 XIII 26 CAR 25
ARMM 67
TOTAL 1,533

8 ROADMAP COMMODITY : T i l a p i a
III. Problems and Constraints
The problems and constraints currently facing the tilapia industry include: Very strict requirements to avail loan from lending institution and
also high interest rate; Extension services rendered should conform on the best aquaculture
practices; Lack of financial assistance; Unstable market price; High cost of farm inputs; Fish diseases/fish kills Lack of manpower to effectively transfer technology to the municipal
level; Marketing layers which stand between producer and consumer; and Lost opportunities to participate in global market for value‐added
products.
IV. Strategies and Interventions
To address the needs of the industry, the government, through the Department of Agriculture’s Bureau of Fisheries and Aquatic Resources (DA‐BFAR) embarks on major activities that will boost tilapia production, generate employment, increase income and eventually, uplift the lives of fisherfolk. As support to the Medium Term Philippine Development Plan (MTPDP) 2005‐2010 and in line with President Gloria Macapagal‐Arroyo’s 10‐Point Agenda, DA is tasked to “develop at least 2 million hectares of new land for agribusiness and generate 2 million jobs in six years” under Goal 1 and “reduce prices of wage goods through productivity enhancement, more efficient logistics, and improved linkages” under Goal 2. With these new thrusts, the following strategies for tilapia were made: Intensify seeding of major inland bodies of water, dams, reservoir,
SWIP and other; Fish cage culture in inland waters and NIA irrigation projects;
5 attributed to the excellent production of Region III and also, due to the fact that most of the regions in Mindanao and the Visayas prefer to eat marine fish species.
Table 1. Supply/production and demand analysis per region for Tilapia @ 1.7 kcy (2006)
BAS Production(2006)
Region Production Requirement GAP (kgs) (kgs)
CAR 2,673,140 7,193,114 (4,519,974) I 6,856,030 27,184,518 (20,328,488) II 8,813,210 10,466,600 (1,653,390) III 101,233,740 53,562,611 47,671,129 NCR 388,690 19,002,620 (18,613,930) IV - A 55,593,790 31,119,242 24,474,549 IV - B 536,640 6,783,446 (6,246,806) V 8,783,780 4,803,210 3,980,570 VI 660,200 36,271,308 (35,611,108) VII 207,130 6,974,505 (6,767,375) VIII 291,660 3,052,090 (2,760,430) IX 1,875,500 3,520,802 (1,645,302) X 890,150 3,912,913 (3,022,763) XI 854,520 8,438,006 (7,583,486) XII 9,389,500 8,347,397 1,042,103 ARMM 2,770,410 4,885,112 (2,114,702) CARAGA 222,460 3,420,260 (3,197,800) Philippines 202,040,550 146,954,127 55,086,423

6 ROADMAP COMMODITY : T i l a p i a
C. Distribution Map
Figure 2. Tilapia Distribution Map
7 D. Supply Chain/Marketing Layers From the fish farms, tilapia goes through the different marketing layers such as the consignacion or broker, buyers‐sellers, viajeros, and the retailers with price margins in every layer ranging from 20 to 25%, inclusive of the mark‐up and marketing costs. Primarily, tilapia is sold in the domestic market only. Insignificant volumes were shipped abroad. However, recent developments suggest potential markets for tilapia products (e.g. tilapia fillet) in the domestic and foreign markets including the United States and the BIMP‐EAGA Regions. Table 2. Cost Element and Current Cost in Tilapia Production
Cost Element Current Cost (P/kg) Production Cost 50.00
Feeds 42.00 Fingerlings 1.00 Labor & maintenance 6.00 PH Losses 1.5 Sub total 50.50
Margin (10% mark up) 5.00 Farmgate Price 55.50 Distribution Cost Element 10.16 Handling 1.39
Ice 1.29 Transport and Informal fees 4.46 Consignation Broker 3.02 Sub total 65.66
Margin (Buyers,Sellers,Viajeros) 5.00 Wholesale Price 65.66 RETAILING 5.34
Handling .70 Ice 1.79 Stall Rental 2.85 Sub total 76.00
MARGIN (retailer) 5.00 CONSUMER PRICE 81.00
Assumptions:
4-6 / kilo Medium size
SRP on Metro Manila market ; Q-Mart, Commonwealth, Novaliches, Muñoz and Farmers