
Commodity Research Report 09 January 2017 Ways2Capital
28
-
Upload
ways2capital-investment-advisor -
Category
Business
-
view
69 -
download
0
Transcript of Commodity Research Report 09 January 2017 Ways2Capital

E

BULLION METALS OUTLOOK -
GOLD - Gold prices inching upside in recent days over 4% from its all time low of $1122.5 in Comex.
We can expect the short term rally to continue till its psychological resistance at $ 1200. The medium
term trend remains bearish and we can expect fresh selling could come around $ 1200 for a near target
till $ 1150 to $ 1130 levels; even we are expecting prices to target $ 1100 to $ 1080 in coming days.
Gold prices in MCX with its short term positive trend from Rs.27000 could head towards Rs.28200 to
Rs.28400. The medium term trend could remain bearish for a target up to Rs.27500 to Rs.27000 levels
in coming days. The Significance levels for Next week is 27977-28175 is Up side and 27779-27581 is
Down Side.
GOLD CHART -
Chart Detail -
The statistical and technical indicators suggest that gold was going ahead and that it was due for a
correction. one key indicator is the moving average of convergence/divergence, which is also known
as MACD, and on a weekly basis the MACD and Parabolic SAR are indicating that the next move for
gold will be up. MCX gold is getting support at 27813 and below same could see a test of 27740 level,
And resistance is now likely to be seen at 27971, a move above could see prices testing 28056.
.
Monday, 09 January 2017
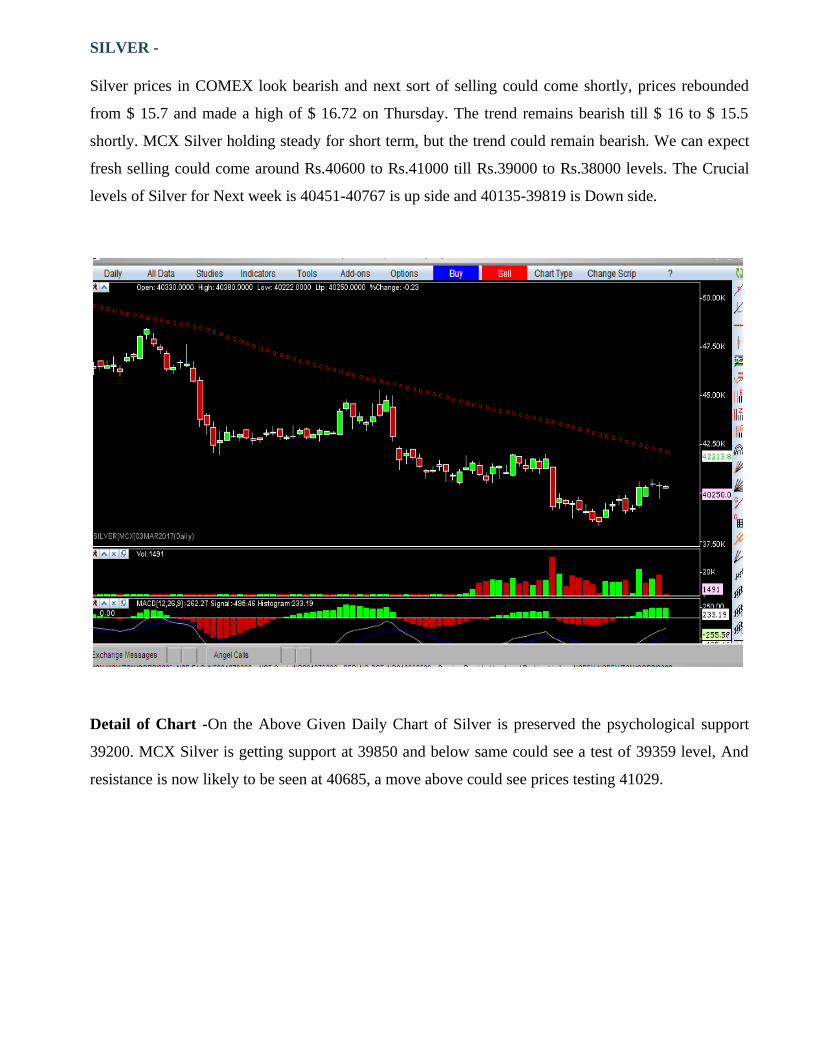
SILVER -
Silver prices in COMEX look bearish and next sort of selling could come shortly, prices rebounded
from $ 15.7 and made a high of $ 16.72 on Thursday. The trend remains bearish till $ 16 to $ 15.5
shortly. MCX Silver holding steady for short term, but the trend could remain bearish. We can expect
fresh selling could come around Rs.40600 to Rs.41000 till Rs.39000 to Rs.38000 levels. The Crucial
levels of Silver for Next week is 40451-40767 is up side and 40135-39819 is Down side.
Detail of Chart -On the Above Given Daily Chart of Silver is preserved the psychological support
39200. MCX Silver is getting support at 39850 and below same could see a test of 39359 level, And
resistance is now likely to be seen at 40685, a move above could see prices testing 41029.
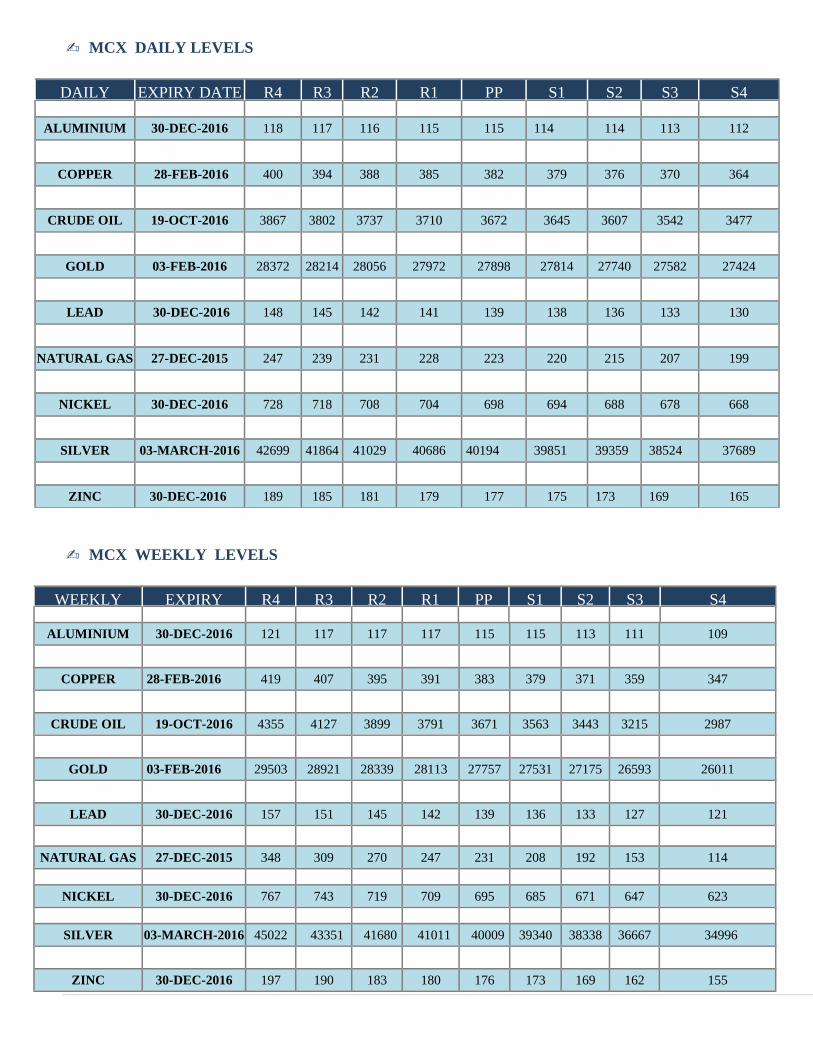
MCX DAILY LEVELS ✍
DAILY EXPIRY DATE R4 R3 R2 R1 PP S1 S2 S3 S4
ALUMINIUM 30-DEC-2016 118 117 116 115 115 114 114 113 112
COPPER 28-FEB-2016 400 394 388 385 382 379 376 370 364
CRUDE OIL 19-OCT-2016 3867 3802 3737 3710 3672 3645 3607 3542 3477
GOLD 03-FEB-2016 28372 28214 28056 27972 27898 27814 27740 27582 27424
LEAD 30-DEC-2016 148 145 142 141 139 138 136 133 130
NATURAL GAS 27-DEC-2015 247 239 231 228 223 220 215 207 199
NICKEL 30-DEC-2016 728 718 708 704 698 694 688 678 668
SILVER 03-MARCH-2016 42699 41864 41029 40686 40194 39851 39359 38524 37689
ZINC 30-DEC-2016 189 185 181 179 177 175 173 169 165
MCX WEEKLY LEVELS ✍
WEEKLY EXPIRY R4 R3 R2 R1 PP S1 S2 S3 S4
ALUMINIUM 30-DEC-2016 121 117 117 117 115 115 113 111 109
COPPER 28-FEB-2016 419 407 395 391 383 379 371 359 347
CRUDE OIL 19-OCT-2016 4355 4127 3899 3791 3671 3563 3443 3215 2987
GOLD 03-FEB-2016 29503 28921 28339 28113 27757 27531 27175 26593 26011
LEAD 30-DEC-2016 157 151 145 142 139 136 133 127 121
NATURAL GAS 27-DEC-2015 348 309 270 247 231 208 192 153 114
NICKEL 30-DEC-2016 767 743 719 709 695 685 671 647 623
SILVER 03-MARCH-2016 45022 43351 41680 41011 40009 39340 38338 36667 34996
ZINC 30-DEC-2016 197 190 183 180 176 173 169 162 155
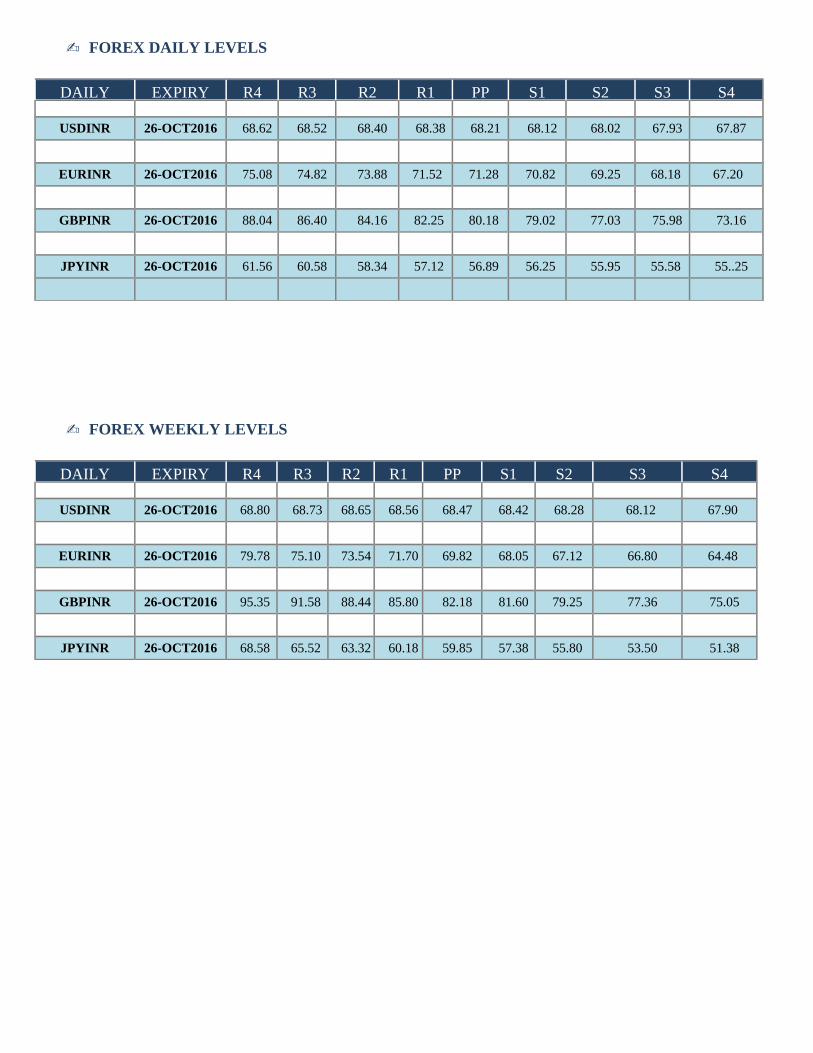
FOREX DAILY LEVELS ✍
DAILY EXPIRY R4 R3 R2 R1 PP S1 S2 S3 S4
USDINR 26-OCT2016 68.62 68.52 68.40 68.38 68.21 68.12 68.02 67.93 67.87
EURINR 26-OCT2016 75.08 74.82 73.88 71.52 71.28 70.82 69.25 68.18 67.20
GBPINR 26-OCT2016 88.04 86.40 84.16 82.25 80.18 79.02 77.03 75.98 73.16
JPYINR 26-OCT2016 61.56 60.58 58.34 57.12 56.89 56.25 55.95 55.58 55..25
FOREX WEEKLY LEVELS✍
DAILY EXPIRY R4 R3 R2 R1 PP S1 S2 S3 S4
USDINR 26-OCT2016 68.80 68.73 68.65 68.56 68.47 68.42 68.28 68.12 67.90
EURINR 26-OCT2016 79.78 75.10 73.54 71.70 69.82 68.05 67.12 66.80 64.48
GBPINR 26-OCT2016 95.35 91.58 88.44 85.80 82.18 81.60 79.25 77.36 75.05
JPYINR 26-OCT2016 68.58 65.52 63.32 60.18 59.85 57.38 55.80 53.50 51.38
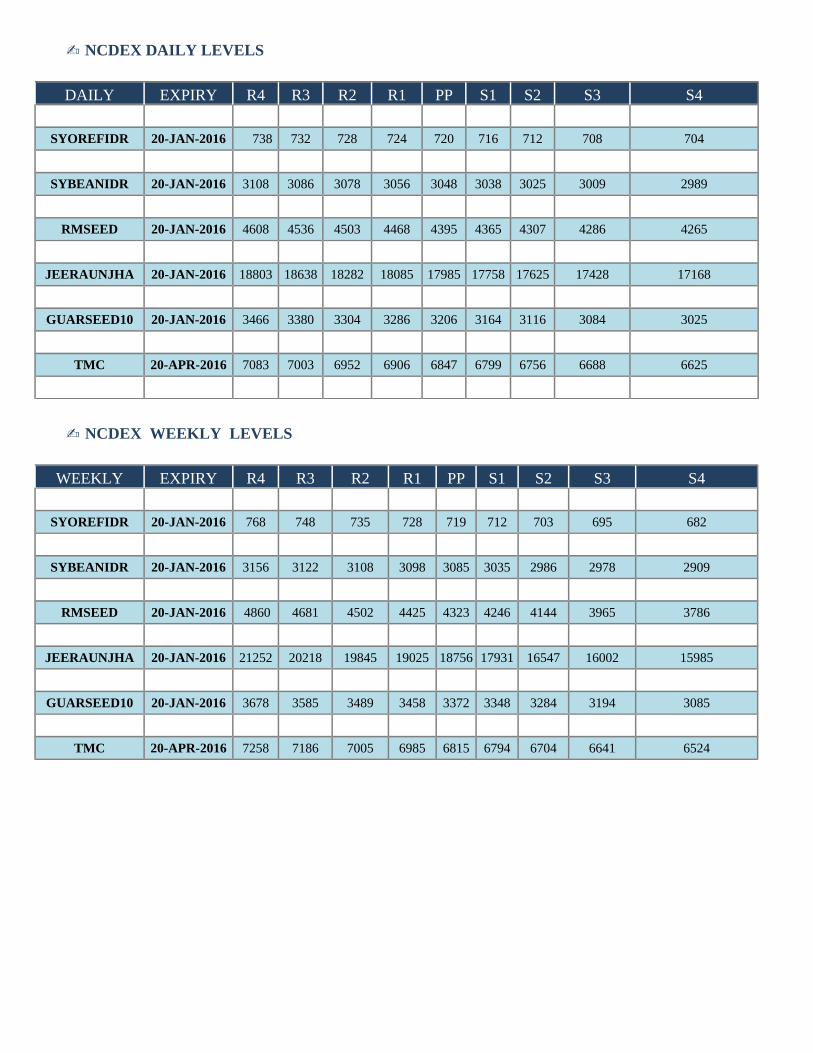
NCDEX DAILY LEVELS✍
DAILY EXPIRY
DATE
R4 R3 R2 R1 PP S1 S2 S3 S4
SYOREFIDR 20-JAN-2016 738 732 728 724 720 716 712 708 704
SYBEANIDR 20-JAN-2016 3108 3086 3078 3056 3048 3038 3025 3009 2989
RMSEED 20-JAN-2016 4608 4536 4503 4468 4395 4365 4307 4286 4265
JEERAUNJHA 20-JAN-2016 18803 18638 18282 18085 17985 17758 17625 17428 17168
GUARSEED10 20-JAN-2016 3466 3380 3304 3286 3206 3164 3116 3084 3025
TMC 20-APR-2016 7083 7003 6952 6906 6847 6799 6756 6688 6625
NCDEX WEEKLY LEVELS✍
WEEKLY EXPIRY
DATE
R4 R3 R2 R1 PP S1 S2 S3 S4
SYOREFIDR 20-JAN-2016 768 748 735 728 719 712 703 695 682
SYBEANIDR 20-JAN-2016 3156 3122 3108 3098 3085 3035 2986 2978 2909
RMSEED 20-JAN-2016 4860 4681 4502 4425 4323 4246 4144 3965 3786
JEERAUNJHA 20-JAN-2016 21252 20218 19845 19025 18756 17931 16547 16002 15985
GUARSEED10 20-JAN-2016 3678 3585 3489 3458 3372 3348 3284 3194 3085
TMC 20-APR-2016 7258 7186 7005 6985 6815 6794 6704 6641 6524

MCX - WEEKLY NEWS LETTERS
✍ INTERNATIONAL UPDATES ( BULLION & ENERGY )
Gold prices were little changed early on Monday, after dipping from a one-month high last week on
expectations of further interest rate hikes, with investor attention on more views from the U.S. Federal
Reserve.
FUNDAMENTALS
➢ Spot gold XAU= was steady at $1,173.06 an ounce by 0047 GMT. The metal rose nearly two percent
last week, its biggest weekly percentage rise since early November.
➢ U.S. gold futures GCcv1 were unchanged at $1,173.80 per ounce.
➢ The dollar index .DXY , which measures the greenback against a basket of currencies, edged 0.1
percent higher at 102.27.
➢ U.S. employment increased less than expected in December but a rebound in wages pointed to
sustained labor market momentum that sets up the economy for stronger growth and further interest rate
increases this year. Chicago Federal Reserve President Charles Evans said on Friday the central bank
could raise interest rates three times this year, faster than he had expected just a few months ago and in
line with the majority of his colleagues. The outlook for U.S. rates may become a little clearer when
Federal Reserve Chair Janet Yellen appears at a webcast town hall meeting with educators on Thursday.
➢ Two regional Fed presidents will speak later Monday, and there are no less than five speeches lined up
for Thursday. The main economic release of the week is not until Friday, when retail sales figures for
December are out.
Hedge funds and money managers cut their bullish position in COMEX gold contracts for the eighth
straight week in the week to Jan. 3, taking it to the smallest in 11 months, U.S. Commodity Futures
Trading Commission data showed on Friday. Gold demand in Asia gathered some steam last week on
wedding season purchases in India, with prices swinging to a premium there for the first time in over a
month, and traders expecting demand to strengthen due to the upcoming Chinese New Year.
Gold prices fell on Friday, retreating from the previous sessions one-month highs as the dollar
strengthened against a currency basket after U.S. jobs data showed a slowdown in hiring in December but
a pickup in wage growth. Gold for February delivery settled down 0.73% at $ 1,172.65 on the Comex
division of the New York Mercantile Exchange. The metal was still 1.97% higher for the week, its best
weekly performance in two months, helped by a broad weakening of the dollar earlier in the week. The
Labor Department said Friday the U.S. economy added 156,000 jobs in December, falling short of
economists forecast for jobs growth of 178,000. The report also showed that the annual rate of wage
growth rose to 2.9% in December from a year earlier, the strongest since 2009. The employment data
indicated that the economy is improving enough for the Federal Reserve to keep pushing up interest rates.
The Fed has indicated that three quarter-percentage-point interest rate increases are on the cards for 2017.
Higher rates boost the dollar by making the currency more attractive to yield-seeking investors. The U.S.
dollar index, which measures the greenback’s strength against a trade-weighted basket of six major
currencies, jumped 0.77% to 102.17 late Friday. The index had fallen in the previous two sessions after
touching a 14-year high of 103.82 on Tuesday. Both a strong dollar and higher interest rates are typically
bearish for gold, which is denominated in dollars and struggles to compete with yield-bearing assets when
borrowing costs rise. Elsewhere in precious metals trading, palladium ended at a five-week high of $
758.35 late Friday. The metal, which is used in vehicle catalysts to clean exhaust emissions ended the
week with gains of around 11% after data showing U.S. sales of new cars and trucks hit a record high in
2016. Silver was down 0.73% at $ 16.52 a troy ounce late Friday, after touching highs of $ 16.76 in the
previous session, its highest since December 15. Copper was up 0.18% at $2.54 a pound and ended the
week up 1.6%.
Platinum was down 0.32% on the day at $972.85 an ounce but was up almost 7.5% for the week. The
metal touched its highest since November 11 at $979.75 on Thursday. In the week ahead, investors will be
looking ahead to U.S. economic reports, particularly Friday’s retail sales figures for December.
Investors will also be watching an appearance by Fed Chair Janet Yellen on Thursday and speeches by a
handful of other Fed officials during the week.
Ahead of the coming week, Investing.com has compiled a list of these and other significant events likely
to affect the markets.
Monday, January 9
Financial markets in Japan will be closed for a holiday.
Australia is to release data on building approvals.
The U.K. is to release industry data on house price inflation.
Boston Fed President Eric Rosengren and Atlanta Fed President Dennis Lockhart are to speak.
Tuesday, January 10
Australia is to report on retail sales.
China is to release data on consumer and producer prices.
Canada is to publish figures on building permits.

Also Wednesday, U.S. President-elect Donald Trump is scheduled to hold his first post-election news
conference, which investors will be watching for any hints about the possible direction of economic
policy.
Wednesday, January 11
The U.K. is to release a report on manufacturing and industrial production as well as trade data.
Thursday, January 12
The European Central Bank is to publish the minutes of its last monetary policy meeting.
Canada is to report on new house price inflation.
The U.S. is to release the weekly jobless claims report along with data on import prices.
Fed Chair Janet Yellen is to speak at an event in Washington.
Also Thursday, Philadelphia Fed President Patrick Harker, Chicago Fed President Charles Evans, Atlanta
Fed's Dennis Lockhart, St. Louis Fed President James Bullard and Dallas Fed President Rob Kaplan are
due to speak.
Friday, January 13
China is to report on the trade balance.
The U.S. is to round up the week with reports on retail sales, producer prices and a preliminary look at
consumer sentiment.
Philadelphia Fed President Patrick Harker is also to speak.Gold slipped on Friday from the previous day's
one-month high as the dollar strengthened against a basket of currencies, lifted by U.S. non-farm payrolls
data that showed a slowing in hiring last month but an increase in wages. The report supported the view
that the U.S. Federal Reserve will press ahead with interest rate increases this year, analysts said. Spot
gold XAU= was down 0.4 percent at $1,175.90 an ounce by 1526 GMT. The metal was still 2.2 percent
higher this week, its biggest weekly rise in two months, helped by a broad weakening of the dollar earlier
in the week and a retreat in U.S. bond yields. But with markets uncertain ahead of Donald Trump's
inauguration on Jan. 20, investors turned cautious after gold reached its highest since Dec. 5 at $ 1,184.90
on Thursday. "Any profit that can be booked at this early stage is welcomed by most, so that's why we're
seeing a scaling back a bit," U.S. gold futures GCcv1 were down 0.4 percent at $ 1,176.30. Non-farm
payroll data showed that the United States added 156,000 jobs in December, less than expected, but a
rebound in wages pointed to sustained labour market momentum, stronger growth and further interest rate
rises from the Fed. data "doesn't change much in terms of the interest rate outlook. The Fed has indicated
that it will press ahead with further rate hikes this year after its second in a decade last month. Higher

interest rates exert downward pressure on the gold price by increasing the opportunity cost of holding
non-yielding bullion. "If we can manage to hold above $ 1,162 then the market has the potential of
moving up towards testing the really big area of resistance, which is just above $ 1,200.
Gold on Friday slipped from the one-month high touched in the previous session on a surge in dollar, with
traders waiting for U.S. jobs data later in the day for clues on the pace of possible U.S. interest rate hikes
this year. Spot gold XAU= eased 0.3 percent to $ 1,176.36 per ounce by 0543 GMT. The metal on
Thursday hit its highest since Dec. 5 at $ 1,184.90. U.S. gold futures GCcv1 were down 0.4 percent, at $
1,177 per ounce. "We can see a bit of profit-taking ahead of the nonfarm payroll data," A firm dollar will
put pressure on gold prices ahead of Donald Trump's inauguration. U.S. services sector activity held at a
one-year high in December as new orders surged, while the number of Americans filing for
unemployment benefits fell near a 43-year-low last week, suggesting the economy ended 2016 with
strong momentum. dollar index .DXY , which measures the greenback against a basket of currencies, was
up 0.2 percent at 101.680. Investors are focused on Friday's U.S. nonfarm payrolls report, with
economists expecting job gains of 178,000 in December. U.S. Fed has indicated that it would press ahead
with further interest rate hikes this year after its second rate increase in a decade last month. Positive data
usually puts pressure on gold prices, because investors raise bets on a U.S. interest rate hike that would
increase the opportunity cost of holding non-yielding bullion. Spot gold failed to break a resistance at $
1,182 per ounce and it may either hover below this level or retrace to a support at $ 1,159. Technical
charts look a bit weak on the daily side and prices might come down to the around $ 1,160. Holdings of
SPDR Gold Trust GLD , the world's largest gold-backed exchange-traded fund, fell 0.03 percent to
813.59 tonnes on Thursday from Wednesday. They have fallen over 14 percent since the U.S. presidential
election in November. Among other precious metals, spot silver XAG= fell 0.8 percent to $ 16.42. Silver
hit a high of $ 16.71, its best since Dec. 15, in the prior session.
Gold on Friday hovered near one-month highs touched the session before, with traders waiting for U.S.
jobs data later in the day for clues on the pace of possible U.S. interest rate hikes in 2017.
FUNDAMENTALS
➢ Spot gold XAU= had eased 0.2 percent to $1,178.53 an ounce by 0056 GMT. The metal on Thursday
hit its highest since Dec. 5 at $1,184.90.
➢ U.S. gold futures GCcv1 were also down 0.2 percent, at $1,179 an ounce.
➢ Investors are focused on Friday's U.S. non-farm payrolls report, with economists expecting job gains of
178,000 in December.
➢ U.S. services sector activity held at a one-year high in December as new orders surged, while the
number of Americans filing for unemployment benefits fell near a 43-year-low last week, suggesting the
economy ended 2016 with strong momentum. A raft of data from China in coming weeks is expected to
show the world's second-largest economy carried solid momentum into 2017, thanks to heavy government
stimulus and a construction boom that breathed new life into its ailing smokestack industries. Euro zone
producer prices rose for the third consecutive month in November on a monthly basis, mostly driven by
soaring energy prices which offset subdued prices for consumer goods, estimates released on Thursday by
Eurostat showed. SPDR Gold Trust GLD , the world's largest gold-backed exchange-traded fund, said its
holdings fell 0.03 percent to 813.59 tonnes on Thursday from Wednesday.
MARKET NEWS
➢ The U.S. dollar wobbled near three-week lows and U.S. bonds were bought back on Friday as investors
wound back 'Trump trade', helping to lift the world's stocks to 1-1/2 year highs.
➢ Oil prices were little changed on Friday after gaining nearly 1 percent the day before on news that
Saudi Arabia had cut production to meet OPEC's agreement to reduce output.
Gold touched its highest in four weeks on Thursday as the dollar slipped further from a 14-year peak hit
earlier this week. Spot gold XAU= rose as much as 1.4 percent to its highest since Dec. 7 at $ 1,179.36 an
ounce and was up 0.7 percent at $ 1,171.46 by 1128 GMT. U.S. gold futures GCcv1 climbed $ 6.90 to $
1,172 an ounce. Spot prices are heading for a near two percent gain for the week so far, having benefited
from a halt in the dollar's rise. "Although the wider picture hasn't changed and U.S. growth is improving,
there shouldn't be any further significant appreciation in the dollar after the strong run of the past few
months and given uncertainty about economic policy changes going forward. This should be supportive
for dollar-denominated gold. The metal, mostly used to clean exhaust emissions from gasoline-powered
catalysts, has been bought in anticipation of record-high vehicle sales in the United States and was also
boosted by a lower dollar. U.S. car sales December data on Wednesday showed sales of new cars and
trucks rose to a record in 2016. dollar . DXY fell 0.2 percent against a basket of six main currencies.
Minutes from the Federal Reserve's December meeting showed almost all policymakers thought the
economy could grow more quickly due to fiscal stimulus under the Trump administration. At the same
time, Fed policymakers "emphasized their considerable uncertainty" about future economic policy
changes. gold fell more than 8 percent in November and touched a 10-month low in December, on a
higher dollar and U.S. Treasury yields after Donald Trump's election win and as the Fed raised interest
rates for the first time in a year. It has now increased around 5 percent from its lows.
Buying from China, the biggest consumer of the yellow metal, is also supporting the recent rally. "The
Chinese New Year is around the corner. Gold kilobar demand is picking up right now with strong
premiums in the mainland. Holdings of the SPDR Gold Trust GLD , the world's largest gold-backed
exchange-traded fund, were unchanged on Wednesday at 813.87 tonnes. They have dropped about 14
percent since the U.S. presidential election in November. Spot silver XAG= was up 0.7 percent at $ 16.54,
after hitting a 3-week high of $ 16.70.
Gold prices eased on Wednesday after hitting a three-week high in the previous session, with the U.S.
dollar hovering near 14-year peaks against a basket of major currencies.
FUNDAMENTALS
➢ Spot gold XAU= was down 0.2 percent at $1,156.96 an ounce by 0051 GMT. It marked its highest
since Dec. 14 on Tuesday at $1,163.52.
➢ U.S. gold futures GCcv1 fell 0.4 percent to $1,157.70 per ounce.
➢ The dollar index .DXY , which measures the greenback against a basket of currencies, was at 103.34
after climbing to 103.82 the previous day, its strongest since December 2002.
➢ Holdings of the SPDR Gold Trust GLD , the world's largest gold-backed exchange-traded fund,
dropped 1.01 percent to 813.87 tonnes on Tuesday.
➢ U.S. factory activity accelerated to a two-year high in December amid a surge in new orders and
rapidly rising raw material prices, indicating that some of the drag on manufacturing from prolonged
dollar strength and a slump in oil prices was fading. Other data on Tuesday showed U.S. construction
spending hit a 10-1/2-year high in Nvember, providing a boost to a fourth-quarter economic growth
estimate. The reports suggested President-elect Donald Trump would inherit a strong economy, with a
labour market that is near full employment, from the Obama administration.
➢ China's factory activity picked up more than expected in December as demand accelerated, with output
reaching a near six-year high, a private business survey showed on Tuesday, giving the manufacturing
sector a solid boost heading into 2017.
Gold prices rose 1 percent to a near 3-week high on Tuesday as early gains in stocks and other assets
perceived as risky gave up gains and investors fled to save-haven bullion. Platinum and palladium both
jumped by more than 4 percent as investors scrambled for position as the new year got under way. The
themes of late 2016 appeared to be persisting in the wider markets, with equities rising while the dollar
index touched a 14-year high boosted by strong economic data. As the session progressed, the dollar and
equities pared gains, supporting gold prices. Spot gold XAU= was up 0.6 percent at $ 1,159.06 an ounce
by 2:17 p.m. EST , while U.S. gold futures GCv1 for February delivery ended the session up 0.9 percent
at $ 1,162. The metal fell sharply in the wake of Donald Trump's victory in November's U.S. presidential
election, sliding by more than 12 percent in the fourth quarter. Trump's victory boosted the dollar and
sparked a sharp rally in bond yields, lifting the opportunity cost of holding non-yielding gold and blunting
investors' appetite for the metal. However, Trump could also boost investor interest in the precious metal,
some market participants said. "We are not going to dismiss the precious metal completely considering
we still have the Trump card in the pack," "At a time when even his tweets are destabilising stocks, any
erratic policy proposals, let alone mismanaged implementation, can potentially trigger market uncertainty
and increase the investors' interest in gold." Indications from the U.S. Federal Reserve that it would press
ahead with further interest rate rises this year are also buoying the dollar and pressuring gold. A strong
start to 2016 meant that gold still managed to end last year with its first annual gain since 2012, rising by
8.5 percent. Spot platinum XPT= was up 4 percent at $935.24` per ounce after rising by more than 5
percent. Meanwhile, sister metal palladium XPD= was up 4.5 percent to $ 709 after rising by about 5
percent. "The repositioning in the futures market in the dying weeks of last year saw in platinum a
rebuilding in the gross short position, and at the same time long positioning remaining fairly steady.
"Right now I think this is some short-covering driving prices higher. "It's the start of the year, and there
are some funds rebalancing their portfolios. There might be some niche funds that are interested in these
metals, so that is part of the mix as well." Palladium was the best-performing precious metal last year,
with the price rising 20 percent for its biggest annual gain in six years. Platinum lagged gains in the wider
complex, however, ending 2016 only 1 percent higher. Both metals are widely used in auto catalyst
manufacturing, and are more exposed than gold to the economic cycle. Spot silver was up 2.23 percent at
$16.29 per ounce.
Gold prices ticked higher in the first trading session of 2017 on Tuesday, but gains were limited as the
prospect of rising U.S. interest rates this year kept sentiment bearish. Gold for February delivery on the
Comex division of the New York Mercantile Exchange tacked on $ 2.00, or around 0.2%, to $1,153.75 a
troy ounce by 3:50AM ET. The U.S. dollar rose on Tuesday, crawling back toward its 14-year-high
against a basket of currencies with markets focused on the possibility of further U.S. interest rate hikes in
2017. The U.S. dollar index, which measures the greenback’s strength against a trade-weighted basket of
six major currencies, was up 0.55% at 102.93 in early trade, not far from last week's 14-year peak of
103.62. Market analysts warned that the outlook for gold remains cloudy in the near-term amid
expectations of U.S. interest rates rising more rapidly during the incoming Trump Administration. The
Federal Reserve hiked interest rates for the first time in a year last month and projected three more
increases in 2017. Prices of the yellow metal have fallen sharply since Donald Trump was elected
president as a soaring U.S. dollar, rising Treasury yields and a record-breaking rally on Wall Street have
dampened its appeal. The precious metal is sensitive to moves in U.S. rates, which lift the opportunity
cost of holding non-yielding assets such as bullion, while boosting the dollar in which it is priced. Both a
strong dollar and higher interest rates are typically bearish for gold, which is denominated in dollars and
struggles to compete with yield-bearing assets when borrowing costs rise. Also on the Comex, silver
futures for March delivery added 7.3 cents, or 0.45%, to $16.02 a troy ounce during morning hours in
New York. Meanwhile, platinum tacked on 0.4% to $ 909.50 and palladium inched up 0.1% to $ 683.73
an ounce. Elsewhere in metals trading, copper futures rose 1.9 cents, or 0.8%, to $ 2.525 a pound
following a survey showing a pickup in China's factory activities for December. The China Caixin
manufacturing purchasing managers' index, a private gauge of nationwide factory activity, rose to 51.9 in
December from 50.9 in November. The figure marked the strongest upturn in Chinese manufacturing
conditions since January 2013. The Asian nation is the world’s largest copper consumer, accounting for
almost 45% of world consumption last year.
Gold began the new year quietly, edging up slightly on Tuesday, despite pressure from a strong dollar.
FUNDAMENTAL
Spot gold XAU= rose 0.2 percent to $ 1,154.26 per ounce at 0109 GMT.
➢ Bullion gained more than 8 percent in 2016, snapping three years of declines.
➢ U.S. gold futures rose 0.3 percent at $1,155.4
➢ The most active COMEX gold futures contract finished 2016 up 7.1 percent as compared to the end of
2015 after strong gains on economic uncertainty earlier in the year were pared by heavy selling as the
U.S. dollar rallied following the U.S. presidential election. The dollar index - which measures the
greenback against six major rivals - climbed over half a percent.
➢ The U.S. dollar held on to broad gains on Tuesday, resuming its ascent after last week's brief wobble as
the prospect of rising U.S. interest rates this year kept sentiment bullish on the long-run.
➢ Asian stocks began 2017 on a flat note on Tuesday, uninspired by a surge in European markets to their
highest in more than a year, while the dollar resumed its climb after last week's stumble.
➢ Starting in July 2017, banks and other financial institutions in China will have to report all domestic
and overseas cash transactions of more than 50,000 yuan ( or $7,201), compared with 200,000 yuan
previously, the central bank said on Friday. China's new rules on overseas currency transfers are not
capital controls, the official Xinhua news agency reported, even as some banks told customers that
purchases of foreign currency for property, securities and life insurance were not allowed. After a late-
year rally fuelled by the U.S. election pushed stocks to surprising new peaks, investors are wary that the
market could be primed for a spill to start 2017. Hedge funds and money managers slashed their net long
positions in COMEX gold to a near 11-month low and trimmed bullish bets in Silver contracts in the
week to Dec. 27, U.S. Commodity Futures Trading Commission data showed on Friday. SPDR Gold
Trust GLD , the world's largest gold-backed exchange-traded fund, said its holdings fell 0.14 percent to
822.17 tonnes on Friday from 823.36 tonnes on Thursday.
ENERGY
Oil prices fell early on Monday as Iran increased exports undermining efforts by other oil producers to
curb a global fuel supply overhang and as U.S. drillers increased activity for a 10th week. Brent crude

futures LCOc1 , the international benchmark for oil prices, were trading at $ 56.97 per barrel at 0019
GMT, down 13 cents from their last close.
U.S. West Texas Intermediate crude oil futures CLc1 were trading at $ 53.79 per barrel, down 20 cents.
The lower prices were a result of rising exports from Iran that come just as other members of the
Organization of the Petroleum Exporting Countries cut supplies in an effort to end a global glut. Iran has
sold more than 13 million barrels of oil held on tankers at sea, capitalising on an OPEC output cut deal
from which it is exempted to regain market share and court new buyers, according to industry sources and
data.
The amount of Iranian oil held at sea has dropped to 16.4 million barrels, from 29.6 million barrels at the
beginning of October, Before that sharp drop, the level had barely changed in 2016; it was 29.7 million
barrels at the start of last year, the data showed. surging tanker exports weren't the only indicator of
plentiful supplies. In the United States, U.S. energy companies last week added oil rigs for a tenth week in
a row, extending the drilling recovery into an eighth month as crude prices remained at levels at which
many U.S. drillers can operate profitably. "The next leg up in prices probably won't occur until the traders
see evidence that production levels are falling. In the meantime, rising U.S. drilling activity and output is
likely to keep prices in check,"
Drillers added four oil rigs in the week to Jan. 6, bringing the total count up to 529, the most since
December 2015, energy services firm Baker Hughes Inc BHI.N said on Friday. a result of the increased
drilling for new production, U.S. oil output C-OUT-T-EIA has risen by over 4 percent since its 2016 low
to almost 8.8 million barrels per day, although production remains 8.74 percent below its 2015 peak.
Oil futures finished slightly higher on Friday, logging their fourth weekly gain in a row with traders
encouraged by signs that major crude producers will adhere to the pledge to curb output. On the New
York Mercantile Exchange, crude oil for delivery in February inched up 23 cents, or about 0.4%, to end at
$ 53.99 a barrel by close of trade Friday.
U.S. crude prices touched an 18-month high of $ 55.24 on Tuesday.
For the week, New York-traded oil futures added 97 cents, or about 1.8%, after posting gains in each of
the previous three weeks. Elsewhere, on the ICE Futures Exchange in London, Brent oil for March
delivery tacked on 21 cents, or nearly 0.4%, to settle at $ 56.82 a barrel by close of trade. Brent prices
rallied to $58.37 on Tuesday, a level not seen since July 2015. London-traded Brent futures logged a gain
of 28 cents, or approximately 0.5%, on the week. Prices tallied a weekly gain amid signals that major oil
producers, such as Saudi Arabia and Kuwait, are sticking to their pledge to cut back output.
January 1 marked the official start of the deal agreed by OPEC and non-OPEC member countries such as
Russia in November last year to reduce output by almost 1.8 million barrels per day. The deal, if carried
out as planned, should reduce global supply by about 2%. However, some traders remain skeptical that
the planned cuts will be as substantial as the market currently expects. There are also some worries in the
market about production increases in Libya and Nigeria, which are both allowed to ramp up production as
part of the OPEC deal. Meanwhile, indications of increased drilling activity in the U.S. remained in focus.
According to oilfield services provider Baker Hughes, the number of rigs drilling for oil in the U.S. last
week increased by 4 to 529, the tenth straight weekly rise and a level not seen in almost a year.
Some analysts have warned that the recent rally in prices could be self-defeating, as it encourages U.S.
shale producers to drill more, adding to concerns over a global supply glut. Elsewhere on Nymex,
gasoline futures for February shed 0.3 cents, or 0.2% to $1.634 a gallon. It ended down about 2.2% for the
week. February heating oil ticked up 0.9 cents, or 0.5%, to finish at $1.728 a gallon. For the week, the fuel
declined around 1.5%. Natural gas futures for February delivery settled 1.2 cents, or 0.4%, higher at
$3.285 per million British thermal units, but still lost 43.9 cents, or 11.8%, on the week, as forecasts of
mild January weather replaced predictions of severe cold. In the week ahead, market participants will eye
fresh weekly information on U.S. stockpiles of crude and refined products on Tuesday and Wednesday to
gauge the strength of demand in the world’s largest oil consumer.
Traders will also continue to pay close attention to comments from global oil producers for further
evidence that they are complying with their agreement to reduce output this year.
Ahead of the coming week, Investing.com has compiled a list of these and other significant events likely
to affect the markets.
Tuesday, January 10
The American Petroleum Institute, an industry group, is to publish its weekly report on U.S. oil supplies.
Wednesday, January 11
The U.S. Energy Information Administration is to release weekly data on oil and gasoline stockpiles.
Thursday, January 12
The U.S. EIA is to produce a weekly report on natural gas supplies in storage.
Friday, January 13
Baker Hughes will release weekly data on the U.S. oil rig count.
Oil rose slightly on Friday on futures buying, ending the week higher, but gains were limited by a strong
U.S. dollar and lingering doubts about whether OPEC producers would stick to a deal to cut output.
Market players attributed choppy trading to position-squaring at the end of the week and low volumes at
the start of the year. Brent crude futures LCOc1 settled 21 cents higher at $ 57.10 per barrel, after trading
in a range of $ 56.28 to $ 57.47. The contract posted gains for the second week in a row. U.S. West Texas
Intermediate crude futures CLc1 ended the session up 23 cents at $ 53.99 a barrel, after swinging between
$ 53.32 and $ 54.32. WTI notched its third straight weekly gain. "There's a lot of volatility, or at least
changes in direction. "People think the long-term trend is up, but after a gain of a few dollars, they take
profit." The dollar .DXY gained broadly after the U.S. non-farm payrolls report showed slower hiring in
December but an increase in wages, feeding expectations of further interest rate increases from the
Federal Reserve this year. stronger greenback makes oil more expensive for holders of other currencies.
Top crude exporter Saudi Arabia and fellow Gulf members Abu Dhabi and Kuwait showed signs they
were cutting production in line with an agreement by members of the Organization of the Petroleum
Exporting Countries and other producers, yet market watchers have doubts about overall compliance.
signs that producers are reneging on their commitments could cause sentiment to sour and cause prices to
fall back sharply.
U.S. energy companies this week added oil rigs for a 10th week in a row, bringing the total count up to
529, the most since December 2015,
"Market balances are unquestionably tightening, but concerns pertaining to the pace at which the global
storage glut will be drawn down toward historically normal levels will be the focal point for the year
ahead," "While the market has centered its attention on the notional size of the announced cuts from both
OPEC and non-OPEC countries and whether or not the group will deliver on its promises, we believe that
an important factor is being overlooked ... the deal inadvertently tightens the medium and heavy balances
incrementally more than the light, sweet market."
Oil was slightly higher Friday, as hopes that a landmark agreement between major producers to cut output
continued to support prices and investors looked ahead to data on U.S. drilling activity. U.S. crude was up
35 cents, or 0.65%, at $54.11 at 06:50 ET, while Brent crude gained 39 cents, or 0.69%, to $ 57.28.
Reports out Thursday of supply cuts from Saudi Arabia and Abu Dhabi coming into effect as part of
efforts by the OPEC and other producers to curb a global supply glut gave oil prices upside. Also
supporting black gold, official EIA data out a day earlier saw crude stockpiles decline by 7.1 million
barrels, compared to expectations for a drop of 2.2 million. Still, market participants were cautious on
Friday ahead of the U.S. employment report for December. A rate rise may strengthen the U.S. dollar,
which could depress oil prices as it would make the greenback-denominated commodity more expensive
for holders of other currencies. Investors also looked ahead to the Baker Hughes U.S. rig count data for
the latest week. Last week, the oilfield services provider said that the number of rigs drilling for oil in the
U.S. increased by 2 to 525 in what was the ninth straight weekly rise and a level not seen in almost a year.
Oil prices edged up on Wednesday, recovering some losses from the previous day when the U.S.-dollar
hit a 14-year peak and weighed on crude markets. U.S. West Texas Intermediate crude oil futures CLc1

were trading at $ 52.58 per barrel at 0026 GMT, up 25 cents, or 0.5 percent, from the last settlement.
International Brent crude futures LCOc1 had yet to trade. Traders said that the increase was due to a dip
in the U.S. dollar, making dollar-traded fuel purchases for countries using other currencies at home
slightly cheaper. The move came after the dollar hit a 14-year peak on the back of strong U.S. economic
data. Wednesday's dip in the dollar, analysts expect the greenback to remain strong in the near future.
"The dollar remains supported due to the fact that the Fed has not only turned hawkish but it has already
started its policy tightening cycle, while the rest of the major central banks are pretty much dovish across
the board. moves in foreign exchange markets would likely be a strong driving factor in crude markets, as
investors weigh the prospects of money markets over commodity futures. In physical oil markets, all eyes
are on plans by major oil producers like the Organization of the Petroleum Exporting Countries to cut
crude supplies from this month in an effort to end global oversupply that has dogged markets for over two
years. Reflecting a tightening market, top oil exporter Saudi Arabia is expected to raise official selling
prices for all its crude grades to Asia in February. for physically delivered crude to customers around the
world are a key indicator in determining the prices for crude oil futures like Brent or WTI. "Crude oil has
risen... on expectations of reduced supply excess.
Oil prices climbed to 18-month highs on the first trading day of 2017 on Tuesday amid hopes that an
agreement between major producers to cut production will be effective in reducing a global supply glut
and rebalancing markets. Brent crude was trading up $ 1.33, or 2.34% at $ 58.15 a barrel at 08.10 Eastern
Time, the highest level since July 2015. Oil markets were closed on Monday after the New Year's
holiday. U.S. crude oil was $1.3, or 2.42% at $55.02, also it's highest since July 2015.
January 1 marked the official start of the deal agreed by the Organization of Petroleum Exporting
Countries and non-OPEC members in November to slash output by almost 1.8 million barrels per day.
Market analysts have said January will serve as an indicator of whether the agreement will be carried out.
Spot deals were limited in the first full trading day of 2017, while the crude oil futures contracts on which
West African oil is priced were notably volatile.
➢ Several pending tenders tied up some seller interest, with Indian firms IOC and BPCL running buying
tenders.
➢ Crude oil futures traded at 18-month highs before crashing more than $1 per barrel below the previous
close due to a resurgent U.S. dollar and questions surrounding OPEC's plans to cut production.
➢ A fire this week hit the Ivory Coast oil refinery SIR, which often processes West African crude, but the
company said that units apart from the hydrocracker where it started had not been affected. Traders expect
Saudi Arabia to raise its official selling prices to Asia, which could help West African grades compete for
buyers in the region. Spot buying demand was all but absent, with those holding Nigerian cargoes
targeting tender buyers in India.
➢ Loading delays plagued Exxon Mobil's production after workers in Nigeria staged industrial action late

last year.
➢ February loadings were impacted by the delays, and stood at 1.58 million bpd. Four planned cargoes of
Akpo condensate not included in the total.
➢ Awards for 2017 contracts were expected any day.
➢ Traders said there was a limited amount of oil left available after buying concluded quietly over the
holidays.
➢ The premium of Brent crude to Dubai crude futures fell to $1.90 per barrel, less than half the level of
the same time last year and close to the 2016 low of $ 1.79.
➢ A smaller gap makes oil priced versus Brent more attractive to the Asian buyers on which Angola
depends.
Oil prices rose on Tuesday, the first trading day of 2017, buoyed by hopes that a deal between OPEC and
non-OPEC members to cut production, which kicked in on Sunday, will drain a global supply glut.
Benchmark North Sea Brent crude LCOc1 was up 40 cents at $57.22 a barrel by 0845 GMT, not far
below the 2016 high of $ 57.89, reached on Dec. 12. U.S. light crude oil CLc1 was up 40 cents at $54.12
a barrel. Oil futures markets were closed on Monday for New Year public holidays. Jan. 1 marked the
official start of a deal agreed by the Organization of the Petroleum Exporting Countries and other
exporters such as Russia to reduce output by almost 1.8 million barrels per day. signals suggest the OPEC
and non-OPEC production cuts are raising hopes that the global oil oversupply will diminish. "Markets
will be looking for anecdotal evidence for production cuts. "The most likely scenario is OPEC and non-
OPEC member countries will be committed to the deal, especially in early stages."Libya, one of two
OPEC countries exempt from the output cuts, has increased its production to 685,000 bpd, from around
600,000 bpd in December, an official at the National Oil Corporation said on Sunday. non-OPEC Middle
Eastern oil producer Oman told customers last week that it would cut its crude oil term allocation volumes
by 5 percent in March. Russia's oil production in December remained unchanged at 11.21 million bpd,
near a 30-year high, but it was preparing to cut output by 300,000 bpd in the first half of 2017 in its
contribution to the accord.
U.S. oil prices rose in the first trading hours of 2017 on Tuesday, buoyed by a deal for OPEC and non-
OPEC production cuts which kicked off on Sunday. U.S. benchmark West Texas Intermediate CLc1
crude oil prices were up 35 cents, or 0.7 percent, at $ 54.07 at 0010 GMT, not far from last year's high of
$ 54.51 reached on Dec. 12. International Brent crude oil LCOc1 was yet to trade after closing up 68 cents
at $56.82 per barrel on Friday. Oil markets were closed on Monday after New Year's holiday. Jan. 1
marked the official start of the deal agreed by the Organization of Petroleum Exporting Countries and
non-OPEC member countries such as Russia in November last year to reduce output by almost 1.8 million
barrels per day. will serve as an indicator for whether the agreement can stick.Libya, one of two OPEC
member countries exempt from the deal, increased its production to 685,000 barrels per day as of Sunday,

up from around 600,000 a day in December, according to an official from the National Oil Corporation.
OPEC member countries, Oman notified its customers last week that it will cut its crude term allocation
volumes by 5 percent in March. member Russia's oil production in December remained unchanged at
11.21 million bpd, but it was preparing to cut output by 300,000 bpd in the first half of 2017 as part of its
efforts to join the global deal to reduce oversupply and rebalance the market.
With global oil markets closed on Monday and crude prices having pocketed gains of around 50% during
2016, traders prepared to watch developments surrounding the landmark deal reached by the Organization
of the Petroleum Exporting Countries and several non-OPEC oil producers to reduce their output this
year.
Oil futures finished with modest losses in the final trading session of 2016 on Friday, but scored the
biggest annual gain since 2009 in the wake of the agreement to tackle the global supply glut and support
crude prices.
OPEC members agreed to lower production by a combined 1.2 million barrels per day starting on Sunday,
January 1, their first such deal since 2008. The pact was followed by an agreement from 11 non-OPEC
producers, led by the largest producer outside the cartel Russia, to reduce their supplies by 558,000
barrels a day. The deal, the first of its kind in 15 years, aimed to reduce global supply by about 2%. From
more than $110 per barrel in 2014, oil prices dropped to its February bottom at a 13-year low of around
$26-per-barrel before recovering in later months as oil-producing countries made efforts to limit
production. Brent oil ended 2016 with an annual rise of 52%, while U.S. crude futures pocketed gains of
nearly 45%. Markets skeptical of output cut compliance, However, some traders remain skeptical that the
planned cuts will be as substantial as the market currently expects. Notably, Moscow promised to account
for 300,000 barrels per day of the 558,000 included in the agreement among non-OPEC producers.
However, Russia also indicated that it planned to reach a reduction of 200,000 barrels by March with the
additional 100,000 being cut by June. There are also some worries in the market about production
increases in Libya and Nigeria, which are both allowed to ramp up production as part of the OPEC deal.
Many analysts have also put into question just how much of the agreement will be carried out. Both JP
Morgan and Goldman Sachs put their forecast for compliance at 80% and 84%, respectively. “We now
harbor mounting concerns that cheating will inevitably undermine commitment to the agreement at some
point in the second semester,” JP Morgan suggested. Goldman explained their less-than-100% forecast
was “given that compliance to cuts outside of Gulf Cooperation Council producers (Saudi Arabia, Kuwait,
United Arab Emirates, Qatar, Bahrain and Oman) has historically been poor.” On the near-term horizon,
investors will likely have to wait for their possible first taste of compliance when the monitoring
committee meets in Vienna. Though OPEC secretary general Mohammed Barkindo had floated a date of
January 13, Kuwaiti oil minister Issam Al-Marzouq confirmed that the first meeting would come later.
"Preparations are under way to hold a meeting for the Kuwait-chaired special commission tasked with
monitoring adherence to crude oil cut on January 21-22 in Vienna," the minister said last Wednesday,
according to a report from the state-run Kuwait News Agency. “It should become better known in a few
weeks, around when Donald Trump takes office, just how much is being cut and how much is smoke-and-
mirrors,” Boslego Risk Services founder Robert Boslego said in an analysis.“The cuts announced are
unlikely to all start this month,” he said, also warning that Russia does not follow through, it would be
unlikely that many other Non-OPEC voluntary cuts will materialize either."You get until January 21 to
believe your hoped-for outcomes and then you converge with reality,” Clear View Energy Partners
managing director Kevin Book told CNBC, affirming that cheating on the deal was “inevitable”.
“Historically OPEC always blows past its targets," he added. U.S. shale producers likely to cap upside on
oil prices Meanwhile, indications of increased drilling activity in the U.S. remained in focus. Oilfield
services provider Baker Hughes said late Friday that the number of rigs drilling for oil in the U.S. during
the previous week increased by 2 to 525, the ninth straight weekly rise and a level not seen in almost a
year. Some analysts have warned that the recent rally in prices could be self-defeating, as it encourages
U.S. shale producers to drill more, adding to concerns over a global supply glut. “As higher prices kick in,
shale production would likely quickly ramp up, effectively capping oil prices above $ 60," analysts at
Standard & Poor’s explained. Ellen R. Wald, Ph.D., expert on the global energy industry, believes that oil
prizes will stabilize in 2017, as OPEC “is once again saying the right things and working towards
cooperation to limit production and raise prices.” “The OPEC production cuts may never be implemented
fully and likely will not last for too long, and further hurdles remain to bringing the full range of non-
OPEC producers on board, but the movement is now clearly in the direction of combined production
limits,” she explained.
BASE METAL’S OUTLOOK :
BASE METAL GUIDE -
Trading Ideas:
Nickel trading range for the day is 687.6-709.2.Nickel steadied as investors squared positions after a
strong U.S. payrolls report, even as they kept an eye on a stronger dollar.The impending moderation of
Indonesia's mineral ore export ban and consequent resumption of nickel exports will increase global
nickel supply.BMI maintained its 2017 nickel price forecast of $10 500/t on average.
ZINC
Zinc trading range for the day is 173.3-180.7.Zinc prices recovered from lows despite of stronger dollar in
the wake of strong manufacturing data from China.Miners remain cautious about the market, and the
market is expected to finish 2016 in deficit, demand expectations for 2017 are murky.China’s
infrastructure spending programs have been a major boost to zinc demand and these programs will wind
down in the second-half of the year.
COPPER
Copper trading range for the day is 376.4-387.6.Copper prices ended with gains as investors squared
positions after a strong U.S. payrolls report.The International Copper Study Group expects global copper
ore output to be 19.90 million tonnes in 2017, flat at 2016’s.Workers at Escondida, the world’s largest
open-pit copper mine, have rejected the company’s initial wage offer as collective talks begin.
BASE METAL
COPPER ✍
Copper prices rose by 0.12 per cent to Rs 380.90 per kg in futures trading on Friday as traders engaged in
enlarging their positions, tracking a firm trend at spot market on rising demand. At the Multi Commodity
Exchange, copper for delivery in February went up by 45 paise, or 0.12 per cent, to Rs 380.90 per kg in
business turnover of 961 lots. Similarly, the metal for delivery in far-month April was trading higher by
40 paise, or 0.10 per cent, to Rs 384.25 per kg in 5 lots. Analysts said widening of positions by
participants on the back of rising demand from consuming industries at domestic spot market, mainly kept
copper prices higher at futures trade.
NICKEL ✍
Falling for the second day, nickel prices shed 0.24 per cent to Rs 699.60 per kg in futures market as
participants engaged in reducing their positions amid subdued demand in the spot market. At the Multi
Commodity Exchange, nickel for delivery in February drifted lower by Rs 1.70, or 0.24 per cent to Rs
699.60 per kg in a business turnover of 3 lots. Likewise, the metal for delivery in January traded lower by
Rs 1.10, or 0.16 per cent to Rs 695 per kg in 701 lots. Analysts said, offloading of positions by traders
following easing demand from alloy-makers in the spot market, mainly kept nickel prices lower at futures
trade.
ZINC ✍
Zinc prices drifted lower by 0.37 per cent to Rs 176.35 per kg in futures trade as traders engaged in
trimming their positions, taking negative cues from spot market on fall in demand from consuming
industries. At the Multi Commodity Exchange, zinc for delivery in January declined by 65 paise, or 0.37
per cent, to Rs 176.35 per kg in a business turnover of 477 lots. Market analysts said offloading of
positions by participants owing to slackened demand from consuming industries in the spot market, kept
zinc prices down at futures trade.
COPPER ✍
Copper prices were up by 0.21 per cent to Rs 384.85 per kg in futures trade on Thursday as speculators
widened positions on the back of rising demand in the spot market amid a firm trend overseas. At the
Multi Commodity Exchange, copper for delivery in February traded higher by 80 paise, or 0.21 per cent,
to Rs 384.85 per kg, in a business turnover of 1,183 lots. Similarly, the metal for delivery in far-month
April edged up by 60 paise, or 0.15 per cent, to Rs 388.10 per kg in 13 lots. Analysts attributed the rise in
copper futures trade to a firm trend at the domestic physical market on pick up in demand from
consuming industries and a firm trend overseas.
NICKLE ✍
Nickle Prices drifted lower by 0.24 per cent to Rs 701.50 per kg in futures trading as speculators booked
profits at prevailing levels, driven by easing demand in the spot market. At the Multi Commodity
Exchange, nickel for delivery in February fell by Rs 1.70, or 0.24 per cent, to Rs 701.50 per kg, in a
business turnover of 11 lots. Similarly, the metal for delivery in January shed 80 paise, or 0.11 per cent, to
Rs 696.30 per kg in 811 lots. Analysts said besides profit-booking by traders, fall in demand from alloy-
makers in the spot market, mainly influenced nickel prices at futures trade.
LEAD ✍
Lead prices softened by 0.28 per cent to Rs 140.85 per kg in futures trading as traders trimmed their
positions amid subdued demand in the spot market. At the Multi Commodity Exchange, lead for delivery
in January shed 40 paise, or 0.28 per cent, to Rs 140.85 per kg, in a business turnover of 420 lots.
Similarly, the metal for delivery in February was trading down by 30 paise, or 0.21 per cent, to Rs 141.40
per kg in four lots. Marketmen said the fall in lead futures was triggered by a weak trend at the domestic
spot markets owing to sluggish demand from consuming industries, particularly battery-makers.
ZINC ✍
Prices eased by 0.36 per cent to Rs 177.55 per kg in futures trade as speculators reduced their positions,
driven by a fall in demand at the spot market. At the Multi Commodity Exchange, zinc for delivery in
January declined by 65 paise, or 0.36 per cent, to Rs 177.55 per kg, in a business turnover of 674 lots.
Likewise, the metal for delivery in February was down by 55 paise, or 0.31 per cent, to Rs 177.95 per kg
in 12 lots. Market analysts said zinc prices slide due to offloading of positions by participants amid tepid
demand at domestic spot markets.

COPPER ✍
Copper prices advanced by 0.21 per cent to Rs 377.40 per kg in futures trade on Wednesday as traders
engaged in enlarging their positions, tracking a firm trend at spot market on rising demand.
At the Multi Commodity Exchange, copper for delivery in February rose by 80 paise, or 0.21 per cent, to
Rs 377.40 per kg, in a business turnover of 589 lots. Similarly, the metal for delivery in far-month April
was trading higher by 75 paise, or 0.20 per cent, to Rs 380.90 per kg in seven lots. Analysts said widening
of positions by participants on the back of rising demand from consuming industries in the physical
market, mainly kept copper prices higher at futures trade.
LEAD ✍
Taking positive cues from the spot markets on uptick in demand, lead prices were up by 0.15 per cent to
Rs 138.10 per kg in futures trade as speculators built up fresh position. At the Multi Commodity
Exchange, lead for delivery in January edged up by 20 paise, or 0.15 per cent, to Rs 138.10 per kg, in a
business turnover of 322 lots. However, the metal for delivery in February held steady at Rs 138.50 per kg
in six lots. Market analysts attributed the rise in lead prices at futures trade to pick up in demand from
battery-makers.
NICKEL ✍
Continuing its rising streak for the third day, nickel prices traded higher by 0.64 per cent to Rs 688.20 per
kg in futures trading as participants engaged in building their positions, taking positive cues from spot
market on firm demand from alloy-makers. At the Multi Commodity Exchange, nickel for delivery in
January gained Rs 4.40, or 0.64 per cent, to Rs 688.20 per kg, in a business turnover of 366 lots.
Likewise, the metal for delivery in February was trading higher by Rs 3.80, or 0.55 per cent, to Rs 693.50
per kg in five lots. Market analysts said increasing of positions by traders following a firming trend at spot
market on strong demand from alloy-makers, mainly kept nickel prices higher at futures trade.
ALUMINIUM ✍
Prices edged up by 0.09 per cent to Rs 115.35 per kg in futures market as speculators built up fresh
positions amid pick up in demand in the spot market. At the Multi Commodity Exchange, aluminium for
delivery in January inched up by 10 paise, or 0.09 per cent, to Rs 115.35 per kg, in a business turnover of
28 lots. Marketmen said that fresh positions created by participants due to uptick in demand from
consuming industries in the physical market, mainly influenced aluminium prices at futures trade.
NCDEX - WEEKLY MARKET REVIEW
SOYBEAN✍
Soybean futures traded almost flat last week on good supplies in the physical as prices have consolidated
near 3000 levels . The demand is steady from the bulk buyers and oil millers. However, higher production
estimates by SOPA is keeping pressure on prices this season .U.S. soybean prices dropped on futures fell
on Friday on signs of weakening demand for U.S. exports as the South American harvest nears. In the
USDA’s weekly soybean report for Dec 23 - 29 exporters reported net sales of 87,500 MT for 2016/2017
- a marketing - year low -- was down 91% from the previous week and 94% from the prior 4- week
average. Moreover, rainfall forecasts in the month of January in the main soyabean growing states of
Brazil will be very beneficial for the soybean yield.
REFINE SOYA OIL✍
Refined soy oil futures closed higher last week by 1.4% tracking good physical demand by the market
participants. However, the prices have corrected in last two trading session last week due to profit
booking at higher levels. India import of soybean oil has declined to 1,64,286 tonnes in Nov from
2,56,836 tonnes in the year - ago period as supplies of soybean is good at lower prices. For the first
fortnight of January, the tariff value of crude soyoil was reduced by $ 20 per tonnes to $ 892 which is the
first reduction in three months by the government.
CRUDE PALM OIL✍
CPO Futures closed higher last week on anticipation of increase in physical demand for the oil after lower
demand during last two months due to affect on demonetization. Malaysian palm oil futures closed lower
last week, hitting their lowest in more than a week due to weaker performing rival oils and a stronger
ringgit. The current prices are already at higher levels compared to last four years. Slowing palm oil
shipments in recent weeks have also weighed on market sentiment. December exports of the tropical oil
are seen declining for a third straight month by 3%, while output is forecast to drop 8 percent to 1.45
million tonnes
SUGAR✍
Sugar Futures closed higher last week on reports that the sugar output may be lower than expected in the
country. India's sugar production in 2016/17 is likely to fall to 22 mt, down 4.3% from an earlier estimate,
as mills in its key producing state are closing early due to a cane shortage, as two years back - to - back
droughts have ravaged the cane crop in Maharashtra, the country's top sugar producer. The consumption
estimate is about 25 mt. As per sugar body, more than two dozen mills in India's top sugar producing

western state of Maharashtra have stopped crushing due to cane shortage while many more mills are
likely to shut before February end. The early shut to sugar crushing may result in lower production in
domestic market. Raw sugar futures on ICE Futures closed lower weighed by prospect of higher
production in China. China's 2016/17 sugar production had reached more than 2.3 mt by December, citing
data from the China Sugar Association.
COTTON✍
Cotton prices have moved up recently as market sentiment has improved with the Cotton Corporation of
India resorting to purchase of the commodity at commercial rates from different parts of key cotton
growing regions in the country. ICE cotton futures jumped more than 4% over the week on expectations
of improvement in demand from China and easing dollar also support prices. There are speculations that
the US 2016 cotton crop may be downgraded and could fall short of the US Department of Agriculture's
current 16.5m - bale estimate. Moreover, Speculators raised their net long in cotton by 5,573 contracts to
99,820 contracts, bringing their bullish stance back toward last month's record high in the week to Jan. 3
JEERA✍
Jeera futures closed higher last week on good physical and export demand. However, good sowing
progress of jeera in capped further gains. The progress of Jeera sowing in Gujarat is higher this season
after lagging behind in the previous week. As on 01- Jan -17, Gujarat farmers have planted jeera in
2,67,680 hectares, higher by 8400 hectares compared to last year acreage of 2,68,400 hectares till same
period. On the export front, India's jeera exports to raise about 30% to 88,000 tonnes in Apr -Dec, because
of robust demand from overseas market and negligible stocks in other exporting nations.
TURMERIC✍
Turmeric futures traded in the range last week as new season turmeric crop has now entered into the
markets in South India.The new crop is of medium quality which is fetching lower prices. On the export
front, country exported about 51,147 tonnes of turmeric during April-September period, up by 27% to
58,233 tonnes compared last year, as per government data. Expectations of increasing production in
coming harvesting season and lowering export demand in recent months are putting pressure on turmeric
prices.
LEGAL DISCLAIMER
This Document has been prepared by Ways2Capital (A Division of High Brow Market Research
Investment Advisor Pvt Ltd). The information, analysis and estimates contained herein are based on
Ways2Capital Equity/Commodities Research assessment and have been obtained from sources believed to
be reliable. This document is meant for the use of the intended recipient only. This document, at best,
represents Ways2Capital Equity/Commodities Research opinion and is meant for general information
only. Ways2Capital Equity/Commodities Research, its directors, officers or employees shall not in any
way to be responsible for the contents stated herein. Ways2Capital Equity/Commodities Research
expressly disclaims any and all liabilities that may arise from information, errors or omissions in this
connection. This document is not to be considered as an offer to sell or a solicitation to buy any securities
or commodities.
All information, levels & recommendations provided above are given on the basis of technical &
fundamental research done by the panel of expert of Ways2Capital but we do not accept any liability for
errors of opinion. People surfing through the website have right to opt the product services of their own
choices.
Any investment in commodity market bears risk, company will not be liable for any loss done on these
recommendations. These levels do not necessarily indicate future price moment. Company holds the right
to alter the information without any further notice. Any browsing through website means acceptance of
disclaimer.
DISCLOSURE
High Brow Market Research Investment Advisor Pvt. Ltd. or its associates does not do business with

companies covered in research report nor is associated in any manner with any issuer of products/
securities, this ensures that there is no actual or potential conflicts of interest. To ensure compliance with
the regulatory body, we have resolved that the company and all its representatives will not make any
trades in the market.
Clients are advised to consider information provided in the report as opinion only & make investment
decision of their own. Clients are also advised to read & understand terms & conditions of services
published on website. No litigations have been filed against the company since the incorporation of the
company.
Disclosure Appendix:
The reports are prepared by analysts who are employed by High Brow Market Research Investment
Advisor Pvt. Ltd. All the views expressed in this report herein accurately reflects personal views about the
subject company or companies & their securities and no part of compensation was, is or will be directly or
indirectly related to the specific recommendations or views contained in this research report.
Disclosure in terms of Conflict of Interest:
(a) High Brow Market Research Pvt. Ltd. or his associate or his relative has no financial interest in the
subject company and the nature of such financial interest;
(b) High Brow Market Research Pvt. Ltd. or its associates or relatives, have no actual/beneficial
ownership of one percent or more in the securities of the subject company,
(c) High Brow Market Research Pvt. Ltd. or its associate has no other material conflict of interest at the
time of publication of the research report or at the time of public appearance;
Disclosure in terms of Compensation:
High Brow Market Research Investment Advisor Pvt. Ltd. policy prohibits its analysts, professionals
reporting to analysts from owning securities of any company in the analyst's area of coverage.
Analyst compensation: Analysts are salary based permanent employees of High Brow Market Research
Pvt. Ltd.
Disclosure in terms of Public Appearance:
(a) High Brow Market Research Pvt. Ltd. or its associates have not received any compensation from the
subject company in the past twelve months;
(b) The subject company is not now or never a client during twelve months preceding the date of
distribution of the research report.
(c) High Brow Market Research Pvt. Ltd. or its associates has never served as an officer, director or
employee of the subject company;
(d) High Brow Market Research Pvt. Ltd. has never been engaged in market making activity for the
subject company.


