Commodities – How to Leverage...
31
Commodities – How to Leverage Opportunity Investment Conference, Boston, March 2010 Peter Königbauer | Senior Portfolio Manager For Broker/Dealer Use Only and Not to be Distributed to the Public
Transcript of Commodities – How to Leverage...

Commodities –How to Leverage OpportunityInvestment Conference, Boston, March 2010
Peter Königbauer | Senior Portfolio Manager
For Broker/Dealer Use Only and Not to be Distributed to the Public

For Broker/Dealer Use Only and Not to be Distributed to the Public | March 2010 | Page 2
Commodity Market Update
Investment Philosophy
Strategy Profile
Active Allocation
Alpha Generation
Agenda

For Broker/Dealer Use Only and Not to be Distributed to the Public | March 2010 | Page 3
Long-Term Outlook is Favourable for Commodities
Demographic aspects:World population grows at an average of 200,000 people every day
Source: International Monetary Fund, 31 December 2008.
0
2
4
6
8
10
1750 1800 1850 1900 1950 2000 2015 2025 2050
Wor
ld P
opul
atio
n (b
n)
0
20
40
60
80
100
120
140
160
180
1982
1983
1984
1985
1986
1987
1988
1989
1990
1991
1992
1993
1994
1995
1996
1997
1998
1999
2000
2001
2002
2003
2004
2005
2006
2007
2008
0
1
2
3
4
5
6
7
8Industrial Commodity usage worldwide
GDP of Emerging Markets (3 years average)
annual %Index: 2005=100
Population Growth
Strong demand from BRIC-Countries:Emerging markets inflate commodity prices
Commodity Prices andEmerging Markets

For Broker/Dealer Use Only and Not to be Distributed to the Public | March 2010 | Page 4
Source: International Monetary Fund, World Bank, Keybridge Research LLC
Emerging Markets – ChinaShare of Global Consumption (2008) & Commodity Price Increases (Feb - Nov 2009)
China’s growth may have driven commodity prices up, but its oil demand is still not as strong as expected.
46%
101%
62%
86%
0%
20%
40%
60%
80%
100%
120%
Aluminium Copper Nickel Petroleum
33%
28%
24%
9%
ChinaWorld
Com
mod
ity P
rice
Incr
ease
s (F
eb-N
ov 2
009)

For Broker/Dealer Use Only and Not to be Distributed to the Public | March 2010 | Page 5
Inventories: OilWithout Increasing Demand, Oil Prices Will Barely Rise
B A
R R
E L
Source: Pioneer Investments, Bloomberg as at 5 February 2010
US Inventory: Oil
US Inventory: Gasoline
Min / Max 5 Years(2003-2008)
Average 5 Years(2003-2008)
Inventories 2009B
A R
R E
L
B A
R R
E L
170,000
180,000
190,000
200,000
210,000
220,000
230,000
240,000
Jan
Feb
Mar
Apr May
Jun
Jul
Aug Sep Oct
Nov
Dec
90,000
100,000
110,000
120,000
130,000
140,000
150,000
160,000
170,000
180,000
Jan
Feb
Mar
Apr May
Jun
Jul
Aug Sep Oct
Nov
Dec
2000
2200
2400
2600
2800
3000
3200
3400
3600
3800
4000
Jan
Feb
Mar
Apr May
Jun Jul
Aug Sep Oct
Nov
Dec
US Inventory: Heating Oil/Diesel

For Broker/Dealer Use Only and Not to be Distributed to the Public | March 2010 | Page 6
Inventories: CopperRising Prices Depend on Europe and the US
Inventories LMI(London Metal Exchange)
Price US Industry Inventories
US Industry Production
Inventory: Copper (World) US Industry Inventory: Copper
Source: Pioneer Investments, Bloomberg as at 31 January 2010
0
200,000
400,000
600,000
800,000
1,000,000
1,200,000
28.0
3.20
00
28.0
3.20
01
28.0
3.20
02
28.0
3.20
03
28.0
3.20
04
28.0
3.20
05
28.0
3.20
06
28.0
3.20
07
28.0
3.20
08
28.0
3.20
090
50
100
150
200
250
300
350
400
450
500
85
90
95
100
105
110
115
Jan 00 Jan 02 Jan 04 Jan 06 Jan 08 Jan 10-8.00%
-6.00%
-4.00%
-2.00%
0.00%
2.00%
4.00%
6.00%

For Broker/Dealer Use Only and Not to be Distributed to the Public | March 2010 | Page 7
Inventories: Soybeans Inventories Remain Tight Despite Increased Production
Source: Pioneer Investments, Bloomberg as at 31 January 2010
Stock/Use Ratio US Soybeans Production
Soybean Import China US Soybean Production
0
1
2
3
4
5
6
Mill
ion
Tons
0.00%
5.00%
10.00%
15.00%
20.00%
25.00%
30.00%
Dec
90
Dec
91
Dec
92
Dec
93
Dec
94
Dec
95
Dec
96
Dec
97
Dec
98
Dec
99
Dec
00
Dec
01
Dec
02
Dec
03
Dec
04
Dec
05
Dec
06
Dec
07
Dec
08
1500
1700
1900
2100
2300
2500
2700
2900
3100
3300
3500
Mill
ion
Met
ric T
ons
2001 2002 2003 2004 2005 2006 2007 2008 2009

For Broker/Dealer Use Only and Not to be Distributed to the Public | March 2010 | Page 8
Commodity Market Update
Investment Philosophy
Strategy Profile
Active Allocation
Alpha Generation
Agenda

For Broker/Dealer Use Only and Not to be Distributed to the Public | March 2010 | Page 9
Pioneer Funds – Commodity AlphaPortfolio Overview
Active, quantitatively-managed commodity Portfolio
Four alpha sources enhance performance potential: Source 1: Changes in inventory levels can identify attractive opportunities
Source 2: Long/Short positions efficiently exploit investment philosophy
Source 3: Exposure to small commodities increases the opportunity for alpha
Source 4: Active allocation between the five different strategies optimises the performance potential
Broad investment universe (consisting of 31 commodities)
Objective: Generate outperformance versus its reference index, Dow Jones-UBS Commodity Total Return Index (DJ-UBS)
This sub-fund does not invest directly in commodities, but it gains exposure via derivatives linked to the performance of five commodity future indices and sub-indices.

For Broker/Dealer Use Only and Not to be Distributed to the Public | March 2010 | Page 10
Low inventories reduce the buffer function of inventories to absorb shocks
Inventories can only be restored through the lengthy process of new production. For that reason, the higher risk premium persists for a longer period of time
Prices rise
Adapted from: Gorton, G.B., Hayashi, F., Rouwenhorst, K.G. (2007) "The Fundamentals of Commodity Futures Returns". Yale ICF Working Paper No. 0708, 27 June 2007.
Inventories
Investment PhilosophyInventory Dynamics Predict Higher Expected Returns
The ‘Inventory Theory’ predicts higher expected returns by selecting commodities based on The dynamics of inventories
0
50
100
150
200
250
300
350
400
450
500
0
100,000
200,000
300,000
400,000
500,000
600,000
700,000
800,000
900,000
03.02.2002 03.02.2003 03.02.2004 03.02.2005 03.02.2006 03.02.2007 03.02.2008
Price
Example: Copper

For Broker/Dealer Use Only and Not to be Distributed to the Public | March 2010 | Page 11
Commoditieswith lowinventories
Commoditieswith highinventories
Source: Gorton, Gary B., Fumio Hayashi, and K. Geert Rouwenhorst (2006)*A normal inventory level for each commodity is calculated using a Hodrick-Prescott filter on historical inventory data. The Hodrick-Prescott filter is an algorithm, used widely in economics, for extracting a smooth, but possibly non-linear, trend from an economic time series. High inventory is defined as when inventories are above normal, while low inventory is defined as the opposite case. High inventory commodities are selected on a monthly basis and included in the High Inventory index, while low inventory commodities are included in the Low Inventory index. Inventories reflect any revisions which may have been released after initial publication.Source: Inventory data compiled by UBS-FP based on public and private sources.
Investment PhilosophySuccessful Commodity Selection Using Inventory Data*
0.0
100.0
200.0
300.0
400.0
500.0
600.0
1990 1992 1993 1995 1996 1998 1999 2001 2002 2004
DJ-UBS CI TRHigh Inventories TRLow Inventories TR
DJ-UBS CI TR High Inventories TR Low Inventories TRAnn. Return 7.09% 6.72% 11.19%Volatility 11.83% 11.56% 10.76%Sharpe Ratio 0.26 0.23 0.66

For Broker/Dealer Use Only and Not to be Distributed to the Public | March 2010 | Page 12
Investment Philosophy: Futures Basis Reflects Inventory LevelsThe Basis is High when Inventories are LowAverage Futures Basis Relative to Normalised Inventories*
-20%
-10%
0%
10%
20%
Aluminium
CocoaCopper
Crude OilHeating
Oil
Lean Hogs
Live Cattle
Natural Gas
Nickel
SoybeanOil
SoybeansUnleaded
GasWheat
Zinc
Bas
is R
elat
ive
to A
vera
ge
High InventoryLow Inventory
Source: Gorton, Gary B., Fumio Hayashi, and K. Geert Rouwenhorst (2006)*A normal inventory level for each commodity is calculated using a Hodrick-Prescott filter on historical inventory data. The Hodrick-Prescott filter is an algorithm, used widely in economics, for extracting a smooth, but possibly non-linear, trend from an economic time series. High inventory is defined as when inventories are above normal, while low inventory is defined as the opposite case. High inventory commodities are selected on a monthly basis and included in the High Inventory index, while low inventory commodities are included in the Low Inventory index. Inventories reflect any revisions which may have been released after initial publication.Source: Inventory data compiled by UBS-FP based on public and private sources.
For Broker/Dealer Use Only and Not to be Distributed to the Public | March 2010 | Page 13
Investment Philosophy: Price Performance Reflects Inventory LevelsReturns are High when Inventories are LowReturns Relative to Normalised Inventories*
Source: Gorton, Gary B., Fumio Hayashi, and K. Geert Rouwenhorst (2006)*A normal inventory level for each commodity is calculated using a Hodrick-Prescott filter on historical inventory data. The Hodrick-Prescott filter is an algorithm, used widely in economics, for extracting a smooth, but possibly non-linear, trend from an economic time series. High inventory is defined as when inventories are above normal, while low inventory is defined as the opposite case. High inventory commodities are selected on a monthly basis and included in the High Inventory index, while low inventory commodities are included in the Low Inventory index. Inventories reflect any revisions which may have been released after initial publication.Source: Inventory data compiled by UBS-FP based on public and private sources.
-30%
-20%
-10%
0%
10%
20%
30%
Prio
r 12-
Mon
th R
etur
n R
elat
ive
to A
vera
ge
Aluminium
Cocoa
Copper
Crude OilHeating
Oil
Lean Hogs
Live Cattle
Natural Gas
NickelSoybean
Oil
Soybeans
UnleadedGas
WheatZinc
High InventoryLow Inventory

For Broker/Dealer Use Only and Not to be Distributed to the Public | March 2010 | Page 14
Commodity Market Update
Investment Philosophy
Strategy Profile
Active Allocation
Alpha Generation
Agenda

For Broker/Dealer Use Only and Not to be Distributed to the Public | March 2010 | Page 15
Pioneer Funds – Commodity AlphaActive Weighting of up to Five Different Strategies
Strategy 1 Strategy 3
Strategy 2Strategy 4
Strategy 5
Strategy 1:
Basis (Long only)
Strategy 2:
Relative Strength (Long only)
Strategy 3:
Basis (Long/Short)
Strategy 4;
Relative Strength (Long/Short)
Strategy 5:Small Commodities(index-independent)
Four
str
ateg
ies,
taki
ng th
eir b
earin
gs fr
om th
e D
ow J
ones
-UB
S C
omm
odity
Inde
x
The Sub-Fund gains exposure to these strategies by investing in financial derivative instruments linked to commodity futures indices or sub-indices.

For Broker/Dealer Use Only and Not to be Distributed to the Public | March 2010 | Page 16
Sources of Performance: Implementing the Investment PhilosophyAlpha Opportunity 1: Commodity Basis and Relative Strength Strategies
Strategy 1:
Basis (Long)
Strategy 2:
Relative Strength (Long)A
lpha
Opp
ortu
nity
1 Long only – Basis Monthly, rank the commodities in the DJ-UBS excluding Gold
and Silver in order of “backwardation“ or basis*
Go long in the 8 commodities with the highest basis, with the same relative weights as in the DJ-UBS (subject to constraints)
Take no position in the remaining commodities
Long only – Relative Strength
Monthly, rank the commodities in the DJ-UBS in order of momentum as measured by the previous 12 months return**
Go long the 9 commodities with the highest momentum, with the same relative weights as in the DJ-UBS (subject to constraints)
Take no position in the remaining commodities
Strategy 3:
Basis (Long/Short)
Strategy 4;
Relative Strength (Long/Short)
Strategy 5:Small Commodities(index-independent) * Basis is calculated for each commodity as (F1/F2-1)*365/(D2-D1),
where F1 is the nearest futures contract. D1 and D2 are the number of days until expiration of the respective contracts **Momentum is calculated for each commodity using the cumulative return for the immediately preceding 12 months.

For Broker/Dealer Use Only and Not to be Distributed to the Public | March 2010 | Page 17
Sources of Performance: Extending the Investment Philosophy Alpha Opportunity 2: Long/Short Strategies
Strategy 3:
Basis (Long/Short)
Strategy 4;
Relative Strength (Long/Short)A
lpha
Opp
ortu
nity
2
Long/Short – Basis Monthly, rank the commodities in the DJ-UBS excluding
Gold and Silver in order of “backwardation“ or basis*
Go long in the 8 commodities with the highest basis, with the same relative weights as in the DJ-UBS (subject to constraints)
Take a short position in the 8 Commodities with the lowest basis*
Long/Short – Relative Strength
Monthly, rank the commodities in the DJ-UBS in order of momentum as measured by the previous 12 months return**
Go long the 9 commodities with the highest momentum, with the same relative weights as in the DJ-UBS (subject to constraints)
Take a short position in the 9 commodities with the lowest momentum
Strategy 1:
Basis (Long only)
Strategy 2:
Relative Strength (Long only)
Strategy 5:Small Commodities(index-independent) *Basis is calculated for each commodity as (F1/F2-1)*365/(D2-D1),
where F1 is the nearest futures contract. D1 and D2 are the number of days until expiration of the respective contracts**Momentum is calculated for each commodity using the cumulative return for the immediately preceding 12 months.

For Broker/Dealer Use Only and Not to be Distributed to the Public | March 2010 | Page 18
Sources of Performance: Broadening the Investment UniverseAlpha Opportunity 3: Source of Return Outside the Traditional UniverseA
lpha
Opp
ortu
nity
3
Strategy 5:Small Commodities(index-independent)
Long only Strategy
12 commodities outside the DJ-UBS Index universe
Sector weights: Energy 30%, Metals 16% and Agriculture 54%
Using 2006 liquidity levels (open interests and turnover) to determine weightings
Single commodity weight capped at max.15%, min. 2%
Annual review and rebalancing
Commodities Weights Commodities WeightsCrude oil 15% Tin 2%Gas oil 15% Platinum 2%Soybean meal 15% Palladium 2%Kansas wheat 15% Range cattle 10%Minneapolis wheat 2% Cocoa 10%Lead 10% Orange juice 2%
Strategies for Small CommoditiesStrategy 1:
Basis (Long only)
Strategy 2:
Relative Strength (Long only)
Strategy 3:
Basis (Long/Short)
Strategy 4;
Relative Strength (Long/Short)

For Broker/Dealer Use Only and Not to be Distributed to the Public | March 2010 | Page 19
Commodity Market Update
Investment Philosophy
Strategy Profile
Active Allocation
Alpha Generation
Agenda

For Broker/Dealer Use Only and Not to be Distributed to the Public | March 2010 | Page 20
Strategy CompositionGood Historical Performance in all Strategies
Long-only Strategies and Small Commodities have shown a long-term outperformance and generally followed market development
Long/Short-Strategies have offered further Alpha and hedging in weak commodity markets
Back-testing of all different strategies* vs. Dow Jones-UBS Commodity Index
Source: Pioneer Investments, *DJ-UBS strategies 29 January 2010
100
300
500
700
900
1100
91 92 93 94 95 96 97 98 99 00 01 02 03 04 05 06 07 08 09
DJ UBSCI Total Return UBS BASIS Long Total ReturnUBS R&S Long Total Return UBS BASIS L&S Total ReturnUBS RS L&S Total Return Smaller Commodities Total Return
Perf
orm
ance
, reb
ased
to 1
00

For Broker/Dealer Use Only and Not to be Distributed to the Public | March 2010 | Page 21
Strategy CompositionAlpha Opportunity 4: Optimise Allocation in Line with Identified Scenarios
Strategy selection and implementation
– Identification of different scenariosusing historical data
– Optimisation across the scenariosbased on best risk/return profile
– Evaluation of current scenarioat monthly intervals
Position limits*
– No strategy has a weight of more than 50%
– Long/Short strategies limited to a combined weight of 30%
Position Limits*“Basis” Long 0%-50%
“Basis” Long/Short 0%-20%
“Relative Strength” Long 0%-50%
“Relative Strength” Long/Short 0%-20%
Small Commodities Long 5%-15%
The Portfolio always combines two or more strategies,depending on the market phase
Implementing the Investment Philosophy
*Note: these are internal guidelines and not prospectus limits and may be subject to change over time.

For Broker/Dealer Use Only and Not to be Distributed to the Public | March 2010 | Page 22
Identification of different market phases based on historical data of the last 15 years
Optimisation across the scenarios based on best risk/return profile
Evaluation of current scenario at monthly intervals
Strategy CompositionAlpha Opportunity 4: Optimise Allocation in Line with Identified Scenarios
Active allocation between different DJ-UBS strategies
Source: DJ-UBS, Pioneer Investments. Back-testing from December 1992 to December 2008. Back test return figures have been adjusted to take into account trading costs, management fees, slippage (difference between real and prices used in back test). In total back test return figures have been adjusted by 300 basis points. Simulated past performance is not a reliable indicator of future performance. Performance of Pioneer Funds – Commodity Alpha, Class A EUR ND units net of fees from March 2008 to December 2009. Returns have been converted to US dollar.
100
300
500
700
900
1100
1300
91 92 93 94 95 96 97 98 99 00 01 02 03 04 05 06 07 08 09
DJ UBSCI Total Return UBS BASIS Long Total Return UBS R&S Long Total Return
UBS BASIS L&S Total Return UBS RS L&S Total Return Smaller Commodities Total Return
Commodities A L P H A Total ReturnPioneer Funds – Commodity Alpha

For Broker/Dealer Use Only and Not to be Distributed to the Public | March 2010 | Page 23
Commodity Market Update
Investment Philosophy
Strategy Profile
Active Allocation
Alpha Generation
Agenda

For Broker/Dealer Use Only and Not to be Distributed to the Public | March 2010 | Page 24
-10.00%
-5.00%
0.00%
5.00%
10.00%
15.00%
20.00%
25.00%
30.00%
35.00%
1 year 3 years ann. 5 years ann. since 1992 ann.
Pioneer Funds – Commodity Alpha DJ-UBS TR Relative performance
Alpha GenerationStrong Outperformance PotentialObjective: Outperforming the DJ-UBS Commodity Index in different periods(figures include back-testing)
Source: DJ-UBS, Pioneer Investments as at 31 January 2010. Back test returns adjusted to trading costs, administrative fees and Slippage (Difference between real prices and prices used in back test). The back test return quote has been adapted overall to 300 bps. Simulated past performance is not a reliable indicator of future performance.
Performance of Pioneer Funds – Commodity Alpha, Class A EUR ND net of fees from March 2008 to January 2010. Returns have been converted to USD.
Characteristics
Tracking error 9.03%
Volatility 13.92%
Volatility Benchmark 15.19%
Correlation 0.81
Dec 1992 – Jan 2010Portfolio
For Broker/Dealer Use Only and Not to be Distributed to the Public | March 2010 | Page 25
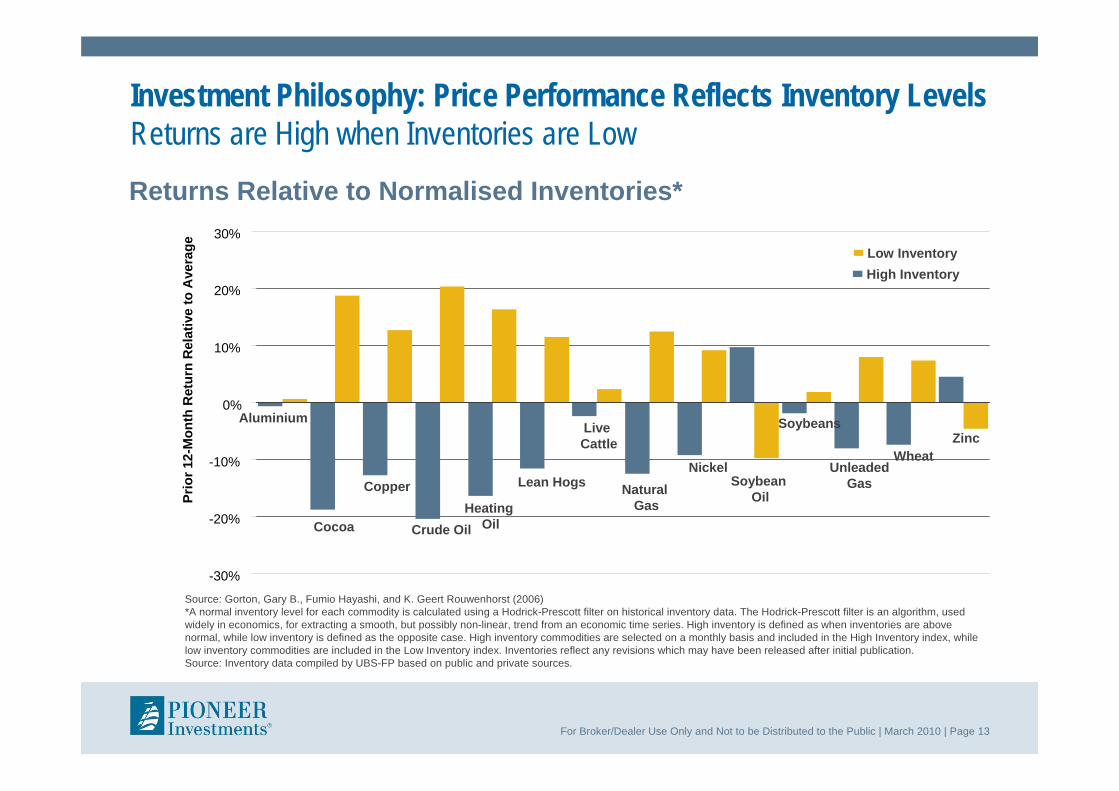
Alpha GenerationStrong Outperformance PotentialCumulative Monthly ReturnPerformance in USD: Pioneer Funds – Commodity Alpha
45
55
65
75
85
95
105
Feb08
Mar08
Apr08
May08
Jun08
Jul08
Aug08
Sep08
Oct08
Nov08
Dec08
Jan09
Feb09
Mar09
Apr09
May09
Jun09
Jul09
Aug09
Sep09
Oct09
Nov09
Dec09
Jan10
Feb10
Ret
urns
reba
sed
to 1
00
-1%
4%
9%
14%
19%
24%
29%
34%
Exce
ss R
etur
ns in
%
Excess returns Pioneer Funds – Commodity Alpha DJ-UBS TR Index
Source: Pioneer Investments, DJ-UBS, Bloomberg (as at 25 February 2010). Performance data provided refers to Class A (USD) units only net of fees. Returns of DJ-UBS and DJ-UBS TR Index on basis of USD. The benchmark performance is adjusted to the previous day for the fund pricing adjustment. Before the fund inception
date of class A in USD on 3 April 2008, the performance of Pioneer Funds – Commodity Alpha, Class A EUR ND net of fees have been converted to USD

For Broker/Dealer Use Only and Not to be Distributed to the Public | March 2010 | Page 26
Source: Pioneer Investments, as at 25 Febuary 2010
Alpha Generation: Portfolio PerformanceCurrent Weights of Sub-Sectors
32.5%
22.1%18.8%
7.5%3.1%
6.4%
19.4%
0.5%
10.9%
-1.2% -0.8%
19.4%
12.4%
42.8%
7.9% 8.4%
-10%
0%
10%
20%
30%
40%
50%
Energy Petroleum Base Metals Precious Metals Grains Softs Vegetable Oil Live Stock
DJ-UBS Pioneer Funds – Commodity Alpha
Highest overweighting Highest underweightingCOPPER 9.13% CRUDE OIL -18.58%ALUMINIUM 6.65% NATURAL GAS -10.85%GOLD 4.01% CORN -9.36%SUGAR 3.38% SOYBEANS -7.61%NICKEL 3.29% WHEAT -6.21%

For Broker/Dealer Use Only and Not to be Distributed to the Public | March 2010 | Page 27
-10.0%
0.0%
10.0%
20.0%
30.0%
40.0%
50.0%
60.0%
Feb. 08 May. 08 Aug. 08 Nov. 08 Feb. 09 May. 09 Aug. 09 Nov. 09 Feb. 10
Energy Metals Agriculture
Active Allocation Offers Flexibility and OpportunitiesSector Weightings are Adjusted According to Trends
Fund inception date: 21 February 2008. Source: Pioneer Investments, in-house calculations (based on the following basic assumptions: target weightings for each strategy are assumed to remain unchanged throughout the entire month; transaction costs are not taken into account; figures are calculated on a same-day basis; NAV calculations for the portfolio are preformed with a one-day time delay (T-1), so performance may deviate; liquidity resulting from sizeable inflows and outflows changes the Portfolio's real performance;back-testing figures have been reduced by 25 bps per month in order to obtain a more realistic picture of expected results). As at 25 February 2010.
Weightings follow wave patterns. Trends are pursued.
March 2009Energy 5%
Metals 19%
Agriculture 53%
December 2009Energy 8%
Metals 57%
Agriculture 35%

For Broker/Dealer Use Only and Not to be Distributed to the Public | March 2010 | Page 28
Alpha GenerationAll Sectors Have Contributed to Outperformance
Rel
ativ
e Pe
rfor
man
ce v
ersu
s D
J-U
BS
Inde
x (r
ebas
ed to
100
)
95,50
98,00
100,50
103,00
105,50
108,00
110.50
113.00
115.50
118.00
Feb08
Mar08
Apr08
May08
Jun08
Jul08
Aug08
Sep08
Oct08
Nov08
Dec08
Jan09
Feb09
Mar09
Apr09
May09
Jun09
Jul09
Aug09
Sep09
Oct09
Nov09
Dec09
Jan10
Feb10
Energy Metals Agriculture
Source: Pioneer Investments, in-house calculations (based on the following basic assumptions: target weightings for each strategy are assumed to remain unchanged throughout the entire month; transaction costs are not taken into account; figures are calculated on a same-day basis; NAV calculations for the portfolio are performed with a one-day time delay (T-1), so performance may deviate; liquidity resulting from sizeable inflows and outflows changes the Portfolio's real performance). As at 25 February 2010
For Broker/Dealer Use Only and Not to be Distributed to the Public | March 2010 | Page 29
Important InformationUnless otherwise stated all information contained in this document is from Pioneer Investments and is as at 23 February 2010.
Pioneer Funds – Commodity Alpha is a sub-fund (the “Sub-Fund”) of Pioneer Funds (the “Fund”), a fonds commun de placement with several separate sub-funds established under the laws of the Grand Duchy of Luxembourg.
Past performance does not guarantee and is not indicative of future results. Unless otherwise stated, all views expressed are those of Pioneer Investments. These views are subject to change at any time based on market and other conditions and there can be no assurances that countries, markets or sectors will perform as expected. Investments involve certain risks, including political and currency risks. Investment return and principal value may go down as well as up and could result in the loss of all capital invested. More recent returns may be different than those shown. Please contact your local sales representative for more current performance results.
This material is not a prospectus and does not constitute an offer to buy or a solicitation to sell any units of the Fund or any services, by or to anyone in any jurisdiction in which such offer or solicitation would be unlawful or in which the person making such offer or solicitation is not qualified to do so or to anyone to whom it is unlawful to make such offer or solicitation. For additional information on the Fund, a free prospectus should be requested from Pioneer Global Investments Limited (“PGIL”), 1 George’s Quay Plaza, George’s Quay, Dublin 2, Ireland. Call +353 1 480 2000 Fax +353 1 449 5000. This information is not for distribution and does not constitute an offer to sell or the solicitation of any offer to buy any securities or services in the United States or in any of its territories or possessions subject to its jurisdiction to or for the benefit of any United States person (being residents and citizens of the United States or partnerships or corporations organized under United States laws). The Fund has not been registered in the United States under the Investment Company Act of 1940 and units of the Fund are not registered in the United States under the Securities Act of 1933.
This document is not intended for and no reliance can be placed on this document by retail clients, to whom the document should not be provided. The content of this document is approved by PGIL. In the UK, it is directed at professional clients and not at retail clients and it is approved for distribution by Pioneer Global Investments Limited (London Branch), 123 Buckingham Palace Road, London SW1W 9SL, authorised by the Financial Regulator in Ireland and regulated by the Financial Services Authority for the conduct of UK business. The Fund is an unregulated collective investment scheme under the UK Financial Services and Markets Act 2000 and therefore does not carry the protection provided by the UK regulatory system.
Pioneer Funds Distributor, Inc., 60 State Street, Boston, MA 02109 (“PFD”), a U.S.-registered broker-dealer, provides marketing services in connection with the distribution of Pioneer Investments’ products. PFD markets these products to financial intermediaries, both within and outside of the U.S. (in jurisdictions where permitted to do so) for sale to clients who are not United States persons.
“UBS®”, [“UBS Commodity Basis P Strategy”], [“UBS Commodity Relative Strength P Strategy”], [“UBS Commodity Small Caps P Strategy”], [“UBS Commodity Long-Short Basis P Strategy”], [“UBS Commodity Long-Short Relative Strength P Strategy”], [“UBSIBAPE”], [“UBSIRSPE”], [“UBSISCIE”], [“UBSIBLPE”] and [“UBSIRLPE”] are trademarks or service marks of UBS Securities LLC (“UBS”), and have been licensed for use for certain purposes by Pioneer Asset Management S.A. Luxemburg. Pioneer Asset Management S.A.’s “Pioneer Funds – Commodity Alpha”, based on the [“UBS Commodity Basis P Strategy”], [“UBS Commodity Relative Strength P Strategy”], [“UBS Commodity Small Caps P Strategy”], [“UBS Commodity Long-Short Basis P Strategy”] and [“UBS Commodity Long-Short Relative Strength P Strategy”], are not sponsored, endorsed, sold or promoted by UBS Securities LLC, UBS AG or any of their respective subsidiaries or affiliates, and none of UBS, UBS AG or any of their respective subsidiaries or affiliates, makes any representation regarding the advisability of investing in such products.
Pioneer Investments is a trading name of the Pioneer Global Asset Management S.p.A. group of companies. Date of First Use 11 March 2010
Pioneer Funds – Commodity Alpha

For Broker/Dealer Use Only and Not to be Distributed to the Public | March 2010 | Page 30
Conclusion II
Positioning:
– High breakeven spreads in the short end of the curve, but higherimplied default rate protection in the medium-long end of the curve
– Overweight issuers with stable cash flow characteristics and little probability of downgrade to sub-IG
– Underweight deeply subordinated bank debt from issuers with highstate involvement or risk of nationalisation
The key risks to our strategy are:
– Early and accelerated exit from expansive monetary policy
– Increased risk aversion through unexpected sovereign defaults, systemically important bank failures and related spill-over
– Double dip of economic growth in Europe

For Broker/Dealer Use Only and Not to be Distributed to the Public | March 2010 | Page 31
Important Information
Unless otherwise stated all information contained in this document is from Pioneer Investments and is as at 29 January 2010Past performance does not guarantee and is not indicative of future results. Unless otherwise stated, all views expressed are those of Pioneer Investments. These views are subject to change at any time based on market and other conditions and there can be no assurances that countries, markets or sectors will perform as expected. Investments involve certain risks, including political and currency risks. Investment return and principal value may go down as well as up and could result in the loss of all capital invested. More recent returns may be different than those shown. Please contact your local sales representative for more current performance results.This material is not a prospectus and does not constitute an offer to buy or a solicitation to sell any units of the Pioneer Invesetments range of mutual funds or any services, by or to anyone in any jurisdiction in which such offer or solicitation would be unlawful or in which the person making such offer or solicitation is not qualified to do so or to anyone to whom it is unlawful to make such offer or solicitation. For additional information on the Fund, a free prospectus should be requested from Pioneer Global Investments Limited (“PGIL”), 1 George’s Quay Plaza, George’s Quay, Dublin 2, Ireland. Call +353 1 480 2000 Fax +353 1 449 5000. This information is not for distribution and does not constitute an offer to sell or the solicitation of any offer to buy any securities or services in the United States or in any of its territories or possessions subject to its jurisdiction to or for the benefit of any United States person (being residents and citizens of the United States or partnerships or corporations organized under United States laws). The non-US Pioneer Investments mutual funds have not been registered in the United States under the Investment Company Act of 1940 and units of these funds are not registered in the United States under the Securities Act of 1933.This document is not intended for and no reliance can be placed on this document by retail clients, to whom the document should not be provided.The content of this document is approved by PGIL. In the UK, it is directed at professional clients and not at retail clients and it is approved for distribution by Pioneer Global Investments Limited (London Branch), 123 Buckingham Palace Road, London SW1W 9SL, authorised by the Financial Regulator in Ireland and regulated by the Financial Services Authority for the conduct of UK business. The Pioneer Investments funds are unregulated collective investment scheme under the UK Financial Services and Markets Act 2000 and therefore do not carry the protection provided by the UK regulatory system.Pioneer Funds Distributor, Inc., 60 State Street, Boston, MA 02109 (“PFD”), a U.S.-registered broker-dealer, provides marketing services in connection with the distribution of Pioneer Investments’ products. PFD markets these products to financial intermediaries, both within and outside of the U.S. (in jurisdictions where permitted to do so) for sale to clients who are not United States persons.Pioneer Investments is a trading name of the Pioneer Global Asset Management S.p.A. group of companies.For Broker/Dealer use only and not for distribution to the publicDate of First Use: 10 March 2010