Commissioned by ……. Big Five Community Services. Inc. Prepared by the Community Service Council...
124
COMMUNITY PROFILE 2012 EARLY CHILDHOOD INDICATORS OF BRYAN, CARTER, COAL, LOVE & PONTOTOC COUNTIES Commissioned by ……. Big Five Community Services. Inc. Prepared by the Community Service Counci June 201
Transcript of Commissioned by ……. Big Five Community Services. Inc. Prepared by the Community Service Council...
COMMUNITY PROFILE 2012EARLY CHILDHOOD INDICATORS OF
BRYAN, CARTER, COAL, LOVE & PONTOTOC COUNTIES
Commissioned by ……. Big Five Community Services. Inc.
Prepared by the Community Service CouncilJune 2012
BRYAN, CARTER, COAL, LOVE & PONTOTOC COUNTIES
Demographic Trends Economics and Employment Child Indicators

DEMOGRAPHIC TRENDS

Prepared by the Community Service Council
DEMOGRAPHIC TRENDS
Population change--migration to suburban areas of Tulsa and Oklahoma City MSA with an overall decrease in new births
Age--aging population Race and ethnicity--more culturally
diverse Living arrangements--transitional for
family living arrangement
DE
MO
GR
AP
HIC
TR
EN
DS

Prepared by the Community Service Council
Population Trends for Total PopulationBryan, Carter, Coal, Love & Pontotoc Counties, 1980 through 2030
Source: US Census Bureau, 1980, 1990, 2000 & 2010 Censuses; Population Estimates Program.
1980 1990 2000 2010 2020(proj.)
2030(proj.)
0
10,000
20,000
30,000
40,000
50,000
60,000
Bryan 30,535 32,089 36,534 42,416 44,930 49,172
Carter 43,610 42,919 45,621 47,557 50,155 52,860
Coal 6,041 5,780 6,031 5,925 7,578 8,603
Love 7,469 8,157 8,831 9,423 12,264 13,997
Pontotoc 32,598 34,119 35,143 37,492 37,691 38,997
DE
MO
GR
AP
HIC
TR
EN
DS
Prepared by the Community Service Council
Population Trends for Population under Age 5Bryan, Carter, Coal, Love & Pontotoc Counties, 1980 through 2030
Source: US Census Bureau, 1980, 1990, 2000 & 2010 Censuses; Population Estimates Program.
1980 1990 2000 2010 2020(proj.)
2030(proj.)
0
1,000
2,000
3,000
4,000
Bryan 2,080 2,143 2,369 2,830 2,952 3,163
Carter 3,390 3,018 3,126 3,377 3,425 3,404
Coal 454 360 397 391 554 585
Love 535 483 540 616 799 858
Pontotoc 2,291 2,190 2,200 2,588 2,510 2,519
DE
MO
GR
AP
HIC
TR
EN
DS

Prepared by the Community Service Council
Race Comparison for Total Population and Children under 5State of Oklahoma and Bryan & Carter Counties, 2010
Source: US Census Bureau, 2010 Census.
59.3%
8.2% 11.0%1.6%
19.8%
63.5%
1.3% 18.1%
0.5%
16.6%
61.3%
5.8% 12.8%1.6%
18.5%
72.2%
7.4%8.6%
1.7%
10.1%
76.2%
1.5%12.9%
0.5%8.8%
74.4%
6.7%8.9%
1.1%8.9%
White Black American Indian Asian Other/2+ races
Oklahoma Bryan County
Under 5
Total Population
N = 264,126
N = 3,751,351
Hispanic16.8%
Hispanic8.9%
Carter County
N = 2,830
N = 42,416
Hispanic11.0%
Hispanic5.0%
N = 3,377
N = 47,557
Hispanic11.1%
Hispanic5.3%
DE
MO
GR
AP
HIC
TR
EN
DS

Prepared by the Community Service Council
Race Comparison for Total Population and Children under 5Coal, Love & Pontotoc Counties, 2010
Source: US Census Bureau, 2010.
55.8%
0.5% 24.6%
19.2%
65.4% 1.3%
8.9%
0.5%
23.9%51.6%
2.5%
27.2%
0.4%
18.3%
74.3%
0.5%
16.7%
0.2%
8.3%
78.8%
1.8%
6.2%
0.5%
12.7%71.2%
2.4%17.4%
0.6%8.4%
White Black American Indian Asian Other/2+ races
Coal County Love County
Under 5
Total Population
N = 391
N = 5,925
Hispanic3.6%
Hispanic2.6%
Pontotoc County
N = 616
N = 9,423
Hispanic20.1%
Hispanic11.8%
N = 2,588
N = 37,492
Hispanic8.9%
Hispanic4.1%
DE
MO
GR
AP
HIC
TR
EN
DS

Prepared by the Community Service Council
Types of Families with Own Children Under 6,by Race & Hispanic Origin
Bryan County, 2010
Source: US Census Bureau, 2010 Census.
65.4%
23.5%
11.2%
68.0%
22.2%
9.8%
34.1%
26.8%
39.0%
56.9%
31.0%
12.1%
80.0%
20.0%
62.0%
22.9%
15.1%
Married couple Female-headed Male-headed
Total NH White Black
American Indian Asian Hispanic
DE
MO
GR
AP
HIC
TR
EN
DS

Prepared by the Community Service Council
Types of Families with Own Children Under 6,by Race & Hispanic Origin
Carter County, 2010
67.5%
23.2%
9.3%
71.4%
19.6%
9.0%
40.6%
51.0%
8.4%
59.4%
31.1%
9.4%
92.3%
5.8%1.9%
64.0%
22.5%
13.5%
Married couple Female-headed Male-headed
Total NH White Black
American Indian Asian Hispanic
Source: US Census Bureau, 2010 Census.
DE
MO
GR
AP
HIC
TR
EN
DS

Prepared by the Community Service Council
Types of Families with Own Children Under 6,by Race & Hispanic Origin
Coal County, 2010
70.1%
22.8%
7.1%
66.5%
24.9%
8.6%
83.0%
15.1%
1.9%75.0%
12.5%
12.5%
Married couple Female-headed Male-headed
Total NH White Black
American Indian Asian Hispanic
(Insufficient data)
(Insufficient data)
Source: US Census Bureau, 2010 Census.
DE
MO
GR
AP
HIC
TR
EN
DS

Prepared by the Community Service Council
Types of Families with Own Children Under 6,by Race & Hispanic Origin
Love County, 2010
74.6%
15.7%
9.7%
74.8%
15.7%
9.6%
40.0%
40.0%
20.0%
86.1%
5.6%
8.3%77.9%
11.7%
10.4%
Married couple Female-headed Male-headed
Total NH White Black
American Indian Asian Hispanic
(Insufficient data)
Source: US Census Bureau, 2010 Census.
DE
MO
GR
AP
HIC
TR
EN
DS

Prepared by the Community Service Council
Types of Families with Own Children Under 6,by Race & Hispanic Origin
Pontotoc County, 2010
69.1%
22.0%
8.9%
72.9%
19.6%
7.5%
61.2%
22.4%
16.3%
60.5%
29.0%
10.5%81.8%
9.1%
9.1%
66.7%
18.8%
14.6%
Married couple Female-headed Male-headed
Total NH White Black
American Indian Asian Hispanic
Source: US Census Bureau, 2010 Census.
DE
MO
GR
AP
HIC
TR
EN
DS

ECONOMICS AND EMPLOYMENT
Prepared by the Community Service Council
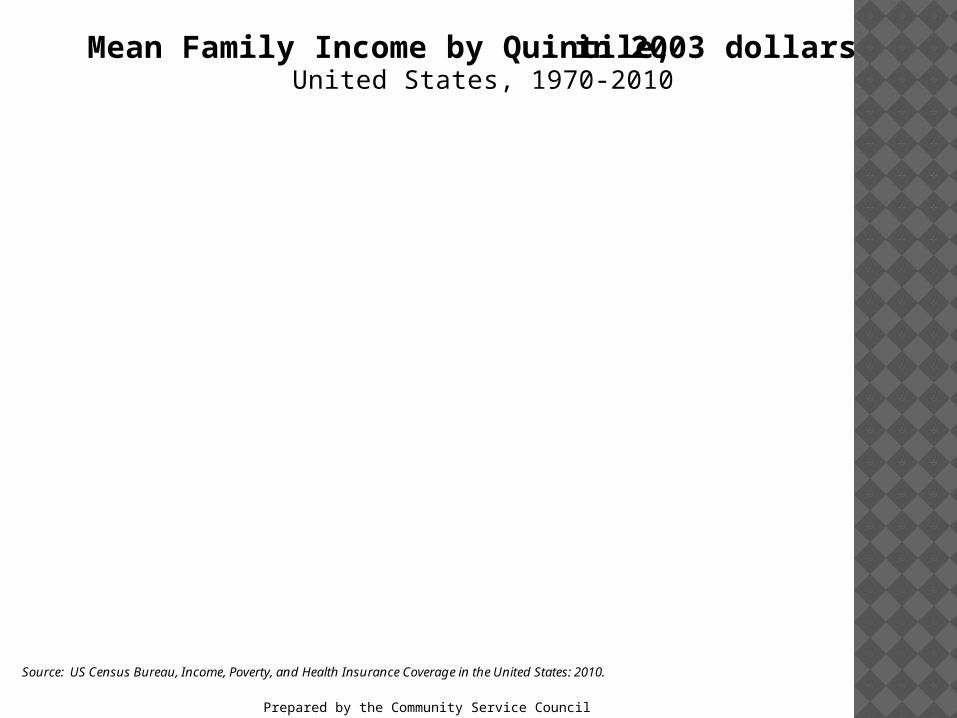
Mean Family Income by Quintile, in 2003 dollarsUnited States, 1970-2010
Source: US Census Bureau, Income, Poverty, and Health Insurance Coverage in the United States: 2010.
1970 1975 1980 1985 1990 1995 2000 2005 2010
$0
$50,000
$100,000
$150,000
$200,000
Real hourly wage (2010 dollars)
Lowest Second Middle Fourth Highest
Lowest $9,982 $10,719 $10,858 $10,849 $11,589 $11,855 $12,860 $11,900 $11,034
Second $27,039 $26,331 $27,024 $27,492 $29,158 $28,976 $32,110 $30,554 $28,636
Middle $43,540 $43,199 $44,594 $45,634 $48,161 $48,450 $53,472 $51,711 $49,309
Fourth $61,374 $62,772 $65,698 $68,643 $72,613 $74,480 $83,124 $81,334 $79,040
Highest $108,653 $110,828 $117,139 $128,221 $140,915 $155,428 $180,129 $178,230 $169,633
EC
ON
OM
IC
S &
EM
PL
OY
ME
NT

Prepared by the Community Service Council
EC
ON
OM
IC
S &
EM
PL
OY
ME
NT
COMPARISON OF SELF-SUFFICIENCY WAGE TO POVERTY GUIDELINES, BY SIZE OF FAMILYBRYAN COUNTY, 2012
Family Size
Self-Sufficiency
Wage (annual)
Poverty Guidelines (annual)
Dollar Difference
Self-Sufficiency Percent of Poverty
One person
$17,078($8.09/hour)
$11,170($5.29/hour)
$5,908 153%
Two persons
$28,856($13.66/hour)
$15,130($7.16/hour)
$13,726 191%
Three persons
$33,247($15.74/hour)
$19,090($9.04/hour)
$14,157 174%
Four persons
$41,198($9.75/hour/adult)
$23,050($5.46/hour/
adult)
$18,148 179%
Notes: For the self-sufficiency wages shown in table, family of two consists of one adult and one preschooler; family of three consists of one adult, one preschooler and one schoolage child; family of four consists of two adults, one preschooler and one schoolage child. Hourly wages given assume full-time, year-round employment.
Source: Oklahoma Association of Community Action Agencies and the Oklahoma Asset Building Coalition, December 2009, The Self-Sufficiency Standard for Oklahoma 2009; 2012 HHS Poverty Guidelines, Federal Register, Vol. 77, No. 13, January 26, 2012, p. 3637-3638. Bureau of Labor Statistics, May 2012.

Prepared by the Community Service Council
Family of Three, Bryan County, 2012
$53,401
$39,675
$22,895
$10,800$15,312
$19,090
$35,317
$17,240
WelfareWage
MinimumWage
PovertyWage
185% PovertyWage
EstimatedMedian Family
Income*(2006-10 ACS)
$0
$10,000
$20,000
$30,000
$40,000
$50,000
$60,000Annual Wage
Self-Sufficiency Wage = $33,247($15.74/hr)
Comparison of Wages: Self-Sufficiency, Welfare, Minimum, Poverty, 185% of Poverty, and Median Family Income
($5.12/hr) ($7.25/hr) ($9.04/hr) ($16.73/hr)
Married-couple families w/ children <18
($18.79/hr)
All families w/ children <18
Male-headed families w/ children <18
Female-headed families w/ children <18
($25.28/hr)
($8.16/hr)($10.84/hr)
Source: Oklahoma Association of Community Action Agencies and the Oklahoma Asset Building Coalition, December 2009, The Self-Sufficiency Standard for Oklahoma 2009; 2012 HHS Poverty Guidelines, Federal Register, Vol. 77, No. 17, January 26, 2012, p. 4034-4035; Oklahoma State Dept. of Human Services; U.S. Census Bureau, 2006-10 American Community Survey.
Notes: For the self-sufficiency wage, family of three consists of one adult, one preschooler and one schoolage child. Hourly wages given assume full-time, year-round employment. Welfare wage is the combined value of TANF, SNAP, & WIC. Values shown for median family income are midpoint estimates within a 90% confidence range, which can be very wide. Estimates with margins of error exceeding +/- 10% of estimate are shown in italics.
EC
ON
OM
IC
S &
EM
PL
OY
ME
NT
Prepared by the Community Service Council
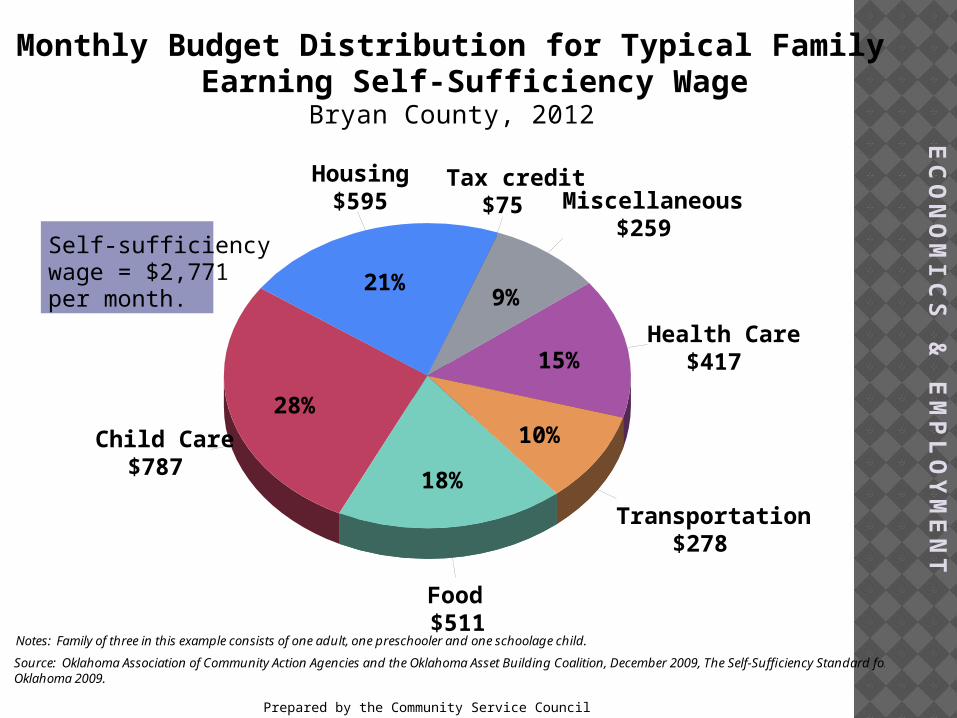
Monthly Budget Distribution for Typical Family of Three Earning Self-Sufficiency Wage
Bryan County, 2012
Source: Oklahoma Association of Community Action Agencies and the Oklahoma Asset Building Coalition, December 2009, The Self-Sufficiency Standard for Oklahoma 2009.
Housing$595
Child Care$787
Food$511
Transportation$278
Health Care$417
Miscellaneous$259
21%
28%
18%
10%
15%
9%
Notes: Family of three in this example consists of one adult, one preschooler and one schoolage child.
Self-sufficiency wage = $2,771 per month.
Tax credit$75
EC
ON
OM
IC
S &
EM
PL
OY
ME
NT

Prepared by the Community Service Council
EC
ON
OM
IC
S &
EM
PL
OY
ME
NT
COMPARISON OF SELF-SUFFICIENCY WAGE TO POVERTY GUIDELINES, BY SIZE OF FAMILYCARTER COUNTY, 2012
Family Size
Self-Sufficiency
Wage (annual)
Poverty Guidelines (annual)
Dollar Difference
Self-Sufficiency Percent of Poverty
One person
$18,330($8.68/hour)
$11,170($5.29/hour)
$7,160 164%
Two persons
$27,750($13.14/hour)
$15,130($7.16/hour)
$12,620 183%
Three persons
$32,330($15.31/hour)
$19,090($9.04/hour)
$13,240 169%
Four persons
$40,221($9.52/hour/adult)
$23,050($5.46/hour/
adult)
$17,171 174%
Notes: For the self-sufficiency wages shown in table, family of two consists of one adult and one preschooler; family of three consists of one adult, one preschooler and one schoolage child; family of four consists of two adults, one preschooler and one schoolage child. Hourly wages given assume full-time, year-round employment.
Source: Oklahoma Association of Community Action Agencies and the Oklahoma Asset Building Coalition, December 2009, The Self-Sufficiency Standard for Oklahoma 2009; 2012 HHS Poverty Guidelines, Federal Register, Vol. 77, No. 13, January 26, 2012, p. 3637-3638. Bureau of Labor Statistics, May 2012.

Prepared by the Community Service Council
Family of Three, Carter County, 2012
$58,155
$46,588
$32,772
$10,800$15,312
$19,090
$35,317
$22,313
WelfareWage
MinimumWage
PovertyWage
185% PovertyWage
EstimatedMedian Family
Income*(2006-10 ACS)
$0
$10,000
$20,000
$30,000
$40,000
$50,000
$60,000Annual Wage
Self-Sufficiency Wage = $32,330($15.31/hr)
Comparison of Wages: Self-Sufficiency, Welfare, Minimum, Poverty, 185% of Poverty, and Median Family Income
($5.12/hr) ($7.25/hr) ($9.04/hr) ($16.73/hr)
Married-couple families w/ children <18
($22.06/hr)
All families w/ children <18
Male-headed families w/ children <18
Female-headed families w/ children <18
($27.54/hr)
($10.56/hr)
($15.52/hr)
Source: Oklahoma Association of Community Action Agencies and the Oklahoma Asset Building Coalition, December 2009, The Self-Sufficiency Standard for Oklahoma 2009; 2012 HHS Poverty Guidelines, Federal Register, Vol. 77, No. 17, January 26, 2012, p. 4034-4035; Oklahoma State Dept. of Human Services; U.S. Census Bureau, 2006-10 American Community Survey.
Notes: For the self-sufficiency wage, family of three consists of one adult, one preschooler and one schoolage child. Hourly wages given assume full-time, year-round employment. Welfare wage is the combined value of TANF, SNAP, & WIC. Values shown for median family income are midpoint estimates within a 90% confidence range, which can be very wide. Estimates with margins of error exceeding +/- 10% of estimate are shown in italics.
EC
ON
OM
IC
S &
EM
PL
OY
ME
NT

Prepared by the Community Service Council
Monthly Budget Distribution for Typical Family of Three Earning Self-Sufficiency Wage
Carter County, 2012
Source: Oklahoma Association of Community Action Agencies and the Oklahoma Asset Building Coalition, December 2009, The Self-Sufficiency Standard for Oklahoma 2009.
Housing$633
Child Care$700
Food$520
Transportation$273
Health Care$417
Miscellaneous$255
23%
25%
19%
10%
15%
9%
Notes: Family of three in this example consists of one adult, one preschooler and one schoolage child.
Self-sufficiency wage = $2,694 per month.
Tax credit$102
EC
ON
OM
IC
S &
EM
PL
OY
ME
NT

Prepared by the Community Service Council
EC
ON
OM
IC
S &
EM
PL
OY
ME
NT
COMPARISON OF SELF-SUFFICIENCY WAGE TO POVERTY GUIDELINES, BY SIZE OF FAMILYCOAL COUNTY, 2012
Family Size
Self-Sufficiency
Wage (annual)
Poverty Guidelines (annual)
Dollar Difference
Self-Sufficiency Percent of Poverty
One person
$16,799($7.95/hour)
$11,170($5.29/hour)
$5,629 150%
Two persons
$26,607($12.60/hour)
$15,130($7.16/hour)
$11,477 176%
Three persons
$31,252($14.80/hour)
$19,090($9.04/hour)
$12,162 164%
Four persons
$38,974($9.23/hour/adult)
$23,050($5.46/hour/
adult)
$15,924 169%
Notes: For the self-sufficiency wages shown in table, family of two consists of one adult and one preschooler; family of three consists of one adult, one preschooler and one schoolage child; family of four consists of two adults, one preschooler and one schoolage child. Hourly wages given assume full-time, year-round employment.
Source: Oklahoma Association of Community Action Agencies and the Oklahoma Asset Building Coalition, December 2009, The Self-Sufficiency Standard for Oklahoma 2009; 2012 HHS Poverty Guidelines, Federal Register, Vol. 77, No. 13, January 26, 2012, p. 3637-3638. Bureau of Labor Statistics, May 2012.
Prepared by the Community Service Council
Family of Three, Coal County, 2012
$41,875
$33,200$33,281
$10,800$15,312
$19,090
$35,317
$15,313
WelfareWage
MinimumWage
PovertyWage
185% PovertyWage
EstimatedMedian Family
Income*(2006-10 ACS)
$0
$10,000
$20,000
$30,000
$40,000
$50,000Annual Wage
Self-Sufficiency Wage = $31,252($14.80/hr)
Comparison of Wages: Self-Sufficiency, Welfare, Minimum, Poverty, 185% of Poverty, and Median Family Income
($5.12/hr) ($7.25/hr) ($9.04/hr) ($16.73/hr)
Married-couple families w/ children <18
($15.76/hr)
All families w/ children <18
Male-headed families w/ children <18
Female-headed families w/ children <18
($19.83/hr)
($7.25/hr)
($15.72/hr)
Source: Oklahoma Association of Community Action Agencies and the Oklahoma Asset Building Coalition, December 2009, The Self-Sufficiency Standard for Oklahoma 2009; 2012 HHS Poverty Guidelines, Federal Register, Vol. 77, No. 17, January 26, 2012, p. 4034-4035; Oklahoma State Dept. of Human Services; U.S. Census Bureau, 2006-10 American Community Survey.
Notes: For the self-sufficiency wage, family of three consists of one adult, one preschooler and one schoolage child. Hourly wages given assume full-time, year-round employment. Welfare wage is the combined value of TANF, SNAP, & WIC. Values shown for median family income are midpoint estimates within a 90% confidence range, which can be very wide. Estimates with margins of error exceeding +/- 10% of estimate are shown in italics.
$33,200
EC
ON
OM
IC
S &
EM
PL
OY
ME
NT

Prepared by the Community Service Council
Monthly Budget Distribution for Typical Family of Three Earning Self-Sufficiency Wage
Coal County, 2012
Source: Oklahoma Association of Community Action Agencies and the Oklahoma Asset Building Coalition, December 2009, The Self-Sufficiency Standard for Oklahoma 2009.
Housing$595
Child Care$703
Food$510
Transportation$266
Health Care$417
Miscellaneous$249
22%
26%
19%
10%
15%
9%
Notes: Family of three in this example consists of one adult, one preschooler and one schoolage child.
Self-sufficiency wage = $2,604 per month.
Tax credit$138
EC
ON
OM
IC
S &
EM
PL
OY
ME
NT
Prepared by the Community Service Council
EC
ON
OM
IC
S &
EM
PL
OY
ME
NT
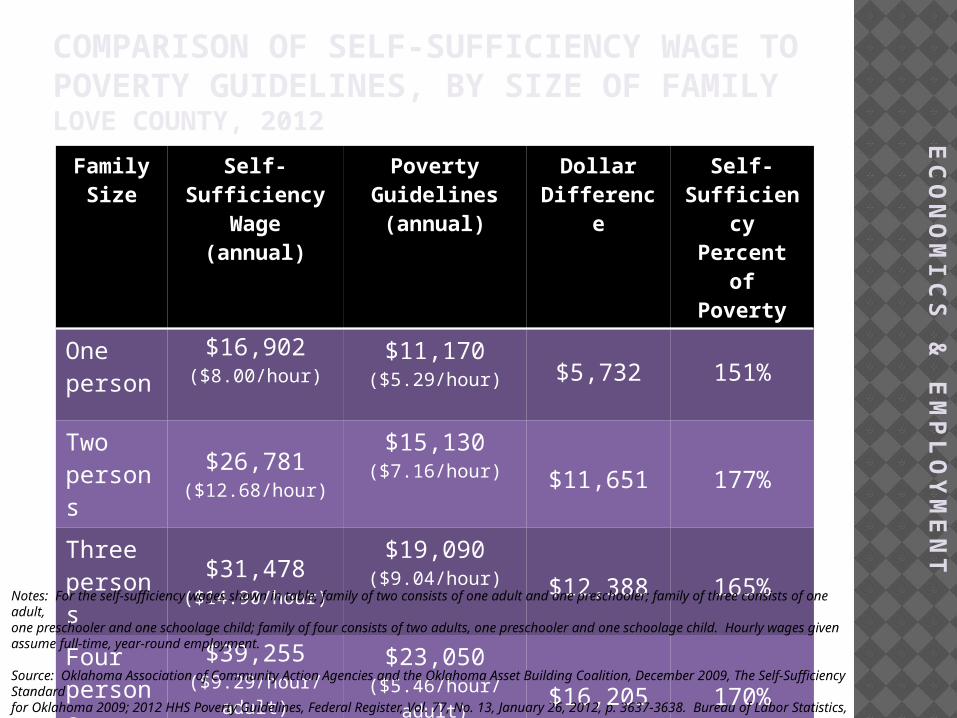
COMPARISON OF SELF-SUFFICIENCY WAGE TO POVERTY GUIDELINES, BY SIZE OF FAMILYLOVE COUNTY, 2012
Family Size
Self-Sufficiency
Wage (annual)
Poverty Guidelines (annual)
Dollar Difference
Self-Sufficiency Percent of Poverty
One person
$16,902($8.00/hour)
$11,170($5.29/hour) $5,732 151%
Two persons
$26,781($12.68/hour)
$15,130($7.16/hour) $11,651 177%
Three persons
$31,478($14.90/hour)
$19,090($9.04/hour) $12,388 165%
Four persons
$39,255($9.29/hour/adult)
$23,050($5.46/hour/
adult) $16,205 170%
Notes: For the self-sufficiency wages shown in table, family of two consists of one adult and one preschooler; family of three consists of one adult, one preschooler and one schoolage child; family of four consists of two adults, one preschooler and one schoolage child. Hourly wages given assume full-time, year-round employment.
Source: Oklahoma Association of Community Action Agencies and the Oklahoma Asset Building Coalition, December 2009, The Self-Sufficiency Standard for Oklahoma 2009; 2012 HHS Poverty Guidelines, Federal Register, Vol. 77, No. 13, January 26, 2012, p. 3637-3638. Bureau of Labor Statistics, May 2012.

Prepared by the Community Service Council
Family of Three, Love County, 2012
$56,288
$39,792
$26,641
$10,800$15,312
$19,090
$35,317
$14,286
WelfareWage
MinimumWage
PovertyWage
185% PovertyWage
EstimatedMedian Family
Income*(2006-10 ACS)
$0
$10,000
$20,000
$30,000
$40,000
$50,000
$60,000Annual Wage
Self-Sufficiency Wage = $31,478($14.90/hr)
Comparison of Wages: Self-Sufficiency, Welfare, Minimum, Poverty, 185% of Poverty, and Median Family Income
($5.12/hr) ($7.25/hr) ($9.04/hr) ($16.73/hr)
Married-couple families w/ children <18
($18.84/hr)All families w/ children <18
Male-headed families w/ children <18
Female-headed families w/ children <18
($26.65/hr)
($6.76/hr)
($12.61/hr)
Source: Oklahoma Association of Community Action Agencies and the Oklahoma Asset Building Coalition, December 2009, The Self-Sufficiency Standard for Oklahoma 2009; 2012 HHS Poverty Guidelines, Federal Register, Vol. 77, No. 17, January 26, 2012, p. 4034-4035; Oklahoma State Dept. of Human Services; U.S. Census Bureau, 2006-10 American Community Survey.
Notes: For the self-sufficiency wage, family of three consists of one adult, one preschooler and one schoolage child. Hourly wages given assume full-time, year-round employment. Welfare wage is the combined value of TANF, SNAP, & WIC. Values shown for median family income are midpoint estimates within a 90% confidence range, which can be very wide. Estimates with margins of error exceeding +/- 10% of estimate are shown in italics.
EC
ON
OM
IC
S &
EM
PL
OY
ME
NT
Prepared by the Community Service Council
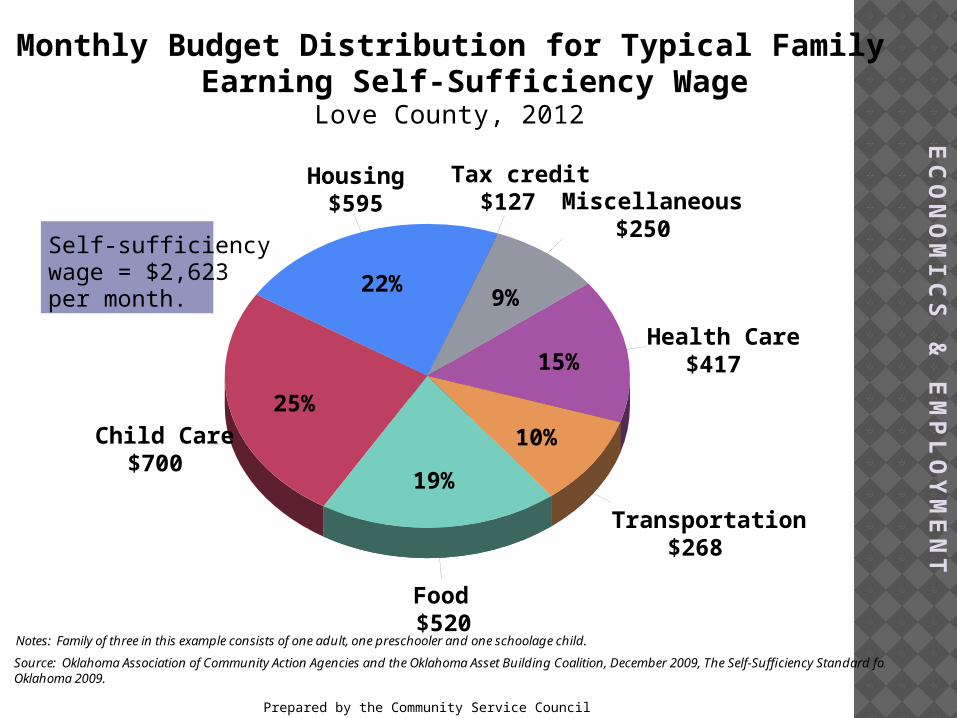
Monthly Budget Distribution for Typical Family of Three Earning Self-Sufficiency Wage
Love County, 2012
Source: Oklahoma Association of Community Action Agencies and the Oklahoma Asset Building Coalition, December 2009, The Self-Sufficiency Standard for Oklahoma 2009.
Housing$595
Child Care$700
Food$520
Transportation$268
Health Care$417
Miscellaneous$250
22%
25%
19%
10%
15%
9%
Notes: Family of three in this example consists of one adult, one preschooler and one schoolage child.
Self-sufficiency wage = $2,623 per month.
Tax credit$127
EC
ON
OM
IC
S &
EM
PL
OY
ME
NT

Prepared by the Community Service Council
EC
ON
OM
IC
S &
EM
PL
OY
ME
NT
COMPARISON OF SELF-SUFFICIENCY WAGE TO POVERTY GUIDELINES, BY SIZE OF FAMILYPONTOTOC COUNTY, 2012
Family Size
Self-Sufficiency
Wage (annual)
Poverty Guidelines (annual)
Dollar Difference
Self-Sufficiency Percent of Poverty
One person
$16,785($7.95/hour)
$11,170($5.29/hour) $5,615 150%
Two persons
$28,048($13.28/hour)
$15,130($7.16/hour) $12,918 185%
Three persons
$32,539($15.41/hour)
$19,090($9.04/hour) $13,449 170%
Four persons
$40,502($9.59/hour/adult)
$23,050($5.46/hour/
adult)$17,452 176%
Notes: For the self-sufficiency wages shown in table, family of two consists of one adult and one preschooler; family of three consists of one adult, one preschooler and one schoolage child; family of four consists of two adults, one preschooler and one schoolage child. Hourly wages given assume full-time, year-round employment.
Source: Oklahoma Association of Community Action Agencies and the Oklahoma Asset Building Coalition, December 2009, The Self-Sufficiency Standard for Oklahoma 2009; 2012 HHS Poverty Guidelines, Federal Register, Vol. 77, No. 13, January 26, 2012, p. 3637-3638. Bureau of Labor Statistics, May 2012.

Prepared by the Community Service Council
Family of Three, Pontotoc County, 2012
$64,092
$40,790
$18,750
$10,800$15,312
$19,090
$35,317
$15,511
WelfareWage
MinimumWage
PovertyWage
185% PovertyWage
EstimatedMedian Family
Income*(2006-10 ACS)
$0
$10,000
$20,000
$30,000
$40,000
$50,000
$60,000
$70,000Annual Wage
Self-Sufficiency Wage = $32,539($15.41/hr)
Comparison of Wages: Self-Sufficiency, Welfare, Minimum, Poverty, 185% of Poverty, and Median Family Income
($5.12/hr) ($7.25/hr) ($9.04/hr) ($16.73/hr)
Married-couple families w/ children <18
($19.31/hr)
All families w/ children <18
Male-headed families w/ children <18
Female-headed families w/ children <18
($30.35/hr)
($7.34/hr)
($8.88/hr)
Source: Oklahoma Association of Community Action Agencies and the Oklahoma Asset Building Coalition, December 2009, The Self-Sufficiency Standard for Oklahoma 2009; 2012 HHS Poverty Guidelines, Federal Register, Vol. 77, No. 17, January 26, 2012, p. 4034-4035; Oklahoma State Dept. of Human Services; U.S. Census Bureau, 2006-10 American Community Survey.
Notes: For the self-sufficiency wage, family of three consists of one adult, one preschooler and one schoolage child. Hourly wages given assume full-time, year-round employment. Welfare wage is the combined value of TANF, SNAP, & WIC. Values shown for median family income are midpoint estimates within a 90% confidence range, which can be very wide. Estimates with margins of error exceeding +/- 10% of estimate are shown in italics.
$18,750
EC
ON
OM
IC
S &
EM
PL
OY
ME
NT

Prepared by the Community Service Council
Monthly Budget Distribution for Typical Family of Three Earning Self-Sufficiency Wage
Pontotoc County, 2012
Source: Oklahoma Association of Community Action Agencies and the Oklahoma Asset Building Coalition, December 2009, The Self-Sufficiency Standard for Oklahoma 2009.
Housing$595
Child Care$749
Food$511
Transportation$279
Health Care$417
Miscellaneous$255
21%
27%
18%
10%
15%
9%
Notes: Family of three in this example consists of one adult, one preschooler and one schoolage child.
Self-sufficiency wage = $2,712 per month.
Tax credit$94
EC
ON
OM
IC
S &
EM
PL
OY
ME
NT
Prepared by the Community Service Council
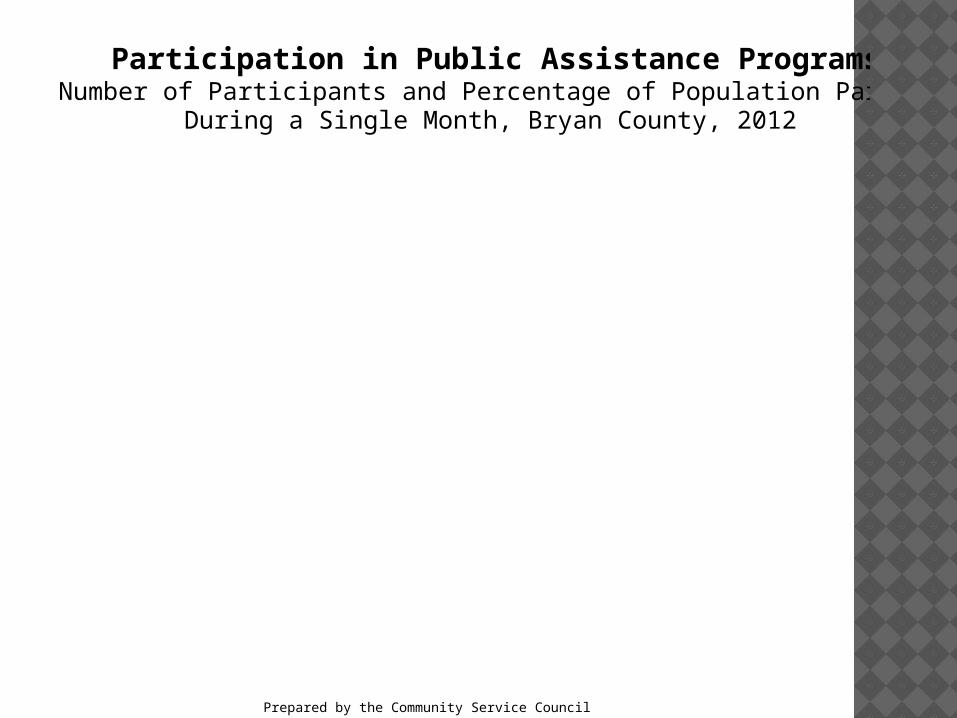
Participation in Public Assistance ProgramsNumber of Participants and Percentage of Population Participating
During a Single Month, Bryan County, 2012
12,923
6,355
248
523
209
6,985
112
3,034
521
30.5%
60%
41.6%
18.9%
7.4%
16.5%
1.1%
64%
11%
Soonercare Total (185%/100%)
Soonercare <19 (185%)
WIC Infants (185%)
WIC age 1-5 (185%)
Child Care Subsidy <5 (185%)
SNAP Total (130%)
TANF <18 (50%)
Elem. School Free Lunch (130%)
Elem. School Reduced Lunch (185%)
05,00010,00015,00020,000
Number of Participants
0% 25% 50% 75% 100%
Percent of Population
Source: Oklahoma Dept. of Human Services, Statistical Bulletin, Jan. 2012; Oklahoma State Dept. of Education, Low Income Report for 2011-12; US Census Bureau, 2010 Census; Oklahoma State Department of Health-WIC Service, Caseload Report, Feb. 2012; Oklahoma Health Care Authority, Fast Facts, March 2011.
EC
ON
OM
IC
S &
EM
PL
OY
ME
NT

Prepared by the Community Service Council
Participation in Public Assistance ProgramsNumber of Participants and Percentage of Population Participating
During a Single Month, Carter County, 2012
15,049
7,422
222
437
283
8,685
280
3,126
579
31.6%
57.6%
36.8%
12.8%
8.4%
18.3%
2.3%
61%
11.3%
Soonercare Total (185%/100%)
Soonercare <19 (185%)
WIC Infants (185%)
WIC age 1-5 (185%)
Child Care Subsidy <5 (185%)
SNAP Total (130%)
TANF <18 (50%)
Elem. School Free Lunch (130%)
Elem. School Reduced Lunch (185%)
05,00010,00015,00020,000
Number of Participants
0% 25% 50% 75% 100%
Percent of Population
Source: Oklahoma Dept. of Human Services, Statistical Bulletin, Jan. 2012; Oklahoma State Dept. of Education, Low Income Report for 2011-12; US Census Bureau, 2010 Census; Oklahoma State Department of Health-WIC Service, Caseload Report, Feb. 2012; Oklahoma Health Care Authority, Fast Facts, March 2011.
EC
ON
OM
IC
S &
EM
PL
OY
ME
NT

Prepared by the Community Service Council
Participation in Public Assistance ProgramsNumber of Participants and Percentage of Population Participating
During a Single Month, Coal County, 2012
2,020
1,012
33
94
30
1,163
31
505
81
34.1%
63.4%
40.2%
25.2%
7.7%
19.6%
2.1%
63.1%
10.1%
Soonercare Total (185%/100%)
Soonercare <19 (185%)
WIC Infants (185%)
WIC age 1-5 (185%)
Child Care Subsidy <5 (185%)
SNAP Total (130%)
TANF <18 (50%)
Elem. School Free Lunch (130%)
Elem. School Reduced Lunch (185%)
01,0002,0003,000
Number of Participants
0% 25% 50% 75% 100%
Percent of Population
Source: Oklahoma Dept. of Human Services, Statistical Bulletin, Jan. 2012; Oklahoma State Dept. of Education, Low Income Report for 2011-12; US Census Bureau, 2010 Census; Oklahoma State Department of Health-WIC Service, Caseload Report, Feb. 2012; Oklahoma Health Care Authority, Fast Facts, March 2011.
EC
ON
OM
IC
S &
EM
PL
OY
ME
NT
Prepared by the Community Service Council
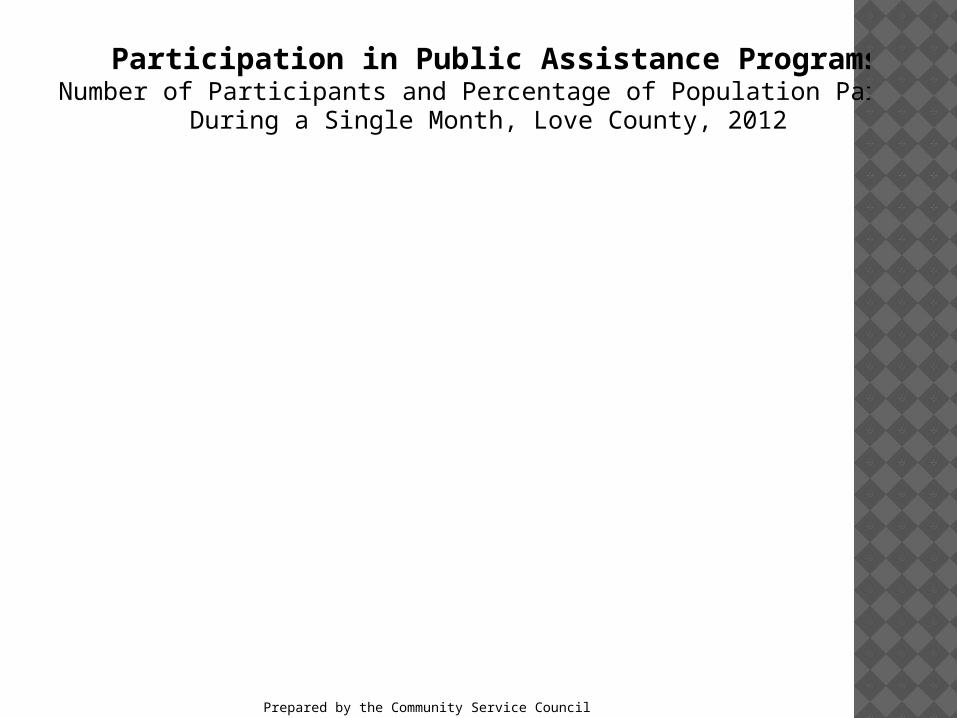
Participation in Public Assistance ProgramsNumber of Participants and Percentage of Population Participating
During a Single Month, Love County, 2012
2,967
1,428
75
158
46
1,736
71
673
152
31.5%
59.5%
63.6%
25%
7.5%
18.4%
3.1%
62%
14%
Soonercare Total (185%/100%)
Soonercare <19 (185%)
WIC Infants (185%)
WIC age 1-5 (185%)
Child Care Subsidy <5 (185%)
SNAP Total (130%)
TANF <18 (50%)
Elem. School Free Lunch (130%)
Elem. School Reduced Lunch (185%)
01,0002,0003,0004,000
Number of Participants
0% 25% 50% 75% 100%
Percent of Population
Source: Oklahoma Dept. of Human Services, Statistical Bulletin, Jan. 2012; Oklahoma State Dept. of Education, Low Income Report for 2011-12; US Census Bureau, 2010 Census; Oklahoma State Department of Health-WIC Service, Caseload Report, Feb. 2012; Oklahoma Health Care Authority, Fast Facts, March 2011.
EC
ON
OM
IC
S &
EM
PL
OY
ME
NT

Prepared by the Community Service Council
Participation in Public Assistance ProgramsNumber of Participants and Percentage of Population Participating
During a Single Month, Pontotoc County, 2012
10,613
5,134
168
341
265
7,153
121
2,559
502
28.3%
54.8%
32.4%
13.4%
10.2%
19.1%
1.4%
57.2%
11.2%
Soonercare Total (185%/100%)
Soonercare <19 (185%)
WIC Infants (185%)
WIC age 1-5 (185%)
Child Care Subsidy <5 (185%)
SNAP Total (130%)
TANF <18 (50%)
Elem. School Free Lunch (130%)
Elem. School Reduced Lunch (185%)
05,00010,00015,000
Number of Participants
0% 25% 50% 75% 100%
Percent of Population
Source: Oklahoma Dept. of Human Services, Statistical Bulletin, Jan. 2012; Oklahoma State Dept. of Education, Low Income Report for 2011-12; US Census Bureau, 2010 Census; Oklahoma State Department of Health-WIC Service, Caseload Report, Feb. 2012; Oklahoma Health Care Authority, Fast Facts, March 2011.
EC
ON
OM
IC
S &
EM
PL
OY
ME
NT
Prepared by the Community Service Council
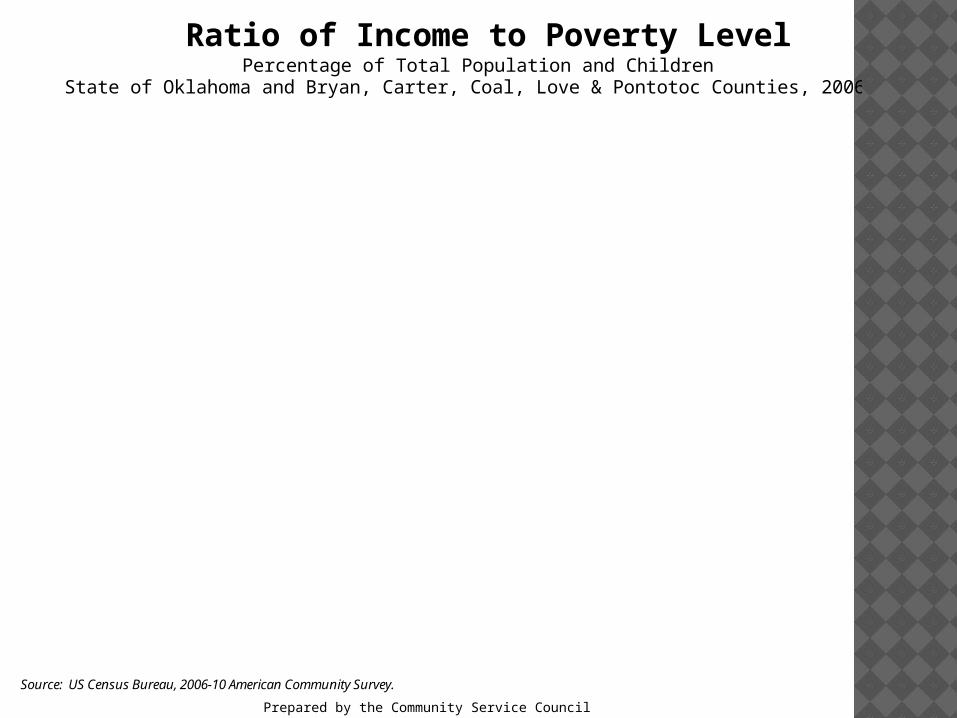
Ratio of Income to Poverty LevelPercentage of Total Population and Children
State of Oklahoma and Bryan, Carter, Coal, Love & Pontotoc Counties, 2006-10 Estimates
Source: US Census Bureau, 2006-10 American Community Survey.
37.9
% 43.3
%
40.8
%
51.6%
38.7%
41.8
%
48.9
%
57.8
%
49.1
%
72.9
%
53.9
%
52.4
%
54.9
% 60.5
%
51.8
%
87.2
%
61.4
%
54.6
%
45.9
%
56.5
%
47.8
%
66.3
%
49.8
%
51.2
%
34.8
%
40.7%
37.1%
48.3%
34.9% 38.7% 45
.4%
55.1%
45.8%
69.2%
48.1%
49.1%
51.2
% 56.4%
48%
82.8%
59.2%
50.1%
42.5
%
54.5%
44.7%
62.8%
42.1% 48
.6%
16.2
% 19.1%
16.5% 21
.6%
14.2% 20
.5%
23.1
% 28.4%
24.1%
34.3%
19.9%
27.6%
27.1
%
27.9%
26.9%
35.2%
30.5%
32.6%
21.1
%
28.6%
22.7%
33.8%
14.1%
24.9%
0%
20%
40%
60%
80%
100%
Percentage of population
Below 100% Below 185% Below 200%
Total Under 18 Under 6 6 to 17
37.9
% 43.3% 49
.1% 53.9%
72.9%
52.4%
54.9
%
51.8%
87.2%
60.5%
61.4%
54.6%
45.9
%
56.5%
47.8%
66.3%
49.8%
51.2%
40.8%
51.6%
38.7%
48.9
%
57.8%
41.8%
Note: Values shown are midpoint estimates within a 90% confidence range, which can be very wide. Estimates with margins of error exceeding +/- 10% of estimate are shown in italics.
EC
ON
OM
IC
S &
EM
PL
OY
ME
NT

Prepared by the Community Service Council
RATIO OF INCOME TO POVERTY LEVELNUMBER OF PERSONS: TOTAL POPULATION AND CHILDRENSTATE OF OKLAHOMA AND BRYAN AND CARTER COUNTIES, 2006-10 ESTIMATES
Population Cohort
All income levels
100% of poverty level
185% of poverty level
200% of poverty level
Oklahoma
Total population 3,559,437 577,247 1,238,511 1,349,831
Under 18 895,872 207,039 406,823 438,327
Under 6 301,806 81,792 154,557 165,696
6 to 17 594,066 125,247 252,266 272,631
Bryan County
Total population 39,068 7,468 15,904 16,903
Under 18 9,677 2,744 5,335 5,589
Under 6 3,015 841 1,701 1,825
6 to 17 6,662 1,903 3,634 3,764
Carter County
Total population 46,046 7,600 17,098 18,767
Under 18 11,989 2,886 5,487 5,891
Under 6 3,957 1,063 1,899 2,049
6 to 17 8,032 1,823 3,588 3,842
Note: Values shown are midpoint estimates within a 90% confidence range, which can be very wide. Estimates with margins of error exceeding +/- 10% of estimate are shown in italics.
Source: US Census Bureau, 2006-10 American Community Survey.
EC
ON
OM
IC
S &
EM
PL
OY
ME
NT
Prepared by the Community Service Council
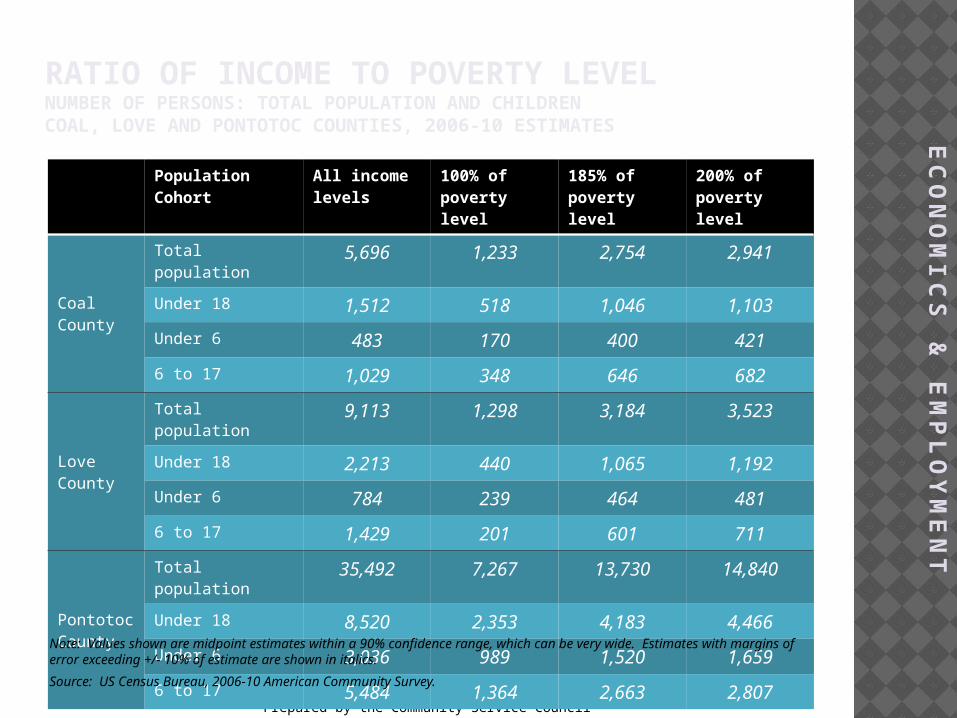
RATIO OF INCOME TO POVERTY LEVELNUMBER OF PERSONS: TOTAL POPULATION AND CHILDRENCOAL, LOVE AND PONTOTOC COUNTIES, 2006-10 ESTIMATES
Population Cohort
All income levels
100% of poverty level
185% of poverty level
200% of poverty level
Coal County
Total population 5,696 1,233 2,754 2,941
Under 18 1,512 518 1,046 1,103
Under 6 483 170 400 421
6 to 17 1,029 348 646 682
Love County
Total population 9,113 1,298 3,184 3,523
Under 18 2,213 440 1,065 1,192
Under 6 784 239 464 481
6 to 17 1,429 201 601 711
Pontotoc County
Total population 35,492 7,267 13,730 14,840
Under 18 8,520 2,353 4,183 4,466
Under 6 3,036 989 1,520 1,659
6 to 17 5,484 1,364 2,663 2,807
Note: Values shown are midpoint estimates within a 90% confidence range, which can be very wide. Estimates with margins of error exceeding +/- 10% of estimate are shown in italics.
Source: US Census Bureau, 2006-10 American Community Survey.
EC
ON
OM
IC
S &
EM
PL
OY
ME
NT

Prepared by the Community Service Council
Ratio of Income to Poverty Level for Total PopulationBryan, Carter, Coal, Love & Pontotoc Counties, 1989, 1999 & 2006-10 Estimates
Source: US Census Bureau, 1990 & 2000 Censuses; US Census Bureau, 2006-10 American Community Survey.
Bryan Carter Coal Love Pontotoc Bryan Carter Coal Love Pontotoc Bryan Carter Coal Love Pontotoc0%
10%
20%
30%
40%
50%
60%
Percentage of population
Below 100% Below 185% Below 200%
Below 100% 24.5% 19.7% 27.4% 15.9% 21.7% 18.4% 16.6% 23.1% 11.8% 16.5% 19.1% 16.5% 21.6% 14.2% 20.5%
Below 185% 48.2% 39.5% 53.9% 39.2% 45.8% 41.7% 38.9% 47.6% 34.6% 40.5% 40.7% 37.1% 48.3% 34.9% 38.7%
Below 200% 51.2% 41.8% 56.7% 42.6% 49.1% 44.7% 41.8% 52.7% 37.8% 43% 43.3% 40.8% 51.6% 38.7% 41.8%
1989 1999 2006-10Note: Values shown are midpoint estimates within a 90% confidence range, which can be very wide. Estimates with margins of error exceeding +/- 10% of estimate are shown in italics.
EC
ON
OM
IC
S &
EM
PL
OY
ME
NT

Prepared by the Community Service Council
RATIO OF INCOME TO POVERTY LEVEL TOTAL POPULATIONBRYAN, CARTER, COAL, LOVE AND PONTOTOC COUNTIES, 1989, 1999 & 2006-10 ESTIMATES
Year All income levels
100% of poverty level
185% of poverty level
200% of poverty level
Bryan County
1989 31,053 7,608 14,970 15,909
1999 35,521 6,529 14,809 15,861
2006-10 39,068 7,468 15,904 16,903
Carter County
1989 41,968 8,272 16,561 17,560
1999 44,412 7,375 17,255 18,552
2006-10 46,046 7,600 17,098 18,767
Coal County
1989 5,687 1,556 3,065 3,223
1999 5,924 1,366 2,819 3,123
2006-10 5,696 1,233 2,754 2,941
Love County
1989 7,680 1,224 3,011 3,268
1999 8,714 1,029 3,015 3,293
2006-10 9,113 1,298 3,184 3,523
Pontotoc County
1989 32,759 7,124 15,007 16,088
1999 33,936 5,601 13,744 14,581
2006-10 35,492 7,267 13,730 14,840Note: Values shown are midpoint estimates within a 90% confidence range, which can be very wide. Estimates with margins of error exceeding +/- 10% of estimate are shown in italics.Source: US Census Bureau, 2006-10 American Community Survey.
EC
ON
OM
IC
S &
EM
PL
OY
ME
NT
Prepared by the Community Service Council
Median Family IncomeBy Family Type and Presence of Children under 18State of Oklahoma, Bryan & Carter Counties, 2006-10 Estimates
Source: U.S. Census Bureau, 2006-10 American Community Survey.
$49,458
$64,992
$20,070
$33,728
$39,675$53,401
$17,240
$22,895
$46,588
$58,155
$22,313$32,772
$56,733
$61,951
$35,872
$42,333
$49,772
$53,772
$33,794$40,045
$50,957
$55,441$27,917
$30,272
OklahomaAll families
Married-couple
Female-headed
Male-headed
Bryan Co.All families
Married-couple
Female-headed
Male-headed
Carter Co.All families
Married-couple
Female-headed
Male-headed
$0$25,000$50,000$75,000
Families WITH children
$0 $25,000 $50,000 $75,000
Families WITHOUT childrenNote: Values shown are midpoint estimates within a 90% confidence range, which can be very wide. Estimates with margins of error exceeding +/- 10% of estimate are shown in italics.
EC
ON
OM
IC
S &
EM
PL
OY
ME
NT
Prepared by the Community Service Council
Median Family IncomeBy Family Type and Presence of Children under 18
Coal, Love & Pontotoc Counties, 2006-10 Estimates
$33,200
$41,875
$15,313
$33,281
$49,792
$56,288
$14,286
$26,641
$40,790
$64,092$15,511
$18,750
$46,094
$48,664
$36,042
$33,203
$52,872
$51,791
$23,125
$58,456
$53,000
$58,026$37,177
$38,043
Coal Co.All families
Married-couple
Female-headed
Male-headed
Love Co.All families
Married-couple
Female-headed
Male-headed
Pontotoc Co.All families
Married-couple
Female-headed
Male-headed
$0$25,000$50,000$75,000
Families WITH children
$0 $25,000 $50,000 $75,000
Families WITHOUT children
Source: U.S. Census Bureau, 2006-10 American Community Survey.
Note: Values shown are midpoint estimates within a 90% confidence range, which can be very wide. Estimates with margins of error exceeding +/- 10% of estimate are shown in italics.
EC
ON
OM
IC
S &
EM
PL
OY
ME
NT
Prepared by the Community Service Council
Educational Attainment for Persons Age 25 & OlderBryan, Carter, Coal, Love and Pontotoc Counties, 2006-10
Less than high school
High school graduate
Some college
Associate degree
Bachelor's degree
Master's degree
Professional school degree
Doctorate degree
0%
10%
20%
30%
40%
50%
60%Bryan Co. Carter Co. Coal Co. Love Co. Pontotoc Co.
Bryan Co. 15.9% 34.8% 22% 7% 12.7% 5.7% 1.2% 0.6%
Carter Co. 16.8% 42.2% 18.8% 5.9% 11.4% 3.7% 0.9% 0.4%
Coal Co. 21.5% 47.2% 17.4% 4.8% 6.5% 2.1% 0.2% 0.3%
Love Co. 21.7% 43.8% 15% 5.7% 10.2% 2.5% 1.1% 0.1%
Pontotoc Co. 15.6% 31.2% 23.2% 3.8% 14.4% 9.4% 1.2% 1.2%
Source: U.S. Census Bureau, 2006-10 American Community Survey.
Note: Values shown are midpoint estimates within a 90% confidence range, which can be very wide. Estimates with margins of error exceeding +/- 10% of estimate are shown in italics.
EC
ON
OM
IC
S &
EM
PL
OY
ME
NT

Prepared by the Community Service Council
Real Hourly Wage by Educational AttainmentUnited States, 1973-2007
Source: Economic Policy Institute, The State of Working America 2008-10, table 3.15.
1973
1975
1977
1979
1981
1983
1985
1987
1989
1991
1993
1995
1997
1999
2001
2003
2005
2007
$0
$10
$20
$30
$40
Real hourly wage (2007 dollars)
Less than high school High school Some college
College degree Advanced degree
EC
ON
OM
IC
S &
EM
PL
OY
ME
NT
Prepared by the Community Service Council
Real Hourly Wage by Educational Attainment for MenUnited States, 1973-2007
1973
1975
1977
1979
1981
1983
1985
1987
1989
1991
1993
1995
1997
1999
2001
2003
2005
2007
$0
$10
$20
$30
$40
Real hourly wage (2007 dollars)
Less than high school High school Some college
College degree Advanced degree
Source: Economic Policy Institute, The State of Working America 2008-10, table 3.15.
EC
ON
OM
IC
S &
EM
PL
OY
ME
NT

Prepared by the Community Service Council
Real Hourly Wage by Educational Attainment for WomenUnited States, 1973-2007
1973
1975
1977
1979
1981
1983
1985
1987
1989
1991
1993
1995
1997
1999
2001
2003
2005
2007
$0
$10
$20
$30
$40
Real hourly wage (2007 dollars)
Less than high school High school Some college
College degree Advanced degree
Source: Economic Policy Institute, The State of Working America 2008-10, table 3.15.
EC
ON
OM
IC
S &
EM
PL
OY
ME
NT

Prepared by the Community Service Council
Real Hourly Wage by Educational Attainment, by SexUnited States, 2007
Less than high school High school College degree Advanced degree$0.00
$10.00
$20.00
$30.00
$40.00Real hourly wage (2007 dollars)
Both sexes Men Women
Both sexes $11.38 $15.01 $26.51 $33.57
Men $12.32 $16.68 $30.36 $38.10
Women $9.43 $13.10 $22.63 $28.77
Source: Economic Policy Institute, The State of Working America 2008-10, table 3.15.
EC
ON
OM
IC
S &
EM
PL
OY
ME
NT

Prepared by the Community Service Council
Unemployment RatesBryan, Carter, Coal, Love & Pontotoc Counties, 1990 - 2012
Source: U.S. Department of Labor, Bureau of Labor Statistics.
1990199119921993199419951996199719981999200020012002200320042005200620072008200920102011 Apr.'12
0.0
3.0
6.0
9.0
12.0
15.0
Bryan Co. 5.9 7.3 6.4 5.4 5.0 4.1 3.8 3.6 2.9 2.5 3.0 3.4 3.9 4.7 4.1 3.8 3.6 3.5 3.4 5.5 5.4 5.4 3.9
Love Co. 5.7 5.7 5.5 7.1 6.7 6.4 4.7 4.2 5.0 4.1 3.6 3.9 4.5 5.0 6.2 4.3 3.6 3.1 2.9 5.4 5.0 4.5 2.9
Pontotoc Co. 6.6 7.9 7.5 6.5 5.6 6.6 5.5 4.9 5.3 3.4 3.3 3.9 4.9 5.1 6.0 4.4 3.7 3.6 3.2 5.6 5.4 4.9 3.6
Carter Co. 6.2 7.0 6.7 6.2 6.1 6.6 5.5 5.7 6.6 5.2 3.8 3.9 4.9 4.9 4.8 4.4 3.9 3.4 3.2 5.8 5.5 5.1 3.5
Coal Co. 12.3 13.4 11.6 10.5 9.5 9.1 8.5 9.0 8.8 6.6 4.3 5.4 6.6 12.4 10.6 7.1 6.0 6.2 4.9 8.9 8.0 7.5 5.0
EC
ON
OM
IC
S &
EM
PL
OY
ME
NT
CHILD INDICATORS
Prepared by the Community Service Council
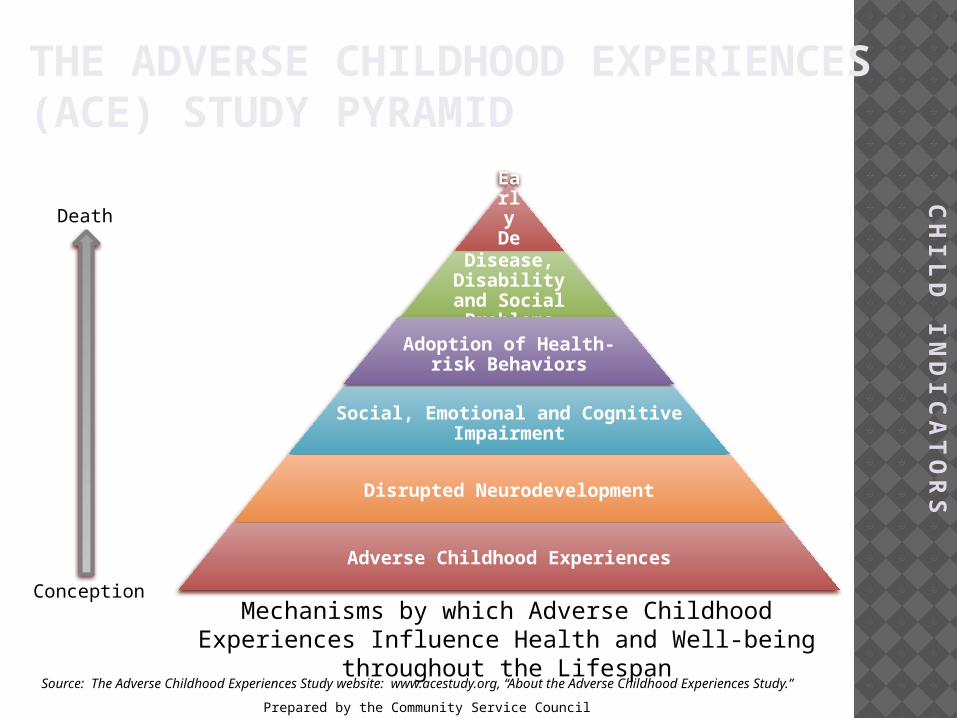
THE ADVERSE CHILDHOOD EXPERIENCES (ACE) STUDY PYRAMID
Early Death
Disease, Disability and Social Problems
Adoption of Health-risk Behaviors
Social, Emotional and Cognitive Impairment
Disrupted Neurodevelopment
Adverse Childhood Experiences
Conception
Death
Mechanisms by which Adverse Childhood Experiences Influence Health and Well-being throughout the Lifespan
Source: The Adverse Childhood Experiences Study website: www.acestudy.org, “About the Adverse Childhood Experiences Study.”
CH
IL
D I
ND
IC
AT
OR
S

ADVERSE CHILDHOOD EXPERIENCES…
Recurrent physical abuse
Recurrent emotional abuse
Sexual abuse An alcohol or drug
abuser An incarcerated
household member
Someone who is chronically depressed, suicidal, institutionalized or mentally ill
Mother being treated violently
One or no parents Emotional or physical
neglectSource: The Adverse Childhood Experiences Study website: www.acestudy.org, “What are Adverse Childhood Experieinces (ACE’s).”
…GROWING UP IN A HOUSEHOLD WITH: CH
IL
D I
ND
IC
AT
OR
S

…LEAD TO HEALTH-RISK BEHAVIORS… Smoking Overeating Physical inactivity Heavy alcohol use Drug use Promiscuity
Source: The Adverse Childhood Experiences Study website: www.acestudy.org
CH
IL
D I
ND
IC
AT
OR
S

…WHICH CAUSE DISEASE, DISABILITY AND SOCIAL PROBLEMS IN ADULTHOOD
Heart disease Cancer Chronic lung and liver
disease Stroke Diabetes Sexually transmitted
diseases
Nicotine addiction Alcoholism Drug addiction Obesity Depression Suicide Injuries Unintentional
pregnancy
Source: Felitti, Vincent J., “The Relationship of Adverse Childhood Experiences to Adult Health: Turning gold into lead;” CDC Media Relations, May 14, 1998, “Adult Health Problems Linked to Traumatic Childhood Experiences.”
CH
IL
D I
ND
IC
AT
OR
S

Prepared by the Community Service Council
Summary of Risk Factors for InfantsBryan & Carter Counties and State of Oklahoma, 2008
Source: Oklahoma State Department of Health, Vital Statistics.
13.7%
42.3%
5.4%
21.4%
6.9%
1.4%
34.8%
20.5%
11%
18.9%
46%
2.7%
24.2%
8%
1.2%
32.5%
17.9%
11.4%
17.8%
46.1%
6%
22.5%
7.2%
0.2%
36.2%
22%
8.8%
Teen mother(age 15-19)
Unmarried mother
Poor prenatal care(3rd trimester/no care)
Mother w/ <12th gradeeducation
Low birthweight(1500-2499 grams)
Very low birthweight(<1500 grams)
Short birth spacing(<24 mos. apart)
Very short birth spacing(<18 mos. apart)
Premature(<37 weeks gest.)
0% 10% 20% 30% 40% 50% 60%
Percent of Births
Bryan Co.
Carter Co.
Oklahoma
Bryan County births: 614Carter County births: 725Oklahoma births: 54,753
CH
IL
D I
ND
IC
AT
OR
S
Prepared by the Community Service Council
Summary of Risk Factors for InfantsCoal, Love & Pontotoc Counties, 2008
13.8%
40%
3.2%
20.5%
5.7%
1.6%
28.6%
17.5%
12.3%
18.5%
32.4%
3.9%
19.4%
6.5%
1.9%
42.4%
21.2%
13.9%
25%
38.6%
5.7%
23.9%
10.2%
3.4%
33.9%
15.3%
15.9%
Teen mother(age 15-19)
Unmarried mother
Poor prenatal care(3rd trimester/no care)
Mother w/ <12th gradeeducation
Low birthweight(1500-2499 grams)
Very low birthweight(<1500 grams)
Short birth spacing(<24 mos. apart)
Very short birth spacing(<18 mos. apart)
Premature(<37 weeks gest.)
0% 10% 20% 30% 40% 50%
Percent of Births
Coal Co.
Love Co.
Pontotoc Co.
Coal County births: 88Love County births: 108Pontotoc County births: 565
Source: Oklahoma State Department of Health, Vital Statistics.
CH
IL
D I
ND
IC
AT
OR
S

Prepared by the Community Service Council
Characteristics of Births to Teen Mothers (Age 15-19)Bryan & Carter Counties and State of Oklahoma, 2008
81.6%
7.1%
54.1%
7.9%
1.8%
67.6%
46.9%
11.6%
20.8%
3.6%
70.8%
3.9%
49.6%
10.9%
1.5%
58.7%
34.8%
11.7%
29.2%
2.2%
78.9%
8.3%
49.5%
10.1%
58.5%
43.9%
12.8%
26.6%
9.2%
Unmarried
Poor prenatal care(3rd trimester/no care)
Mother w/ <12th gradeeducation
Low birthweight(1500-2499 grams)
Very low birthweight(<1500 grams)
Short birth spacing(<24 mos. apart)
Very short birth spacing(<18 mos. apart)
Premature(<37 weeks gest.)
1+ previous births
2+ previous births
0% 20% 40% 60% 80% 100%
Percent of Teen Births
Bryan Co.
Carter Co.
Oklahoma
Source: Oklahoma State Department of Health, Vital Statistics.
Bryan County births to teens: 109Bryan County teen birth rate: 75.6 (per 100,000 females age 15-19)
Carter County births to teens: 137Carter County teen birth rate: 94.9 (per 100,000 females age 15-19)
Oklahoma births to teens: 7,492Oklahoma teen birth rate: 61.6 (per 100,000 females age 15-19)
CH
IL
D I
ND
IC
AT
OR
S

Prepared by the Community Service Council
Characteristics of Births to Teen Mothers (Age 15-19)Coal, Love & Pontotoc Counties, 2008
75.6%
55.1%
3.8%
9%
17.9%
2.6%
65%
11.1%
40%
5%
20%
10%
68.2%
50%
9.1%
13.6%
18.2%
Unmarried
Poor prenatal care(3rd trimester/no care)
Mother w/ <12th gradeeducation
Low birthweight(1500-2499 grams)
Very low birthweight(<1500 grams)
Short birth spacing(<24 mos. apart)
Very short birth spacing(<18 mos. apart)
Premature(<37 weeks gest.)
1+ previous births
2+ previous births
0% 20% 40% 60% 80% 100%
Percent of Teen Births
Coal Co.
Love Co.
Pontotoc Co.
Coal County births to teens: 22Coal County teen birth rate: 106.8 (per 100,000 females age 15-19)
Love County births to teens: 20Love County teen birth rate: 70.7 (per 100,000 females age 15-19)
Pontotoc County births to teens: 78Pontotoc County teen birth rate: 58.3 (per 100,000 females age 15-19)
Source: Oklahoma State Department of Health, Vital Statistics.
CH
IL
D I
ND
IC
AT
OR
S
Prepared by the Community Service Council
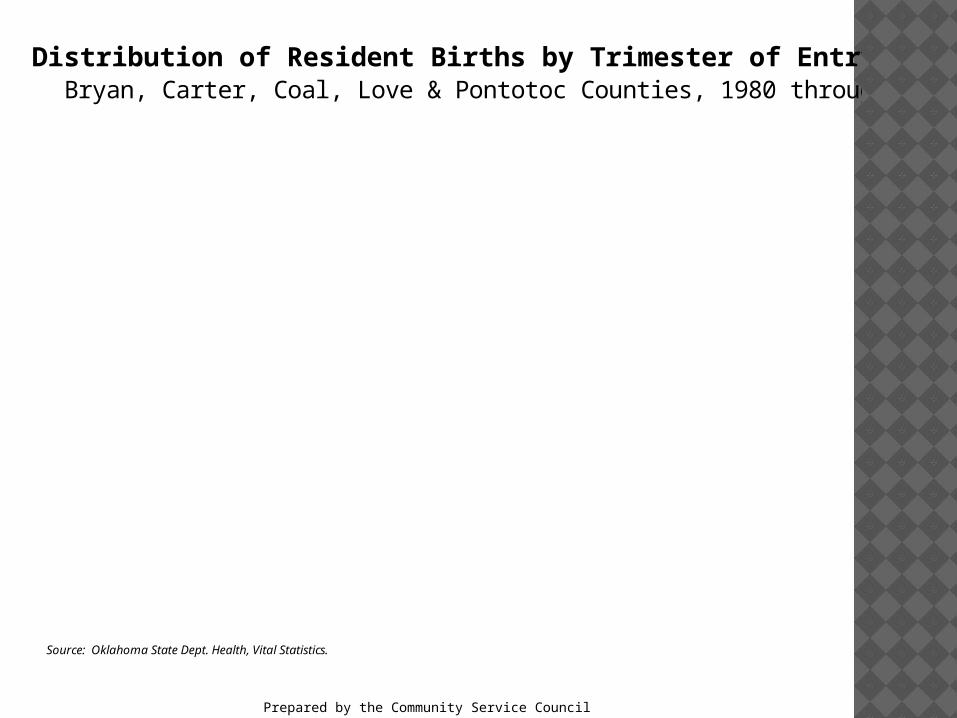
Distribution of Resident Births by Trimester of Entry into CareBryan, Carter, Coal, Love & Pontotoc Counties, 1980 through 2007
Source: Oklahoma State Dept. Health, Vital Statistics.
1980199020002008 1980199020002008 1980199020002008 1980199020002008 19801990200020080%
20%
40%
60%
80%
100%
1st trimester 2nd trimester 3rd trimester No care Unknown
1st trimester 69.1 72 78.4 69.7 69.7 70.9 82.2 83.4 58.2 75.3 70.1 70.5 67.1 68.8 84 87 77.2 78.2 74.2 77.9
2nd trimester 21.1 15 12.4 24.1 22.9 22.1 11.8 6.5 20.3 13.4 20.8 22.7 23.5 24.8 11.7 3.7 16.4 13.7 15.4 17.7
3rd trimester 3.2 3.5 4.4 5 3.9 4.1 1.9 2.2 2.5 7.2 3.9 5.7 0 3.2 2.1 3.7 3.8 3.2 3.7 2.8
No care 0.8 1.4 0.6 1 1.4 0.3 0.5 0.3 1.3 0 1.3 0 4.7 0 1.1 0 0.8 1.9 0.4 0.4
Unknown 5.7 8.2 4.2 0.2 2.2 2.6 3.6 7.6 17.7 4.1 3.9 1.1 4.7 3.2 1.1 5.6 1.8 3 6.3 1.2
Bryan Co. Carter Co. Coal Co. Love Co. Pontotoc Co.
CH
IL
D I
ND
IC
AT
OR
S
Prepared by the Community Service Council
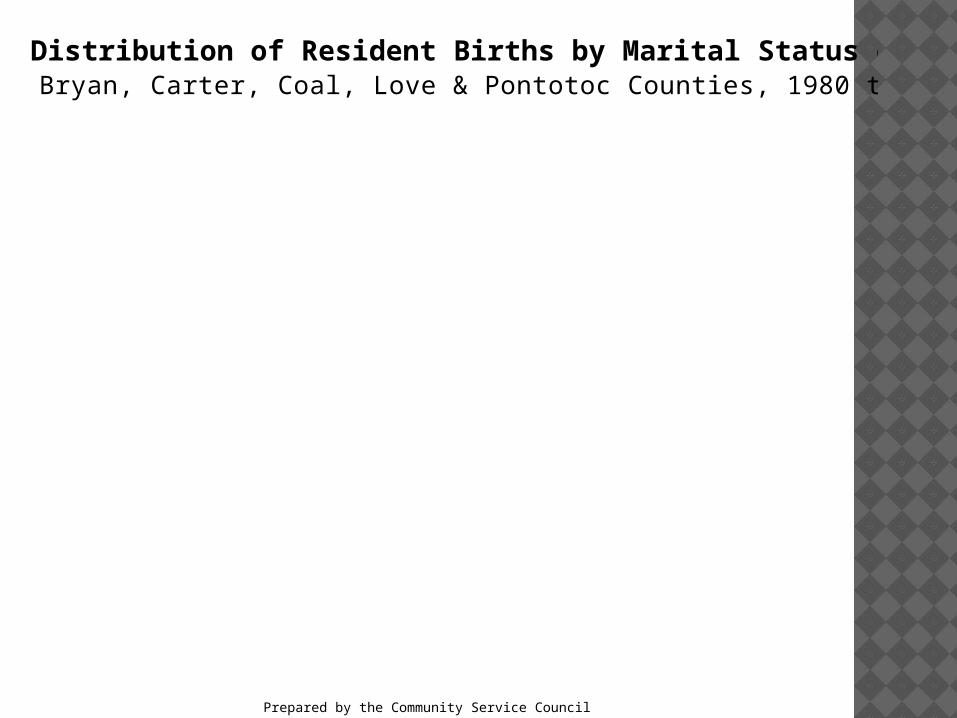
Distribution of Resident Births by Marital Status of MotherBryan, Carter, Coal, Love & Pontotoc Counties, 1980 through 2008
1980 1990 2000 2008 1980 1990 2000 2008 1980 1990 2000 2008 1980 1990 2000 2008 1980 1990 2000 20080%
20%
40%
60%
80%
100%
Single Married
Single 36 114 177 283 73 167 220 333 11 20 24 34 10 40 26 35 46 104 161 429
% Single 14.3 26.6 33.8 46.1 11.4 28.6 34.7 46 14.1 20.6 31.2 38.6 12.5 32 27.7 32.4 9.2 22.3 29.9 44
Married 215 314 347 331 570 417 414 391 67 77 53 54 70 85 68 73 455 362 378 547
% Married 85.7 73.4 66.2 53.9 88.6 71.4 65.3 54 85.9 79.4 68.8 61.4 87.5 68 72.3 62.6 90.8 77.7 70.1 56
Bryan Co. Carter Co. Coal Co. Love Co. Pontotoc Co.
Source: Oklahoma State Dept. Health, Vital Statistics.
CH
IL
D I
ND
IC
AT
OR
S
Prepared by the Community Service Council
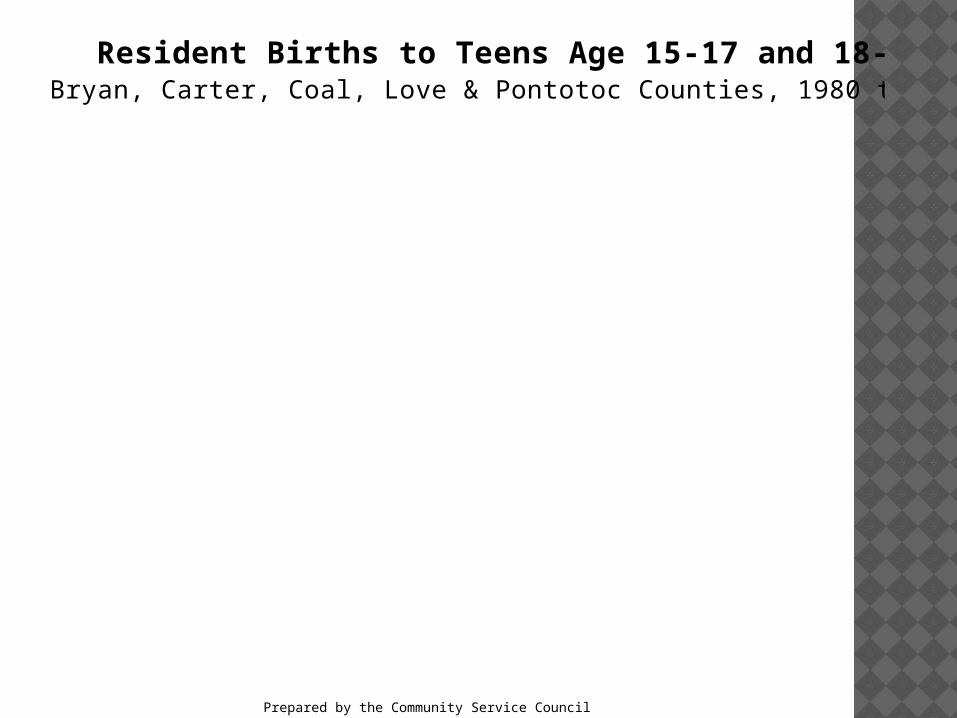
Resident Births to Teens Age 15-17 and 18-19Bryan, Carter, Coal, Love & Pontotoc Counties, 1980 through 2008
'80 '90 '00 '08 '80 '90 '00 '08 '80 '90 '00 '08 '80 '90 '00 '08 '80 '90 '00 '080
20
40
60
80
100
120Number of births
Births 15-17 33 29 27 34 44 42 28 34 8 12 6 8 11 6 9 8 30 21 24 28
Births 18-19 69 68 72 75 118 50 78 103 11 15 13 14 11 16 12 12 55 52 58 50
Bryan CoalCarter Love PontotocSource: Oklahoma State Dept. Health, Vital Statistics.
CH
IL
D I
ND
IC
AT
OR
S
Prepared by the Community Service Council
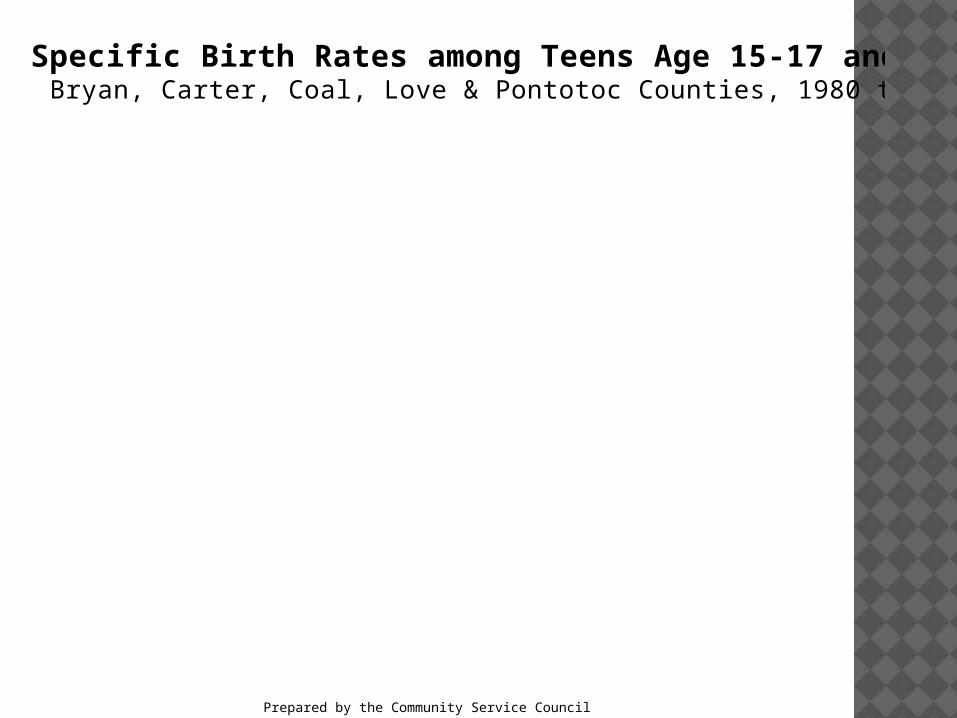
Specific Birth Rates among Teens Age 15-17 and 18-19Bryan, Carter, Coal, Love & Pontotoc Counties, 1980 through 2008
'80 '90 '00 '08 '80 '90 '00 '08 '80 '90 '00 '08 '80 '90 '00 '08 '80 '90 '00 '080
50
100
150
200
250
300Specific birth rate
Births 15-17 43.7 41.9 34.7 40.3 38.5 43.3 27.2 33 50 80 43.2 60.6 55.6 32.3 42.7 40 36.4 27 33.2 35
Births 18-19 103.9 118.1 112.9 125.4 187.9 93.3 139.8 248.8 119.6 208.3 200 189.2 134.1 205.1 134.8 144.6 66.5 83.3 100.3 93.3
Note: Specific birth rate is the number of births to females in specified age group per 1,000 females in age group.
Bryan CoalCarter Love Pontotoc
Source: Oklahoma State Dept. Health, Vital Statistics.
CH
IL
D I
ND
IC
AT
OR
S
Prepared by the Community Service Council
Percentage of all Births to Teens Age 15-17 and 18-19Bryan, Carter, Coal, Love & Pontotoc Counties, 1980 through 2008
'80 '90 '00 '08 '80 '90 '00 '08 '80 '90 '00 '08 '80 '90 '00 '08 '80 '90 '00 '080
5
10
15
20Percent of births
Births 15-17 7 6.8 5.2 5.5 6.8 8 4.4 4.7 10.1 12.8 7.8 9.1 12.9 5 9.6 7.4 6 4.5 4.5 5
Births 18-19 14.6 16 13.8 12.2 18.3 9.5 12.3 14.2 13.9 16 16.9 15.9 12.9 13.4 12.8 11.1 11 11.2 10.8 8.8
Bryan CoalCarter Love PontotocSource: Oklahoma State Dept. Health, Vital Statistics.
CH
IL
D I
ND
IC
AT
OR
S
Prepared by the Community Service Council
Infant Mortality Rates (5-year averages)State of Oklahoma and Bryan County, 1980 to 2008
198
0 -8 4
198
1 -8 5
198
2 -8 6
198
3 -8 7
198
4 -8 8
198
5 -8 9
198
6 -9 0
198
7 -9 1
198
8 -9 2
198
9 -9 3
199
0 -9 4
199
1 -9 5
199
2 -9 6
199
3 -9 7
199
4 -9 8
199
5 -9 9
199
6 -2 0
00
199
7 -2 0
01
199
8 -2 0
02
199
9 -2 0
03
200
0 -0 4
200
1 -0 5
200
2 -0 6
200
3 -0 7
200
4 -0 8
0
5
10
15Number of infant deaths per 1,000 live births
Oklahoma Bryan Co.
Oklahoma 11.2 10.9 10.6 10.1 9.8 9.3 9 8.9 8.7 8.7 8.7 8.6 8.4 8.2 8.2 8.2 8.3 8 8.1 8 7.9 7.8 8 8.1 8
Bryan Co. 10.4 9.9 9.7 10 9.6 11.1 9.6 8.3 6.9 5.6 4.6 5.1 5.5 7.8 7.6 7 6.3 7 5.3 4.8 7.2 9.5 8.6 8.6 8.6
“Healthy People 2020” goal = 6.0
per 1,000
Source: Oklahoma State Dept. Health, Vital Statistics.
From 2004 through 2008, there was an average of 5 infant deaths per year in Bryan County, for a rate of 8.6 per 1,000 live births. In Oklahoma, the average was 425 infant deaths, for a rate of 8.0.
CH
IL
D I
ND
IC
AT
OR
S

Prepared by the Community Service Council
Infant Mortality Rates (5-year averages)State of Oklahoma and Carter County, 1980 to 2008
198
0 -8 4
198
1 -8 5
198
2 -8 6
198
3 -8 7
198
4 -8 8
198
5 -8 9
198
6 -9 0
198
7 -9 1
198
8 -9 2
198
9 -9 3
199
0 -9 4
199
1 -9 5
199
2 -9 6
199
3 -9 7
199
4 -9 8
199
5 -9 9
199
6 -2 0
00
199
7 -2 0
01
199
8 -2 0
02
199
9 -2 0
03
200
0 -0 4
200
1 -0 5
200
2 -0 6
200
3 -0 7
200
4 -0 8
0
5
10
15Number of infant deaths per 1,000 live births
Oklahoma Carter Co.
Oklahoma 11.2 10.9 10.6 10.1 9.8 9.3 9 8.9 8.7 8.7 8.7 8.6 8.4 8.2 8.2 8.2 8.3 8 8.1 8 7.9 7.8 8 8.1 8
Carter Co. 12.9 12.3 12 10.1 8.7 7.9 7.3 5.2 6.5 6.2 7.8 7.9 8.3 6.7 6.9 5.1 4.6 5.6 5.2 4.6 5.2 6.4 6.2 7.7 8.7
“Healthy People 2020” goal = 6.0
per 1,000
Source: Oklahoma State Dept. Health, Vital Statistics.
From 2004 through 2008, there was an average of 6 infant deaths per year in Carter County, for a rate of 8.7 per 1,000 live births. In Oklahoma, the average was 425 infant deaths, for a rate of 8.0.
CH
IL
D I
ND
IC
AT
OR
S
Prepared by the Community Service Council
Infant Mortality Rates (5-year averages)State of Oklahoma and Coal County, 1980 to 2008
198
0 -8 4
198
1 -8 5
198
2 -8 6
198
3 -8 7
198
4 -8 8
198
5 -8 9
198
6 -9 0
198
7 -9 1
198
8 -9 2
198
9 -9 3
199
0 -9 4
199
1 -9 5
199
2 -9 6
199
3 -9 7
199
4 -9 8
199
5 -9 9
199
6 -2 0
00
199
7 -2 0
01
199
8 -2 0
02
199
9 -2 0
03
200
0 -0 4
200
1 -0 5
200
2 -0 6
200
3 -0 7
200
4 -0 8
0
5
10
15
20
25
30Number of infant deaths per 1,000 live births
Oklahoma Coal Co.
Oklahoma 11.2 10.9 10.6 10.1 9.8 9.3 9 8.9 8.7 8.7 8.7 8.6 8.4 8.2 8.2 8.2 8.3 8 8.1 8 7.9 7.8 8 8.1 8
Coal Co. 23 23.8 23.4 27.2 20.2 10.8 7.5 12.8 7.6 9.8 14.4 15.3 10.1 10.1 9.9 5 7.4 7.7 17.3 15.8 21.2 22.3 26.8 17.1 16.3
“Healthy People 2020” goal = 6.0
per 1,000
Source: Oklahoma State Dept. Health, Vital Statistics.
From 2004 through 2008, there was an average of 1 infant death per year in Coal County, for a rate of 16.3 per 1,000 live births. In Oklahoma, the average was 425 infant deaths, for a rate of 8.0.
CH
IL
D I
ND
IC
AT
OR
S

Prepared by the Community Service Council
Infant Mortality Rates (5-year averages)State of Oklahoma and Love County, 1980 to 2008
198
0 -8 4
198
1 -8 5
198
2 -8 6
198
3 -8 7
198
4 -8 8
198
5 -8 9
198
6 -9 0
198
7 -9 1
198
8 -9 2
198
9 -9 3
199
0 -9 4
199
1 -9 5
199
2 -9 6
199
3 -9 7
199
4 -9 8
199
5 -9 9
199
6 -2 0
00
199
7 -2 0
01
199
8 -2 0
02
199
9 -2 0
03
200
0 -0 4
200
1 -0 5
200
2 -0 6
200
3 -0 7
200
4 -0 8
0
5
10
15
20Number of infant deaths per 1,000 live births
Oklahoma Love Co.
Oklahoma 11.2 10.9 10.6 10.1 9.8 9.3 9 8.9 8.7 8.7 8.7 8.6 8.4 8.2 8.2 8.2 8.3 8 8.1 8 7.9 7.8 8 8.1 8
Love Co. 12.9 11 9.1 15.8 15.9 11.9 14.8 12.5 5.4 5.4 7.2 3.9 4 4 5.9 5.9 5.7 9.5 9.3 7.6 5.6 5.5 5.2 11.7 13.4
“Healthy People 2020” goal = 6.0
per 1,000
Source: Oklahoma State Dept. Health, Vital Statistics.
From 2004 through 2008, there was an average of 2 infant deaths per year in Love County, for a rate of 13.4 per 1,000 live births. In Oklahoma, the average was 425 infant deaths, for a rate of 8.0.
CH
IL
D I
ND
IC
AT
OR
S

Prepared by the Community Service Council
Infant Mortality Rates (5-year averages)State of Oklahoma and Pontotoc County, 1980 to 2008
198
0 -8 4
198
1 -8 5
198
2 -8 6
198
3 -8 7
198
4 -8 8
198
5 -8 9
198
6 -9 0
198
7 -9 1
198
8 -9 2
198
9 -9 3
199
0 -9 4
199
1 -9 5
199
2 -9 6
199
3 -9 7
199
4 -9 8
199
5 -9 9
199
6 -2 0
00
199
7 -2 0
01
199
8 -2 0
02
199
9 -2 0
03
200
0 -0 4
200
1 -0 5
200
2 -0 6
200
3 -0 7
200
4 -0 8
0
5
10
15Number of infant deaths per 1,000 live births
Oklahoma Pontotoc Co.
Oklahoma 11.2 10.9 10.6 10.1 9.8 9.3 9 8.9 8.7 8.7 8.7 8.6 8.4 8.2 8.2 8.2 8.3 8 8.1 8 7.9 7.8 8 8.1 8
Pontotoc Co. 10.6 10.2 8.2 8.8 8.6 7.1 6.4 7 5.7 4.9 7 8 8.8 9.5 9.3 9 9.5 8.6 8.2 9.4 8.5 7.7 8.3 9.7 9.1
“Healthy People 2020” goal = 6.0
per 1,000
Source: Oklahoma State Dept. Health, Vital Statistics.
From 2004 through 2008, there was an average of 5 infant deaths per year in Pontotoc County, for a rate of 9.1 per 1,000 live births. In Oklahoma, the average was 425 infant deaths, for a rate of 8.0.
CH
IL
D I
ND
IC
AT
OR
S
Prepared by the Community Service Council
Average Daily Membership and Percentage of Children Enrolled in Special Education, by School District
Bryan County County, School Year 2009-10
Source: Oklahoma State Department of Education, Education Oversight Board, Office of Accountability, Profiles 2011 Reports.
Silo Rock Creek Achille Colbert Caddo Bennington Calera Durant0
500
1,000
1,500
2,000
2,500
3,000
3,500ADM
0%
5%
10%
15%
20%
25%
30%
35%Percent in Special Education
ADM % Spec. Ed.
ADM 743 481 391 886 487 263 615 3,360
% Spec. Ed. 21.9% 18.9% 21.5% 17.4% 20.3% 32.7% 16.3% 15.2%
Bryan County total ADM = 7,726; percentage in special education = 17.8%
CH
IL
D I
ND
IC
AT
OR
S
Prepared by the Community Service Council
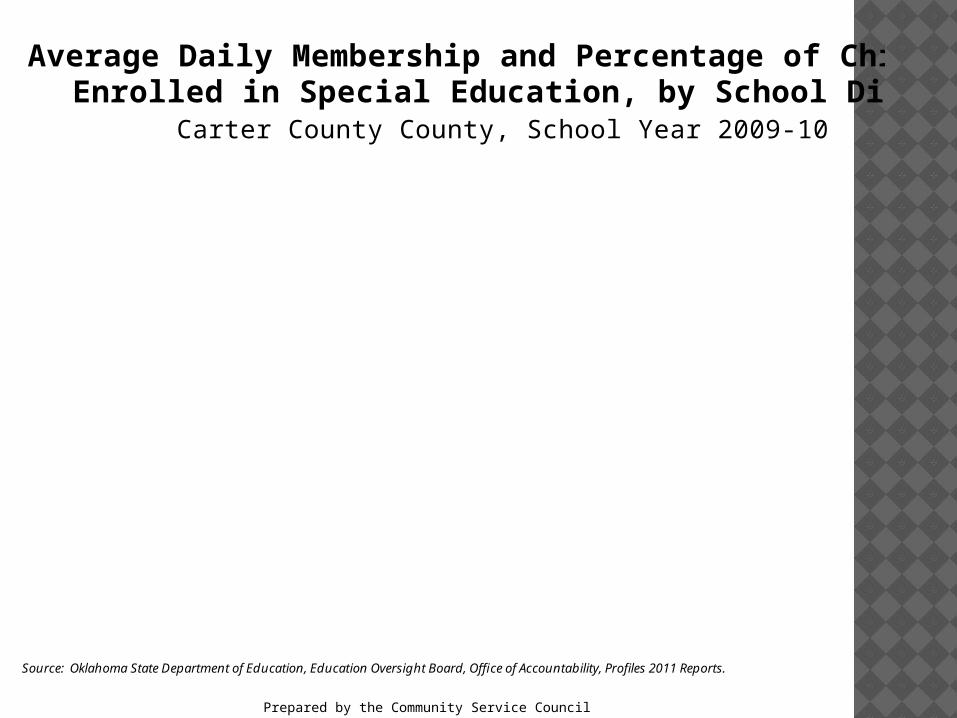
Average Daily Membership and Percentage of Children Enrolled in Special Education, by School District
Carter County County, School Year 2009-10
Source: Oklahoma State Department of Education, Education Oversight Board, Office of Accountability, Profiles 2011 Reports.
Zaneis Ardmore Springer Plainview LoneGrove
Wilson Healdton Fox Dickson0
500
1,000
1,500
2,000
2,500
3,000
3,500ADM
0%
5%
10%
15%
20%
25%
30%
35%Percent in Special Education
ADM % Spec. Ed.
ADM 270 3,081 249 1,388 1,545 469 548 333 1,290
% Spec. Ed. 24.1% 14.5% 27.3% 13.6% 14.4% 25.8% 22.4% 23.1% 13.3%
Carter County total ADM = 9,173; percentage in special education = 16.2%
CH
IL
D I
ND
IC
AT
OR
S

Prepared by the Community Service Council
Average Daily Membership and Percentage of Children Enrolled in Special Education, by School District
Coal County County, School Year 2009-10
Source: Oklahoma State Department of Education, Education Oversight Board, Office of Accountability, Profiles 2011 Reports.
Cottonwood Coalgate Tupelo0
200
400
600
800ADM
0%
10%
20%
30%
40%Percent in Special Education
ADM % Spec. Ed.
ADM 248 762 282
% Spec. Ed. 33.1% 21.3% 28.4%
Coal County total ADM = 1,292; percentage in special education = 25.1%
CH
IL
D I
ND
IC
AT
OR
S
Prepared by the Community Service Council
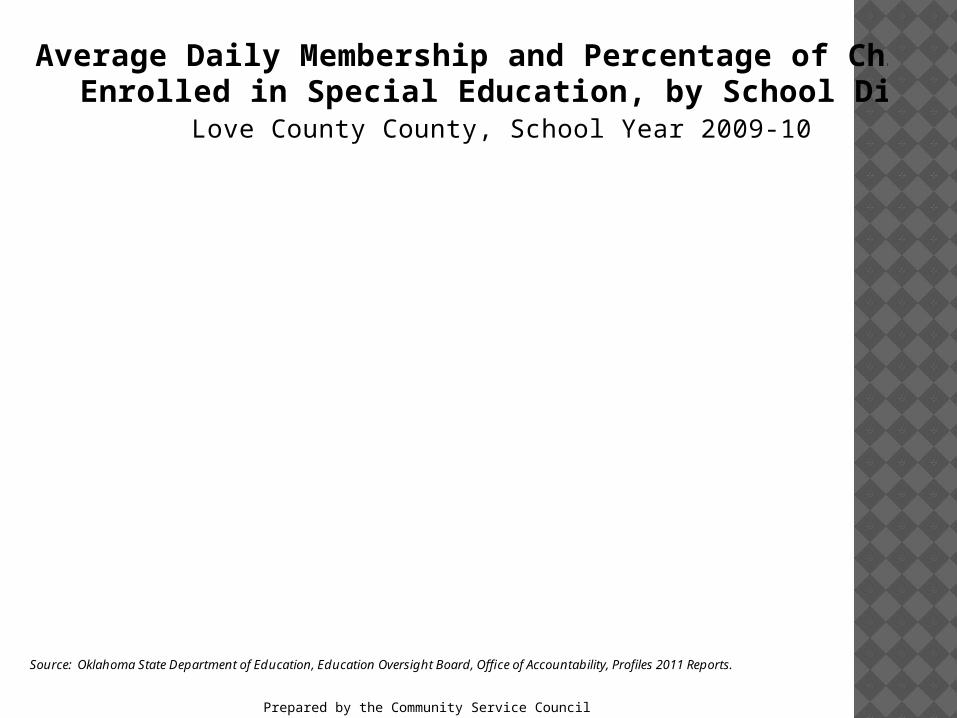
Average Daily Membership and Percentage of Children Enrolled in Special Education, by School District
Love County County, School Year 2009-10
Source: Oklahoma State Department of Education, Education Oversight Board, Office of Accountability, Profiles 2011 Reports.
Greenville Thackerville Turner Marietta0
250
500
750
1,000ADM
0%
10%
20%
30%
40%Percent in Special Education
ADM % Spec. Ed.
ADM 108 307 289 952
% Spec. Ed. 14.8% 16.6% 27% 11.4%
Love County total ADM = 1,656; percentage in special education = 15.3%
CH
IL
D I
ND
IC
AT
OR
S
Prepared by the Community Service Council
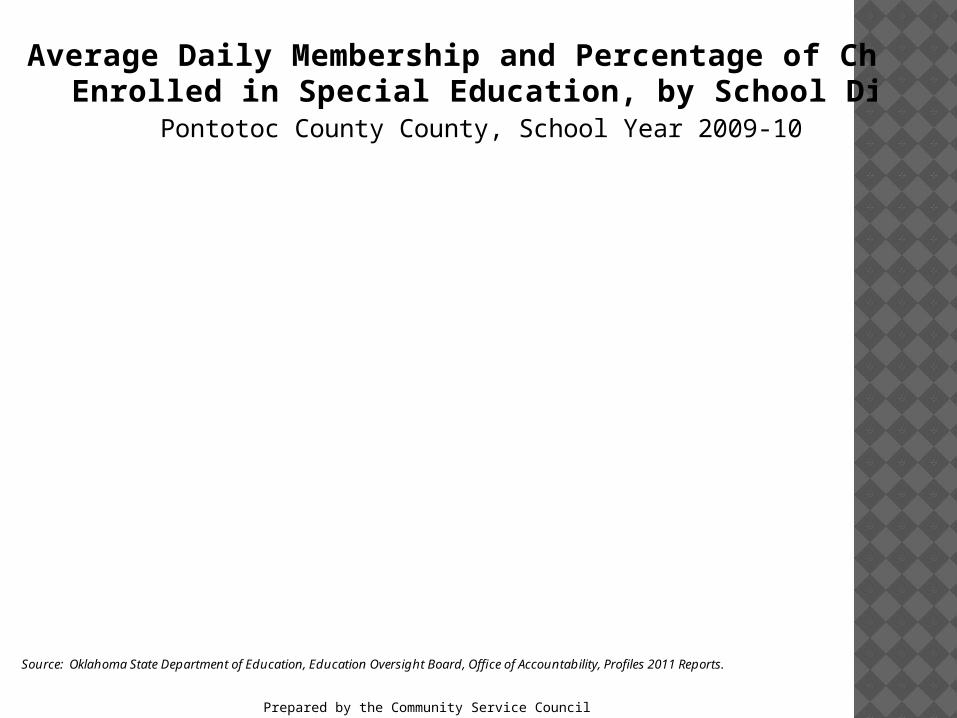
Average Daily Membership and Percentage of Children Enrolled in Special Education, by School District
Pontotoc County County, School Year 2009-10
Source: Oklahoma State Department of Education, Education Oversight Board, Office of Accountability, Profiles 2011 Reports.
Pickett-Center
Allen Vanoss Byng Ada Latta Stonewall Roff0
500
1,000
1,500
2,000
2,500
3,000ADM
0%
5%
10%
15%
20%
25%
30%Percent in Special Education
ADM % Spec. Ed.
ADM 109 432 554 1,750 2,652 695 412 344
% Spec. Ed. 19.3% 13.9% 19.7% 18.9% 17.3% 14.8% 19.2% 15.7%
Pontotoc County total ADM = 6,948; percentage in special education = 17.5%
CH
IL
D I
ND
IC
AT
OR
S

Prepared by the Community Service Council
DHS Licensed Child Care Services Provided to Children Under Age 5, by Age
Bryan County, October 2001 & 2011
Source: Oklahoma Department of Human Services, Monthly Statistical Bulletins.
19
44 4448
39
25
4750
43
31
< Age 1 Age 1 Age 2 Age 3 Age 40
10
20
30
40
50
60 2001 2011 CH
IL
D I
ND
IC
AT
OR
S

Prepared by the Community Service Council
DHS Licensed Child Care Services Provided to Children Under Age 5, by Age
Carter County, October 2001 & 2011
45
78
118
102
63
22
6368
75
51
< Age 1 Age 1 Age 2 Age 3 Age 40
20
40
60
80
100
120
140 2001 2011
Source: Oklahoma Department of Human Services, Monthly Statistical Bulletins.
CH
IL
D I
ND
IC
AT
OR
S

Prepared by the Community Service Council
DHS Licensed Child Care Services Provided to Children Under Age 5, by Age
Coal County, October 2001 & 2011
2
6 6
9
6
5
7
12
5
4
< Age 1 Age 1 Age 2 Age 3 Age 40
2
4
6
8
10
12
14 2001 2011
Source: Oklahoma Department of Human Services, Monthly Statistical Bulletins.
CH
IL
D I
ND
IC
AT
OR
S

Prepared by the Community Service Council
DHS Licensed Child Care Services Provided to Children Under Age 5, by Age
Love County, October 2001 & 2011
2
15
10
8
44
9
1514
8
< Age 1 Age 1 Age 2 Age 3 Age 40
2
4
6
8
10
12
14
16
18 2001 2011
Source: Oklahoma Department of Human Services, Monthly Statistical Bulletins.
CH
IL
D I
ND
IC
AT
OR
S
Prepared by the Community Service Council
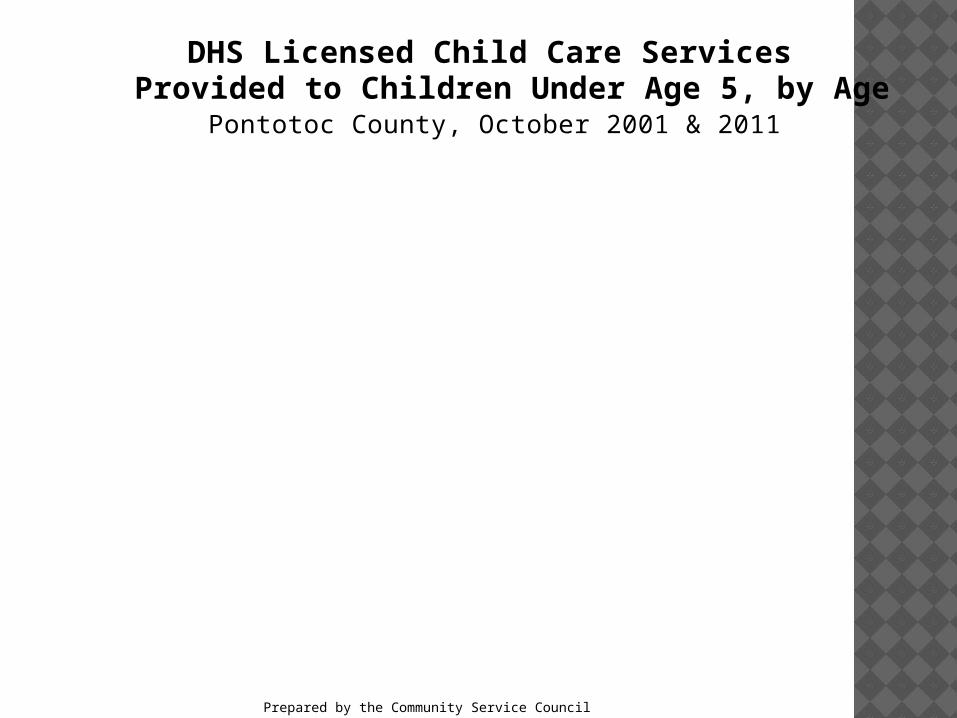
DHS Licensed Child Care Services Provided to Children Under Age 5, by Age
Pontotoc County, October 2001 & 2011
42
75 7681
4136
59 61
71
24
< Age 1 Age 1 Age 2 Age 3 Age 40
20
40
60
80
100 2001 2011
Source: Oklahoma Department of Human Services, Monthly Statistical Bulletins.
CH
IL
D I
ND
IC
AT
OR
S

Prepared by the Community Service Council
DHS Child Care Licensed Facilities and Capacity, by Type
Bryan County, October, 2011
Source: Oklahoma Department of Human Services, Monthly Statistical Bulletin.
41
25
27
17
14
8
1,505
1,095
1,369
1,009
136
86
Total
DHS Contract Total
Total Centers
DHS Contract Centers
Total Homes
DHS Contract Homes
01020304050
Facilities
0 500 1,000 1,500
Capacity
CH
IL
D I
ND
IC
AT
OR
S
Prepared by the Community Service Council
DHS Child Care Licensed Facilities and Capacity, by Type
Carter County, October 2011
Source: Oklahoma Department of Human Services, Monthly Statistical Bulletin.
38
26
19
12
19
14
1,473
993
1,310
865
163
128
Total
DHS Contract Total
Total Centers
DHS Contract Centers
Total Homes
DHS Contract Homes
01020304050
Facilities
0 500 1,000 1,500
Capacity
CH
IL
D I
ND
IC
AT
OR
S

Prepared by the Community Service Council
DHS Child Care Licensed Facilities and Capacity, by Type
Coal County, October, 2011
Source: Oklahoma Department of Human Services, Monthly Statistical Bulletin.
8
4
6
2
2
2
233
94
214
75
19
19
Total
DHS Contract Total
Total Centers
DHS Contract Centers
Total Homes
DHS Contract Homes
051015
Facilities
0 100 200 300
Capacity
CH
IL
D I
ND
IC
AT
OR
S

Prepared by the Community Service Council
DHS Child Care Licensed Facilities and Capacity, by Type
Love County, October, 2011
Source: Oklahoma Department of Human Services, Monthly Statistical Bulletin.
6
4
4
3
2
1
194
142
180
135
14
7
Total
DHS Contract Total
Total Centers
DHS Contract Centers
Total Homes
DHS Contract Homes
0246810
Facilities
0 50 100 150 200
Capacity
CH
IL
D I
ND
IC
AT
OR
S
Prepared by the Community Service Council
DHS Child Care Licensed Facilities and Capacity, by Type
Pontotoc County, October, 2011
Source: Oklahoma Department of Human Services, Monthly Statistical Bulletin.
32
22
20
14
12
8
1,255
760
1,156
689
99
71
Total
DHS Contract Total
Total Centers
DHS Contract Centers
Total Homes
DHS Contract Homes
01020304050
Facilities
0 500 1,000 1,500
Capacity
CH
IL
D I
ND
IC
AT
OR
S
Prepared by the Community Service Council
Early Childhood (Pre-K) Enrollment, by School DistrictBryan County, Comparison of October 2003 and October 2010
Source: Oklahoma State Department of Education, Accreditation and Data Processing/Research Services.
00
00
40
00
00
00
00
00
23
53
0
199266
19
19
3939
2020
0
0
1
0
0
0
0
0
21
160
52
266
22
28
39
20
Achille - 20032010
Colbert - 20032010
Silo - 20032010
Durant - 20032010
Bennington - 20032010
Caddo - 20032010
Calera - 20032010
Rock Creek - 20032010
0100200300 0 100 200 300
4 year old half day 4 year old full day
3 year old half day 3 year old full day CH
IL
D I
ND
IC
AT
OR
S

Prepared by the Community Service Council
Early Childhood (Pre-K) Enrollment, by School DistrictCarter County, Comparison of October 2003 and October 2010
Source: Oklahoma State Department of Education, Accreditation and Data Processing/Research Services.
00
00
00
00
94
00
22
00
00
21
253
817
73
0100
21
039
17
57
0
0
0
0
6
0
1
0
00
41
238
17
84
100
27
39
26
5772
Zaneis - 20032010
Ardmore - 20032010
Springer - 20032010
Plainview - 20032010
Lone Grove - 20032010
Wilson - 20032010
Healdton - 20032010
Fox - 20032010
Dickson - 20032010
0100200300 0 100 200 300
4 year old half day 4 year old full day
3 year old half day 3 year old full day CH
IL
D I
ND
IC
AT
OR
S
Prepared by the Community Service Council
Early Childhood (Pre-K) Enrollment, by School DistrictCoal County, Comparison of October 2003 and October 2010
Source: Oklahoma State Department of Education, Accreditation and Data Processing/Research Services.
0
0
0
0
0
0
15
37
30
14
23
4
0
0
0
2
0
0
0
15
31
37
30
14
23
4
Cottonwood - 2003
2010
Coalgate - 2003
2010
Tupelo - 2003
2010
Olney - 2003
2010
01020304050 0 10 20 30 40 50
4 year old half day 4 year old full day
3 year old half day 3 year old full day CH
IL
D I
ND
IC
AT
OR
S
Prepared by the Community Service Council
Early Childhood (Pre-K) Enrollment, by School DistrictLove County, Comparison of October 2003 and October 2010
Source: Oklahoma State Department of Education, Accreditation and Data Processing/Research Services.
0
0
0
0
0
0
0
0
10
18
13
57
0
0
0
0
0
0
0
0
10
13
18
30
13
31
57
76
Greenville - 2003
2010
Thackerville - 2003
2010
Turner - 2003
2010
Marietta - 2003
2010
020406080100 0 20 40 60 80 100
4 year old half day 4 year old full day
3 year old half day 3 year old full day CH
IL
D I
ND
IC
AT
OR
S

Prepared by the Community Service Council
Early Childhood (Pre-K) Enrollment, by School DistrictPontotoc County, Comparison of October 2003 and October 2010
Source: Oklahoma State Department of Education, Accreditation and Data Processing/Research Services.
80
0
0
0
0
0
0
00
00
09
2930
2233
139179
163193
5
4040
2238
1724
0
1
1
4
5
3
0
0
9
30
33
179
193
40
38
24
Pickett-Center - 20032010
Allen - 20032010
Vanoss - 20032010
Byng - 20032010
Ada - 20032010
McLish - 20032010
Latta - 20032010
Stonewall - 20032010
Roff - 20032010
050100150200 0 50 100 150 200
4 year old half day 4 year old full day
3 year old half day 3 year old full day CH
IL
D I
ND
IC
AT
OR
S
Prepared by the Community Service Council
Child Deaths Due to AbuseOklahoma, Fiscal Years 1978 - 2009
Source: Oklahoma Dept. of Human Services, Children & Family Services Division.
75
12 13
1821
16 16
24
31
2325
18
38
2023
3134
29
4245
47 48
3835
27
51
40
32
3941
52
1978
1979
1980
1981
1982
1983
1984
1985
1986
1987
1988
1989
1990
1991
1992
1993
1994
1995
1996
1997
1998
1999
2000
2001
2002
2003
2004
2005
2006
2007
2008
2009
0
10
20
30
40
50
60
CH
IL
D I
ND
IC
AT
OR
S
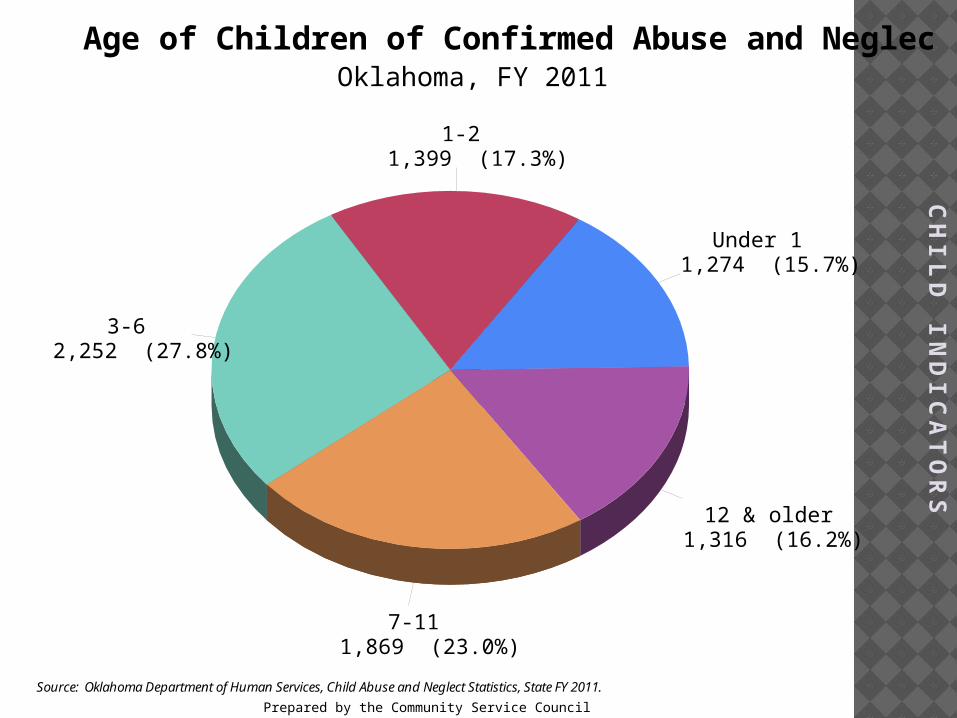
Prepared by the Community Service Council
Age of Children of Confirmed Abuse and NeglectOklahoma, FY 2011
Source: Oklahoma Department of Human Services, Child Abuse and Neglect Statistics, State FY 2011.
Under 11,274 (15.7%)
1-21,399 (17.3%)
3-62,252 (27.8%)
7-111,869 (23.0%)
12 & older1,316 (16.2%)
CH
IL
D I
ND
IC
AT
OR
S

Prepared by the Community Service Council
CHILD ABUSE AND NEGLECT, FY2011
Bryan County
Carter County
Coal County
Love County
Pontotoc County
Alleged victims 842 927 154 112 543
Confirmed victims 165 193 22 20 94
…of Abuse 29 26 7 1 18
…of Neglect 119 160 13 17 61
… of Both abuse & neglect
17 7 2 2 15
Child abuse/neglect rate per 1,000 children
16.6 15.8 14.6 8.7 10.7
Notes: Each “confirmed victim” of child abuse and/or neglect indicates one child. Since a child may be confirmed abused and/or neglected multiple times in a year, “confirmed victims” is not an unduplicated count of children.
Source: Oklahoma Department of Human Services, Child Abuse and Neglect Statistics.
CH
IL
D I
ND
IC
AT
OR
S

Prepared by the Community Service Council
Child Abuse and Neglect Reports Received and Accepted for Investigation or Assessment
Bryan County, Fiscal Year 2000 - 2011
Source: Oklahoma Department of Human Services, Child Abuse and Neglect Statistics.
2000 2001 2002 2003 2004 2005 2006 2007 2008 2009 2010 20110
500
1,000
1,500Number of reports received and accepted
Reports received 431 468 821 861 808 1,192 1,091 1,135 1,204 1,029 1,113 1,083
Reports accepted 317 311 490 444 480 694 560 667 733 516 494 530
Notes: Each “report” of child abuse and/or neglect “received” and “accepted” may involve multiple children.
CH
IL
D I
ND
IC
AT
OR
S
Prepared by the Community Service Council
Number of Children Assessed or Investigated and Confirmed as Victims of Child Abuse and Neglect
Bryan County, Fiscal Year 2000- 2011
Source: Oklahoma Department of Human Services, Child Abuse and Neglect Statistics.
2000 2001 2002 2003 2004 2005 2006 2007 2008 2009 2010 20110
300
600
900
1,200Number of children
0%
10%
20%
30%
40%Confirmation rate
Assessed or Investigated 542 420 796 716 623 1,199 1,010 1,004 1,156 1,010 782 842
Confirmed 130 155 220 137 156 336 309 226 197 161 204 165
Confirmation rate 24% 37% 28% 19% 25% 28% 31% 23% 17% 16% 26% 20%
Notes: Each child assessed, investigated or confirmed for child abuse and/or neglect indicates one child. Since a child may be assessed, investigated or confirmed multiple times in a year, these values are not necessarily unduplicated counts of children. “Confirmation rate” is the number of children confirmed abused and/or neglected per 100 children investigated or assessed.
CH
IL
D I
ND
IC
AT
OR
S

Prepared by the Community Service Council
Child Abuse and Neglect Reports Received and Accepted for Investigation or Assessment
Carter County, Fiscal Year 2002 - 2011
Source: Oklahoma Department of Human Services, Child Abuse and Neglect Statistics.
2000 2001 2002 2003 2004 2005 2006 2007 2008 2009 2010 20110
500
1,000
1,500Number of reports received and accepted
Reports received 718 715 709 884 1,057 1,097 1,088 1,165 1,365 1,207 1,108 582
Reports accepted 481 436 499 583 670 704 775 752 674 477 502 511
Notes: Each “report” of child abuse and/or neglect “received” and “accepted” may involve multiple children.
CH
IL
D I
ND
IC
AT
OR
S

Prepared by the Community Service Council
Number of Children Assessed or Investigated and Confirmed as Victims of Child Abuse and Neglect
Carter County, Fiscal Year 2000- 2011
2000 2001 2002 2003 2004 2005 2006 2007 2008 2009 2010 20110
300
600
900
1,200
1,500Number of children
0%
10%
20%
30%
40%
50%Confirmation rate
Assessed or Investigated 818 668 823 937 1,068 1,280 1,382 1,400 1,149 825 845 927
Confirmed 215 253 271 187 259 358 328 238 209 106 146 193
Confirmation rate 26% 39% 33% 20% 24% 28% 24% 17% 18% 13% 17% 21%
Source: Oklahoma Department of Human Services, Child Abuse and Neglect Statistics.
Notes: Each child assessed, investigated or confirmed for child abuse and/or neglect indicates one child. Since a child may be assessed, investigated or confirmed multiple times in a year, these values are not necessarily unduplicated counts of children. “Confirmation rate” is the number of children confirmed abused and/or neglected per 100 children investigated or assessed.
CH
IL
D I
ND
IC
AT
OR
S

Prepared by the Community Service Council
Child Abuse and Neglect Reports Received and Accepted for Investigation or Assessment
Coal County, Fiscal Year 2002 - 2011
Source: Oklahoma Department of Human Services, Child Abuse and Neglect Statistics.
2000 2001 2002 2003 2004 2005 2006 2007 2008 2009 2010 20110
100
200
300Number of reports received and accepted
Reports received 169 220 223 251 198 238 225 200 221 196 165 164
Reports accepted 129 167 176 182 151 161 164 131 131 127 107 97
Notes: Each “report” of child abuse and/or neglect “received” and “accepted” may involve multiple children.
CH
IL
D I
ND
IC
AT
OR
S

Prepared by the Community Service Council
Number of Children Assessed or Investigated and Confirmed as Victims of Child Abuse and Neglect
Coal County, Fiscal Year 2000- 2011
2000 2001 2002 2003 2004 2005 2006 2007 2008 2009 2010 20110
100
200
300
400
500Number of children
0%
10%
20%
30%
40%
50%Confirmation rate
Assessed or Investigated 228 231 360 334 299 291 283 236 230 205 175 154
Confirmed 58 69 93 78 73 81 37 26 36 19 38 22
Confirmation rate 25% 30% 26% 23% 24% 28% 13% 11% 16% 9% 22% 14%
Source: Oklahoma Department of Human Services, Child Abuse and Neglect Statistics.
Notes: Each child assessed, investigated or confirmed for child abuse and/or neglect indicates one child. Since a child may be assessed, investigated or confirmed multiple times in a year, these values are not necessarily unduplicated counts of children. “Confirmation rate” is the number of children confirmed abused and/or neglected per 100 children investigated or assessed.
CH
IL
D I
ND
IC
AT
OR
S
Prepared by the Community Service Council
Child Abuse and Neglect Reports Received and Accepted for Investigation or Assessment
Love County, Fiscal Year 2002 - 2011
Source: Oklahoma Department of Human Services, Child Abuse and Neglect Statistics.
2000 2001 2002 2003 2004 2005 2006 2007 2008 2009 2010 20110
50
100
150
200Number of reports received and accepted
Reports received 126 136 139 143 176 180 163 141 119 171 179 74
Reports accepted 99 83 95 107 124 113 101 77 57 80 76 64
Notes: Each “report” of child abuse and/or neglect “received” and “accepted” may involve multiple children.
CH
IL
D I
ND
IC
AT
OR
S
Prepared by the Community Service Council
Number of Children Assessed or Investigated and Confirmed as Victims of Child Abuse and Neglect
Love County, Fiscal Year 2000- 2011
2000 2001 2002 2003 2004 2005 2006 2007 2008 2009 2010 20110
50
100
150
200
250Number of children
0%
10%
20%
30%
40%
50%Confirmation rate
Assessed or Investigated 172 166 169 172 236 204 155 146 102 137 144 112
Confirmed 69 52 28 36 48 40 45 22 15 6 18 20
Confirmation rate 40% 31% 17% 21% 20% 20% 29% 15% 15% 4% 13% 18%
Source: Oklahoma Department of Human Services, Child Abuse and Neglect Statistics.
Notes: Each child assessed, investigated or confirmed for child abuse and/or neglect indicates one child. Since a child may be assessed, investigated or confirmed multiple times in a year, these values are not necessarily unduplicated counts of children. “Confirmation rate” is the number of children confirmed abused and/or neglected per 100 children investigated or assessed.
CH
IL
D I
ND
IC
AT
OR
S

Prepared by the Community Service Council
Child Abuse and Neglect Reports Received and Accepted for Investigation or Assessment
Pontotoc County, Fiscal Year 2002 - 2011
Source: Oklahoma Department of Human Services, Child Abuse and Neglect Statistics.
2000 2001 2002 2003 2004 2005 2006 2007 2008 2009 2010 20110
250
500
750
1,000Number of reports received and accepted
Reports received 745 678 705 656 747 858 860 800 762 746 650 743
Reports accepted 432 391 420 430 427 429 389 387 372 306 299 364
Notes: Each “report” of child abuse and/or neglect “received” and “accepted” may involve multiple children.
CH
IL
D I
ND
IC
AT
OR
S
Prepared by the Community Service Council
Number of Children Assessed or Investigated and Confirmed as Victims of Child Abuse and Neglect
Pontotoc County, Fiscal Year 2000- 2011
2000 2001 2002 2003 2004 2005 2006 2007 2008 2009 2010 20110
250
500
750
1,000Number of children
0%
10%
20%
30%
40%Confirmation rate
Assessed or Investigated 693 685 803 819 740 775 600 637 660 528 445 543
Confirmed 193 162 255 227 150 169 108 150 134 80 95 94
Confirmation rate 28% 24% 32% 28% 20% 22% 18% 24% 20% 15% 21% 17%
Source: Oklahoma Department of Human Services, Child Abuse and Neglect Statistics.
Notes: Each child assessed, investigated or confirmed for child abuse and/or neglect indicates one child. Since a child may be assessed, investigated or confirmed multiple times in a year, these values are not necessarily unduplicated counts of children. “Confirmation rate” is the number of children confirmed abused and/or neglected per 100 children investigated or assessed.
CH
IL
D I
ND
IC
AT
OR
S
Prepared by the Community Service Council
Elementary School Students Eligible for Free and Reduced Lunch Program
By School District, Bryan County, 2011-2012 School Year
Source: Oklahoma State Dept. of Education, Low Income Report for 2011-2012.
64%
73.3%
79.5%
69.2%
68.8%
64.6%
64.5%
59.9%
56.7%
11%
15.7%
6%
12.9%
11.1%
12.1%
12.1%
10.2%
13.1%
Bryan County Total
Bennington
Caddo
Rock Creek
Colbert
Achille
Silo
Durant
Calera
0% 20% 40% 60% 80% 100%
Percent of Students Eligible
Free Reduced
Free lunch eligibility requirement: annual household income below 130% of poverty, which currently is $24,817 for a family of three.
Reduced lunch eligibility requirement: annual household income below 185% of poverty, which currently is $35,317 for a family of three.
CH
IL
D I
ND
IC
AT
OR
S

Prepared by the Community Service Council
Elementary School Students Eligible for Free and Reduced Lunch Program
By School District, Carter County, 2011-2012 School Year
Source: Oklahoma State Dept. of Education, Low Income Report for 2011-2012.
61%
81.8%
78.1%
72.2%
64.9%
67.7%
65.3%
54.4%
46.9%
28.1%
11.3%
7.3%
10.7%
11.4%
14.8%
11.1%
13.1%
13.7%
11.9%
8.7%
Carter County Total
Fox
Ardmore
Springer
Wilson
Zaneis
Healdton
Dickson
Lone Grove
Plainview
0% 20% 40% 60% 80% 100%
Percent of Students Eligible
Free Reduced
Free lunch eligibility requirement: annual household income below 130% of poverty, which currently is $24,817 for a family of three.
Reduced lunch eligibility requirement: annual household income below 185% of poverty, which currently is $35,317 for a family of three.
CH
IL
D I
ND
IC
AT
OR
S

Prepared by the Community Service Council
Elementary School Students Eligible for Free and Reduced Lunch Program
By School District, Coal County, 2011-2012 School Year
Source: Oklahoma State Dept. of Education, Low Income Report for 2011-2012.
63.1%
69.1%
61.6%
55.5%
10.1%
9.9%
13.2%
8.1%
Coal County Total
Coalgate
Tupelo
Cottonwood
0% 20% 40% 60% 80% 100%
Percent of Students Eligible
Free Reduced
Free lunch eligibility requirement: annual household income below 130% of poverty, which currently is $24,817 for a family of three.
Reduced lunch eligibility requirement: annual household income below 185% of poverty, which currently is $35,317 for a family of three.
CH
IL
D I
ND
IC
AT
OR
S

Prepared by the Community Service Council
Elementary School Students Eligible for Free and Reduced Lunch Program
By School District, Love County, 2011-2012 School Year
Source: Oklahoma State Dept. of Education, Low Income Report for 2011-2012.
62%
67.4%
67.2%
64.1%
45.3%
14%
14.9%
12.9%
8.6%
17.5%
Love County Total
Marietta
Greenville
Thackerville
Turner
0% 20% 40% 60% 80% 100%
Percent of Students Eligible
Free Reduced
Free lunch eligibility requirement: annual household income below 130% of poverty, which currently is $24,817 for a family of three.
Reduced lunch eligibility requirement: annual household income below 185% of poverty, which currently is $35,317 for a family of three.
CH
IL
D I
ND
IC
AT
OR
S

Prepared by the Community Service Council
Elementary School Students Eligible for Free and Reduced Lunch Program
By School District, Pontotoc County, 2011-2012 School Year
Source: Oklahoma State Dept. of Education, Low Income Report for 2011-2012.
57.2%
84.4%
77.5%
61.2%
58.5%
57.9%
52%
39.4%
11.2%
10.8%
5.7%
16.3%
10.2%
8.8%
14.6%
10.8%
Pontotoc County Total
Stonewall
Roff
Vanoss
Allen
Ada
Byng
Latta
0% 20% 40% 60% 80% 100%
Percent of Students Eligible
Free Reduced
Free lunch eligibility requirement: annual household income below 130% of poverty, which currently is $24,817 for a family of three.
Reduced lunch eligibility requirement: annual household income below 185% of poverty, which currently is $35,317 for a family of three.
CH
IL
D I
ND
IC
AT
OR
S
Prepared by the Community Service Council
Juvenile Arrests, by Type of CrimeBryan County, 2001 through 2010
Source: Oklahoma State Bureau of Investigation, Uniform Crime Reports.
Index crimes Drug related Alcohol related Other crimes0
20
40
60
80
100
120
140
160Number of arrests
2001 2002 2003 2004 2005 2006 2007 2008 2009 2010
A total of 96 juvenile arrests were made in Bryan County in 2010, for a rate of 22.0 per 1,000 juveniles age 10-17, down from 240 arrests for a
rate of 57.5 in 2001.
Includes murder, rape, robbery aggravated
assault, burglary, larceny, and motor vehicle theft.
Includes sale/manufacturing
and possession of drugs.
Includes driving under the influence, liquor law violations, and
drunkenness.
Includes other assaults, disorderly conduct, curfew & loitering, runaway and all other non-traffic offenses
CH
IL
D I
ND
IC
AT
OR
S

Prepared by the Community Service Council
Juvenile Arrests, by Type of CrimeCarter County, 2001 through 2010
Source: Oklahoma State Bureau of Investigation, Uniform Crime Reports.
Index crimes Drug related Alcohol related Other crimes0
50
100
150
200
250
300Number of arrests
2001 2002 2003 2004 2005 2006 2007 2008 2009 2010
A total of 235 juvenile arrests were made in Carter County in 2010, for a rate of 42.8 per 1,000 juveniles age 10-17, down from 388 arrests for a
rate of 73.2 in 2001.
Includes murder, rape, robbery aggravated
assault, burglary, larceny, and motor vehicle theft.
Includes sale/manufacturing
and possession of drugs.
Includes driving under the influence, liquor law violations, and
drunkenness.
Includes other assaults, disorderly conduct, curfew & loitering, runaway and all other non-traffic offenses
CH
IL
D I
ND
IC
AT
OR
S
Prepared by the Community Service Council
Juvenile Arrests, by Type of CrimeCoal County, 2001 through 2010
Source: Oklahoma State Bureau of Investigation, Uniform Crime Reports.
Index crimes Drug related Alcohol related Other crimes0
5
10
15
20
25
30
35
40Number of arrests
2001 2002 2003 2004 2005 2006 2007 2008 2009 2010
A total of 5 juvenile arrests were made in Coal County in 2010, for a rate of 7.0 per 1,000 juveniles age
10-17, up from 3 arrests for a rate of 4.1 in 2001.
Includes murder, rape, robbery aggravated
assault, burglary, larceny, and motor vehicle theft.
Includes sale/manufacturing
and possession of drugs.
Includes driving under the influence, liquor law violations, and
drunkenness.
Includes other assaults, disorderly conduct, curfew & loitering, runaway and all other non-traffic offenses
CH
IL
D I
ND
IC
AT
OR
S

Prepared by the Community Service Council
Juvenile Arrests, by Type of CrimeLove County, 2001 through 2010
Source: Oklahoma State Bureau of Investigation, Uniform Crime Reports.
Index crimes Drug related Alcohol related Other crimes0
5
10
15
20Number of arrests
2001 2002 2003 2004 2005 2006 2007 2008 2009 2010
A total of 5 juvenile arrests were made in Love County in 2010, for a rate of 1.1 per 1,000 juveniles age
10-17, down from 21 arrests for a rate of 19.8 in 2001.
Includes murder, rape, robbery aggravated
assault, burglary, larceny, and motor vehicle theft.
Includes sale/manufacturing
and possession of drugs.
Includes driving under the influence, liquor law violations, and
drunkenness.
Includes other assaults, disorderly conduct, curfew & loitering, runaway and all other non-traffic offenses
CH
IL
D I
ND
IC
AT
OR
S
Prepared by the Community Service Council
Juvenile Arrests, by Type of CrimePontotoc County, 2001 through 2010
Source: Oklahoma State Bureau of Investigation, Uniform Crime Reports.
Index crimes Drug related Alcohol related Other crimes0
20
40
60
80
100
120
140
160
180Number of arrests
2001 2002 2003 2004 2005 2006 2007 2008 2009 2010
A total of 236 juvenile arrests were made in Pontotoc County in 2010, for a rate of 63.4 per 1,000 juveniles age 10-17, up from 189 arrests for a rate
of 45.5 in 2001.
Includes murder, rape, robbery aggravated
assault, burglary, larceny, and motor vehicle theft.
Includes sale/manufacturing
and possession of drugs.
Includes driving under the influence, liquor law violations, and
drunkenness.
Includes other assaults, disorderly conduct, curfew & loitering, runaway and all other non-traffic offenses
CH
IL
D I
ND
IC
AT
OR
S

Prepared by the Community Service Council
Source: Centers for Disease Control, Youth Risk Behavior Surveillance System; Oklahoma State Department of Health, OK2SHARE.
47.8%
22%
9.9%
22.2%
26.5%
17.5%
30.6%
40.5%
18.7%
7.1%
18.4%
28.6%
12.3%
25.8%
43.1%
15.9%
5.5%
19.1%
23.2%
13.3%
26.8%
39%
17.2%
4.8%
16.8%
22.6%
11%
23.1%
44.7%
19.7%
4.4%
22.3%
20%
10.5%
29.1%
Alcohol
Marijuana
Methamphetamine
Offered/sold/givenillegal drugs at school
Smoked cigarettesduring past month
Drove after drinkingalcohol in past month
Rode with drinkingdriver in past month
0% 20%40%60%80%100%
2003 Oklahoma
2005 Oklahoma
2007 Oklahoma
2009 Oklahoma
2007 US
Youth Risk Behavior Survey:Summary of Alcohol, Other Drug & Tobacco Use
High School Students, Oklahoma, 2003 through 2009, and U.S., 2007
Used once or more during past 30 days...
Ever used...
Note: National 2009 YRBSS data have not yet been released.
CH
IL
D I
ND
IC
AT
OR
S

Prepared by the Community Service Council
Source: Centers for Disease Control, Youth Risk Behavior Surveillance System; Oklahoma State Department of Health, OK2SHARE.
50%
5.8%
64.3%
17.7%
7%
14.2%
49.3%
6.5%
61.7%
16.4%
7.9%
15.9%
38.2%
50.9%
5.8%
59.6%
16.7%
5.9%
15.2%
49.6%
51.1%
4.7%
56.7%
22.7%
7%
16.4%
47.4%
47.8%
7.1%
61.5%
16%
6.9%
15.8%
34.7%
Ever hadsexual intercourse
Had sex before age 13
Used condom last time
Used birth controlpills last time
Attempted suicidein past year
Overweight(according to BMI)
Physical activity for60 min/day 5 of past 7 days
0% 20% 40% 60% 80% 100%
2003 Oklahoma
2005 Oklahoma
2007 Oklahoma
2009 Oklahoma
2007 US
Youth Risk Behavior Survey:Summary of Sexual Behaviors, Suicide & Physical Health
High School Students, Oklahoma, 2003 through 2009, and U.S., 2007
Note: National 2009 YRBSS data have not yet been released.
na
CH
IL
D I
ND
IC
AT
OR
S

Prepared by the Community Service Council
ADVERSE CHILDHOOD EXPERIENCESCOUNTY RANKINGS
Rankings: 1 = best, 77 = worst*Indicates a tie with at least one other county
Source: Oklahoma KIDS COUNT Factbook, 2006-2007, Oklahoma Institute for Child Advocacy
Bryan Carter Coal Love Pontotoc
Parental separation or divorce 71 25 74 48 38
Incarcerated household member 70 74 37 27 58
Mentally ill household member 43* 43* 43* 43* 43*
Substance abusing household member
11* 11* 11* 11* 11*
Violence against mother
51 1 72 5 31
Psychological, physical & sexual abuse
62 54 77 52 42
Emotional & physical neglect 66 63 77 49 56
Overall ranking 72 59 77 47 55
CH
IL
D I
ND
IC
AT
OR
S
HEALTH INDICATORS
Prepared by the Community Service Council
Health StatusOklahoma and United States, 1996 - 2011
Source: United Health Foundation, “America’s Health Rankings.“
'96 '97 '98 '99 '00 '01 '02 '03 '04 '05 '06 '07 '08 '09 '10 '110%
5%
10%
15%
20%
25%Percent adults reporting fair or poor health
0
10
20
30
40
50State rank
Rank Oklahoma US
Rank 26 32 28 25 42 34 45 41 41 44 42 46 43 42 42 45
Oklahoma 13.1% 14% 13.4% 12.6% 17.4% 15.3% 19.6% 17.7% 17.8% 19.7% 18.7% 20.2% 19.2% 18.7% 19.6% 20.5%
US 12.9% 12.9% 12.8% 12.6% 13% 13.9% 14% 14.7% 14.7% 14.9% 14.8% 14.7% 14.9% 14.4% 14.5% 14.7%
HE
AL
TH
IN
DIC
AT
OR
S
Prepared by the Community Service Council
Prevalence of ObesityOklahoma and United States, 1990 - 2011
Source: United Health Foundation, “America’s Health Rankings.“
'90 '91 '92 '93 '94 '95 '96 '97 '98 '99 '00 '01 '02 '03 '04 '05 '06 '07 '08 '09 '10 '110%
5%
10%
15%
20%
25%
30%
35%Percent of population estimated to be obese
0
10
20
30
40
50State rank
Rank Oklahoma US
Rank 23 23 22 37 14 14 12 27 14 35 37 22 38 29 37 37 38 44 43 46 46 40
Oklahoma 11.6% 11.6% 11.9% 14.1% 12.1% 13.2% 13.5% 16.8% 15.1% 19.5% 21.1% 19.7% 22.6% 22.9% 24.4% 24.9% 26.8% 28.8% 28.8% 30.9% 32% 31.3%
US 11.6% 11.6% 12.6% 12.6% 13.7% 14.4% 15.9% 16.8% 16.5% 18.3% 19.6% 20% 20.9% 21.9% 22.9% 23.2% 24.4% 25.1% 26.3% 26.7% 26.9% 27.5%
HE
AL
TH
IN
DIC
AT
OR
S

Prepared by the Community Service Council
Prevalence of SmokingOklahoma and United States, 1990 - 2011
Source: United Health Foundation, “America’s Health Rankings.“
'90 '91 '92 '93 '94 '95 '96 '97 '98 '99 '00 '01 '02 '03 '04 '05 '06 '07 '08 '09 '10 '110%
5%
10%
15%
20%
25%
30%
35%Percent of population over 18 that smoke regularly
0
10
20
30
40
50
60State rank
Rank Oklahoma US
Rank 44 42 42 40 37 45 15 28 36 32 41 27 49 42 36 47 46 47 48 46 48 48
Oklahoma 33% 28.7% 28.7% 26.6% 25% 26.1% 21.7% 24.1% 24.6% 23.9% 25.2% 23.3% 28.7% 26.6% 25.1% 26.1% 25.1% 25.1% 25.8% 24.7% 25.5% 23.7%
US 29.5% 25.2% 25.2% 22.7% 23% 22.2% 22.7% 23.5% 23.2% 22.9% 22.8% 23.2% 23.2% 23.2% 22% 20.9% 20.6% 20.1% 19.8% 18.3% 17.9% 17.3%
HE
AL
TH
IN
DIC
AT
OR
S

Prepared by the Community Service Council
Oklahoma's Rankings in Health Determinants, 2011 (part 1)According to United Health Foundation's State Health Rankings
Source: United Health Foundation, “America’s Health Rankings.“
#48
#12
#40
#21
#39
#44
#10
#42
#29
Personal Behaviors
Prevalence of smoking
Prevalence of Binge Drinking
Prevalence of obesity
Community & Environment
High school graduation
Violent crime
Occupational fatalities
Infectious disease
Children in poverty
Air pollution
#0 #10 #20 #30 #40 #50
1991 2011
Ranking: 1=best, 50=worst
HE
AL
TH
IN
DIC
AT
OR
S

Prepared by the Community Service Council
Oklahoma's Rankings in Health Determinants, 2011 (part 2)According to United Health Foundation's State Health Rankings
Source: United Health Foundation, “America’s Health Rankings.“
#39
#11
#46
#47
#49
#44
#47
Public & Health Policies
Lack of health insurance
Public health funding (per capita)
Immunization coverage
Clinical Care
Early prenatal care
Primary Care Physicians
Preventable Hospitalizations
All Determinants
#0 #10 #20 #30 #40 #50
1991 2011
Ranking: 1=best, 50=worst
HE
AL
TH
IN
DIC
AT
OR
S

Prepared by the Community Service Council
Oklahoma's Rankings in Health Outcomes, 2011According to United Health Foundation's State Health Rankings
Source: United Health Foundation, “America’s Health Rankings.“
#48
#46
#19
#41
#48
#42
#47
#46
Poor mental health days
Poor physical health days
Geographic disparity
Infant mortality
Cardiovascular deaths
Cancer deaths
Premature death
All Health Outcomes
#0 #10 #20 #30 #40 #50
1991 2011
Ranking: 1=best, 50=worst
Oklahoma’s overall health ranking for 2011 is # 48
HE
AL
TH
IN
DIC
AT
OR
S

Prepared by the Community Service Council
Health Insurance Status, by AgeOklahoma, 2009-10
Source: Kaiser Family Foundation, StateHealthFacts.org; Oklahoma Health Care Authority, Oklahoma County Chartbook, May 2009.
1,707,200(47.0%)
133,500(3.7%)
569,800(15.7%)
505,400(13.9%)
80,100(2.2%)
638,500(17.6%)
423,100(43.9%)
32,400(3.4%)
383,700(39.8%)
124,300(12.9%)
1,291,800(60.1%)
97,600(4.5%)
142,500(6.6%)
106,600(5.0%)
511,900(23.8%)
Employer Individual Medicaid Medicare Other public Uninsured
Total Population Under Age 19 Age 19-64
Estimated uninsured non-elderly population, 2008 (Oklahoma Health Care Authority, May 2009):
~ Bryan County: 18.8%~ Carter County: 20.7%~ Coal County: 25.8%~ Love County: 16.6%
~ Pontotoc County: 20.6%
HE
AL
TH
IN
DIC
AT
OR
S
…IN SUMMARY
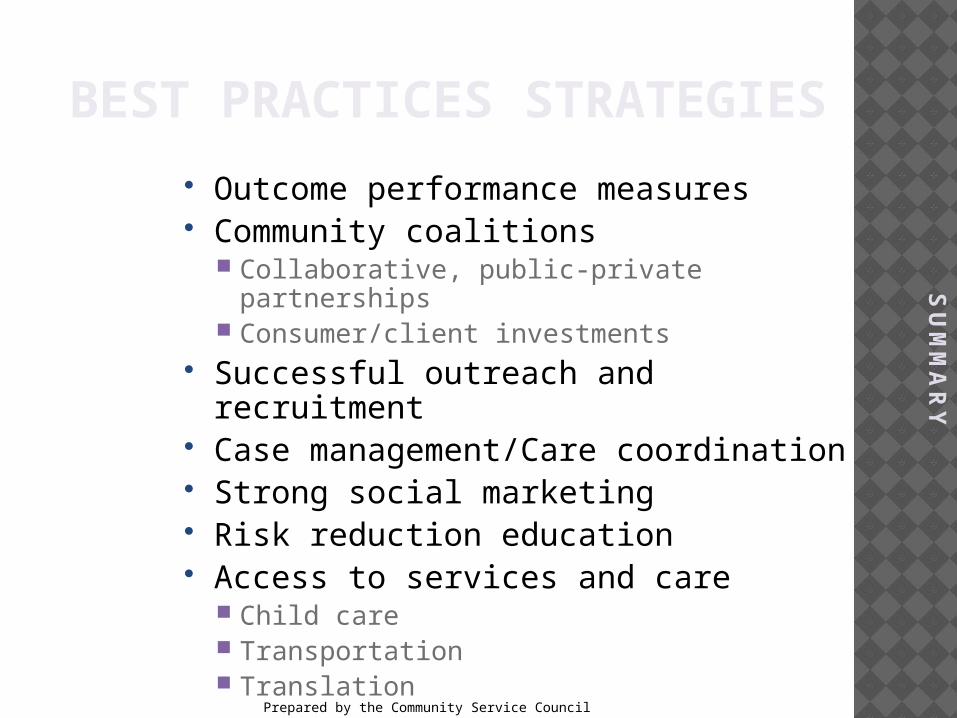
Prepared by the Community Service Council
BEST PRACTICES STRATEGIES
Outcome performance measures Community coalitions
Collaborative, public-private partnerships Consumer/client investments
Successful outreach and recruitment Case management/Care coordination Strong social marketing Risk reduction education Access to services and care
Child care Transportation Translation
SU
MM
AR
Y
COMMUNITY PROFILE 2012EARLY CHILDHOOD INDICATORS OF BRYAN, CARTER, COAL, LOVE AND PONTOTOC COUNTIESPrepared by the Community Service Council of Greater Tulsa
June 2012
…is available on our website:www.csctulsa.org