Survey of Canadian Community Pharmacists: Use of Digital ... · Commissioned by Survey of Canadian...
27
Commissioned by Survey of Canadian Community Pharmacists: Use of Digital Health Technologies in Practice August 2014 Final Report
Transcript of Survey of Canadian Community Pharmacists: Use of Digital ... · Commissioned by Survey of Canadian...
Commissioned by
Survey of Canadian Community Pharmacists: Use of Digital Health Technologies in Practice
August 2014
Final Report
Background and Methodology
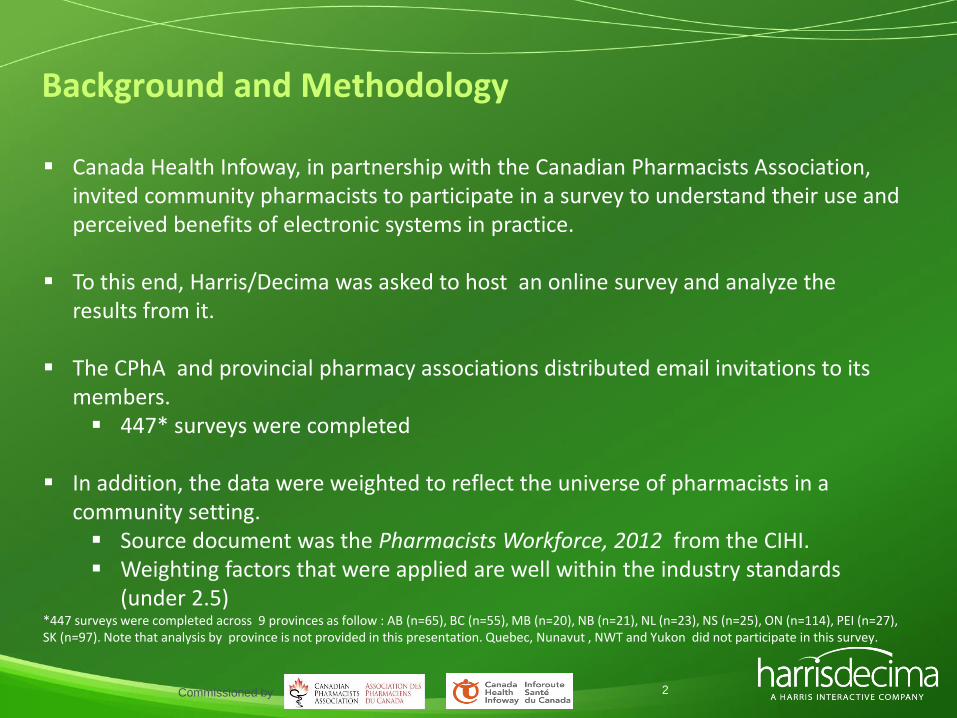
Canada Health Infoway, in partnership with the Canadian Pharmacists Association,
invited community pharmacists to participate in a survey to understand their use and perceived benefits of electronic systems in practice.
To this end, Harris/Decima was asked to host an online survey and analyze the results from it.
The CPhA and provincial pharmacy associations distributed email invitations to its members. 447* surveys were completed
In addition, the data were weighted to reflect the universe of pharmacists in a community setting. Source document was the Pharmacists Workforce, 2012 from the CIHI. Weighting factors that were applied are well within the industry standards
(under 2.5) *447 surveys were completed across 9 provinces as follow : AB (n=65), BC (n=55), MB (n=20), NB (n=21), NL (n=23), NS (n=25), ON (n=114), PEI (n=27), SK (n=97). Note that analysis by province is not provided in this presentation. Quebec, Nunavut , NWT and Yukon did not participate in this survey.
2 Commissioned by

Respondent Profile
Commissioned by :
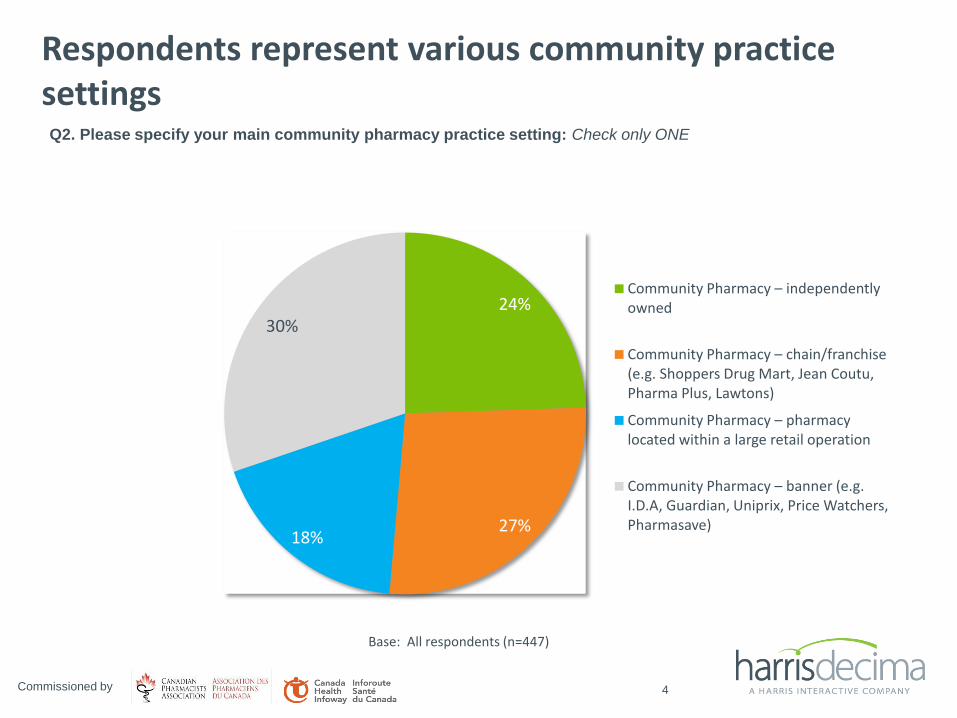
24%
27% 18%
30%
Community Pharmacy – independently owned
Community Pharmacy – chain/franchise (e.g. Shoppers Drug Mart, Jean Coutu, Pharma Plus, Lawtons)
Community Pharmacy – pharmacy located within a large retail operation
Community Pharmacy – banner (e.g. I.D.A, Guardian, Uniprix, Price Watchers, Pharmasave)
Q2. Please specify your main community pharmacy practice setting: Check only ONE
Base: All respondents (n=447)
Respondents represent various community practice settings
4 Commissioned by
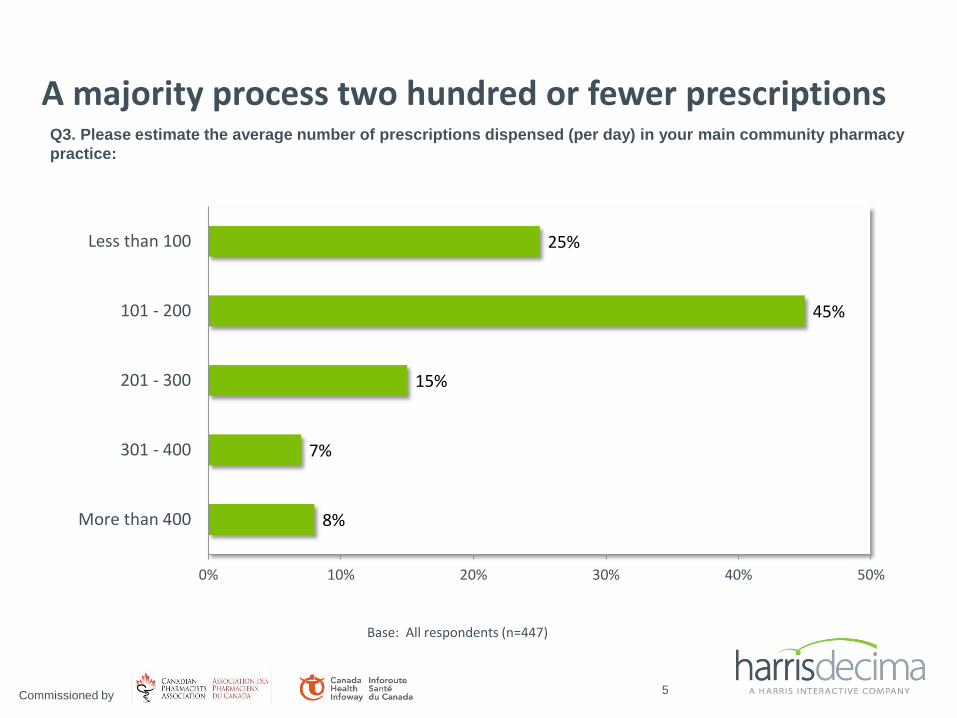
8%
7%
15%
45%
25%
0% 10% 20% 30% 40% 50%
More than 400
301 - 400
201 - 300
101 - 200
Less than 100
Q3. Please estimate the average number of prescriptions dispensed (per day) in your main community pharmacy
practice:
A majority process two hundred or fewer prescriptions
5
Base: All respondents (n=447)
Commissioned by
Current State of Electronic System Use
Commissioned by
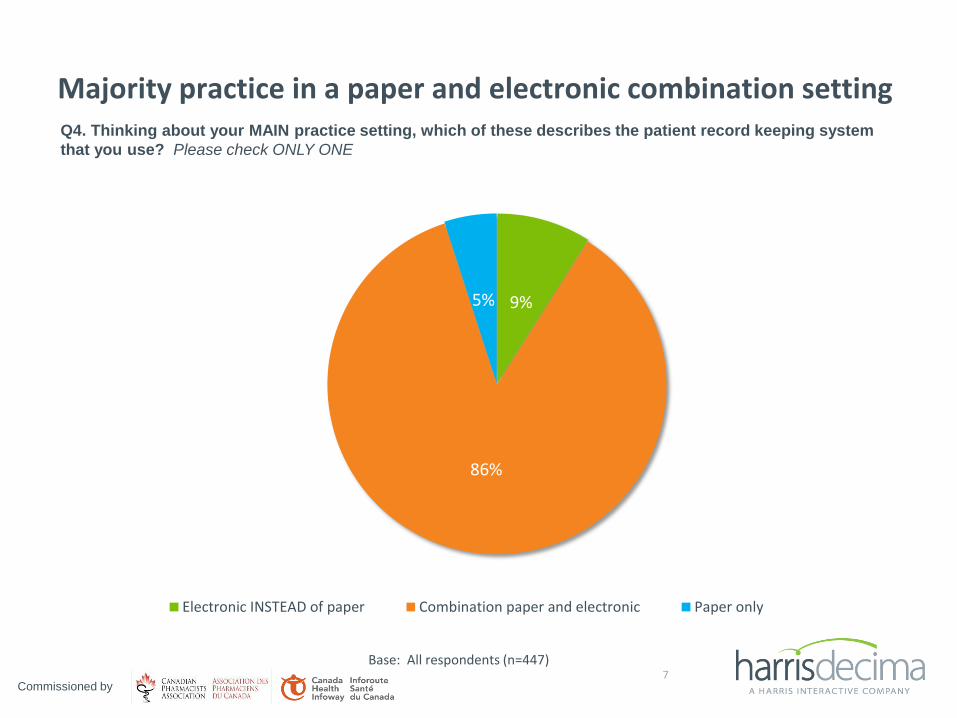
Majority practice in a paper and electronic combination setting
7
9%
86%
5%
Electronic INSTEAD of paper Combination paper and electronic Paper only
Q4. Thinking about your MAIN practice setting, which of these describes the patient record keeping system
that you use? Please check ONLY ONE
Base: All respondents (n=447)
Commissioned by
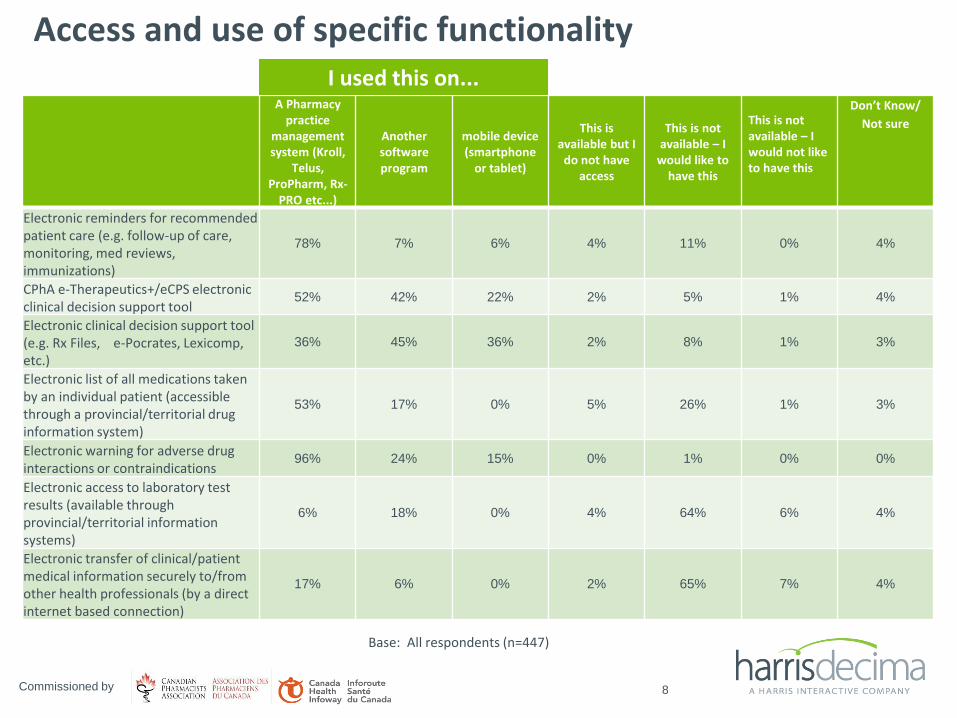
Access and use of specific functionality
A Pharmacy practice
management system (Kroll,
Telus, ProPharm, Rx-
PRO etc...)
Another software program
mobile device (smartphone
or tablet)
This is available but I
do not have access
This is not available – I
would like to have this
This is not available – I would not like to have this
Don’t Know/
Not sure
Electronic reminders for recommended patient care (e.g. follow-up of care, monitoring, med reviews, immunizations)
78% 7% 6% 4% 11% 0% 4%
CPhA e-Therapeutics+/eCPS electronic clinical decision support tool
52% 42% 22% 2% 5% 1% 4%
Electronic clinical decision support tool (e.g. Rx Files, e-Pocrates, Lexicomp, etc.)
36% 45% 36% 2% 8% 1% 3%
Electronic list of all medications taken by an individual patient (accessible through a provincial/territorial drug information system)
53% 17% 0% 5% 26% 1% 3%
Electronic warning for adverse drug interactions or contraindications
96% 24% 15% 0% 1% 0% 0%
Electronic access to laboratory test results (available through provincial/territorial information systems)
6% 18% 0% 4% 64% 6% 4%
Electronic transfer of clinical/patient medical information securely to/from other health professionals (by a direct internet based connection)
17% 6% 0% 2% 65% 7% 4%
8
Base: All respondents (n=447)
Commissioned by
I used this on...
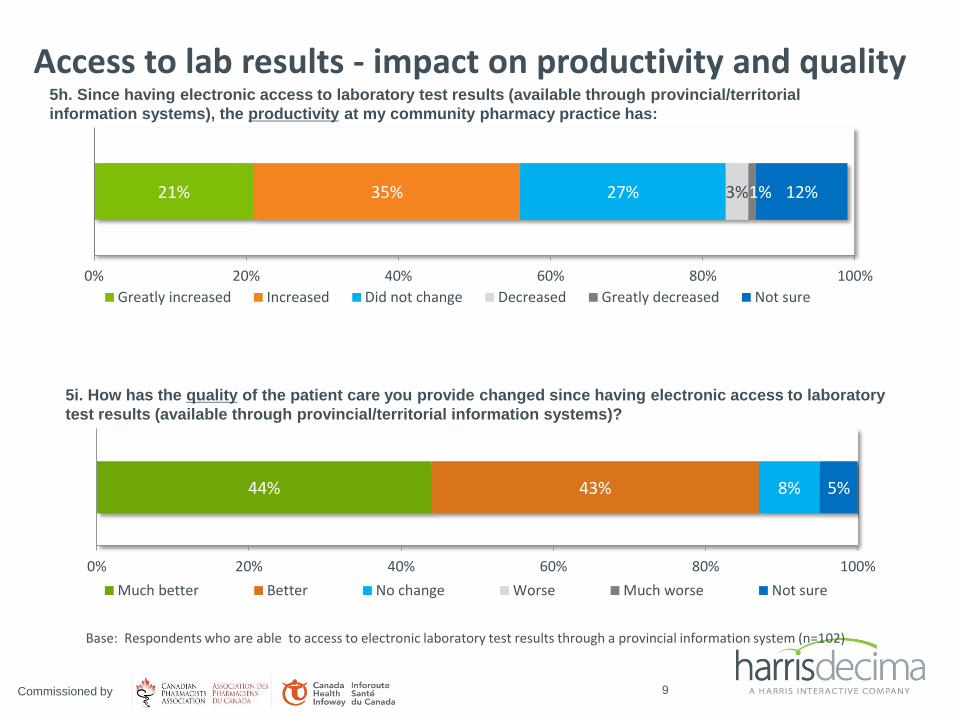
21% 35% 27% 3% 1% 12%
0% 20% 40% 60% 80% 100%
Greatly increased Increased Did not change Decreased Greatly decreased Not sure
5h. Since having electronic access to laboratory test results (available through provincial/territorial
information systems), the productivity at my community pharmacy practice has:
Access to lab results - impact on productivity and quality
9
Base: Respondents who are able to access to electronic laboratory test results through a provincial information system (n=102)
44% 43% 8% 5%
0% 20% 40% 60% 80% 100%
Much better Better No change Worse Much worse Not sure
5i. How has the quality of the patient care you provide changed since having electronic access to laboratory
test results (available through provincial/territorial information systems)?
Commissioned by
Drug Information Systems (DIS) The analysis presented on DIS in the following slides includes only those provinces with fully implemented DIS systems: Alberta, British Columbia, Manitoba, Prince Edward Island, and Saskatchewan (n=192). In questions where we wanted to compare the difference and impact on pharmacy practice following the availability of a provincial DIS, only respondents who had previously practiced in a non-provincial DIS environment were included (n=107).
Commissioned by
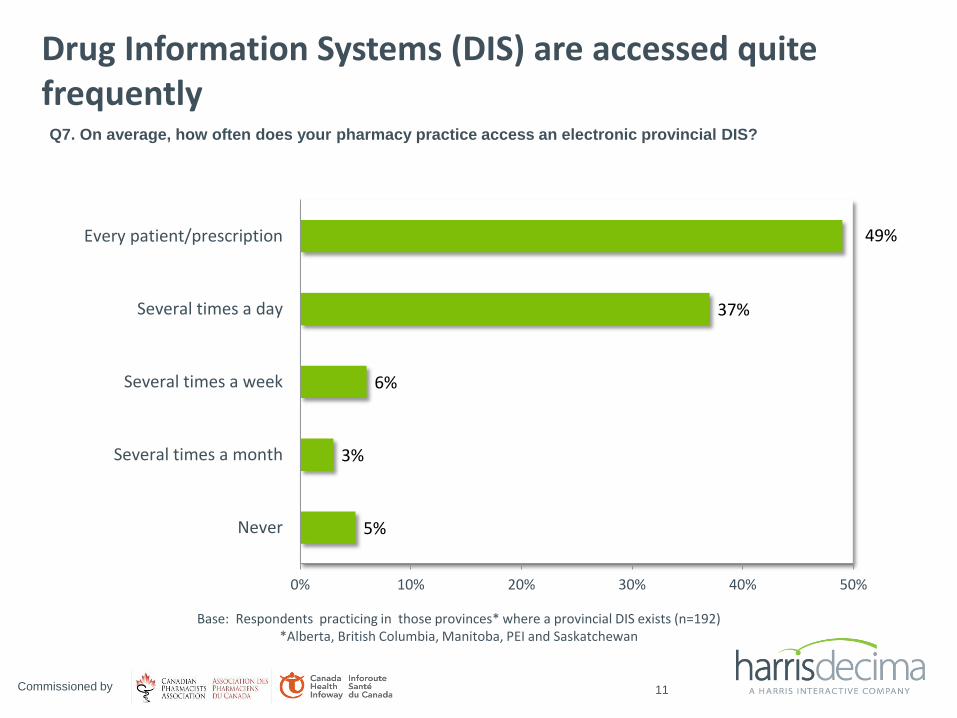
49%
37%
6%
3%
5%
0% 10% 20% 30% 40% 50%
Every patient/prescription
Several times a day
Several times a week
Several times a month
Never
Q7. On average, how often does your pharmacy practice access an electronic provincial DIS?
Drug Information Systems (DIS) are accessed quite frequently
11
Base: Respondents practicing in those provinces* where a provincial DIS exists (n=192) *Alberta, British Columbia, Manitoba, PEI and Saskatchewan
Commissioned by
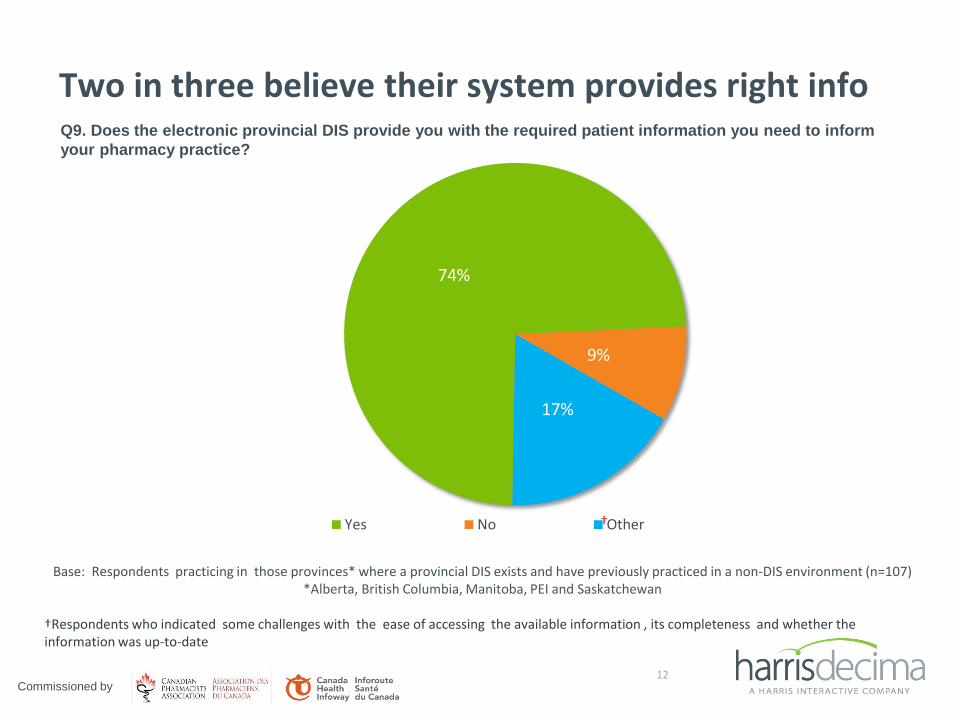
Two in three believe their system provides right info
12
74%
9%
17%
Yes No Other†
Q9. Does the electronic provincial DIS provide you with the required patient information you need to inform
your pharmacy practice?
Base: Respondents practicing in those provinces* where a provincial DIS exists and have previously practiced in a non-DIS environment (n=107) *Alberta, British Columbia, Manitoba, PEI and Saskatchewan
†Respondents who indicated some challenges with the ease of accessing the available information , its completeness and whether the information was up-to-date
Commissioned by
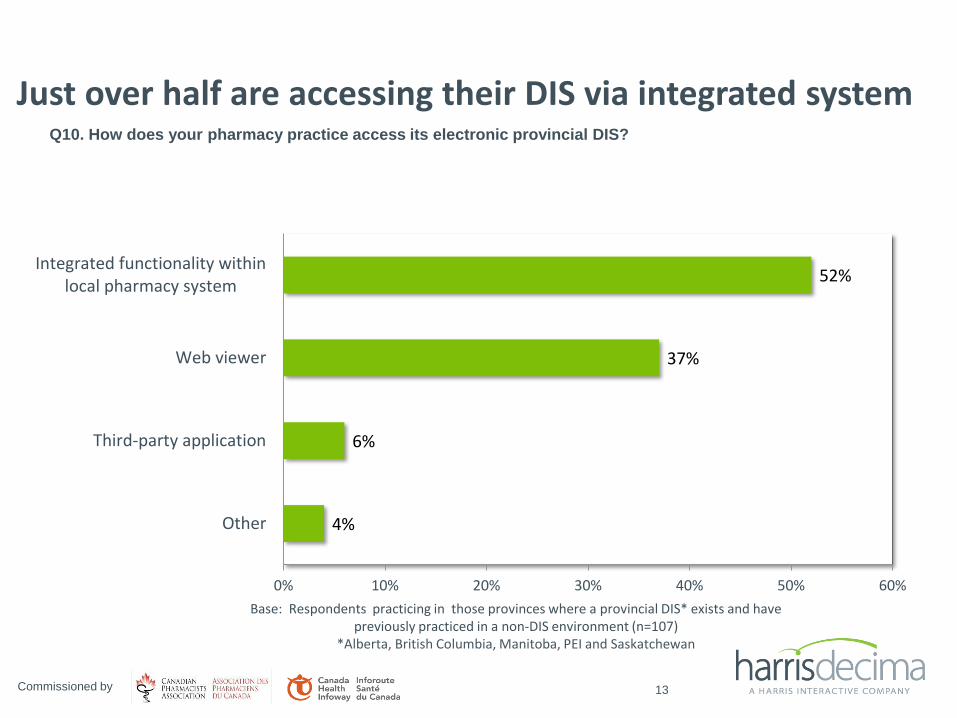
52%
37%
6%
4%
0% 10% 20% 30% 40% 50% 60%
Integrated functionality withinlocal pharmacy system
Web viewer
Third-party application
Other
Q10. How does your pharmacy practice access its electronic provincial DIS?
Just over half are accessing their DIS via integrated system
13
Base: Respondents practicing in those provinces where a provincial DIS* exists and have previously practiced in a non-DIS environment (n=107)
*Alberta, British Columbia, Manitoba, PEI and Saskatchewan
Commissioned by
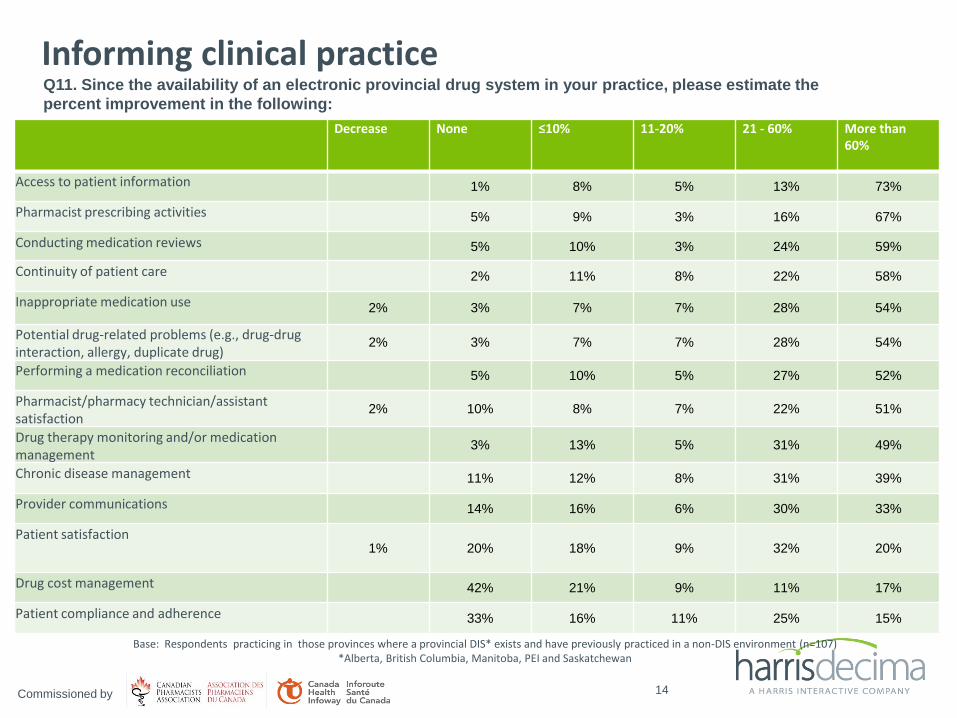
Informing clinical practice
Decrease None ≤10% 11-20% 21 - 60% More than 60%
Access to patient information 1% 8% 5% 13% 73%
Pharmacist prescribing activities 5% 9% 3% 16% 67%
Conducting medication reviews 5% 10% 3% 24% 59%
Continuity of patient care 2% 11% 8% 22% 58%
Inappropriate medication use 2% 3% 7% 7% 28% 54%
Potential drug-related problems (e.g., drug-drug interaction, allergy, duplicate drug)
2% 3% 7% 7% 28% 54%
Performing a medication reconciliation 5% 10% 5% 27% 52%
Pharmacist/pharmacy technician/assistant satisfaction
2% 10% 8% 7% 22% 51%
Drug therapy monitoring and/or medication management
3% 13% 5% 31% 49%
Chronic disease management 11% 12% 8% 31% 39%
Provider communications 14% 16% 6% 30% 33%
Patient satisfaction 1% 20% 18% 9% 32% 20%
Drug cost management 42% 21% 9% 11% 17%
Patient compliance and adherence 33% 16% 11% 25% 15%
14
Base: Respondents practicing in those provinces where a provincial DIS* exists and have previously practiced in a non-DIS environment (n=107) *Alberta, British Columbia, Manitoba, PEI and Saskatchewan
Q11. Since the availability of an electronic provincial drug system in your practice, please estimate the
percent improvement in the following:
Commissioned by
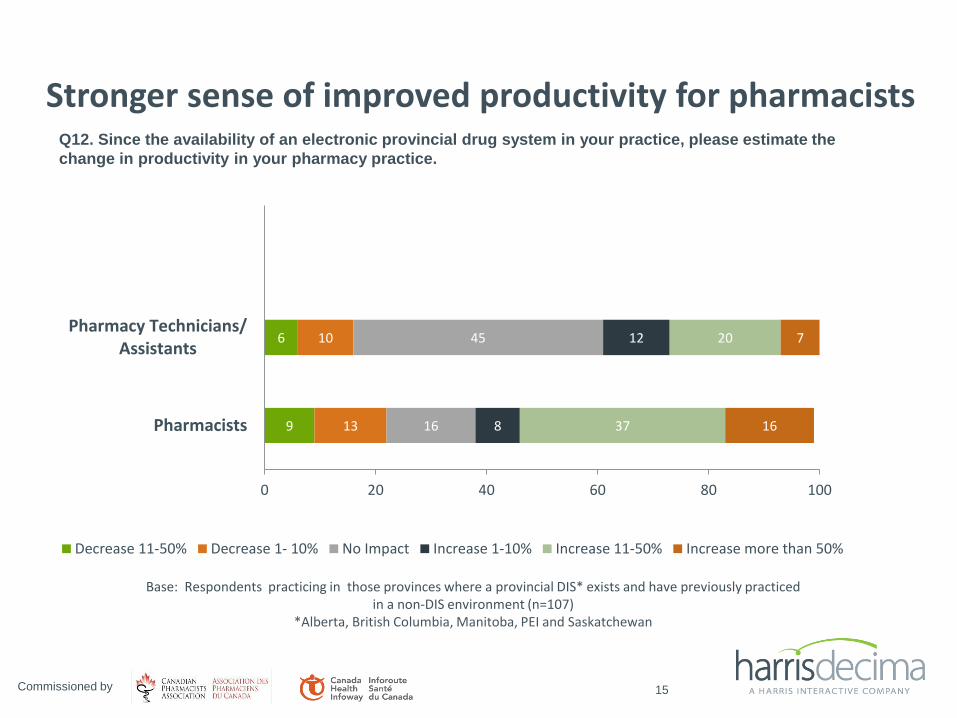
Stronger sense of improved productivity for pharmacists
15
Q12. Since the availability of an electronic provincial drug system in your practice, please estimate the
change in productivity in your pharmacy practice.
Base: Respondents practicing in those provinces where a provincial DIS* exists and have previously practiced in a non-DIS environment (n=107)
*Alberta, British Columbia, Manitoba, PEI and Saskatchewan
9
6
13
10
16
45
8
12
37
20
16
7
0 20 40 60 80 100
Pharmacists
Pharmacy Technicians/Assistants
Decrease 11-50% Decrease 1- 10% No Impact Increase 1-10% Increase 11-50% Increase more than 50%
Commissioned by
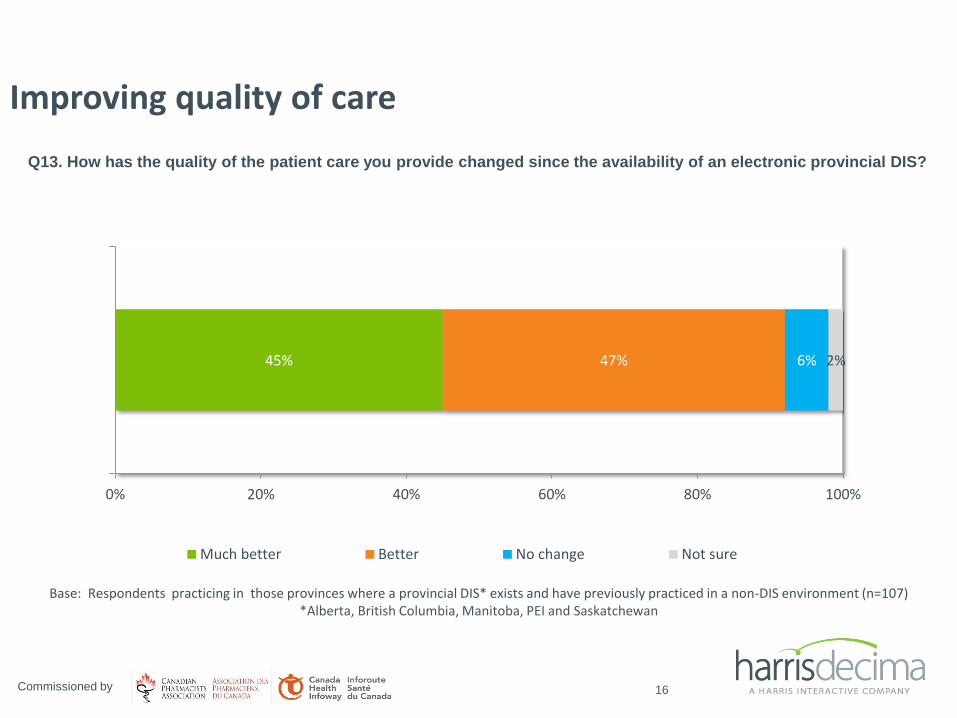
Improving quality of care
16
45% 47% 6% 2%
0% 20% 40% 60% 80% 100%
Much better Better No change Not sure
Q13. How has the quality of the patient care you provide changed since the availability of an electronic provincial DIS?
Base: Respondents practicing in those provinces where a provincial DIS* exists and have previously practiced in a non-DIS environment (n=107) *Alberta, British Columbia, Manitoba, PEI and Saskatchewan
Commissioned by
Electronic System Use in Prescribing Activities
Commissioned by
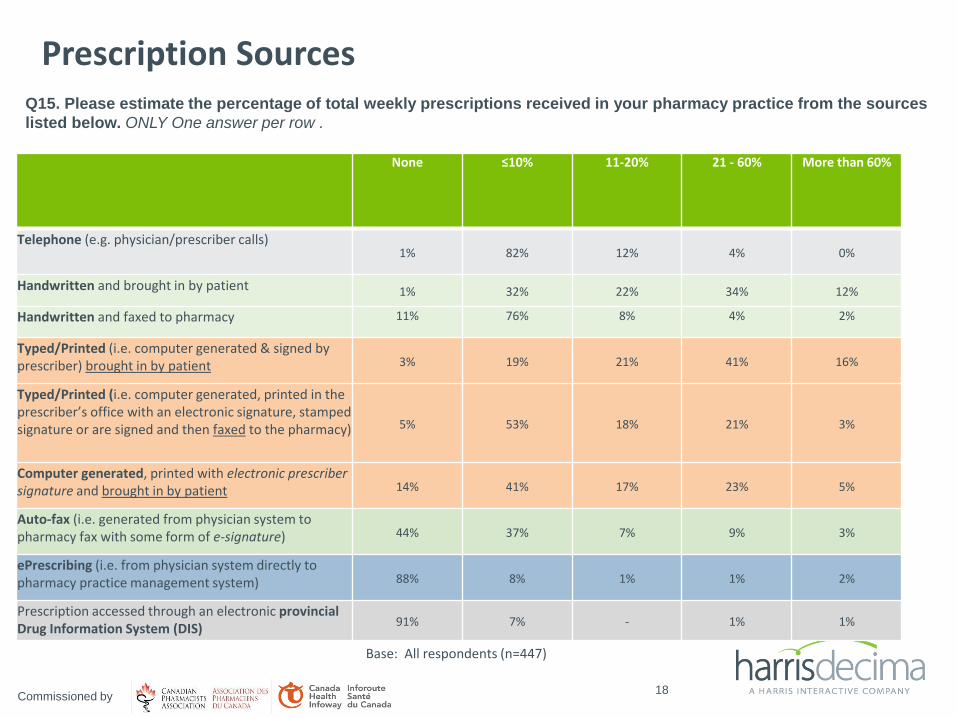
Prescription Sources
None ≤10% 11-20% 21 - 60% More than 60%
Telephone (e.g. physician/prescriber calls) 1% 82% 12% 4% 0%
Handwritten and brought in by patient 1% 32% 22% 34% 12%
Handwritten and faxed to pharmacy 11% 76% 8% 4% 2%
Typed/Printed (i.e. computer generated & signed by prescriber) brought in by patient 3% 19% 21% 41% 16%
Typed/Printed (i.e. computer generated, printed in the prescriber’s office with an electronic signature, stamped signature or are signed and then faxed to the pharmacy) 5% 53% 18% 21% 3%
Computer generated, printed with electronic prescriber signature and brought in by patient 14% 41% 17% 23% 5%
Auto-fax (i.e. generated from physician system to pharmacy fax with some form of e-signature) 44% 37% 7% 9% 3%
ePrescribing (i.e. from physician system directly to pharmacy practice management system) 88% 8% 1% 1% 2%
Prescription accessed through an electronic provincial Drug Information System (DIS)
91% 7% - 1% 1%
18
Q15. Please estimate the percentage of total weekly prescriptions received in your pharmacy practice from the sources
listed below. ONLY One answer per row .
Base: All respondents (n=447)
Commissioned by
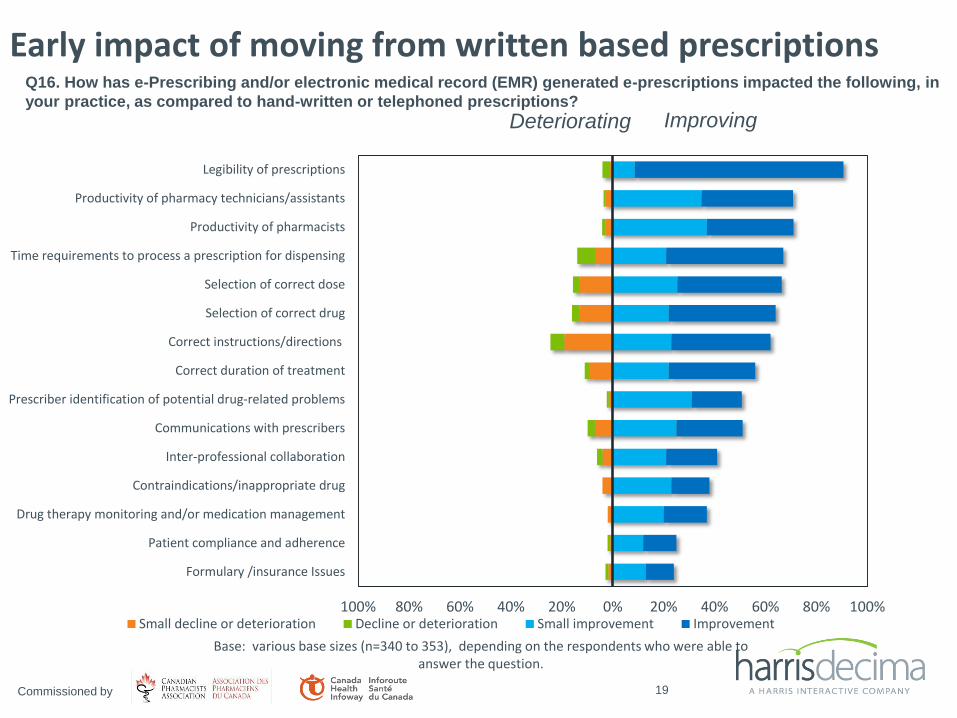
100% 80% 60% 40% 20% 0% 20% 40% 60% 80% 100%
Formulary /insurance Issues
Patient compliance and adherence
Drug therapy monitoring and/or medication management
Contraindications/inappropriate drug
Inter-professional collaboration
Communications with prescribers
Prescriber identification of potential drug-related problems
Correct duration of treatment
Correct instructions/directions
Selection of correct drug
Selection of correct dose
Time requirements to process a prescription for dispensing
Productivity of pharmacists
Productivity of pharmacy technicians/assistants
Legibility of prescriptions
Small decline or deterioration Decline or deterioration Small improvement Improvement
Deteriorating Improving
Early impact of moving from written based prescriptions
Base: various base sizes (n=340 to 353), depending on the respondents who were able to answer the question.
Q16. How has e-Prescribing and/or electronic medical record (EMR) generated e-prescriptions impacted the following, in
your practice, as compared to hand-written or telephoned prescriptions?
19 Commissioned by
8%
10%
12%
36%
12%
6%
8%
17%
22%
22%
30%
13%
14%
27%
28%
9%
22%
22%
12%
14%
21%
13%
12%
11%
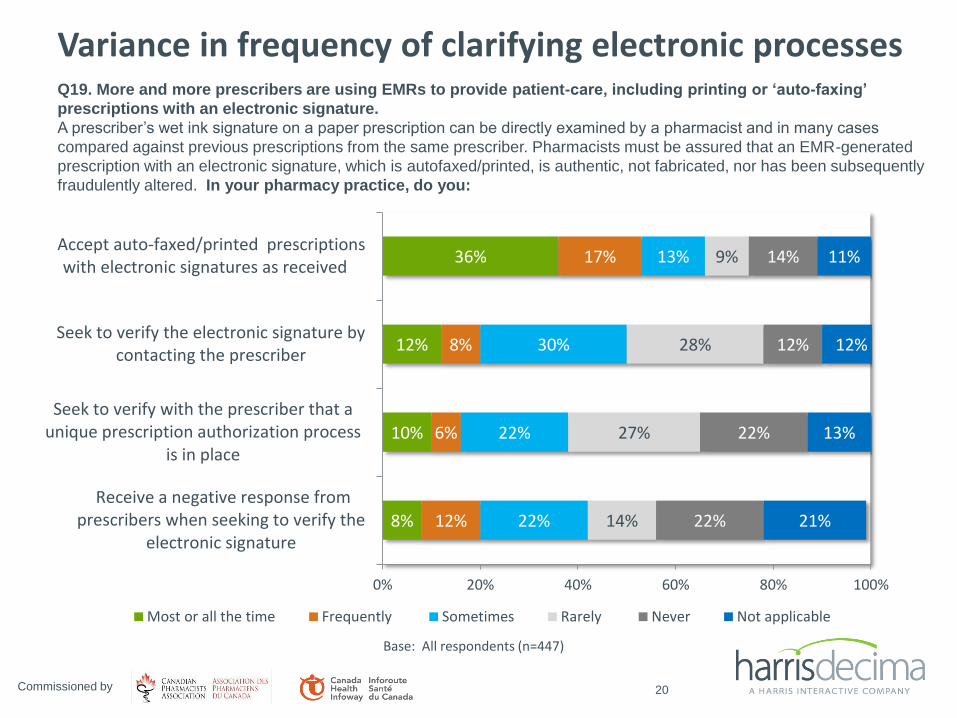
0% 20% 40% 60% 80% 100%
Receive a negative response fromprescribers when seeking to verify the
electronic signature
Seek to verify with the prescriber that aunique prescription authorization process
is in place
Seek to verify the electronic signature bycontacting the prescriber
Accept auto-faxed/printed prescriptionswith electronic signatures as received
Most or all the time Frequently Sometimes Rarely Never Not applicable
Variance in frequency of clarifying electronic processes
20
Q19. More and more prescribers are using EMRs to provide patient-care, including printing or ‘auto-faxing’
prescriptions with an electronic signature.
A prescriber’s wet ink signature on a paper prescription can be directly examined by a pharmacist and in many cases
compared against previous prescriptions from the same prescriber. Pharmacists must be assured that an EMR-generated
prescription with an electronic signature, which is autofaxed/printed, is authentic, not fabricated, nor has been subsequently
fraudulently altered. In your pharmacy practice, do you:
Base: All respondents (n=447)
Commissioned by
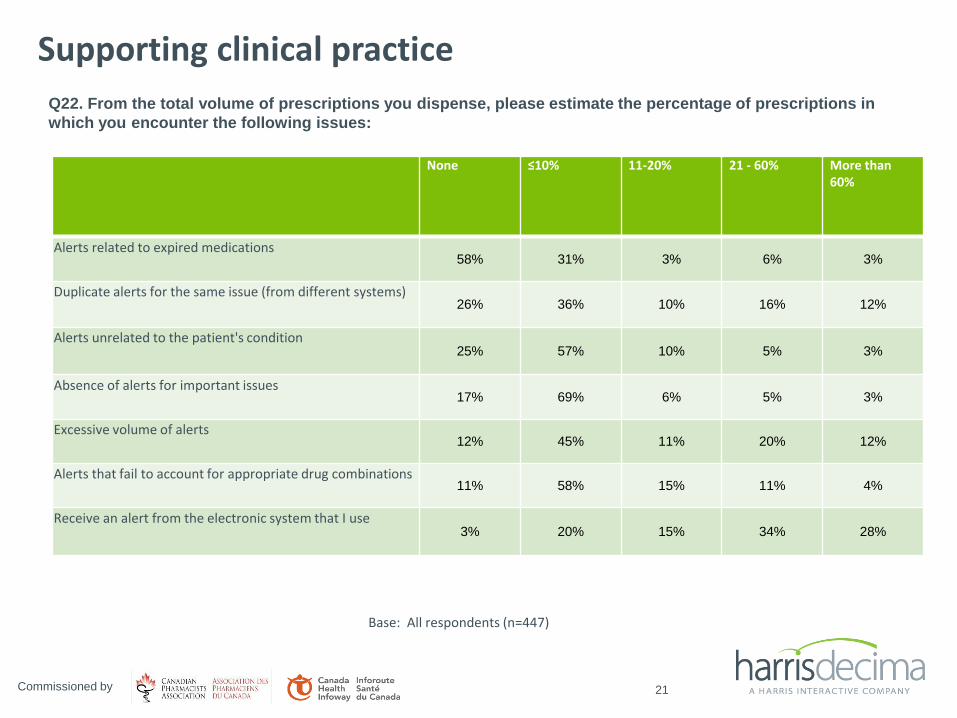
Supporting clinical practice
None ≤10% 11-20% 21 - 60% More than 60%
Alerts related to expired medications 58% 31% 3% 6% 3%
Duplicate alerts for the same issue (from different systems) 26% 36% 10% 16% 12%
Alerts unrelated to the patient's condition 25% 57% 10% 5% 3%
Absence of alerts for important issues 17% 69% 6% 5% 3%
Excessive volume of alerts 12% 45% 11% 20% 12%
Alerts that fail to account for appropriate drug combinations 11% 58% 15% 11% 4%
Receive an alert from the electronic system that I use 3% 20% 15% 34% 28%
21
Q22. From the total volume of prescriptions you dispense, please estimate the percentage of prescriptions in
which you encounter the following issues:
Base: All respondents (n=447)
Commissioned by
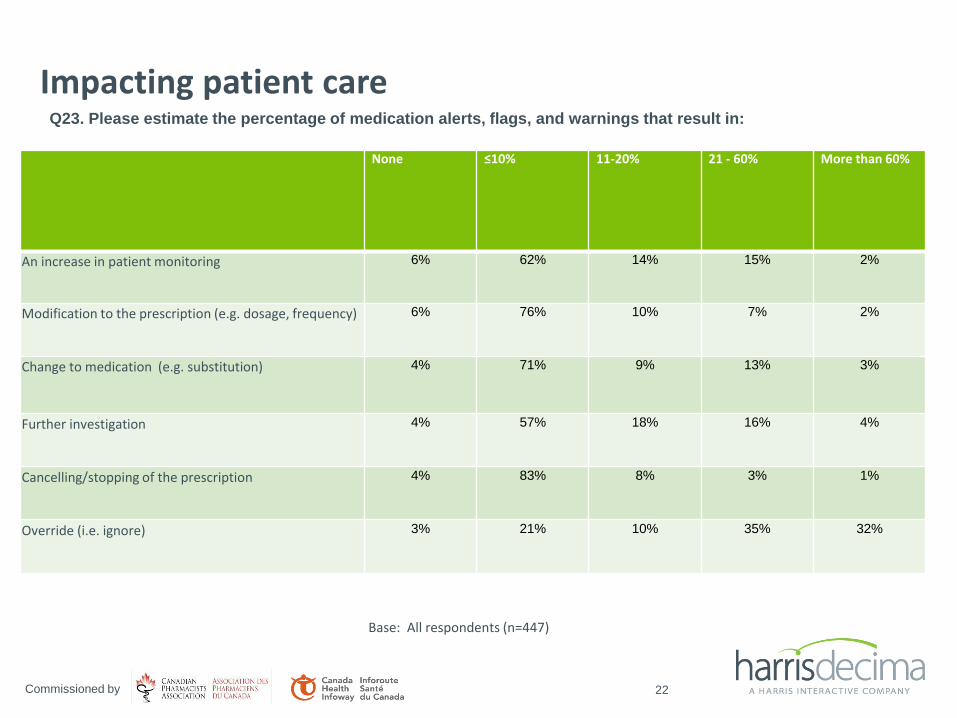
Impacting patient care
None ≤10% 11-20% 21 - 60% More than 60%
An increase in patient monitoring 6% 62% 14% 15% 2%
Modification to the prescription (e.g. dosage, frequency) 6% 76% 10% 7% 2%
Change to medication (e.g. substitution) 4% 71% 9% 13% 3%
Further investigation 4% 57% 18% 16% 4%
Cancelling/stopping of the prescription 4% 83% 8% 3% 1%
Override (i.e. ignore) 3% 21% 10% 35% 32%
22
Q23. Please estimate the percentage of medication alerts, flags, and warnings that result in:
Base: All respondents (n=447)
Commissioned by

Respondent Profile - Additional Details
Commissioned by
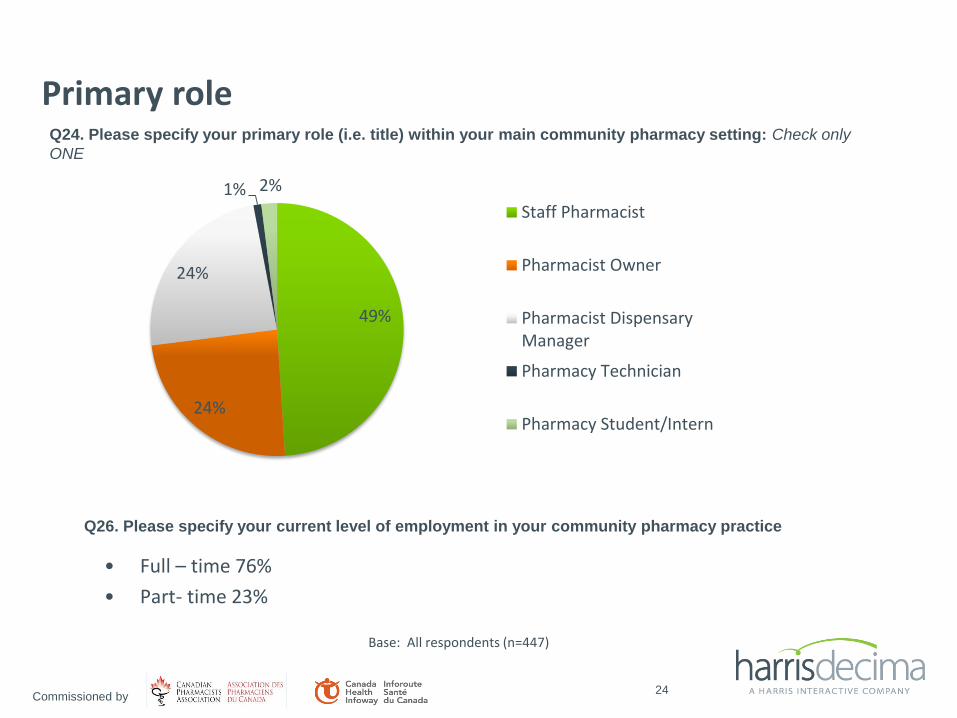
Q24. Please specify your primary role (i.e. title) within your main community pharmacy setting: Check only
ONE
Base: All respondents (n=447)
49%
24%
24%
1% 2%
Staff Pharmacist
Pharmacist Owner
Pharmacist DispensaryManager
Pharmacy Technician
Pharmacy Student/Intern
Q26. Please specify your current level of employment in your community pharmacy practice
• Full – time 76%
• Part- time 23%
24
Primary role
Commissioned by
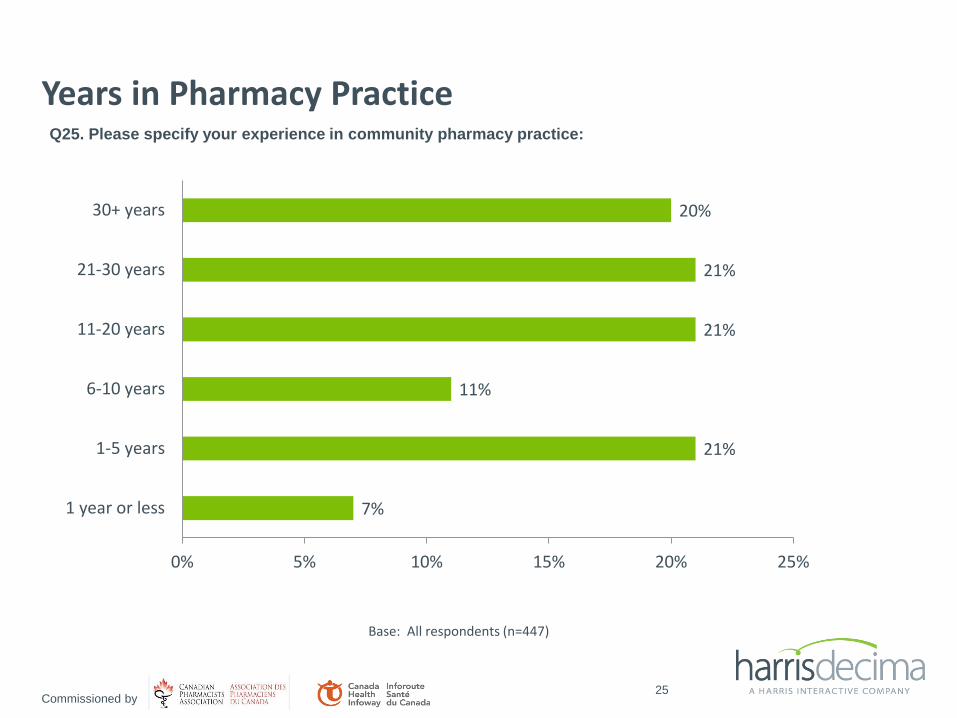
Q25. Please specify your experience in community pharmacy practice:
Base: All respondents (n=447)
Years in Pharmacy Practice
25
7%
21%
11%
21%
21%
20%
0% 5% 10% 15% 20% 25%
1 year or less
1-5 years
6-10 years
11-20 years
21-30 years
30+ years
Commissioned by
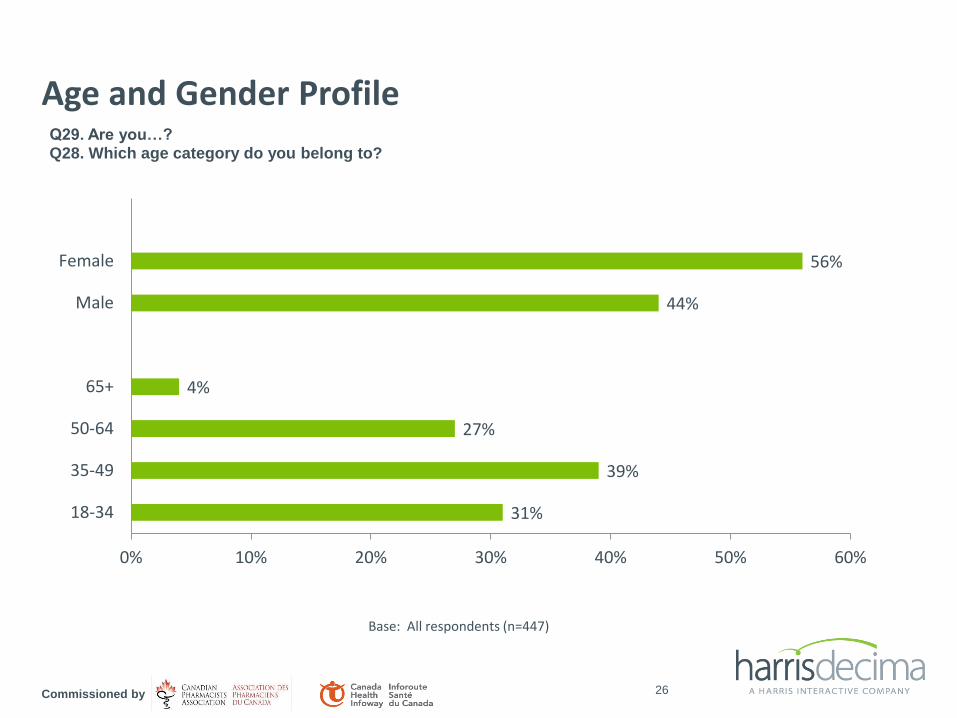
Q29. Are you…? Q28. Which age category do you belong to?
Base: All respondents (n=447)
31%
39%
27%
4%
44%
56%
0% 10% 20% 30% 40% 50% 60%
18-34
35-49
50-64
65+
Male
Female
26
Age and Gender Profile
Commissioned by

For more information: Megan Tam, Vice President
Tel: 613-751-5070
27 Commissioned by