Colostrum and Mature Human Milk of Women from London, Moscow ...
14
nutrients Article Colostrum and Mature Human Milk of Women from London, Moscow, and Verona: Determinants of Immune Composition Daniel Munblit 1,2,3, *, Marina Treneva 2,4 , Diego G. Peroni 2,5 , Silvia Colicino 6 , LiYan Chow 1 , Shobana Dissanayeke 7 , Priya Abrol 1 , Shreya Sheth 1 , Alexander Pampura 2,4 , Attilio L. Boner 8 , Donna T. Geddes 2,9 , Robert J. Boyle 1,2,† and John O. Warner 1,2,† 1 Department of Paediatrics, Imperial College London, London W2 1NY, UK; [email protected] (L.C.); [email protected] (P.A.); [email protected] (S.S.); [email protected] (R.J.B.); [email protected] (J.O.W.) 2 International Inflammation (in-FLAME) Network of the World Universities Network, Sydney 2006, NSW, Australia; [email protected] (M.T.); [email protected] (D.G.P.); [email protected] (A.P.); [email protected] (D.T.G.) 3 Faculty of Pediatrics, I. M. Sechenov First Moscow State Medical University, Moscow 119991, Russia 4 Allergy Department, Veltischev Clinical Pediatric Research Institute of Pirogov Russian National Research Medical University, Moscow 125412, Russia 5 Department of Clinical and Experimental Medicine, Section of Paediatrics, University of Pisa, 56126 Pisa, Italy 6 National Heart and Lung Institute, Imperial College London, London SW3 6NP, UK; [email protected] 7 Royal Holloway University of London School of Biological Sciences, Biomedical Sciences, London TW20 0EX, UK; [email protected] 8 Department of Life and Reproduction Sciences, Section of Paediatrics, University of Verona, 37124 Verona, Italy; [email protected] 9 School of Chemistry and Biochemistry, The University of Western Australia, Perth 6009, WA, Australia * Correspondence: [email protected]; Tel.: +44-07-898-257-151 † These authors contributed equally to this work. Received: 30 August 2016; Accepted: 28 October 2016; Published: 3 November 2016 Abstract: Cytokines and growth factors in colostrum and mature milk may play an important role in infant immune maturation, and may vary significantly between populations. We aimed to examine associations between environmental and maternal factors, and human milk (HM) cytokine and growth factor levels. We recruited 398 pregnant/lactating women in the United Kingdom, Russia, and Italy. Participants underwent skin prick testing, questionnaire interview, and colostrum and mature milk sampling. HM cytokine and growth factor levels were quantified by electro-chemiluminescence. We found significant geographical variation in growth factor levels, but no evidence of variation between sites in cytokine detectability. There was an inverse correlation between time of milk sampling and growth factor levels in colostrum for Hepatocyte Growth Factor (HGF) and TGFβ1 and TGFβ3, but not TGFβ2, and levels were significantly higher in colostrum than mature milk for all growth factors. The kinetics of decline were different for each growth factor. Cytokines were present at much lower levels than growth factors, and the decline over time was less consistent. HM growth factors and cytokine levels vary between populations for unknown reasons. Levels of HM mediators decline at different rates postpartum, and these findings suggest specific biological roles for HM growth factors and cytokines in early postnatal development. Keywords: colostrum; human milk; immune modulators; immunologically active molecules; cytokines; growth factors; environmental influence Nutrients 2016, 8, 695; doi:10.3390/nu8110695 www.mdpi.com/journal/nutrients
Transcript of Colostrum and Mature Human Milk of Women from London, Moscow ...

nutrients
Article
Colostrum and Mature Human Milk of Women fromLondon, Moscow, and Verona: Determinants ofImmune Composition
Daniel Munblit 1,2,3,*, Marina Treneva 2,4, Diego G. Peroni 2,5, Silvia Colicino 6, LiYan Chow 1,Shobana Dissanayeke 7, Priya Abrol 1, Shreya Sheth 1, Alexander Pampura 2,4, Attilio L. Boner 8,Donna T. Geddes 2,9, Robert J. Boyle 1,2,† and John O. Warner 1,2,†
1 Department of Paediatrics, Imperial College London, London W2 1NY, UK; [email protected] (L.C.);[email protected] (P.A.); [email protected] (S.S.); [email protected] (R.J.B.);[email protected] (J.O.W.)
2 International Inflammation (in-FLAME) Network of the World Universities Network, Sydney 2006, NSW,Australia; [email protected] (M.T.); [email protected] (D.G.P.); [email protected] (A.P.);[email protected] (D.T.G.)
3 Faculty of Pediatrics, I. M. Sechenov First Moscow State Medical University, Moscow 119991, Russia4 Allergy Department, Veltischev Clinical Pediatric Research Institute of Pirogov Russian National Research
Medical University, Moscow 125412, Russia5 Department of Clinical and Experimental Medicine, Section of Paediatrics, University of Pisa,
56126 Pisa, Italy6 National Heart and Lung Institute, Imperial College London, London SW3 6NP, UK;
[email protected] Royal Holloway University of London School of Biological Sciences, Biomedical Sciences,
London TW20 0EX, UK; [email protected] Department of Life and Reproduction Sciences, Section of Paediatrics, University of Verona, 37124 Verona,
Italy; [email protected] School of Chemistry and Biochemistry, The University of Western Australia, Perth 6009, WA, Australia* Correspondence: [email protected]; Tel.: +44-07-898-257-151† These authors contributed equally to this work.
Received: 30 August 2016; Accepted: 28 October 2016; Published: 3 November 2016
Abstract: Cytokines and growth factors in colostrum and mature milk may play an important role ininfant immune maturation, and may vary significantly between populations. We aimed to examineassociations between environmental and maternal factors, and human milk (HM) cytokine andgrowth factor levels. We recruited 398 pregnant/lactating women in the United Kingdom, Russia, andItaly. Participants underwent skin prick testing, questionnaire interview, and colostrum and maturemilk sampling. HM cytokine and growth factor levels were quantified by electro-chemiluminescence.We found significant geographical variation in growth factor levels, but no evidence of variationbetween sites in cytokine detectability. There was an inverse correlation between time of milksampling and growth factor levels in colostrum for Hepatocyte Growth Factor (HGF) and TGFβ1 andTGFβ3, but not TGFβ2, and levels were significantly higher in colostrum than mature milk for allgrowth factors. The kinetics of decline were different for each growth factor. Cytokines were presentat much lower levels than growth factors, and the decline over time was less consistent. HM growthfactors and cytokine levels vary between populations for unknown reasons. Levels of HM mediatorsdecline at different rates postpartum, and these findings suggest specific biological roles for HMgrowth factors and cytokines in early postnatal development.
Keywords: colostrum; human milk; immune modulators; immunologically active molecules;cytokines; growth factors; environmental influence
Nutrients 2016, 8, 695; doi:10.3390/nu8110695 www.mdpi.com/journal/nutrients

Nutrients 2016, 8, 695 2 of 14
1. Introduction
Human milk (HM) is usually the first source of nutrition for a newborn, and an important factorassisting infants in the first months of life, not only as a nutrition source but also as a manner ofadapting infants to their extra-uterine environment. Breastfeeding is known to have positive short- andlong-term effects on child health, although its influence on allergy development is still debatable [1].There have been few attempts to investigate relationships between maternal and environmental factorsand immune active profiles of HM. Data from a variety of studies suggest that factors such as countryof maternal origin, diet, exercise, and exposure to smoke or farming environment in early life mayinfluence colostrum and HM constituents [2–22].
It has been shown that Hepatocyte Growth Factor (HGF) is known to regulate vascular endothelialgrowth factor (VEGF) production from endothelial cells [23] and complements VEGF biological activityin the infant gut [24]. HGF levels in maternal serum change throughout pregnancy, peaking at 30 to40 weeks of gestation and then decreasing upon delivery [25]. As levels of HGF are 20 to 30 timeshigher in colostrum than in maternal serum [26] it is reasonable to propose that HGF is activelyexcreted into HM in order to support infant’s gut immunity maturation and growth.
Inverse relationships between the risk of atopic diseases, associated with T-helper lymphocytetype 2 (TH2) immune response, and indicators of early-life exposure to infections, such as high birthorder or sibship size, early attendance at day care, and early exposure to pets or other animals arewell described [27]. The “hygiene hypothesis” remains one of the most popular current hypotheses onearly-life exposures and allergy risk [28]. It has been suggested that farming environment [6], higherbacterial exposure [7], or maternal country of origin [5] may have significant impacts on HM immunecomposition, and such effects on HM composition may be an important pathway through which earlyvariations in microbial exposures influence risk of allergy development.
Our study aimed to prospectively investigate the relationship between maternal andenvironmental factors and levels of HGF, Transforming Growth Factor beta (TGFβ)1,2,3 anddetectability of TH1 and TH2 cytokines using colostrum and HM samples collected from birth cohortsin three regions; the UK, eastern Europe, and continental Europe.
2. Materials and Methods
2.1. Study Setting, Eligibility Criteria, and Ethics
The investigations and sample collection have been conducted following ethical approval byEthics committee in three countries participating in the study: West London Rec 3 (UK) (Ref. number10/H0706/32) and all paperwork has been completed according to the hospital R&D Joint ResearchOffice (UK) (JROSM0072) policy; Ethical Committee of the Azienda Ospedaliera di Verona (Italy)(approval No. 1288), and Moscow Institute of Paediatrics and Child Health of Ministry of Health ofRussian Federation (Russia) (approval No. 1-MS/11). All women provided written informed consent.
Women were enrolled at antenatal and postnatal units of three participating centres—St. Mary’sHospital, London, UK; Maternity Hospital No. 1, Moscow, Russia; G.B. Rossi Hospital, Verona, Italy.Inclusion criteria for the study were: healthy term infants and their mothers intending to breastfeedand willing to comply with the study procedures.
Exclusion criteria were: maternal immunosuppressive treatment during lactation, or severeillness; infants with a major birth defect, admitted to neonatal intensive care, other severe illness, bornprematurely (<37 weeks gestation), or with low birth weight (<2nd centile).
2.2. Medical Records and Interview
Following enrolment, participants underwent allergy skin prick testing (SPT) and answereda 10 min interview-based questionnaire regarding their medical history. Exposure variables recordedwere selected based on a detailed review of known determinants of HM composition [29]. Informationcollected from the recruited women included parity; age; mode of delivery; details of residence

Nutrients 2016, 8, 695 3 of 14
environment, such as mould presence at home, regular contact with animals and/or pets at home;exposure to tobacco smoke (smoker or living in household with smoker or self-reported passivesmoker); any reports of infections during pregnancy. We also obtained information on maternal dietarypreferences—fish, fresh fruit, and probiotic intake. Participant medical records were reviewed by studypersonnel to extract relevant health information which was not available from questionnaires, prior tobreast milk analysis. SPT was undertaken using the following solutions: Histamine 1% Positive Control,Glycerol Negative Control, House Dust Mite (Dermatophagoides pteronyssinus), Cat (Felix domesticus),Grass Pollen, Birch pollen, Peanut, Hazelnut, Egg (all from Stallergenes, SA 92160 Anthony, France),and Cow’s milk (ALK-Abello, Hørsholm, Denmark). SPT was performed by standard technique using1 mm lancets (ALK-Abello, Hørsholm, Denmark), and were read at 15 min. Allergic sensitization wasdefined as a wheal ≥3 mm to at least one allergen, in the context of a wheal ≥3 mm to histamine andno wheal to the negative control.
2.3. Human Milk Sampling
Participants were given sterile tubes to collect their own colostrum (once in the first 6 daysof life) and mature HM (once at 4–6 weeks postpartum). Local site investigators and participatingmothers were asked to collect colostrum or milk at the first morning breastfeed, by manual expression(colostrum) or collecting the drip (mature milk) from the contra-lateral breast during feeding [15].Colostrum samples were frozen at −50 ◦C to −80 ◦C within 12 h of collection. HM samples werecollected at home, stored in the fridge for not longer than 4 h, and transported to participating units bystudy staff, and frozen at 50 ◦C to−80 ◦C within 12 h of collection. It has been previously demonstratedthat storage for 6 months at either −20 ◦C or −80 ◦C did not influence the concentration of immuneactive factors in human milk [30]. After thawing, samples were centrifuged at 1500× g for 15 minat 4 ◦C. The lipid layer was removed with a pipette and aqueous fraction was analysed for immunemodulators [31]. All milk samples were transported to London at −70 ◦C where the samples werestored at −80 ◦C until analysis.
2.4. Electro-Chemiluminescence
We used electro-chemiluminescence to measure immune mediators in colostrum and breast milksamples for Th1 and Th2 cytokines, HGF, and TGFβ1-3 (MesoScale Discovery, Rockville, MD, USA).Laboratory experiments were run according to manufacturer’s protocol, using an eight-point standardcurve. No dilution was used for Th1 and Th2 cytokines and HGF, and 1:2 dilution for TGFβ assays,following pilot experiments which showed that TGFβ2 levels in undiluted milk samples were oftengreater than the upper limit of detection. Assays were run in duplicate, and mediator levels wereexcluded where the CV was >25%—Median (IQR) levels and assay detection limits for each immunemediator studied are shown in Table A1.
2.5. Protein Analysis
We used turbidimetry to assess total protein concentration in colostrum samples (Abbott ArchitectAnalyser C8000, Abbott, Abbott Park, IL, USA). For turbidimetry colostrum, proteins were denaturedby benzethonium chloride, then measured at 404 nm. Pilot experiments determined that a 1:30 onboarddilution was needed to bring the colostrum protein concentration to within the linear measurementrange of the Architect Analyser (3–60 g/L). Prior to protein analysis samples were thawed andcentrifuged at 3000× g for 15 min at 4 ◦C. Next, 300 µL of supernatant were carefully transferred to thetubes and loaded into the Architect device for the analysis.
2.6. Statistical Analysis
Maternal factors and levels/detection of cytokines and growth factors were summarized usingstandard descriptive statistics. As outcome variables were not normally distributed, non-parametrictests such as the Mann–Whitney U-test, were used to compare independent observations of different

Nutrients 2016, 8, 695 4 of 14
populations for unadjusted analyses. All growth factors have been presented as a continuousvariable (pg/mL), whilst data on cytokines were transformed into a binary variable (detectableversus undetectable). Since concentration of growth factors and cytokines were assayed twice(in both colostrum and breast milk) for many participants, we used a mixed-effect regression model toaccount for the absence of independence between those two measures and to evaluate a broad rangeof variables. Continuous data with non-parametric distribution were log-transformed for inclusion inregression models.
Model selection was based on major approaches such as Akaike and Bayesian information criteria.Difference between groups effects (maternal and environmental factors) as well as within subject effectswere evaluated using multilevel mixed-effect regression model. Factors and covariates included in themodels were: parity, maternal sensitisation, maternal age, site of collection, mode of delivery—vaginalbirth/caesarean section, mould presence at home, pets at home or regular contact; exposure to tobaccosmoke (i.e., maternal active smoking or living in household with smoker or self-reported passivesmoker) at recruitment; at least one self-reported maternal infection during pregnancy; maternaldiet—fish intake at least once per week versus less often; daily fresh fruit versus less often; dailyprobiotic versus none/less often.
As models were used for the statistical analysis, the sample size reduced slightly, due to incompletedata for one or more variables included in the multivariate model in 56 individuals. This explainsdiscrepancy in colostrum numbers. Reduced numbers were included in analysis of human milksamples, due to missing samples. Milk samples were missing due to cessation of breastfeeding beforethis time, due to mother’s not supplying a sample within the four to six week time window forsampling, and due to loss to follow up/not contactable women.
Outcomes assessed were levels of HGF, TGFβ1, TGFβ2, TGFβ3, and cytokine detectability.Relationship between corrected growth factor levels and time (measured as HGF/Protein,TGFβ1/Protein, TGFβ2/Protein, and TGFβ3/Protein in pg/g) was assessed using the Spearmanrank correlation coefficient. Results were considered significant when p-values were reported at a levelless than 0.05. Bonferroni correction was used in mixed models analyses to control for false discovery.
3. Results
3.1. Study Population
Total of 481 mothers were recruited into the study from June 2011 to March 2012 from the birthcentres and antenatal and postnatal units of secondary and tertiary hospitals from three countries,located in Northern Europe, Eastern Europe, and the Mediterranean area. Of 481 women, 398 (UKn = 101, Russia n = 221, Italy n = 76) provided samples and were included in this study. The 83 mothersunwilling or unable to provide colostrum samples postnatally were not evaluated further.
Demographic data of the participants is presented in Table 1. Significant differences betweengroups were seen for most variables recorded. Maternal age (highest in Italy), maternal allergicsensitization (highest in UK), rate of Caesarean section (highest in UK), tobacco smoke exposure(highest in Russia), antenatal infections (highest in Italy), and time of colostrum collection (earlier inRussia than other sites) all differed significantly. There was also weak evidence for differences in parityand birth weight across centres). Infant sex did not significantly differ across sites.
3.2. Association between Collection Time and Colostrum/Breast Milk Composition
Among the environmental and maternal factors analysed we found time of milk sample collectionpostpartum to have the most significant influence on growth factor levels, and a mixed effect oncytokine detectability. A significant decline over time in colostrum was seen for HGF, TGFβ1 andTGFβ3, IL2, IL5, IL10, and IFNγ. No significant influence but similar trends were seen for most ofthe other mediators (Table 2 and Figure 1). Differences between colostrum and mature milk showedsimilar findings for growth factors, which were all statistically significant. For cytokine detectability

Nutrients 2016, 8, 695 5 of 14
in breast milk versus colostrum, findings were mixed and not entirely consistent with the changesseen over time in colostrum. IL10 was more commonly detected in colostrum than in HM, but IL4 andIFNγ were more commonly detected in HM, despite no change or a decline in detectability over timein colostrum samples. Other cytokines showed no significant difference between colostrum and HM(Table 2).
Table 1. Characteristics of study participants.
UK Russia Italy p-Value (ThreeCountries)
Maternal allergic sensitisation * 35/94 (37) 22/156 (14) 9/40 (23) <0.01 a
Maternal Age (years) 32.8 (4.78) 29.8 (4.45) 37.4 (5.38) <0.01 b
Vaginal Delivery 70/101 (69) 188/219 (86) 62/76 (82) <0.01 a
Male sex 54/101 (53) 118/216 (55) 41/76 (54) 0.98 a
Birth Weight (grams) 3527 (535.37) 3526 (438.97) 3328 (476.95) 0.05 b
Primiparous women 55/100 (55) 93/216 (43) 29/75 (39) 0.06 a
Household tobacco smoke exposure 30/99 (30) 135/218 (62) 25/76 (33) <0.01 a
Antenatal Infections † 16/100 (16) 61/211 (29) 29/76 (38) <0.01 a
Time of colostrum collection (hours) 58.61 (33.2) 50.03 (14.34) 57.84 (26.52) <0.01 b
a Pearson χ2 test has been used; b ANOVA test has been used. Data shown are (n/(%)) for binary variables,and (mean (S.D.)) for continuous variables; * Defined as skin prick test wheal ≥3 mm to at least one ofa panel of common allergens; † Antenatal infection is defined as at least one self-reported maternal infectionduring pregnancy.
Table 2. Relationship between time of sample collection and milk composition.
ImmuneModulator
Colostrum Composition Paired Differences between HM and Colostrumof Colostrum and Breast Milk Composition
Changeover Time β p-Value
Difference betweenColostrum and HM
over Timeβ p-Value
HGF Lower −0.01 <0.001 ** Higher in colostrum −1.35 <0.001 **TGFβ1 Lower −0.003 0.01 * Higher in colostrum −0.93 <0.001 **TGFβ2 No change −0.003 0.12 Higher in colostrum −1.12 <0.001 **TGFβ3 Lower −0.01 <0.001 ** Higher in colostrum −2.03 <0.001 **
IL2 Lower −0.02 0.02 * No difference 0.32 0.30IL4 No change −0.01 0.22 Higher in HM 0.72 0.04 *IL5 Lower −0.03 <0.001 ** No difference −0.54 0.09IL10 Lower −0.02 <0.001 ** Higher in colostrum −1.66 <0.001 **IFNγ Lower −0.01 0.04 * Higher in HM 1.20 <0.001 **IL12 No change −0.01 0.12 No difference −0.11 0.73IL13 No change −0.01 0.09 No difference 0.09 0.72
Data shown are concentration (pg/mL) for growth factors, and detectable versus not detectable for cytokines.A multilevel mixed-effect regression model was used for all analyses, which were adjusted to the followingfactors: Parity, Maternal Atopy, Maternal age, Site of collection, Mode of delivery, Mould presence at home, Petsat home or regular contact; Exposure to tobacco smoke; At least one self-reported maternal infection duringpregnancy; Maternal diet. HM, human milk; HGF, Hepatocyte Growth Factor. * p value < 0.05; ** p value < 0.01.
Nutrients 2016, 8, 695 6 of 14Nutrients 2016, 8, 695 6 of 14
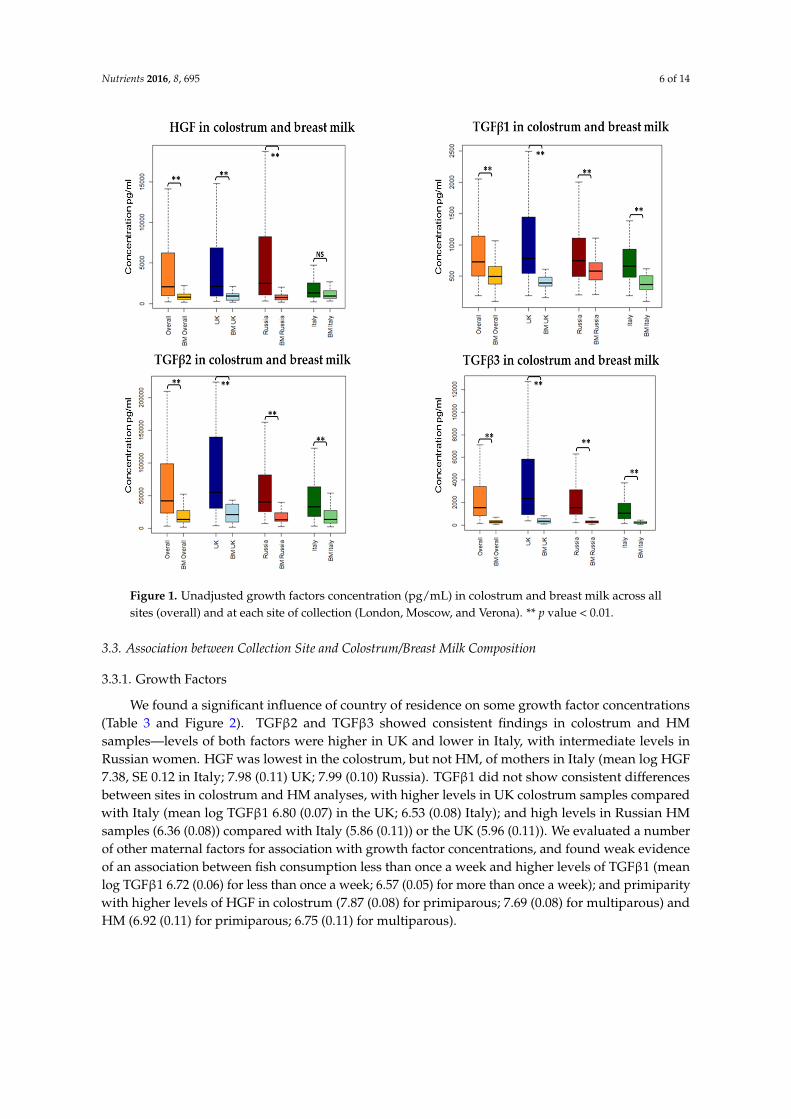
Figure 1. Unadjusted growth factors concentration (pg/mL) in colostrum and breast milk across all
sites (overall) and at each site of collection (London, Moscow, and Verona). ** p value < 0.01.
3.3. Association between Collection Site and Colostrum/Breast Milk Composition
3.3.1. Growth Factors
We found a significant influence of country of residence on some growth factor concentrations
(Table 3 and Figure 2). TGFβ2 and TGFβ3 showed consistent findings in colostrum and HM
samples—levels of both factors were higher in UK and lower in Italy, with intermediate levels in
Russian women. HGF was lowest in the colostrum, but not HM, of mothers in Italy (mean log HGF
7.38, SE 0.12 in Italy; 7.98 (0.11) UK; 7.99 (0.10) Russia). TGFβ1 did not show consistent differences
between sites in colostrum and HM analyses, with higher levels in UK colostrum samples compared
with Italy (mean log TGFβ1 6.80 (0.07) in the UK; 6.53 (0.08) Italy); and high levels in Russian HM
samples (6.36 (0.08)) compared with Italy (5.86 (0.11)) or the UK (5.96 (0.11)). We evaluated a number
of other maternal factors for association with growth factor concentrations, and found weak evidence
of an association between fish consumption less than once a week and higher levels of TGFβ1 (mean
log TGFβ1 6.72 (0.06) for less than once a week; 6.57 (0.05) for more than once a week); and primiparity
with higher levels of HGF in colostrum (7.87 (0.08) for primiparous; 7.69 (0.08) for multiparous) and
HM (6.92 (0.11) for primiparous; 6.75 (0.11) for multiparous).
Figure 1. Unadjusted growth factors concentration (pg/mL) in colostrum and breast milk across allsites (overall) and at each site of collection (London, Moscow, and Verona). ** p value < 0.01.
3.3. Association between Collection Site and Colostrum/Breast Milk Composition
3.3.1. Growth Factors
We found a significant influence of country of residence on some growth factor concentrations(Table 3 and Figure 2). TGFβ2 and TGFβ3 showed consistent findings in colostrum and HMsamples—levels of both factors were higher in UK and lower in Italy, with intermediate levels inRussian women. HGF was lowest in the colostrum, but not HM, of mothers in Italy (mean log HGF7.38, SE 0.12 in Italy; 7.98 (0.11) UK; 7.99 (0.10) Russia). TGFβ1 did not show consistent differencesbetween sites in colostrum and HM analyses, with higher levels in UK colostrum samples comparedwith Italy (mean log TGFβ1 6.80 (0.07) in the UK; 6.53 (0.08) Italy); and high levels in Russian HMsamples (6.36 (0.08)) compared with Italy (5.86 (0.11)) or the UK (5.96 (0.11)). We evaluated a numberof other maternal factors for association with growth factor concentrations, and found weak evidenceof an association between fish consumption less than once a week and higher levels of TGFβ1 (meanlog TGFβ1 6.72 (0.06) for less than once a week; 6.57 (0.05) for more than once a week); and primiparitywith higher levels of HGF in colostrum (7.87 (0.08) for primiparous; 7.69 (0.08) for multiparous) andHM (6.92 (0.11) for primiparous; 6.75 (0.11) for multiparous).

Nutrients 2016, 8, 695 7 of 14
Table 3. Concentration (pg/mL) of growth factors in colostrum and breast milk and exposuresassociated with the levels.
Median (IQR) pg/mL Important Growth Factor Level Difference between the Groups
Colostrum
HGF 2055.31 (964–6239)UK and Russia higher than in Italy p < 0.001
Primipara higher than Multipara p = 0.05
TGFβ1 731.534 (505–1142)UK higher than Italy p = 0.01
Fish consumption Less than oncea week higher than At least once a week p = 0.04
TGFβ2 42,209.88 (23,847–98,597) UK higher than Russia and Italy p < 0.05
TGFβ3 1535.081 (847–3395) UK higher than Russia higher than Italy p < 0.05
Breast Milk
HGF 784.041 (508–1189) Primiparous higher than Multigravida p = 0.05
TGFβ1 493.514 (375–653) Russia higher than UK and Italy p < 0.05
TGFβ2 14,040.62 (10,080–27,262) UK higher than Russia and Italy p < 0.05
TGFβ3 279.41 (183–395) UK higher than Russia higher than Italy p < 0.05
A multilevel mixed-effect regression model was used for all analyses, which was adjusted using Bonferronicorrection, to the following factors: Parity, Maternal Atopy, Maternal age, Site (Country) of collection, Modeof delivery—labour versus no labour, Mould presence at home, Pets at home or regular contact; Exposure totobacco smoke (i.e., smoker or living in household with smoker or self-reported passive smoker) at recruitment;At least one self-reported maternal infection during pregnancy; Maternal diet—fish intake at least once perweek versus less often; daily fresh fruit versus less often; daily probiotic versus none/less often.Nutrients 2016, 8, 695 7 of 14
Figure 2. Association between site of collection and growth factor concentrations in colostrum and
breast milk. Data shown are mean (bold line) and 95% CI (shaded area) for log transformed
concentrations of HGF (a); TGFβ1 (b); TGFβ2 (c); and TGFβ3 (d) in the UK (red), Russia (blue), and
Italy (green). A multilevel mixed‐effect regression model was used for all analyses which were
adjusted to the following factors: Parity, Maternal Atopy, Maternal age, Site (Country) of collection,
Mode of delivery, Mould presence at home, Pets at home or regular contact; Exposure to tobacco
smoke, at recruitment; At least one self‐reported maternal infection during pregnancy; Maternal diet.
Table 3. Concentration (pg/mL) of growth factors in colostrum and breast milk and exposures
associated with the levels.
Median (IQR) pg/mL Important Growth Factor Level Difference between the Groups
Colostrum
HGF 2055.31 (964–6239) UK and Russia higher than in Italy p < 0.001
Primipara higher than Multipara p = 0.05
TGFβ1 731.534 (505–1142)
UK higher than Italy p = 0.01
Fish consumption Less than once a
week higher than At least once a
week p = 0.04
TGFβ2 42,209.88 (23,847–98,597) UK higher than Russia and Italy p < 0.05
TGFβ3 1535.081 (847–3395) UK higher than Russia higher than
Italy p < 0.05
Breast Milk
HGF 784.041 (508–1189) Primiparous higher than
Multigravida p = 0.05
TGFβ1 493.514 (375–653) Russia higher than UK and Italy p < 0.05
TGFβ2 14,040.62 (10,080–27,262) UK higher than Russia and Italy p < 0.05
TGFβ3 279.41 (183–395) UK higher than Russia higher than
Italy p < 0.05
A multilevel mixed‐effect regression model was used for all analyses, which was adjusted using
Bonferroni correction, to the following factors: Parity, Maternal Atopy, Maternal age, Site (Country)
of collection, Mode of delivery—labour versus no labour, Mould presence at home, Pets at home or
regular contact; Exposure to tobacco smoke (i.e., smoker or living in household with smoker or self‐
reported passive smoker) at recruitment; At least one self‐reported maternal infection during
Figure 2. Association between site of collection and growth factor concentrations in colostrumand breast milk. Data shown are mean (bold line) and 95% CI (shaded area) for log transformedconcentrations of HGF (a); TGFβ1 (b); TGFβ2 (c); and TGFβ3 (d) in the UK (red), Russia (blue), andItaly (green). A multilevel mixed-effect regression model was used for all analyses which were adjustedto the following factors: Parity, Maternal Atopy, Maternal age, Site (Country) of collection, Mode ofdelivery, Mould presence at home, Pets at home or regular contact; Exposure to tobacco smoke, atrecruitment; At least one self-reported maternal infection during pregnancy; Maternal diet.
Nutrients 2016, 8, 695 8 of 14
3.3.2. Cytokines
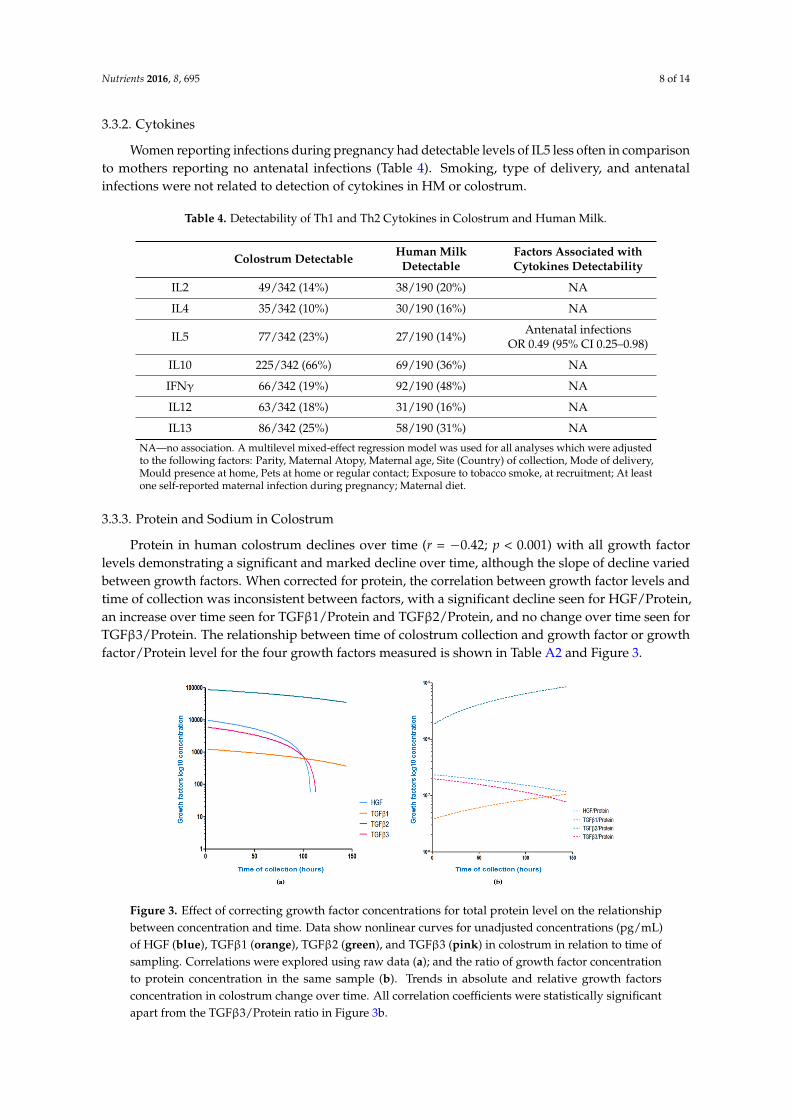
Women reporting infections during pregnancy had detectable levels of IL5 less often in comparisonto mothers reporting no antenatal infections (Table 4). Smoking, type of delivery, and antenatalinfections were not related to detection of cytokines in HM or colostrum.
Table 4. Detectability of Th1 and Th2 Cytokines in Colostrum and Human Milk.
Colostrum Detectable Human MilkDetectable
Factors Associated withCytokines Detectability
IL2 49/342 (14%) 38/190 (20%) NA
IL4 35/342 (10%) 30/190 (16%) NA
IL5 77/342 (23%) 27/190 (14%) Antenatal infectionsOR 0.49 (95% CI 0.25–0.98)
IL10 225/342 (66%) 69/190 (36%) NA
IFNγ 66/342 (19%) 92/190 (48%) NA
IL12 63/342 (18%) 31/190 (16%) NA
IL13 86/342 (25%) 58/190 (31%) NA
NA—no association. A multilevel mixed-effect regression model was used for all analyses which were adjustedto the following factors: Parity, Maternal Atopy, Maternal age, Site (Country) of collection, Mode of delivery,Mould presence at home, Pets at home or regular contact; Exposure to tobacco smoke, at recruitment; At leastone self-reported maternal infection during pregnancy; Maternal diet.
3.3.3. Protein and Sodium in Colostrum
Protein in human colostrum declines over time (r = −0.42; p < 0.001) with all growth factorlevels demonstrating a significant and marked decline over time, although the slope of decline variedbetween growth factors. When corrected for protein, the correlation between growth factor levels andtime of collection was inconsistent between factors, with a significant decline seen for HGF/Protein,an increase over time seen for TGFβ1/Protein and TGFβ2/Protein, and no change over time seen forTGFβ3/Protein. The relationship between time of colostrum collection and growth factor or growthfactor/Protein level for the four growth factors measured is shown in Table A2 and Figure 3.
Nutrients 2016, 8, 695 8 of 14
pregnancy; Maternal diet—fish intake at least once per week versus less often; daily fresh fruit versus
less often; daily probiotic versus none/less often.
3.3.2. Cytokines
Women reporting infections during pregnancy had detectable levels of IL5 less often in
comparison to mothers reporting no antenatal infections (Table 4). Smoking, type of delivery, and
antenatal infections were not related to detection of cytokines in HM or colostrum.
Table 4. Detectability of Th1 and Th2 Cytokines in Colostrum and Human Milk.
Colostrum
Detectable
Human Milk
Detectable
Factors Associated with
Cytokines Detectability
IL2 49/342 (14%) 38/190 (20%) NA
IL4 35/342 (10%) 30/190 (16%) NA
IL5 77/342 (23%) 27/190 (14%) Antenatal infections
OR 0.49 (95% CI 0.25–0.98)
IL10 225/342 (66%) 69/190 (36%) NA
IFNγ 66/342 (19%) 92/190 (48%) NA
IL12 63/342 (18%) 31/190 (16%) NA
IL13 86/342 (25%) 58/190 (31%) NA
NA—no association. A multilevel mixed‐effect regression model was used for all analyses which were
adjusted to the following factors: Parity, Maternal Atopy, Maternal age, Site (Country) of collection,
Mode of delivery, Mould presence at home, Pets at home or regular contact; Exposure to tobacco
smoke, at recruitment; At least one self‐reported maternal infection during pregnancy; Maternal diet.
3.3.3. Protein and Sodium in Colostrum
Protein in human colostrum declines over time (r = −0.42; p < 0.001) with all growth factor levels
demonstrating a significant and marked decline over time, although the slope of decline varied
between growth factors. When corrected for protein, the correlation between growth factor levels and
time of collection was inconsistent between factors, with a significant decline seen for HGF/Protein,
an increase over time seen for TGFβ1/Protein and TGFβ2/Protein, and no change over time seen for
TGFβ3/Protein. The relationship between time of colostrum collection and growth factor or growth
factor/Protein level for the four growth factors measured is shown in Table A2 and Figure 3.
Figure 3. Effect of correcting growth factor concentrations for total protein level on the relationship
between concentration and time. Data show nonlinear curves for unadjusted concentrations (pg/mL)
of HGF (blue), TGFβ1 (orange), TGFβ2 (green), and TGFβ3 (pink) in colostrum in relation to time of
Figure 3. Effect of correcting growth factor concentrations for total protein level on the relationshipbetween concentration and time. Data show nonlinear curves for unadjusted concentrations (pg/mL)of HGF (blue), TGFβ1 (orange), TGFβ2 (green), and TGFβ3 (pink) in colostrum in relation to time ofsampling. Correlations were explored using raw data (a); and the ratio of growth factor concentrationto protein concentration in the same sample (b). Trends in absolute and relative growth factorsconcentration in colostrum change over time. All correlation coefficients were statistically significantapart from the TGFβ3/Protein ratio in Figure 3b.

Nutrients 2016, 8, 695 9 of 14
4. Discussion
In this large prospective cohort study, we have confirmed earlier findings of significant differencesin milk composition between sites, but were not able to explain these differences through maternalor environmental factors. We identified important differences between mediators in kinetics ofdecline postpartum and these data suggest specific mechanisms controlling HM immune composition,and support important biological roles for HM immune factors in the developing infant.
Data from a variety of studies suggest that colostrum and HM constituents may be influenced bythe country of origin and a number of environmental conditions which may differ significantly fromone location to another [3–7,32], but the cause of this difference is still unclear. Our data suggest thatHGF levels were lower in the colostrum/milk of Italian mothers and TGFβ2 and TGFβ3 were higherin colostrum/milk of UK mothers with the same significant difference for colostral TGFβ1 (Figure 2).Amoudruz showed that Mali women have higher levels of TGF-β1 in comparison with women born inSweden [5]. Peroni reported higher HM TGF-β1 in a farming compared with urban environment [6].Tomicic found Estonian mothers have lower HM TGFβ2 than Swedish mothers [7] which the authorssuggested may be due to differences in microbial exposure. Orivuori et al. assessed HM samplescollected in four countries of continental Europe and Finland and showed TGFβ1 levels to be highestin Finland and sIgA lowest in Germany [32]. We explored a number of maternal and demographicvariables including markers of microbial load such as maternal report of probiotic, pet, and mouldexposure, but we were not able to confirm these previous findings.
At present, we do not possess strong evidence of maternal allergic status influences on qualitativeand quantitative immunological constituents in HM. We did not find any relationship between thelevels of growth factors and/or detectability of cytokines and maternal allergy; this is in agreementwith data from other studies which found no obvious trend in HM composition of allergic motherscompared to non-allergic [32–34].
Our data show some evidence for higher levels of HGF and TGFβ3 in the colostrum of primiparouswomen. Data from some studies suggest that parity does not influence HM composition. Thisborderline trend can be seen in some (but not all [3,35]) other studies [4,36,37], suggesting that higherlevels of certain immune active markers can be found in the HM of primiparous mothers, which maybe an additional mechanism to explain decreased allergy risk with an increase of birth order.
We found some evidence that fish intake during pregnancy can influence HM composition [3]—wefound higher colostrum TGFβ1 in women eating fish less than once a week. This adds to a confusingpicture, with Urwin reporting TGF-β1 levels to be highest in the colostrum of women residing in theriver and lake region of China [3], well known for high fish consumption and Hawkes not finding anyrelationship between fish oil intervention and TGFβ1 levels [38]. Thus, the reasons behind differencesin the HM immunological profile between countries remain unclear. Further work should considergenetic and gene/environment influences, as well as detailed dietary assessments, in addition to thefactors evaluated in this study. Data from So-Yeon Lee and co-authors show that breastfeeding wasfound to be associated with a reduced risk of allergic sensitisation in children with CT/CC geno-type,suggesting gene-environment interaction between the CD14C-159T polymorphism and breastfeedingin relation to aeroallergen sensitisation [39].
It is well established that colostrum is particularly rich in immunologically active molecules andthat levels of immunological factors are lower in mature HM [6,12,40,41]. Although our study didnot involve HM collection in the same individuals over multiple timepoints, the sample size waslarge enough to identify a strong relationship between time of sampling postpartum and growthfactor levels. We observed a strong relationship between growth factor levels and time postpartumboth within colostrum, and between colostrum and mature milk samples, which was independentof geographical location. Although the difference between colostrum and mature milk compositionis well established in the literature [6,12,40,41], our finding of a rapid decline in growth factor levels(HGF, TGFβ1, TGFβ3) and evidence for reduced detectability of cytokines (IL2, IL5, IL10, IFNγ) incolostrum with time postpartum has not been consistently demonstrated by others. Soto-Ramirez et al.

Nutrients 2016, 8, 695 10 of 14
found none of the immune markers to correlate with the time of milk collection in a study conductedin the USA [42]; this may be partially explained by a wide range in collection times (week one to eight)and absence of colostral samples. In a study done in China with a narrower range of collection times,levels of TGF-β1 and TGF-β2 decreased significantly over time [3]. Studies which do not adequatelyaccount for variations in sampling time may explain some of the inconsistency of HM compositionand its determinants in the literature [29].
Dilution could be a potential explanation of the growth factor decline over time. During the firstweek of life the infant’s volume requirements are low. Later levels of the immune active moleculesdecrease as the volume and nutritional requirements of the infant increase. Immune active constituentsof colostrum and breast milk represent a minor component but one of the most biologically activeparts of HM total protein. In this study, we attempted to adjust for dilutional effects by correctinggrowth factor colostrum levels for total protein level in the same sample. Correction for colostrum totalprotein failed to consistently remove the relationship between factor level and time postpartum, andhighlighted significant variation between factors in the kinetics of decline. This implies active transportof these growth factors using varied mechanisms specific to each factor. If we assume biologicalrelevance, then these results suggest that infants need relatively higher amounts of TGFβ1 and TGFβ2for longer than that of TGFβ3 or HGF. TGFβ3 is significantly different from TGFβ1 and TGFβ2 inits detailed tertiary structure of the active domain despite homology in amino acid sequence [43].There is some evidence [43] that TGFβ3 may also have distinct functions to other TGFβ isoforms.TGFβ3 is up-regulated by milk stasis, and induces apoptosis in mammary gland epithelium duringinvolution, in contrast to TGFβ1 and TGFβ2 [44]. The biological relevance of HM TGFβ is illustratedby the observed direct correlation between the levels of TGFβ in human milk and infant serum IgA [45].As the infant’s immune response matures there is likely to be less need for an extrinsic supply ofimmune stimulants.
The main limitations of our study are first that we did not assess maternal diet using a foodfrequency questionnaire, did not collect detailed information on the strain of probiotics and/or fish oilsupplements used, and did not evaluate maternal genotype as a potentially important determinant ormodulator of HM composition. This means that while we were able to explore our primary focus ofmaternal and demographic factors influence on HM composition, we were not able to reliably identifyreasons for the difference in HM composition identified between sites. Second, we sampled singlecolostrum and HM specimens from each subject. Our findings regarding the kinetics of growth factordecline in colostrum and HM need to be explored further in prospective studies with longitudinalsampling at multiple timepoints within the same participants. Third, we only made preliminaryattempts to adjust for the effect of time or milk maturity on compositional analysis. Since timepostpartum may be a surrogate for milk/breast maturity, we aimed to identify a ‘correction factor’ thatmight reflect milk maturity. We did not find evidence that any growth factor concentration was relatedto HM protein concentration, but further work is needed to identify markers of HM maturity in orderto control for this in compositional analysis of colostrum. Maternal body mass index (BMI) data hasnot been assessed due to a difficulty in one of the participating countries. Finally, due to logistical,funding, and sample size constraints our analysis covers only a small number of growth factors andcytokines, so may not be generalisable to all immune factors in HM.
5. Conclusions
In this large international cohort study of HM composition, we have found an important influenceof time after birth on colostrum composition, which must be adjusted for in any further research.Despite adjusting for this and other factors, we identified unexplained and significant variation inHM immune composition between geographically distant populations. Overall, our data suggest thatlevels of human milk mediators decline at different rates post-partum, and this may suggest that thesefactors are likely to have specific biological roles in early postnatal development. An important aimof future research should be to optimize the analysis of HM composition, accounting for maturity of

Nutrients 2016, 8, 695 11 of 14
milk, and aim to better understand the biological roles and consequences for the developing infant ofvariations in HM immune composition.
Acknowledgments: We are grateful to the staff of birth centres and postnatal units involved and all the womenand their babies, participating in our study. Robert Boyle and John Warner are supported by a National Institutefor Health Research Biomedical Research Centre (BRC). Both JW and RB have received research grant incomefrom Danone in relation to studies of the value of prebiotics in allergy prevention and Airsonette to evaluateTemperature controlled laminar airflow for asthma. JW is on a Danone, UCB and Airsonette scientific advisoryboard and both JW and RB have given paid lectures for the companies. DM has received travel funding fromNutricia. DG receives an unrestricted research grant from Medela AG and has received travel funding and supportfor lectures.
Author Contributions: J.O.W., R.J.B. and D.M. conceived and designed the experiments; D.M., S.D., L.Y.C., P.A.and S.S. performed the experiments; D.M., L.Y.C. collected data in London; D.G.P. and A.L.B. collected data inVerona; M.T. and A.P. collected data in Moscow; S.C. analysed the data; D.M., D.T.G., R.J.B. and J.O.W. wrote thepaper. For research articles with several authors, a short paragraph specifying their individual contributions mustbe provided. The following statements should be used “X.X. and Y.Y. conceived and designed the experiments;X.X. performed the experiments; X.X. and Y.Y. analysed the data; W.W. contributed reagents/materials/analysistools; Y.Y. wrote the paper”. Authorship must be limited to those who have contributed substantially to thework reported.
Conflicts of Interest: The authors declare no conflict of interest.
Appendix A
Table A1. Lower limit of detection values (pg/mL) for cytokines and growth factors analysis andoverall locations median concentrations for all immune active molecules (values below LLOD for allcytokines have been transformed into 1/2 of LLOD).
Immune ActiveMolecule
Median Lower Limitof Detection
Median (IQR)Colostrum Median (IQR) HM
IFN-γ 3.49 1.23 (0.51–3.49) 3.49 (1.54–7.8)IL2 2.06 0.6 (0.29–1.47) 0.98 (0.23–2.06)IL4 1.83 1.83 (0.24–1.83) 1.83 (0.50–1.83)IL5 2.89 1.44 (0.57–2.85) 1.57 (0.33–2.89)
IL10 1.50 2.67 (1.01–9.04) 1.5 (0.74–2.66)IL12 3.50 1.85 (0.34–3.5) 2.13 (0.32–3.5)IL13 4.60 4.6 (1.85–4.69) 4.6 (3.52–6.76)HGF 73.00 2055.31 (964–6239) 784.041 (508–1189)
TGFβ1 8.73 731.534 (505–1142) 493.514 (375–653)TGFβ2 265.00 42,209.88 (23,847–98,597) 14,040.62 (10,080–27,262)TGFβ3 8.37 1535.081 (847–3395) 279.41 (183–395)
Standard curve ranges: IFN-γ, IL2, IL4, IL5, IL10, IL12, IL13 0—2500 pg/mL; HGF, TGFβ1, TGFβ2 0—100.000;TGFβ3 0—50.000. All values presented in pg/mL.
Table A2. Absolute and relative decline of growth factors over time.
Growth Factor Concentration(pg/mL)/Time of Collection Raw Concentration (pg/mL) Growth Factor/Protein Ratio
HGF r = −0.39, p < 0.001 ↓ r = −0.19, p = 0.003 ↓TGFβ1 r = −0.21, p < 0.001 ↓ r = 0.25, p < 0.001 ↑TGFβ2 r = −0.16, p = 0.01 ↓ r = 0.20, p = 0.004 ↑TGFβ3 r = −0.35, p < 0.001 ↓ r = −0.06, p = 0.34 ↓
↑—Positive correlation with time of collection; ↓—Negative correlation with time of collection.
References
1. Matheson, M.C.; Allen, K.J.; Tang, M.L. Understanding the evidence for and against the role of breastfeedingin allergy prevention. Clin. Exp. Allergy 2012, 42, 827–851. [CrossRef] [PubMed]

Nutrients 2016, 8, 695 12 of 14
2. Hoppu, U.; Isolauri, E.; Laakso, P.; Matomaki, J.; Laitinen, K. Probiotics and dietary counselling targetingmaternal dietary fat intake modifies breast milk fatty acids and cytokines. Eur. J. Nutr. 2012, 51, 211–219.[CrossRef] [PubMed]
3. Urwin, H.J.; Miles, E.A.; Noakes, P.S.; Kremmyda, L.S.; Vlachava, M.; Diaper, N.D.; Perez-Cano, F.J.;Godfrey, K.M.; Calder, P.C.; Yaqoob, P. Salmon consumption during pregnancy alters fatty acid compositionand secretory IgA concentration in human breast milk. J. Nutr. 2012, 142, 1603–1610. [CrossRef] [PubMed]
4. Amoudruz, P.; Holmlund, U.; Schollin, J.; Sverremark-Ekstrom, E.; Montgomery, S.M. Maternal country ofbirth and previous pregnancies are associated with breast milk characteristics. Pediatr. Allergy Immunol. 2009,20, 19–29. [CrossRef] [PubMed]
5. Holmlund, U.; Amoudruz, P.; Johansson, M.A.; Haileselassie, Y.; Ongoiba, A.; Kayentao, K.; Traore, B.;Doumbo, S.; Schollin, J.; Doumbo, O.; et al. Maternal country of origin, breast milk characteristics andpotential influences on immunity in offspring. Clin. Exp. Immunol. 2010, 162, 500–509. [CrossRef] [PubMed]
6. Peroni, D.G.; Pescollderungg, L.; Piacentini, G.L.; Rigotti, E.; Maselli, M.; Watschinger, K.; Piazza, M.;Pigozzi, R.; Boner, A.L. Immune regulatory cytokines in the milk of lactating women from farming andurban environments. Pediatr. Allergy Immunol. 2010, 21, 977–982. [CrossRef] [PubMed]
7. Tomicic, S.; Johansson, G.; Voor, T.; Bjorksten, B.; Bottcher, M.F.; Jenmalm, M.C. Breast milk cytokine and IgAcomposition differ in Estonian and Swedish mothers-relationship to microbial pressure and infant allergy.Pediatr. Res. 2010, 68, 330–334. [CrossRef] [PubMed]
8. Striker, G.A.; Casanova, L.D.; Nagao, A.T. Influence of type of delivery on A, G and M immunoglobulinconcentration in maternal colostrum. J. Pediatr. 2004, 80, 123–128. [CrossRef]
9. Bottcher, M.F.; Jenmalm, M.C.; Garofalo, R.P.; Bjorksten, B. Cytokines in breast milk from allergic andnonallergic mothers. Pediatr. Res. 2000, 47, 157–162. [CrossRef] [PubMed]
10. Laiho, K.; Lampi, A.M.; Hamalainen, M.; Moilanen, E.; Piironen, V.; Arvola, T.; Syrjanen, S.; Isolauri, E. Breastmilk fatty acids, eicosanoids, and cytokines in mothers with and without allergic disease. Pediatr. Res. 2003,53, 642–647. [CrossRef] [PubMed]
11. Prokesova, L.; Lodinova-Zadnikova, R.; Zizka, J.; Kocourkova, I.; Novotna, O.; Petraskova, P.; Sterzl, I.Cytokine levels in healthy and allergic mothers and their children during the first year of life.Pediatr. Allergy Immunol. 2006, 17, 175–183. [CrossRef] [PubMed]
12. Rigotti, E.; Piacentini, G.L.; Ress, M.; Pigozzi, R.; Boner, A.L.; Peroni, D.G. Transforming growth factor-betaand interleukin-10 in breast milk and development of atopic diseases in infants. Clin. Exp. Allergy 2006, 36,614–618. [CrossRef] [PubMed]
13. Marek, A.; Zagierski, M.; Liberek, A.; Aleksandrowicz, E.; Korzon, M.; Krzykowski, G.; Kaminska, B.;Szlagatys-Sidorkiewicz, A. TGF-beta(1), IL-10 and IL-4 in colostrum of allergic and nonallergic mothers.Acta Biochim. Pol. 2009, 56, 411–414. [PubMed]
14. Sidor, K.; Jarmolowska, B.; Kaczmarski, M.; Kostyra, E.; Iwan, M.; Kostyra, H. Content of beta-casomorphinsin milk of women with a history of allergy. Pediatr. Allergy Immunol. 2008, 19, 587–591. [CrossRef] [PubMed]
15. Snijders, B.E.; Damoiseaux, J.G.; Penders, J.; Kummeling, I.; Stelma, F.F.; van Ree, R.; van den Brandt, P.A.;Thijs, C. Cytokines and soluble CD14 in breast milk in relation with atopic manifestations in mother andinfant (KOALA study). Clin. Exp. Allergy 2006, 36, 1609–1615. [CrossRef] [PubMed]
16. Bottcher, M.F.; Abrahamsson, T.R.; Fredriksson, M.; Jakobsson, T.; Bjorksten, B. Low breast milk tgf-beta2 isinduced by lactobacillus reuteri supplementation and associates with reduced risk of sensitization duringinfancy. Pediatr. Allergy Immunol. 2008, 19, 497–504. [CrossRef] [PubMed]
17. Boyle, R.J.; Ismail, I.H.; Kivivuori, S.; Licciardi, P.V.; Robins-Browne, R.M.; Mah, L.J.; Axelrad, C.; Moore, S.;Donath, S.; Carlin, J.B.; et al. Lactobacillus GG treatment during pregnancy for the prevention of eczema: Arandomized controlled trial. Allergy 2011, 66, 509–516. [CrossRef] [PubMed]
18. Prescott, S.L.; Wickens, K.; Westcott, L.; Jung, W.; Currie, H.; Black, P.N.; Stanley, T.V.; Mitchell, E.A.;Fitzharris, P.; Siebers, R.; et al. Supplementation with Lactobacillus Rhamnosus or Bifidobacterium Lactisprobiotics in pregnancy increases cord blood interferon-gamma and breast milk transforming growthfactor-beta and immunoglobin a detection. Clin. Exp. Allergy 2008, 38, 1606–1614. [CrossRef] [PubMed]
19. Rautava, S.; Kalliomaki, M.; Isolauri, E. Probiotics during pregnancy and breast-feeding might conferimmunomodulatory protection against atopic disease in the infant. J. Allergy Clin. Immunol. 2002, 109,119–121. [CrossRef] [PubMed]

Nutrients 2016, 8, 695 13 of 14
20. Kuitunen, M.; Kukkonen, A.K.; Savilahti, E. Impact of maternal allergy and use of probiotics duringpregnancy on breast milk cytokines and food antibodies and development of allergy in children until 5 years.Int. Arch. Allergy Immunol. 2012, 159, 162–170. [CrossRef] [PubMed]
21. Zanardo, V.; Nicolussi, S.; Cavallin, S.; Trevisanuto, D.; Barbato, A.; Faggian, D.; Favaro, F.; Plebani, M. Effectof maternal smoking on breast milk interleukin-1alpha, beta-endorphin, and leptin concentrations and leptinconcentrations. Environ. Health Perspect. 2005, 113, 1410–1413. [CrossRef] [PubMed]
22. Burch, J.; Karmaus, W.; Gangur, V.; Soto-Ramirez, N.; Yousefi, M.; Goetzl, L.M. Pre- and perinatalcharacteristics and breast milk immune markers. Pediatr. Res. 2013, 74, 615–621. [CrossRef] [PubMed]
23. Min, J.K.; Lee, Y.M.; Kim, J.H.; Kim, Y.M.; Kim, S.W.; Lee, S.Y.; Gho, Y.S.; Oh, G.T.; Kwon, Y.G. Hepatocytegrowth factor suppresses vascular endothelial growth factor-induced expression of endothelial ICAM-1 andVCAM-1 by inhibiting the nuclear factor-kappaB pathway. Circ. Res. 2005, 96, 300–307. [CrossRef] [PubMed]
24. Kobata, R.; Tsukahara, H.; Ohshima, Y.; Ohta, N.; Tokuriki, S.; Tamura, S.; Mayumi, M. High levels of growthfactors in human breast milk. Early Hum. Dev. 2008, 84, 67–69. [CrossRef] [PubMed]
25. Horibe, N.; Okamoto, T.; Itakura, A.; Nakanishi, T.; Suzuki, T.; Kazeto, S.; Tomoda, Y. Levels of hepatocytegrowth factor in maternal serum and amniotic fluid. Am. J. Obstet. Gynecol. 1995, 173, 937–942. [CrossRef]
26. Yamada, Y.; Saito, S.; Morikawa, H. Hepatocyte growth factor in human breast milk. Am. J. Reprod. Immunol.1998, 40, 112–120. [CrossRef] [PubMed]
27. Strachan, D.P. Family size, infection and atopy: The first decade of the “hygiene hypothesis”. Thorax 2000, 55(Suppl. 1), S2–S10. [CrossRef] [PubMed]
28. Strachan, D.P. Hay fever, hygiene, and household size. BMJ 1989, 299, 1259–1260. [CrossRef] [PubMed]29. Munblit, D.; Boyle, R.J.; Warner, J.O. Factors affecting breast milk composition and potential consequences
for development of the allergic phenotype. Clin. Exp. Allergy 2015, 45, 583–601. [CrossRef] [PubMed]30. Ramirez-Santana, C.; Perez-Cano, F.J.; Audi, C.; Castell, M.; Moretones, M.G.; Lopez-Sabater, M.C.;
Castellote, C.; Franch, A. Effects of cooling and freezing storage on the stability of bioactive factors inhuman colostrum. J. Dairy Sci. 2012, 95, 2319–2325. [CrossRef] [PubMed]
31. Jones, C.A.; Holloway, J.A.; Popplewell, E.J.; Diaper, N.D.; Holloway, J.W.; Vance, G.H.; Warner, J.A.;Warner, J.O. Reduced soluble CD14 levels in amniotic fluid and breast milk are associated with the subsequentdevelopment of atopy, eczema, or both. J. Allergy Clin. Immunol. 2002, 109, 858–866. [CrossRef] [PubMed]
32. Orivuori, L.; Loss, G.; Roduit, C.; Dalphin, J.C.; Depner, M.; Genuneit, J.; Lauener, R.; Pekkanen, J.; Pfefferle, P.;Riedler, J.; et al. Soluble immunoglobulin A in breast milk is inversely associated with atopic dermatitis atearly age: The PASTURE cohort study. Clin. Exp. Allergy 2014, 44, 102–112. [CrossRef] [PubMed]
33. Savilahti, E.; Siltanen, M.; Kajosaari, M.; Vaarala, O.; Saarinen, K.M. IgA antibodies, TGF-beta1 and -beta2,and soluble CD14 in the colostrum and development of atopy by age 4. Pediatr. Res. 2005, 58, 1300–1305.[CrossRef] [PubMed]
34. Kondo, N.; Suda, Y.; Nakao, A.; Oh-Oka, K.; Suzuki, K.; Ishimaru, K.; Sato, M.; Tanaka, T.; Nagai, A.;Yamagata, Z. Maternal psychosocial factors determining the concentrations of transforming growthfactor-beta in breast milk. Pediatr. Allergy Immunol. 2011, 22, 853–861. [CrossRef] [PubMed]
35. Ismail, I.H.; Licciardi, P.V.; Oppedisano, F.; Boyle, R.J.; Tang, M.L. Relationship between breastmilk sCD14, Tgf-beta1 and total IgA in the first month and development of eczema during infancy.Pediatr. Allergy Immunol. 2013, 24, 352–360. [CrossRef] [PubMed]
36. Groer, M.W.; Shelton, M.M. Exercise is associated with elevated proinflammatory cytokines in human milk.J. Obstet. Gynecol. Neonatal Nurs. 2009, 38, 35–41. [CrossRef] [PubMed]
37. Walter, J.; Kuhn, L.; Ghosh, M.K.; Kankasa, C.; Semrau, K.; Sinkala, M.; Mwiya, M.; Thea, D.M.;Aldrovandi, G.M. Low and undetectable breast milk interleukin-7 concentrations are associated withreduced risk of postnatal HIV transmission. J. Acquir. Immune Defic. Syndr. 2007, 46, 200–207. [CrossRef][PubMed]
38. Hawkes, J.S.; Bryan, D.L.; Neumann, M.A.; Makrides, M.; Gibson, R.A. Transforming growth factor betain human milk does not change in response to modest intakes of docosahexaenoic acid. Lipids 2001, 36,1179–1181. [CrossRef] [PubMed]
39. Lee, S.Y.; Kang, M.J.; Kwon, J.W.; Park, K.S.; Hong, S.J. Breastfeeding might have protective effects onatopy in children with the CD14C-159T CT/CC genotype. Allergy Asthma Immunol. Res. 2013, 5, 239–241.[CrossRef] [PubMed]
Nutrients 2016, 8, 695 14 of 14
40. Takahata, Y.; Takada, H.; Nomura, A.; Ohshima, K.; Nakayama, H.; Tsuda, T.; Nakano, H.; Hara, T.Interleukin-18 in human milk. Pediatr. Res. 2001, 50, 268–272. [CrossRef] [PubMed]
41. Ustundag, B.; Yilmaz, E.; Dogan, Y.; Akarsu, S.; Canatan, H.; Halifeoglu, I.; Cikim, G.; Aygun, A.D. Levels ofcytokines (IL-1beta, IL-2, IL-6, IL-8, TNF-alpha) and trace elements (Zn, Cu) in breast milk from mothers ofpreterm and term infants. Mediat. Inflamm. 2005, 2005, 331–336. [CrossRef] [PubMed]
42. Soto-Ramirez, N.; Karmaus, W.; Yousefi, M.; Zhang, H.; Liu, J.; Gangur, V. Maternal immune markers inserum during gestation and in breast milk and the risk of asthma-like symptoms at ages 6 and 12 months:A longitudinal study. Allergy Asthma Clin. Immunol. 2012, 8, 11. [CrossRef] [PubMed]
43. Laverty, H.G.; Wakefield, L.M.; Occleston, N.L.; O’Kane, S.; Ferguson, M.W. TGF-β3 and cancer: A review.Cytokine Growth Factor Rev. 2009, 20, 305–317. [CrossRef] [PubMed]
44. Nguyen, A.V.; Pollard, J.W. Transforming growth factor beta3 induces cell death during the first stage ofmammary gland involution. Development 2000, 127, 3107–3118. [PubMed]
45. Ogawa, J.; Sasahara, A.; Yoshida, T.; Sira, M.M.; Futatani, T.; Kanegane, H.; Miyawaki, T. Role of transforminggrowth factor-beta in breast milk for initiation of IgA production in newborn infants. Early Hum. Dev. 2004,77, 67–75. [CrossRef] [PubMed]
© 2016 by the authors; licensee MDPI, Basel, Switzerland. This article is an open accessarticle distributed under the terms and conditions of the Creative Commons Attribution(CC-BY) license (http://creativecommons.org/licenses/by/4.0/).