Color in Information Display - UC Berkeleyvis.berkeley.edu/courses/cs294-10-sp10/WWW/... · 3 Color...
19
1 Color M hA l Maneesh Agrawala CS 294-10: Visualization Spring 2010 Final project Design new visualization method Pose problem, Implement creative solution Deliverables Implementation of solution 8-12 page paper in format of conference paper submission 2 design discussion presentations Schedule Project proposal: 3/29 Initial problem presentation: 3/31 Midpoint design discussion: TBD Final paper and presentation: TBD Grading Groups of up to 3 people, graded individually Clearly report responsibilities of each member Color in Information Display Maureen Stone StoneSoup Consulting What is Color? Physical World Visual System Mental Models Lights, surfaces, objects Eye, optic nerve, visual t Red, green, brown Bright, light, dark, cortex vivid, colorful, dull Warm, cool, bold, blah, attractive, ugly, pleasant, jarring Perception and Cognition
Transcript of Color in Information Display - UC Berkeleyvis.berkeley.edu/courses/cs294-10-sp10/WWW/... · 3 Color...

1
Color
M h A lManeesh Agrawala
CS 294-10: Visualization
Spring 2010
Final projectDesign new visualization method
Pose problem, Implement creative solution
Deliverables Implementation of solution 8-12 page paper in format of conference paper submission 2 design discussion presentationsg p
Schedule Project proposal: 3/29 Initial problem presentation: 3/31 Midpoint design discussion: TBD Final paper and presentation: TBD
Grading Groups of up to 3 people, graded individually Clearly report responsibilities of each member
Color in Information Display
Maureen StoneStoneSoup Consulting
What is Color?
Physical World Visual System Mental Models
Lights, surfaces, objects
Eye, optic nerve, visual
t
Red, green, brown
Bright, light, dark, cortex
g , g , ,vivid, colorful, dull
Warm, cool, bold, blah, attractive, ugly,
pleasant, jarring
Perception and Cognition

2
Color Models
Physical World Visual System Mental Models
Opponent Encoding
Separate lightness,
LightEnergy
Spectral distribution
ConeResponse
Encode as three values
Appearance Models
Color in Context
Perceptual Models
Color “Space”
chroma
(A,R-G,Y-B)
functions
F()
(L,M,S)
CIE (X,Y,Z) Adaptation
BackgroundSize …
CIECAM02
Hue lightnesssaturation
CIELABMunsell(HVC)
Physical World
Spectral Distribution• Visible light• Power vs. wavelength
Any source• Direct• Transmitted• Reflected• Refracted
From A Field Guide to Digital Color, © A.K. Peters, 2003
Cone Response
Encode spectra as three values• Long, medium and short (LMS)• Trichromacy: only LMS is “seen”• Different spectra can “look the same”
Sort of like a digital camera*
From A Field Guide to Digital Color, © A.K. Peters, 2003
Effects of Retinal Encoding
All spectra that stimulate the same cone responseare indistinguishable
Metameric match

3
Color Measurement
CIE Standard ObserverCIE tristimulus values (XYZ)All spectra that stimulate the same tristimulus
(XYZ) response are indistinguishable
From A Field Guide to Digital Color, © A.K. Peters, 2003
Project X,Y,Z on a plane to separate colorfulness from brightness
X/(X+Y+Z)
Chromaticity Diagram
x = X/(X+Y+Z)y = Y/(X+Y+Z)z = Z/(X+Y+Z)
1 = x+y+z
Courtesy of PhotoResearch, Inc.
Project X,Y,Z on a plane to separate colorfulness from brightness
X/(X+Y+Z)
Chromaticity Diagram
x = X/(X+Y+Z)y = Y/(X+Y+Z)z = Z/(X+Y+Z)
1 = x+y+z
RGB Chromaticity
R,G,B are points (varying lightness)Sum of two colors lies on lineGamut is a triangle
• White/gray/blacknear center
• Saturated colorson edges

4
Display Gamuts
From A Field Guide to Digital Color, © A.K. Peters, 2003
Projector Gamuts
From A Field Guide to Digital Color, © A.K. Peters, 2003
Color Models
Physical World Visual System Mental Models
Opponent Encoding
Separate lightness,
LightEnergy
Spectral distribution
ConeResponse
Encode as three values
Appearance Models
Color in Context
Perceptual Models
Color “Space”
chroma
(A,R-G,Y-B)
functions
F()
(L,M,S)
CIE (X,Y,Z) Adaptation,Background,
Size, …
CIECAM02
Hue, lightnesssaturation
CIELABMunsell(HVC)
Separate lightness, chroma
Color blindness
Image encoding
Opponent Color
Definition• Achromatic axis• R-G and Y-B axis• Separate lightness from chroma channels
First level encoding• Linear combination of LMS• Before optic nerve• Basis for perception• Defines “color blindness”

5
Vischeck
Simulates color vision deficiencies• Web service or Photoshop plug-in• Robert Dougherty and Alex Wade
www.vischeck.com
Deuteranope Protanope Tritanope
2D Color Space
Perceptual Color Spaces
Unique black and whiteUniform differences
Perception & design
Lightness
Hue
Colorfulness
Munsell Atlas
Courtesy Gretag-Macbeth
6
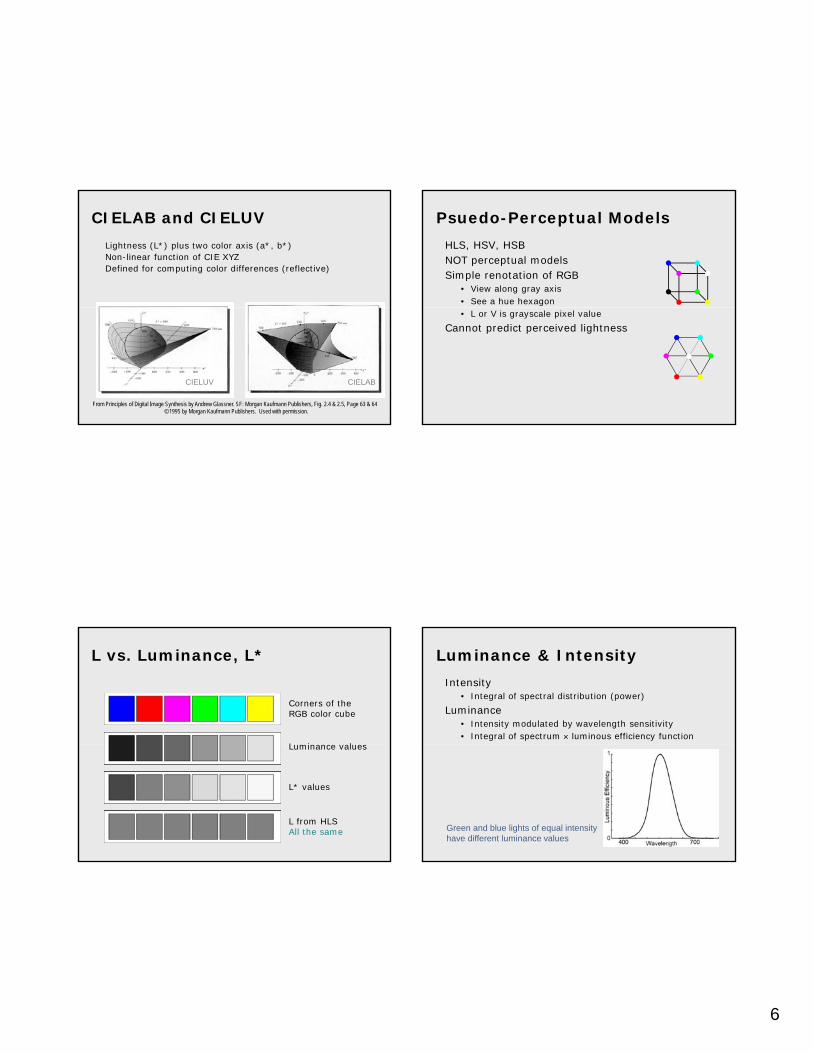
CIELAB and CIELUV
Lightness (L*) plus two color axis (a*, b*)Non-linear function of CIE XYZDefined for computing color differences (reflective)
CIELABCIELUV
From Principles of Digital Image Synthesis by Andrew Glassner. SF: Morgan Kaufmann Publishers, Fig. 2.4 & 2.5, Page 63 & 64© 1995 by Morgan Kaufmann Publishers. Used with permission.
Psuedo-Perceptual Models
HLS, HSV, HSBNOT perceptual modelsSimple renotation of RGB
• View along gray axis• See a hue hexagon• L or V is grayscale pixel value
Cannot predict perceived lightness
L vs. Luminance, L*
Luminance values
Corners of the RGB color cube
Luminance values
L* values
L from HLSAll the same
Luminance & Intensity
Intensity • Integral of spectral distribution (power)
Luminance • Intensity modulated by wavelength sensitivity• Integral of spectrum luminous efficiency function
Green and blue lights of equal intensityhave different luminance values
7
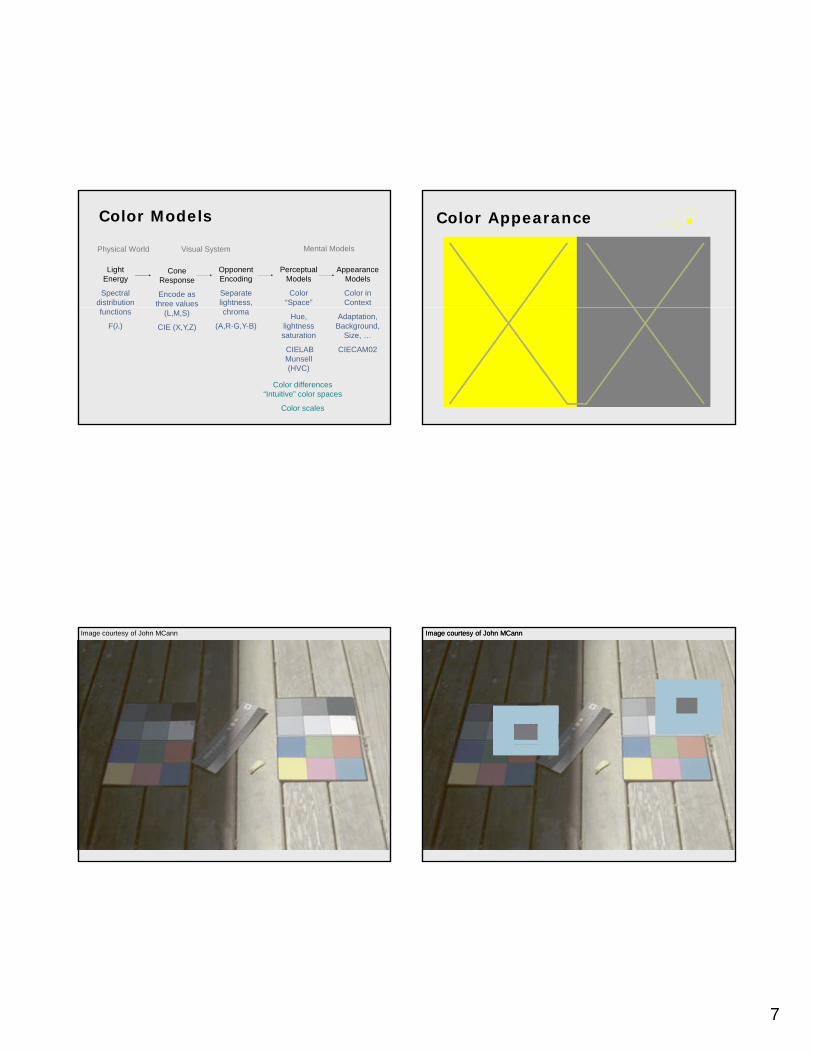
Color Models
Physical World Visual System Mental Models
Opponent Encoding
Separate lightness,
LightEnergy
Spectral distribution
ConeResponse
Encode as three values
Appearance Models
Color in Context
Perceptual Models
Color “Space”
chroma
(A,R-G,Y-B)
functions
F()
(L,M,S)
CIE (X,Y,Z) Adaptation,Background,
Size, …
CIECAM02
Hue, lightnesssaturation
CIELABMunsell(HVC)
Color differences“Intuitive” color spaces
Color scales
Color Appearance
Image courtesy of John MCann Image courtesy of John MCannImage courtesy of John MCann

8
Color Appearance
More than a single color• Adjacent colors (background)• Viewing environment (surround)
Appearance effects• Adaptation
surround• Simultaneous contrast• Spatial effects
Color in context
Color Appearance ModelsColor Appearance ModelsMark FairchildMark Fairchild
surround
background
stimulus
Simultaneous Contrast
Add Opponent Color• Dark adds light• Red adds green• Blue adds yellow
These samples will have both light/dark and hue contrast
Affects Lightness Scale Bezold Effect
9
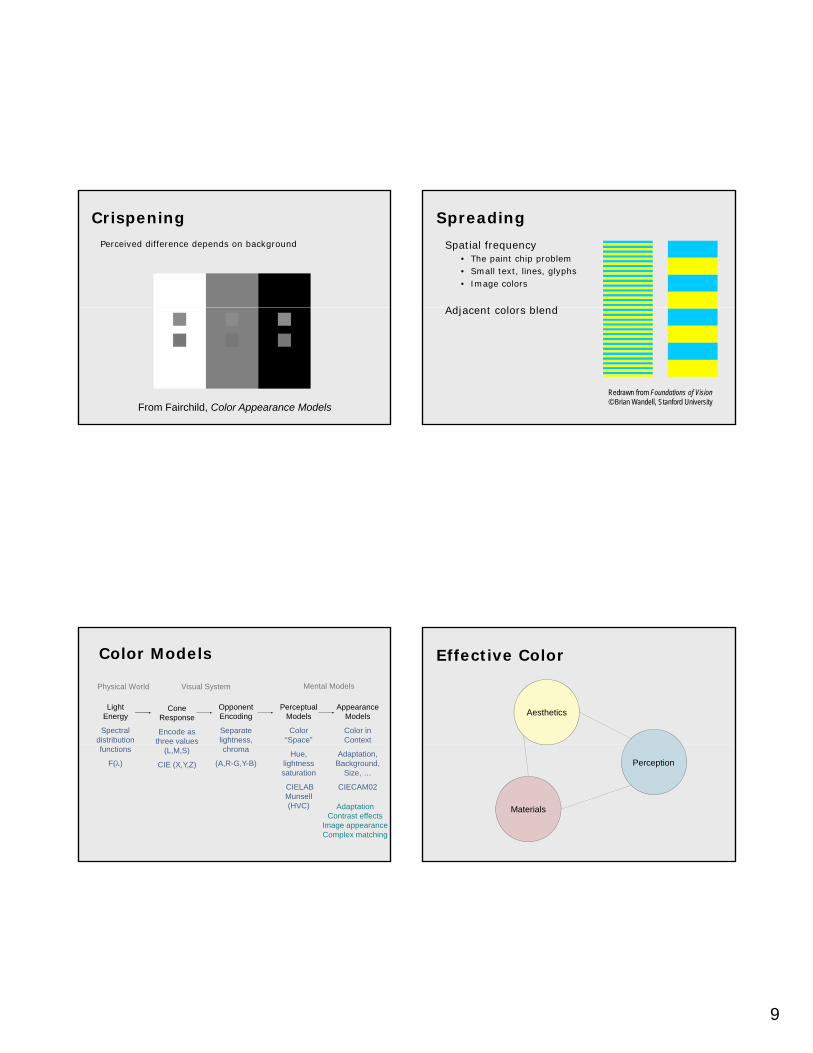
CrispeningPerceived difference depends on background
From Fairchild, Color Appearance Models
Spreading
Spatial frequency• The paint chip problem• Small text, lines, glyphs• Image colors
Adj t l bl dAdjacent colors blend
Redrawn from Foundations of Vision© Brian Wandell, Stanford University
Color Models
Physical World Visual System Mental Models
Opponent Encoding
Separate lightness,
LightEnergy
Spectral distribution
ConeResponse
Encode as three values
Appearance Models
Color in Context
Perceptual Models
Color “Space”
chroma
(A,R-G,Y-B)
functions
F()
(L,M,S)
CIE (X,Y,Z) Adaptation,Background,
Size, …
CIECAM02
Hue, lightnesssaturation
CIELABMunsell(HVC) Adaptation
Contrast effectsImage appearanceComplex matching
Effective Color
Aesthetics
Materials
Perception

10
What makes color effective?
“Good ideas executed with superb craft”—E.R. Tufte
Effective color needs a context• Immediate vs. studied• Anyone vs. specialist• Critical vs. contextual• Culture and expectations• Time and money
Why Should You Care?
Poorly designed color is confusing• Creates visual clutter• Misdirects attention
Poor design devalues the information• Visual sophistication• Evolution of document and web design
“Attractive things work better”—Don Norman
Information Display
Graphical presentation of information• Charts, graphs, diagrams, maps, illustrations• Originally hand-crafted, static• Now computer-generated, dynamic
Color is a key component• Color labels and groups• Color scales (colormaps)• Multi-variate color encoding• Color shading and textures• And more…
www.nps.gov
Color Design Terminology
Hue (color wheel)• Red, yellow, blue (primary)• Orange, green, purple (secondary)• Opposites complement (contrast)• Adjacent are analogous• Many different color wheels*
*See www.handprint.com for examples
Chroma (saturation) • Intensity or purity• Distance from gray
Value (lightness)• Dark to light• Applies to all colors, not just gray

11
Tints and Tones
Tone or shade• Hue + black• Decrease saturation• Decrease lightness
Tint• Hue + white• Decrease saturation• Increase lightness
Gradations
Color Design Principles
Control value (lightness)• Ensure legibility• Avoid unwanted emphasis
Use a limited hue palette• Control color “pop out”• Define color grouping• Avoid clutter from too many competing colors
Use neutral backgrounds• Control impact of color• Minimize simultaneous contrast
Envisioning Information
“… avoiding catastrophe becomes the first principle in bringing color to information:
Above all, do no harm.”
—E. R. Tufte
www.edwardtufte.com

12
Fundamental Uses
To labelTo measureTo represent or to imitate realityTo enliven or decorate
To Label
Identify by Color
Information VisualizationInformation VisualizationColin WareColin Ware
Product Categories
Created by Tableau - Visual Analysis for DatabasesTM

13
Grouping, Highlighting Considerations for Labels
How critical is the color encoding?• Unique specification or is it a “hint”?• Quick response, or time for inspection?• Is there a legend, or need it be memorized?
Contextual issues• Are there established semantics?• Grouping or ordering relationships?• Surrounding shapes and colors?
Shape and structural issues• How big are the objects? • How many objects, and could they overlap?• Need they be readable, or only visible?
Controls and Alerts
Aircraft cockpit design• Quick response• Critical information and conditions• Memorized• 5-7 unique colors, easily distinguishable
Highway signsg y g• Quick response• Critical but redundant information• 10-15 colors?
Typical color desktop• Aid to search• Redundant information• Personal and decorative• How many colors?
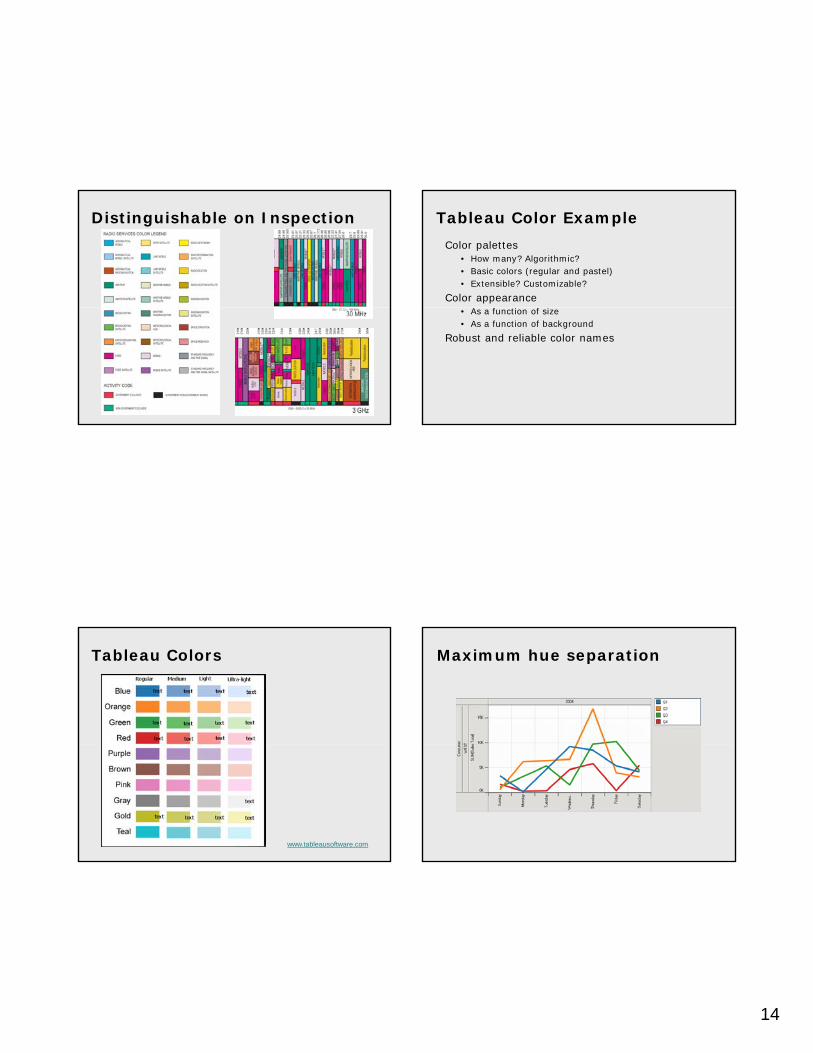
Radio Spectrum Map (33 colors)
http://www.cybergeography.org/atlas/us_spectrum_map.pdf
14
Distinguishable on Inspection Tableau Color Example
Color palettes• How many? Algorithmic?• Basic colors (regular and pastel)• Extensible? Customizable?
Color appearance• As a function of size• As a function of background
Robust and reliable color names
Tableau Colors
www.tableausoftware.com
Maximum hue separation
15
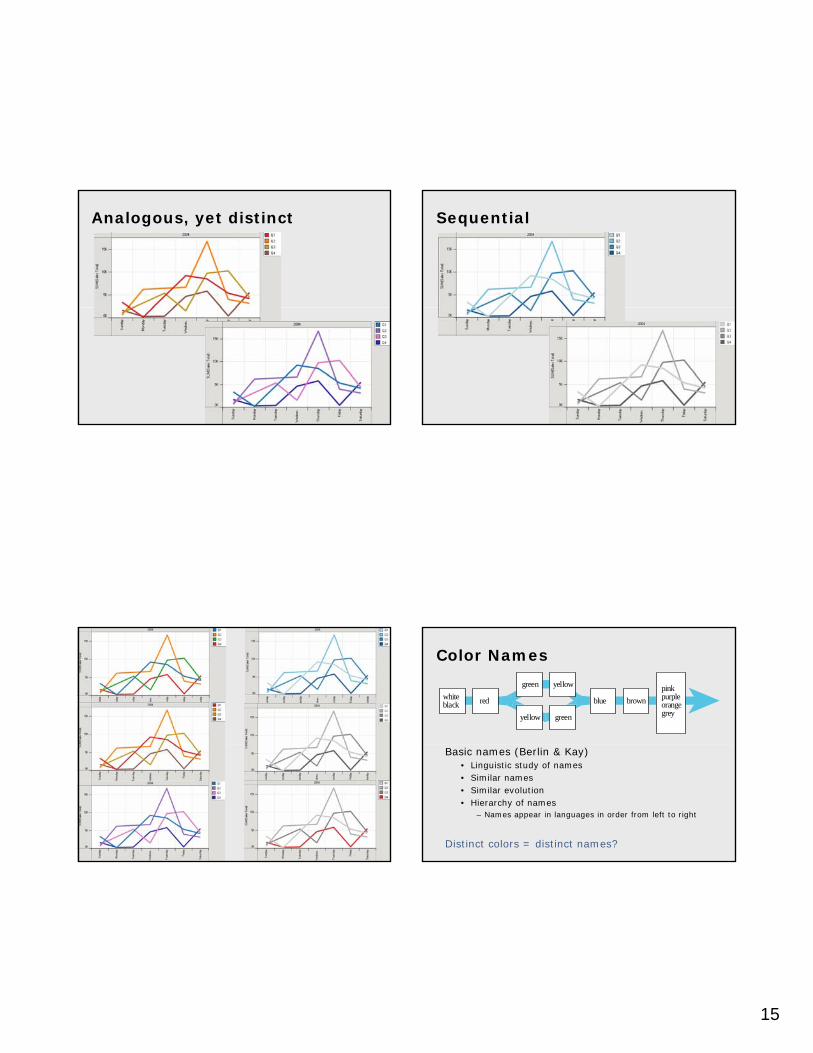
Analogous, yet distinct Sequential
Color Names
whiteblack
green yellow
green
blue brown
pinkpurpleorangegrey
red
yellow
Basic names (Berlin & Kay)• Linguistic study of names• Similar names• Similar evolution• Hierarchy of names
– Names appear in languages in order from left to right
Distinct colors = distinct names?

16
Distinct, but hard to name Color Names Research
Selection by name• Berk, Brownston & Kaufman, 1982• Meier, et. al. 2003
Image recoloring• Saito, et. al.
Labels in visualization• D’Zmura, Cowan (pop out conditions)• Healey & Booth (automatic selection)
Web experiment• Moroney, et. al. 2003
World Color Survey (Kay & Cook)• http://www.icsi.berkeley.edu/wcs/
To Measure
Data to Color
Types of data values• Nominal, ordinal, numeric• Qualitative, sequential, diverging
Types of color scales• Hue scale
l (l b l )– Nominal (labels)– Cyclic (learned order)
• Lightness or saturation scales– Ordered scales– Lightness best for high frequency– More = darker (or more saturated)– Most accurate if quantized

17
Color Scales
Long history in graphics and visualization• Ware, Robertson et. al• Levkowitz et. al• Rheingans
PRAVDA Color• Rogowitz and Treinish• IBM Research
Cartography• Cynthia Brewer • ColorBrewer
Different Scales
Rogowitz & Treinish, “How not to lie with visualization”
Density Map
Lightness scale
Lightness scalewith hue and
chroma variationHue scale with
lightness variation
Phase Diagrams (hue scale)Singularities occur where all colors meet
The optical singularities of bianisotropic crystals, by M. V. Berry
18
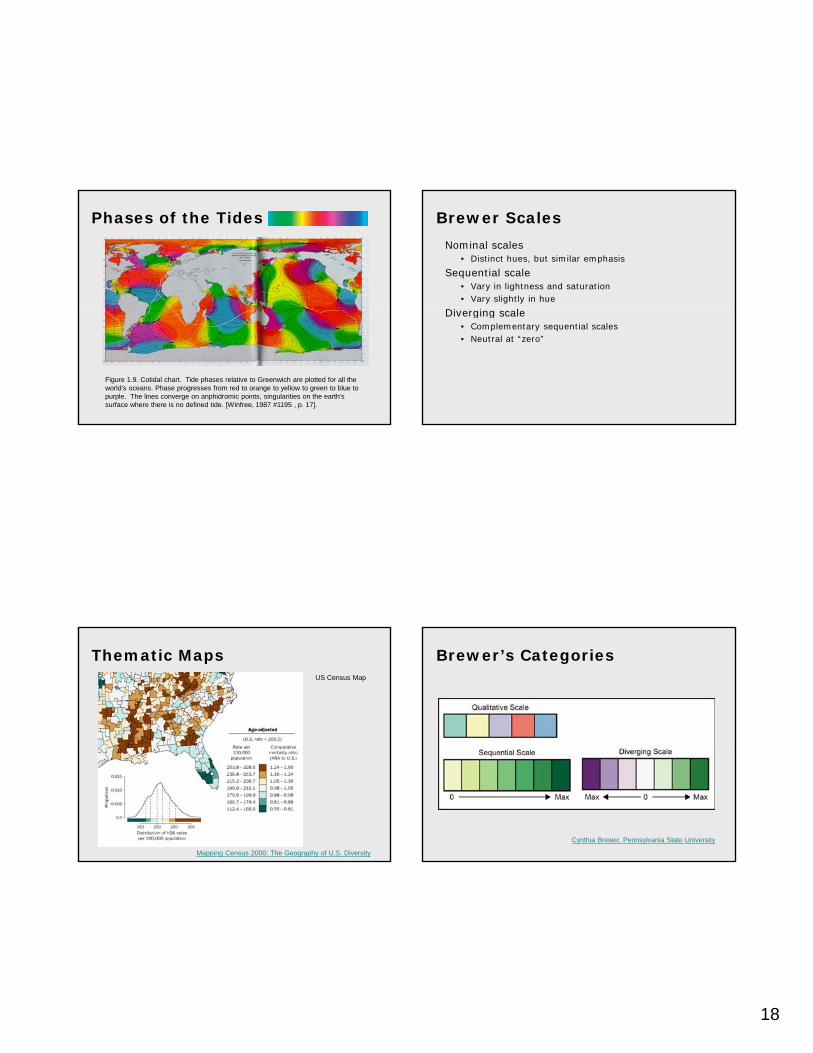
Phases of the Tides
Figure 1.9. Cotidal chart. Tide phases relative to Greenwich are plotted for all the world’s oceans. Phase progresses from red to orange to yellow to green to blue to purple. The lines converge on anphidromic points, singularities on the earth’s surface where there is no defined tide. [Winfree, 1987 #1195 , p. 17].
Brewer Scales
Nominal scales• Distinct hues, but similar emphasis
Sequential scale• Vary in lightness and saturation• Vary slightly in hue
Diverging scale• Complementary sequential scales• Neutral at “zero”
Thematic MapsUS Census Map
Mapping Census 2000: The Geography of U.S. Diversity
Brewer’s Categories
Cynthia Brewer, Pennsylvania State University

19
Color Brewer
www.colorbrewer.org