
Collision of continental corner from 3-D numerical...
14
Earth and Planetary Science Letters 380 (2013) 98–111 Contents lists available at ScienceDirect Earth and Planetary Science Letters www.elsevier.com/locate/epsl Collision of continental corner from 3-D numerical modeling Zhong-Hai Li a,∗ , Zhiqin Xu a , Taras Gerya b,c , Jean-Pierre Burg d a State Key Lab of Continental Tectonics and Dynamics, Institute of Geology, Chinese Academy of Geological Sciences, Beijing, China b Institute of Geophysics, Department of Earth Sciences, ETH-Zurich, Switzerland c Geology Department, Moscow State University, Moscow, Russia d Geological Institute, Department of Earth Sciences, ETH and University Zurich, Switzerland article info abstract Article history: Received 3 March 2013 Received in revised form 10 August 2013 Accepted 16 August 2013 Available online xxxx Editor: C. Sotin Keywords: continental collision lateral extrusion slab break-off 3-D numerical modeling Himalaya Zagros Continental collision has been extensively investigated with 2-D numerical models assuming infinitely wide plates or insignificant along-strike deformation in the third dimension. However, the corners of natural collision zones normally have structural characteristics that differ from linear parts of mountain belt. We conducted 3-D high-resolution numerical simulations to study the dynamics of a continental corner (lateral continental/oceanic transition zone) during subduction/collision. The results demonstrate different modes between the oceanic subduction side (continuous subduction and retreating trench) and the continental collision side (slab break-off and topography uplift). Slab break-off occurs at a depth (100 km to ∼300 km) that depends on the convergence velocity. The numerical models produce lateral extrusion of the overriding crust from the collisional side to the subduction side, which is also a phenomenon recognized around natural collision of continental corners, for instance around the western corner of the Arabia–Asia collision zone and around the eastern corner of the India–Asia collision zone. Modeling results also indicate that extrusion tectonics may be driven both from above by the topography and gravitational potentials and from below by the trench retreat and asthenospheric mantle return flow, which supports the link between deep mantle dynamics and shallower crustal deformation. © 2013 Elsevier B.V. All rights reserved. 1. Introduction Continental subduction and collision normally follows oceanic subduction under the combined convergent forces of ‘ridge push’ and/or oceanic ‘slab pull’ (e.g., Turcotte and Schubert, 2002). Be- sides the systematic geological/petrological studies of recent con- tinental collision zones (e.g., Alpine–Zagros–Himalayan belt), ana- logue (e.g., Chemenda et al., 1995, 1996, 2000; Boutelier et al., 2004) and numerical models (e.g., Beaumont et al., 2001, 2009; Burov et al., 2001; Liu et al., 2004; Toussaint et al., 2004; Burg and Gerya, 2005; Sobolev and Babeyko, 2005; Gerya et al., 2008a; Yamato et al., 2007, 2008; Warren et al., 2008; Li and Gerya, 2009; Li et al., 2010, 2011; Chen et al., 2013) are also widely used and become more and more substantial to investigate continental sub- duction/collision processes. The numerical tectonic styles of con- tinental subduction/collision can be either “one-sided” (overriding plate does not subduct) or “two-sided” (both plates subduct to- gether) (Tao and O’Connell, 1992; Pope and Willett, 1998; Faccenda et al., 2008; Warren et al., 2008; Li et al., 2011). Several other pos- sibilities such as thickening, slab drips (e.g., Toussaint et al., 2004) and slab break-off (e.g., Duretz et al., 2011, 2012; Van Hunen and Allen, 2011) have been put forward. The one-sided style can be * Corresponding author. E-mail address: [email protected] (Z.-H. Li). further divided into steep (high angle) and flat (low angle) subduc- tion/collision zones, resulting in different structures, stress states and deformation styles in the converging plates as well as differ- ent metamorphic pressure conditions of the exhumed wedge rocks (e.g., Li et al., 2011). However, most of the models mentioned in the previous sec- tion are based on the 2-D regime, assuming that the plate is infinitely wide or that along-strike deformation in the third di- mension can be neglected. 2-D models are indeed relevant to study the general processes and dynamics in the continental sub- duction channels and/or the interior of the continental collision zones, but far from curvilinear areas such as the continental cor- ners. Recent 3-D numerical models of oceanic subduction, without continental collision, revealed different characteristics and scal- ing laws between the lateral edges and the interior of subduct- ing slabs (e.g., Schellart et al., 2011; Li and Ribe, 2012). In na- ture, convergent continents have borders with transition to oceanic plates or to other continents. In addition, the corners of the natu- ral collision zones normally have structures different from those of linear mountain belts. For example, the geological/petrologi- cal characteristics and deep structures of the western and eastern Himalayan syntaxes are very different from those of the central Himalayas (e.g. Burg et al., 1997; Burg and Podladchikov, 1999, 2000; Zeitler et al., 2001; Yin, 2006; Burg and Schmalholz, 2008; Guillot et al., 2008; Oreshin et al., 2008). Therefore, 3-D numerical 0012-821X/$ – see front matter © 2013 Elsevier B.V. All rights reserved. http://dx.doi.org/10.1016/j.epsl.2013.08.034
Transcript of Collision of continental corner from 3-D numerical...
Earth and Planetary Science Letters 380 (2013) 98–111
Contents lists available at ScienceDirect
Earth and Planetary Science Letters
www.elsevier.com/locate/epsl
Collision of continental corner from 3-D numerical modeling
Zhong-Hai Li a,∗, Zhiqin Xu a, Taras Gerya b,c, Jean-Pierre Burg d
a State Key Lab of Continental Tectonics and Dynamics, Institute of Geology, Chinese Academy of Geological Sciences, Beijing, Chinab Institute of Geophysics, Department of Earth Sciences, ETH-Zurich, Switzerlandc Geology Department, Moscow State University, Moscow, Russiad Geological Institute, Department of Earth Sciences, ETH and University Zurich, Switzerland
a r t i c l e i n f o a b s t r a c t
Article history:Received 3 March 2013Received in revised form 10 August 2013Accepted 16 August 2013Available online xxxxEditor: C. Sotin
Keywords:continental collisionlateral extrusionslab break-off3-D numerical modelingHimalayaZagros
Continental collision has been extensively investigated with 2-D numerical models assuming infinitelywide plates or insignificant along-strike deformation in the third dimension. However, the corners ofnatural collision zones normally have structural characteristics that differ from linear parts of mountainbelt. We conducted 3-D high-resolution numerical simulations to study the dynamics of a continentalcorner (lateral continental/oceanic transition zone) during subduction/collision. The results demonstratedifferent modes between the oceanic subduction side (continuous subduction and retreating trench) andthe continental collision side (slab break-off and topography uplift). Slab break-off occurs at a depth(�100 km to ∼300 km) that depends on the convergence velocity. The numerical models producelateral extrusion of the overriding crust from the collisional side to the subduction side, which is also aphenomenon recognized around natural collision of continental corners, for instance around the westerncorner of the Arabia–Asia collision zone and around the eastern corner of the India–Asia collision zone.Modeling results also indicate that extrusion tectonics may be driven both from above by the topographyand gravitational potentials and from below by the trench retreat and asthenospheric mantle return flow,which supports the link between deep mantle dynamics and shallower crustal deformation.
© 2013 Elsevier B.V. All rights reserved.
1. Introduction
Continental subduction and collision normally follows oceanicsubduction under the combined convergent forces of ‘ridge push’and/or oceanic ‘slab pull’ (e.g., Turcotte and Schubert, 2002). Be-sides the systematic geological/petrological studies of recent con-tinental collision zones (e.g., Alpine–Zagros–Himalayan belt), ana-logue (e.g., Chemenda et al., 1995, 1996, 2000; Boutelier et al.,2004) and numerical models (e.g., Beaumont et al., 2001, 2009;Burov et al., 2001; Liu et al., 2004; Toussaint et al., 2004; Burgand Gerya, 2005; Sobolev and Babeyko, 2005; Gerya et al., 2008a;Yamato et al., 2007, 2008; Warren et al., 2008; Li and Gerya, 2009;Li et al., 2010, 2011; Chen et al., 2013) are also widely used andbecome more and more substantial to investigate continental sub-duction/collision processes. The numerical tectonic styles of con-tinental subduction/collision can be either “one-sided” (overridingplate does not subduct) or “two-sided” (both plates subduct to-gether) (Tao and O’Connell, 1992; Pope and Willett, 1998; Faccendaet al., 2008; Warren et al., 2008; Li et al., 2011). Several other pos-sibilities such as thickening, slab drips (e.g., Toussaint et al., 2004)and slab break-off (e.g., Duretz et al., 2011, 2012; Van Hunen andAllen, 2011) have been put forward. The one-sided style can be
* Corresponding author.E-mail address: [email protected] (Z.-H. Li).
0012-821X/$ – see front matter © 2013 Elsevier B.V. All rights reserved.http://dx.doi.org/10.1016/j.epsl.2013.08.034
further divided into steep (high angle) and flat (low angle) subduc-tion/collision zones, resulting in different structures, stress statesand deformation styles in the converging plates as well as differ-ent metamorphic pressure conditions of the exhumed wedge rocks(e.g., Li et al., 2011).
However, most of the models mentioned in the previous sec-tion are based on the 2-D regime, assuming that the plate isinfinitely wide or that along-strike deformation in the third di-mension can be neglected. 2-D models are indeed relevant tostudy the general processes and dynamics in the continental sub-duction channels and/or the interior of the continental collisionzones, but far from curvilinear areas such as the continental cor-ners. Recent 3-D numerical models of oceanic subduction, withoutcontinental collision, revealed different characteristics and scal-ing laws between the lateral edges and the interior of subduct-ing slabs (e.g., Schellart et al., 2011; Li and Ribe, 2012). In na-ture, convergent continents have borders with transition to oceanicplates or to other continents. In addition, the corners of the natu-ral collision zones normally have structures different from thoseof linear mountain belts. For example, the geological/petrologi-cal characteristics and deep structures of the western and easternHimalayan syntaxes are very different from those of the centralHimalayas (e.g. Burg et al., 1997; Burg and Podladchikov, 1999,2000; Zeitler et al., 2001; Yin, 2006; Burg and Schmalholz, 2008;Guillot et al., 2008; Oreshin et al., 2008). Therefore, 3-D numerical
Z.-H. Li et al. / Earth and Planetary Science Letters 380 (2013) 98–111 99
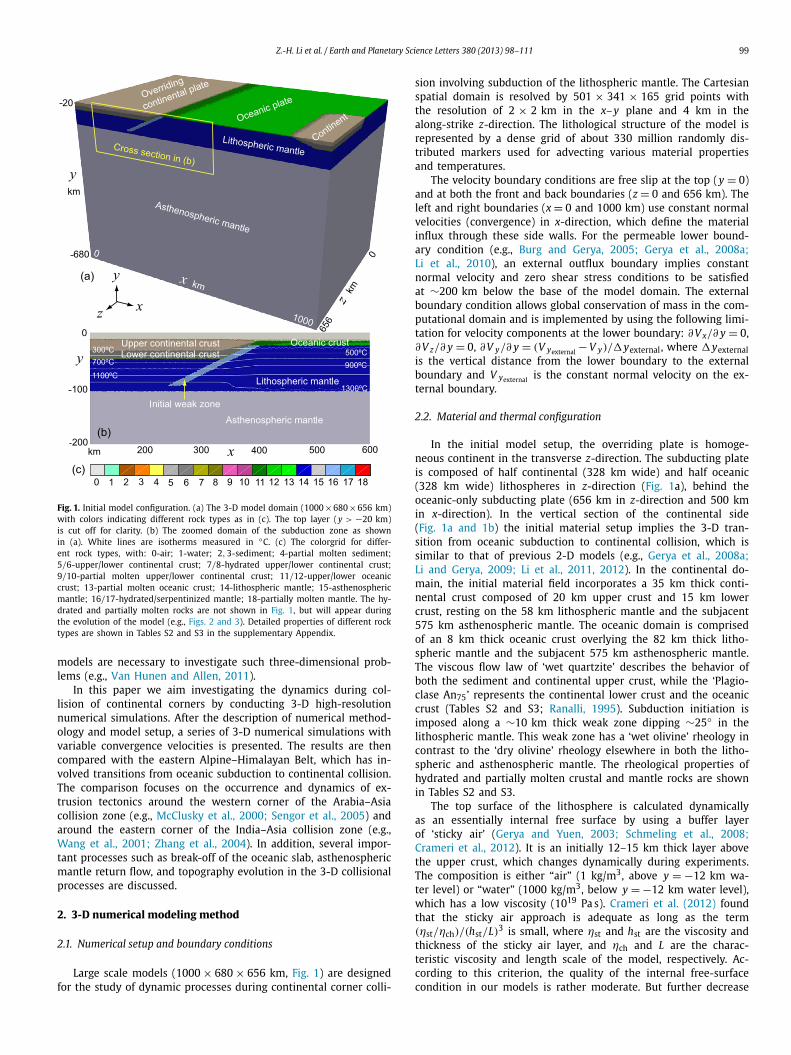
Fig. 1. Initial model configuration. (a) The 3-D model domain (1000×680×656 km)with colors indicating different rock types as in (c). The top layer (y > −20 km)is cut off for clarity. (b) The zoomed domain of the subduction zone as shownin (a). White lines are isotherms measured in ◦C. (c) The colorgrid for differ-ent rock types, with: 0-air; 1-water; 2,3-sediment; 4-partial molten sediment;5/6-upper/lower continental crust; 7/8-hydrated upper/lower continental crust;9/10-partial molten upper/lower continental crust; 11/12-upper/lower oceaniccrust; 13-partial molten oceanic crust; 14-lithospheric mantle; 15-asthenosphericmantle; 16/17-hydrated/serpentinized mantle; 18-partially molten mantle. The hy-drated and partially molten rocks are not shown in Fig. 1, but will appear duringthe evolution of the model (e.g., Figs. 2 and 3). Detailed properties of different rocktypes are shown in Tables S2 and S3 in the supplementary Appendix.
models are necessary to investigate such three-dimensional prob-lems (e.g., Van Hunen and Allen, 2011).
In this paper we aim investigating the dynamics during col-lision of continental corners by conducting 3-D high-resolutionnumerical simulations. After the description of numerical method-ology and model setup, a series of 3-D numerical simulations withvariable convergence velocities is presented. The results are thencompared with the eastern Alpine–Himalayan Belt, which has in-volved transitions from oceanic subduction to continental collision.The comparison focuses on the occurrence and dynamics of ex-trusion tectonics around the western corner of the Arabia–Asiacollision zone (e.g., McClusky et al., 2000; Sengor et al., 2005) andaround the eastern corner of the India–Asia collision zone (e.g.,Wang et al., 2001; Zhang et al., 2004). In addition, several impor-tant processes such as break-off of the oceanic slab, asthenosphericmantle return flow, and topography evolution in the 3-D collisionalprocesses are discussed.
2. 3-D numerical modeling method
2.1. Numerical setup and boundary conditions
Large scale models (1000 × 680 × 656 km, Fig. 1) are designedfor the study of dynamic processes during continental corner colli-
sion involving subduction of the lithospheric mantle. The Cartesianspatial domain is resolved by 501 × 341 × 165 grid points withthe resolution of 2 × 2 km in the x–y plane and 4 km in thealong-strike z-direction. The lithological structure of the model isrepresented by a dense grid of about 330 million randomly dis-tributed markers used for advecting various material propertiesand temperatures.
The velocity boundary conditions are free slip at the top (y = 0)and at both the front and back boundaries (z = 0 and 656 km). Theleft and right boundaries (x = 0 and 1000 km) use constant normalvelocities (convergence) in x-direction, which define the materialinflux through these side walls. For the permeable lower bound-ary condition (e.g., Burg and Gerya, 2005; Gerya et al., 2008a;Li et al., 2010), an external outflux boundary implies constantnormal velocity and zero shear stress conditions to be satisfiedat ∼200 km below the base of the model domain. The externalboundary condition allows global conservation of mass in the com-putational domain and is implemented by using the following limi-tation for velocity components at the lower boundary: ∂V x/∂ y = 0,∂V z/∂ y = 0, ∂V y/∂ y = (V yexternal − V y)/�yexternal, where �yexternalis the vertical distance from the lower boundary to the externalboundary and V yexternal is the constant normal velocity on the ex-ternal boundary.
2.2. Material and thermal configuration
In the initial model setup, the overriding plate is homoge-neous continent in the transverse z-direction. The subducting plateis composed of half continental (328 km wide) and half oceanic(328 km wide) lithospheres in z-direction (Fig. 1a), behind theoceanic-only subducting plate (656 km in z-direction and 500 kmin x-direction). In the vertical section of the continental side(Fig. 1a and 1b) the initial material setup implies the 3-D tran-sition from oceanic subduction to continental collision, which issimilar to that of previous 2-D models (e.g., Gerya et al., 2008a;Li and Gerya, 2009; Li et al., 2011, 2012). In the continental do-main, the initial material field incorporates a 35 km thick conti-nental crust composed of 20 km upper crust and 15 km lowercrust, resting on the 58 km lithospheric mantle and the subjacent575 km asthenospheric mantle. The oceanic domain is comprisedof an 8 km thick oceanic crust overlying the 82 km thick litho-spheric mantle and the subjacent 575 km asthenospheric mantle.The viscous flow law of ‘wet quartzite’ describes the behavior ofboth the sediment and continental upper crust, while the ‘Plagio-clase An75’ represents the continental lower crust and the oceaniccrust (Tables S2 and S3; Ranalli, 1995). Subduction initiation isimposed along a ∼10 km thick weak zone dipping ∼25◦ in thelithospheric mantle. This weak zone has a ‘wet olivine’ rheology incontrast to the ‘dry olivine’ rheology elsewhere in both the litho-spheric and asthenospheric mantle. The rheological properties ofhydrated and partially molten crustal and mantle rocks are shownin Tables S2 and S3.
The top surface of the lithosphere is calculated dynamicallyas an essentially internal free surface by using a buffer layerof ‘sticky air’ (Gerya and Yuen, 2003; Schmeling et al., 2008;Crameri et al., 2012). It is an initially 12–15 km thick layer abovethe upper crust, which changes dynamically during experiments.The composition is either “air” (1 kg/m3, above y = −12 km wa-ter level) or “water” (1000 kg/m3, below y = −12 km water level),which has a low viscosity (1019 Pa s). Crameri et al. (2012) foundthat the sticky air approach is adequate as long as the term(ηst/ηch)/(hst/L)3 is small, where ηst and hst are the viscosity andthickness of the sticky air layer, and ηch and L are the charac-teristic viscosity and length scale of the model, respectively. Ac-cording to this criterion, the quality of the internal free-surfacecondition in our models is rather moderate. But further decrease
100 Z.-H. Li et al. / Earth and Planetary Science Letters 380 (2013) 98–111
in the ‘sticky air’ viscosity and/or increase in its thickness areprecluded by numerical limitations of the multigrid solver con-vergence. Indeed, the large viscosity contrast caused by this low-viscosity boundary layer minimizes shear stresses (<105 Pa) at thetop of the solid portion of the model (Burg and Gerya, 2005). Forsimplicity, surface erosion and sedimentation are neglected, whichis a first order approximation acceptable at the considered timeand space scales.
The initial thermal structure of the subducting continentallithosphere (white lines in Fig. 1b) is laterally uniform with 0 ◦C atthe surface (�12 km, the air) and 1327 ◦C at 100 km depth, withlinear interpolation in between. The thermal structure of the over-riding continental lithosphere is similar with 0 ◦C at the surface,but 1322 ◦C at 90 km depth (slightly warmer than the subduct-ing continent). The relatively thin and hot continental lithosphereis applied in consistency with some mountain belts, such as Tibet(e.g., Owens and Zandt, 1997; Tilmann et al., 2003; Liang et al.,2012). The thermal structure of the oceanic lithosphere is appliedusing the half-space cooling age of 30 Ma (Turcotte and Schubert,2002). The initial temperature gradient in the asthenospheric man-tle is about 0.5 ◦C/km. The thermal boundary conditions have afixed value (0 ◦C) for the upper boundary and zero horizontal heatflux across the vertical boundaries. For the lower thermal bound-ary, an infinity-like external constant temperature condition is im-posed, which allows both temperatures and vertical heat fluxes tovary along the permeable lower boundary of the box. This impliesthat the constant temperature condition is satisfied at ∼200 kmbelow the bottom of the model. This condition is implementedby using the equation ∂T /∂ y = (Texternal − T y)/�yexternal at thelower boundary, where Texternal is the temperature at the exter-nal boundary and �yexternal is the vertical distance from the lowerboundary to the external boundary (e.g., Burg and Gerya, 2005;Gerya et al., 2008a; Li et al., 2010).
2.3. Hydration and melting implementation
In the numerical model, water is expelled from the subductedoceanic crust as a consequence of both dehydration reactionsand compaction. Equilibrium mineralogical water content is cal-culated for the Lagrangian rock markers at every time step basedon Gibbs free energy minimization (Connolly and Petrini, 2002;Connolly, 2005; Gerya and Meilick, 2011) as a function of thelocal pressure, temperature and rock composition. The additionalconnate water content of the basaltic, upper oceanic crust and sed-iment is assumed as a linear function of depth.
XH2O(P )(wt.%) = XH2O(P0)(1 − �z/75) (1)
where XH2O(P ) = 2 wt.% is the connate water content at thesurface, �z (km) is the depth below the surface in kilometer(0–75 km). The release of water also mimics the effects of low-temperature (T < 573 K) reactions not included in our thermo-dynamic database. According to the numerical models, water re-leased from the slab creates a rheologically weak, hydrated zone,which ensures self-sustaining retreating subduction (Gerya et al.,2008b). To simulate the migration of water released by dehydra-tion process, we use independently moving rock and fluid markers(Gorczyk et al., 2007a). To account for water transport, a fluidmarker with its water amount is generated and moves upward un-til it reaches a lithology that assimilates water. Following Nikolaevaet al. (2008) the velocity of water is computed as
vx(water) = vx
v y(water) = v y + v y(percolation)
vz(water) = vz (2)
where y is the vertical coordinate pointing upward, x and z arethe horizontal coordinates, respectively; vx , v y and vz indicatethe local velocity, v y(percolation) = 10 cm/a, an assumed parameter(Peacock, 1990; Gorczyk et al., 2007b), characterizing the upwardspeed of free water through the mantle. The sensitivity tests ofthe percolation speed v y(percolation) on our results are shown in thesupplementary Appendix (Figs. S1, S2). Free water is consumed byhydration and melting reactions in the mantle. Consequently, thepropagation of the hydration/melting front in the mantle wedge islimited by the availability of water. This propagation is thus relatedto the rate of subduction which brings water to depths (Gerya etal., 2006).
The degree of melting of hydrated peridotite is computed asa function of pressure, temperature and water content using theparameterization of Katz et al. (2003). The degree of melting ofcrustal rocks is calculated according to the simple linear meltingmodel (Burg and Gerya, 2005; Gerya and Meilick, 2011; Li et al.,2011):
M = 0, when: T � Tsolidus
M = (T − Tsolidus)
(T liquidus − Tsolidus), when: Tsolidus < T < T liquidus
M = 1, when: T � T liquidus (3)
where M is the volumetric fraction of melt with temperature T .Tsolidus and T liquidus are solidus temperature and dry liquidus tem-perature at a given pressure and temperature, respectively (Ta-ble S3; Ranalli, 1995).
Consequently, the effective density, ρeff , of partially moltenrocks varies with the amount of melt fraction and P –T conditionsaccording to the relations:
ρeff = ρsolid − M(ρsolid − ρmolten) (4)
where ρsolid and ρmolten are the densities of the solid and moltencrustal rock, respectively, which vary with pressure and tempera-ture according to the relation:
ρP ,T = ρ0[1 − α(T − T0)
][1 + β(P − P0)
](5)
where ρ0 is the standard density at P0 = 0.1 MPa and T0 = 298 K.The effect of latent heating is implicitly included by increasing
the effective heat capacity (Cpeff ) and thermal expansion (αeff ) ofpartially molten rocks (0 < M < 1), calculated as (Gerya, 2010):
Cpeff = Cp + Q L
(∂M
∂T
)P=cnst
αeff = α + ρQ L
T
(∂M
∂ P
)T =cnst
(6)
where Cp and α are the heat capacity and the thermal expansionof the solid crust, respectively, and Q L is the latent heat of meltingof the crust (Table S3).
2.4. Visco-plastic rheology
The relationships between the deviatoric stress (σ ′i j) and the
strain rate (ε̇i j) tensors are described by the visco-plastic constitu-tive laws allowing for strain localization (e.g., Buiter et al., 2006;Ruh et al., 2013). In case of incompressible viscous deformation,the viscous law of friction is:
σ ′xx = 2ηeff ε̇xx σ ′
yy = 2ηeff ε̇yy σ ′zz = 2ηeff ε̇zz
σ ′xy = 2ηeff ε̇xy σ ′
yz = 2ηeff ε̇yz σ ′xz = 2ηeff ε̇xz
ε̇xx = ∂vxε̇yy = ∂v y
ε̇zz = ∂vz
∂x ∂ y ∂z
Z.-H. Li et al. / Earth and Planetary Science Letters 380 (2013) 98–111 101
ε̇xy = 1
2
(∂vx
∂ y+ ∂v y
∂x
)ε̇yz = 1
2
(∂v y
∂z+ ∂vz
∂ y
)
ε̇xz = 1
2
(∂vx
∂z+ ∂vz
∂x
)(7)
where ηeff is the effective viscosity that depends on the pressure,temperature, composition, strain rate and degree of melting.
The viscosity for ductile creep is defined by:
ηductile = (ε̇II)1−n
n (AD)−1n exp
(E + P V
nRT
)(8)
where ε̇II = (0.5ε̇i j ε̇i j)1/2 is the second invariant of the strain rate
tensor and AD , E , V and n are experimentally determined flow lawparameters (Tables S1 and S2), which stand for material constant,activation energy, activation volume and stress exponent, respec-tively.
The ductile rheology is combined with a brittle/plastic rheol-ogy to yield an effective visco-plastic rheology. The Drucker–Prageryield criterion is easier to be implemented in 3-D than the Mohr–Coulomb criterion, while in 2-D these two criteria are known tobe equivalent. Therefore the Drucker–Prager yield criterion (e.g.,Ranalli, 1995) was implemented as follows:
σyield = C0 + P sin(ϕeff )
sin(ϕeff ) = sin(ϕ)(1 − λ)
ηplastic = σyield
2ε̇II(9)
where σyield is the yield stress, ε̇II is the second invariant of thestrain rate tensor, P is the dynamic pressure; C0 is the residualrock strength at P = 0 and ϕ is the internal frictional angle; λ isthe pore fluid coefficient that controls the brittle strength of fluid-containing porous or fractured media. ϕeff can be illustrated as theeffective internal frictional angle that integrates the effects of inter-nal frictional angle (ϕ) and pore fluid coefficient (λ). In this paper,C0 = 1 MPa for all the rock types. Therefore the plastic rheologyis implemented by different values of sin(ϕeff ) for different rocktypes (Table S3), which are chosen according to the same princi-ples as in previous 2-D subduction/collision models (e.g., Gerya etal., 2008a; Li et al., 2011).
With ηductile and ηplastic, the visco-plastic rheology is assignedto the model by means of a Christmas tree-like criterion, wherethe rheological behavior depends on the minimum viscosity (ordifferential stress) attained between the ductile and brittle/plasticfields (Ranalli, 1995).
ηcreep = min(ηductile, ηplastic) (10)
It is worth notifying that elasticity might affect lithosphericflexure in collision zone, however the general dynamics of con-tinental subduction/collision and underlying mantle flow remainwell established by the visco-plastic rheology (Gerya and Yuen,2003, 2007).
2.5. Governing equations and numerical implementation
The momentum, continuity and heat conservation equations fora 3-D creeping flow are solved. Abbreviations and units are listedin Table S1.
(1) 3-D Stokes equations:
∂σ ′xx
∂x+ ∂σ ′
xy
∂ y+ ∂σ ′
xz
∂z= ∂ P
∂x
∂σ ′yx + ∂σ ′
yy + ∂σ ′yz = ∂ P − gρ(C, M, P , T )
∂x ∂ y ∂z ∂ y
∂σ ′zx
∂x+ ∂σ ′
zy
∂ y+ ∂σ ′
zz
∂z= ∂ P
∂z(11)
(2) Conservation of mass is approximated by the incompressiblecontinuity equation:
∂vx
∂x+ ∂v y
∂ y+ ∂vz
∂z= 0 (12)
(3) Heat conservation equations:
ρC p
(DT
Dt
)= −∂qx
∂x− ∂qy
∂ y− ∂qz
∂z+ Hr + Ha + H S
qx = −k∂T
∂xqy = −k
∂T
∂ yqz = −k
∂T
∂z
Ha = TαD P
DtH S = σ ′
xxε̇xx + σ ′yy ε̇yy + σ ′
zzε̇zz + 2σ ′xy ε̇xy + 2σ ′
yzε̇yz
+ 2σ ′xzε̇xz (13)
where y is the vertical coordinate pointing upward, x and zare the horizontal coordinates (Fig. 1); vx , v y , and vz indi-cate the components of the velocity vector; t is time; σ ′
i j arethe components of the viscous deviatoric stress tensor; ε̇i j arethe components of the strain rate tensor; g is the gravita-tional acceleration, and the density ρ depends explicitly oncomposition (C ), melt fraction (M), temperature (T ) and pres-sure (P ). k is the variable thermal conductivity (Clauser andHuenges, 1995), C p is the effective isobaric heat capacity, i.e.,incorporating latent heat; Hr , Ha and H S denote radioactiveheat production (Table S3), the energetic effect of isother-mal (de)compression (i.e., adiabatic heating/cooling), and shearheating, respectively.
The above equations are solved in the ‘I3ELVIS’ code (Geryaand Yuen, 2007; Zhu et al., 2009; Gerya, 2010) based on finite-differences with a marker-in-cell technique, which allows for non-diffusive numerical simulation of multiphase flow in a rectangularfully staggered Eulerian grid.
3. Model results
Series of numerical experiments were conducted with vari-ous convergence velocities V c . The partition of V c is that V c =V xo − V xs , where V xo is applied on the boundary plane x = 0 km(overriding side), and V xs on the boundary plane of x = 1000 km(subducting side; Fig. 1). In Models-I and -II, V c = 5 cm/a (V xo =1.5 cm/a, V xs = −3.5 cm/a) for the first 10 Ma, which rules theoceanic subduction of 500 km. The partition of V xs/V xo was deter-mined in order to keep the subduction/collision zone in the middleof the model domain, far from the boundaries in x-direction. Theratio V xs/V xo might affect the model evolution to a certain degree(Burov et al., in press). However, we emphasize that it does notchange the general structures of the numerical models in a sys-tem with neglected inertia (Fig. S3). Then the convergence velocitywas decreased linearly during continental subduction (10–15 Ma)to 2.5 cm/a for Model-I (Figs. 2a, 3a) and to 1 cm/a for Model-II(Fig. 6a). In Models-III and -IV, constant convergent velocities of5 cm/a (V xo = 1.5 cm/a, V xs = −3.5 cm/a; Fig. 7a) and 3.0 cm/a(V xo = 1 cm/a, V xs = −2 cm/a; Fig. 8a) were applied, respectively.The configurations and detailed parameters are shown in Fig. 1 andTables S2 and S3.
3.1. Reference Model-I
At the initial stages of our reference Model-I, the relativelystrong oceanic plate subducted along the prescribed weak zone

102 Z.-H. Li et al. / Earth and Planetary Science Letters 380 (2013) 98–111
Fig. 2. Evolution of the reference model viewed in the oceanic subduction side. The top layer (y > −20 km) is cut off for clarity. The prescribed convergence velocity (Vc )decreases from 5 to 2.5 cm/a during the continental subduction (10–15 Ma) as shown in (a). The partition of Vc is that V c = V xo − V xs , where V xo = 1.5 cm/a (in the initialmodel) is applied on the boundary plane x = 0 km (overriding side), and V xs = −3.5 cm/a on the boundary plane of x = 1000 km (subducting side). The ratio V xs/V xo iskept constant during the slowing of convergence. Colors of rock types are as in Fig. 1. Time (Ma) of shortening is given in the figures.
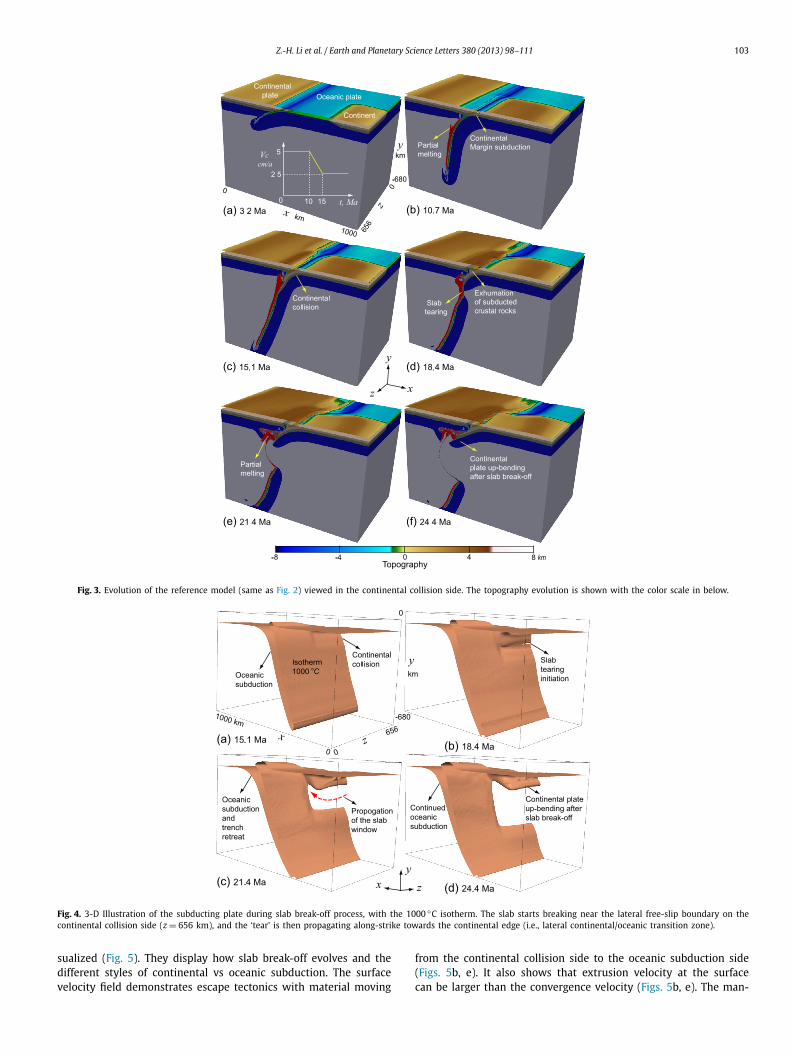
into the mantle (Figs. 2a–b, 3a–b). Water is expelled from thesubducted oceanic crust as a consequence of both dehydrationreactions and compaction (e.g., Zhu et al., 2009), which createsa rheologically weak hydrated zone in the mantle wedge closelyabove the subducting plate. The released water is transported intothe mantle wedge and contributes to partial melting of the mantle(e.g., Figs. 2b–d). Viewed from the ocean-only side (Fig. 2), sub-duction is continuous while the trench retreats. The subductingplate becomes decoupled from the overriding plate (Figs. 2d–f).This process opens space for emplacement of partially molten ma-terial and mantle upwelling. At the same time, the side carry-ing continent has a different mode (Fig. 3). The incoming con-tinental margin subducts to >100 km depth following the ear-lier oceanic subduction (Figs. 3b–c). Then, slab break-off occursat about 150 km depth. After break-off of the oceanic slab, thesubducted continental plate up-bends towards a shallower dipangle (cf., Figs. 3e and 3f), which is comparable to what hap-pens after break-off in analogue models of continental collision(Chemenda et al., 2000). This event triggers exhumation of thesubducted continental crustal rocks (Figs. 3d–e). Exhumation issimilar to material circulation shown in previous numerical modelsof rheologically weak subduction channels (e.g., Burov et al., 2001;Stöckhert and Gerya, 2005; Yamato et al., 2007; Warren et al.,2008). Partially molten rocks, derived from both the continentalcrust and the mantle wedge, accumulate at the bottom of theoverriding lithosphere (Figs. 3e–f). One of the most important phe-nomena is material lateral extrusion (in z-direction) from the con-
tinental collision side to the oceanic subduction side (Figs. 2e–f,3e–f). Fig. 3 also displays the topography evolution, which indi-cates that the relief of the continental collision mountain can reach5–6 km in the overriding plate over a wide area (Figs. 3d–f).
Comparing Figs. 2 and 3 discloses the differences between theoceanic subduction and the continental collision sides. The 1000 ◦Cisotherm contour was plotted to make obvious the 3-D structureof the subducting slab (Fig. 4). On the oceanic side, subductionand trench retreat continue. By contrast, slab break-off occurs onthe continental side in such a manner that the lateral integrityof the already subducted oceanic plate remains preserved (Fig. 4).Firstly, break-off initiates away from the continent corner, close tothe free-slip side model boundary, at a site that can be regarded asthe interior of the continent because of the mirror symmetry effectof free-slip condition in fluid dynamics (e.g., Li and Ribe, 2012).Then break-off propagates sideways in the z-direction towards thecontinental edge (lateral continental/oceanic transition zone) andfinally propagates along the lateral edge of the subducted con-tinental mantle lithosphere, in the x-direction. The slab windowopens wider during break-off propagation in the y-direction, belowthe collided continents (Figs. 4c–d). The slab separated from thesubducted continent continues subducting with the oceanic plate(Figs. 4c–d). The part of the plate remained attached to the sub-ducted continent up-bends to a shallower dip angle (slab pull hasceased) during the growth of the ‘tear’ window (Figs. 4c–d).
In order to better define the slab break-off and to track thematerial flow, the effective viscosity and velocity fields were vi-
Z.-H. Li et al. / Earth and Planetary Science Letters 380 (2013) 98–111 103
Fig. 3. Evolution of the reference model (same as Fig. 2) viewed in the continental collision side. The topography evolution is shown with the color scale in below.
Fig. 4. 3-D Illustration of the subducting plate during slab break-off process, with the 1000 ◦C isotherm. The slab starts breaking near the lateral free-slip boundary on thecontinental collision side (z = 656 km), and the ‘tear’ is then propagating along-strike towards the continental edge (i.e., lateral continental/oceanic transition zone).
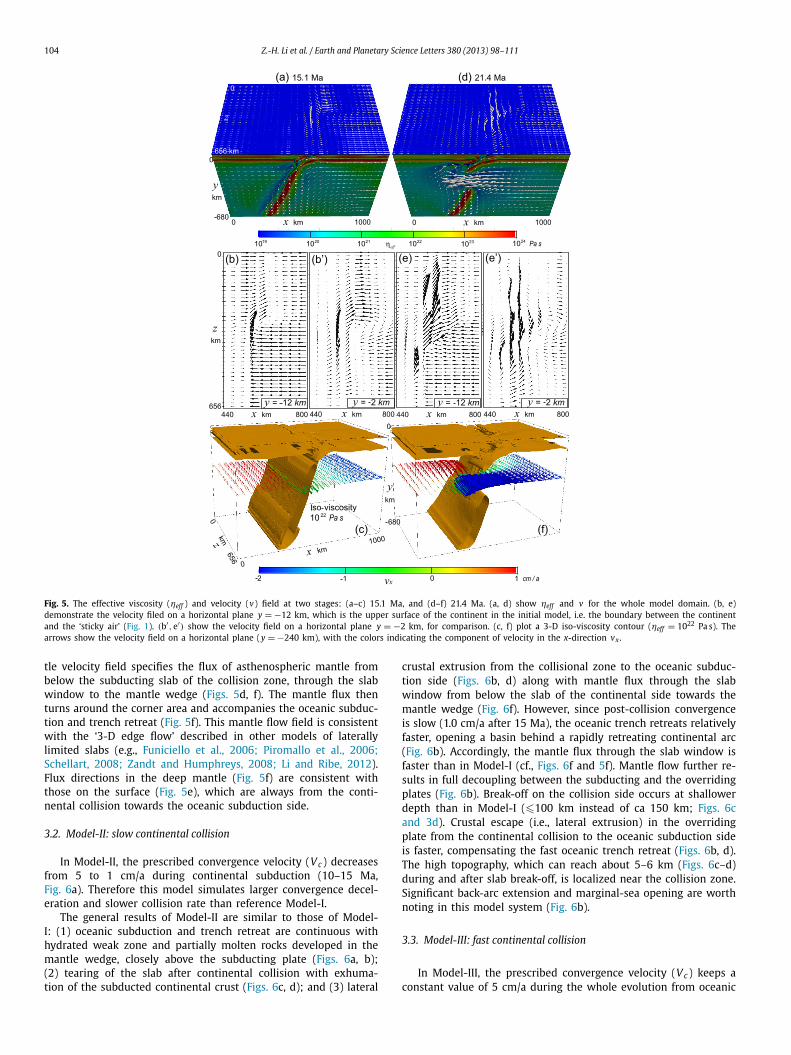
sualized (Fig. 5). They display how slab break-off evolves and thedifferent styles of continental vs oceanic subduction. The surfacevelocity field demonstrates escape tectonics with material moving
from the continental collision side to the oceanic subduction side(Figs. 5b, e). It also shows that extrusion velocity at the surfacecan be larger than the convergence velocity (Figs. 5b, e). The man-
104 Z.-H. Li et al. / Earth and Planetary Science Letters 380 (2013) 98–111
Fig. 5. The effective viscosity (ηeff ) and velocity (v) field at two stages: (a–c) 15.1 Ma, and (d–f) 21.4 Ma. (a, d) show ηeff and v for the whole model domain. (b, e)demonstrate the velocity filed on a horizontal plane y = −12 km, which is the upper surface of the continent in the initial model, i.e. the boundary between the continentand the ‘sticky air’ (Fig. 1). (b′,e′) show the velocity field on a horizontal plane y = −2 km, for comparison. (c, f) plot a 3-D iso-viscosity contour (ηeff = 1022 Pa s). Thearrows show the velocity field on a horizontal plane (y = −240 km), with the colors indicating the component of velocity in the x-direction vx .
tle velocity field specifies the flux of asthenospheric mantle frombelow the subducting slab of the collision zone, through the slabwindow to the mantle wedge (Figs. 5d, f). The mantle flux thenturns around the corner area and accompanies the oceanic subduc-tion and trench retreat (Fig. 5f). This mantle flow field is consistentwith the ‘3-D edge flow’ described in other models of laterallylimited slabs (e.g., Funiciello et al., 2006; Piromallo et al., 2006;Schellart, 2008; Zandt and Humphreys, 2008; Li and Ribe, 2012).Flux directions in the deep mantle (Fig. 5f) are consistent withthose on the surface (Fig. 5e), which are always from the conti-nental collision towards the oceanic subduction side.
3.2. Model-II: slow continental collision
In Model-II, the prescribed convergence velocity (V c) decreasesfrom 5 to 1 cm/a during continental subduction (10–15 Ma,Fig. 6a). Therefore this model simulates larger convergence decel-eration and slower collision rate than reference Model-I.
The general results of Model-II are similar to those of Model-I: (1) oceanic subduction and trench retreat are continuous withhydrated weak zone and partially molten rocks developed in themantle wedge, closely above the subducting plate (Figs. 6a, b);(2) tearing of the slab after continental collision with exhuma-tion of the subducted continental crust (Figs. 6c, d); and (3) lateral
crustal extrusion from the collisional zone to the oceanic subduc-tion side (Figs. 6b, d) along with mantle flux through the slabwindow from below the slab of the continental side towards themantle wedge (Fig. 6f). However, since post-collision convergenceis slow (1.0 cm/a after 15 Ma), the oceanic trench retreats relativelyfaster, opening a basin behind a rapidly retreating continental arc(Fig. 6b). Accordingly, the mantle flux through the slab window isfaster than in Model-I (cf., Figs. 6f and 5f). Mantle flow further re-sults in full decoupling between the subducting and the overridingplates (Fig. 6b). Break-off on the collision side occurs at shallowerdepth than in Model-I (�100 km instead of ca 150 km; Figs. 6cand 3d). Crustal escape (i.e., lateral extrusion) in the overridingplate from the continental collision to the oceanic subduction sideis faster, compensating the fast oceanic trench retreat (Figs. 6b, d).The high topography, which can reach about 5–6 km (Figs. 6c–d)during and after slab break-off, is localized near the collision zone.Significant back-arc extension and marginal-sea opening are worthnoting in this model system (Fig. 6b).
3.3. Model-III: fast continental collision
In Model-III, the prescribed convergence velocity (V c) keeps aconstant value of 5 cm/a during the whole evolution from oceanic

Z.-H. Li et al. / Earth and Planetary Science Letters 380 (2013) 98–111 105
Fig. 6. The model with prescribed convergence velocity (Vc ) decreasing from 5 to 1 cm/a during the continental subduction (10–15 Ma) as shown in (a). The partition ofV c is the same as in the reference model (Fig. 2), where V xo = 1.5 cm/a and V xs = −3.5 cm/a at the beginning, and the V xs/V xo ratio is kept constant during the collision.(a–b) View in the oceanic subduction side. Colors of rock types are as in Fig. 1. (c–d) View in the continental collision side. The topography color scale is the same as inFig. 3. (e–f) Iso-viscosity (ηeff = 1022 Pa s) with the velocity field on a horizontal plane (y = −240 km). The velocity (vx) color scale is the same as in Fig. 5. Time (Ma) ofshortening is given in the figures.
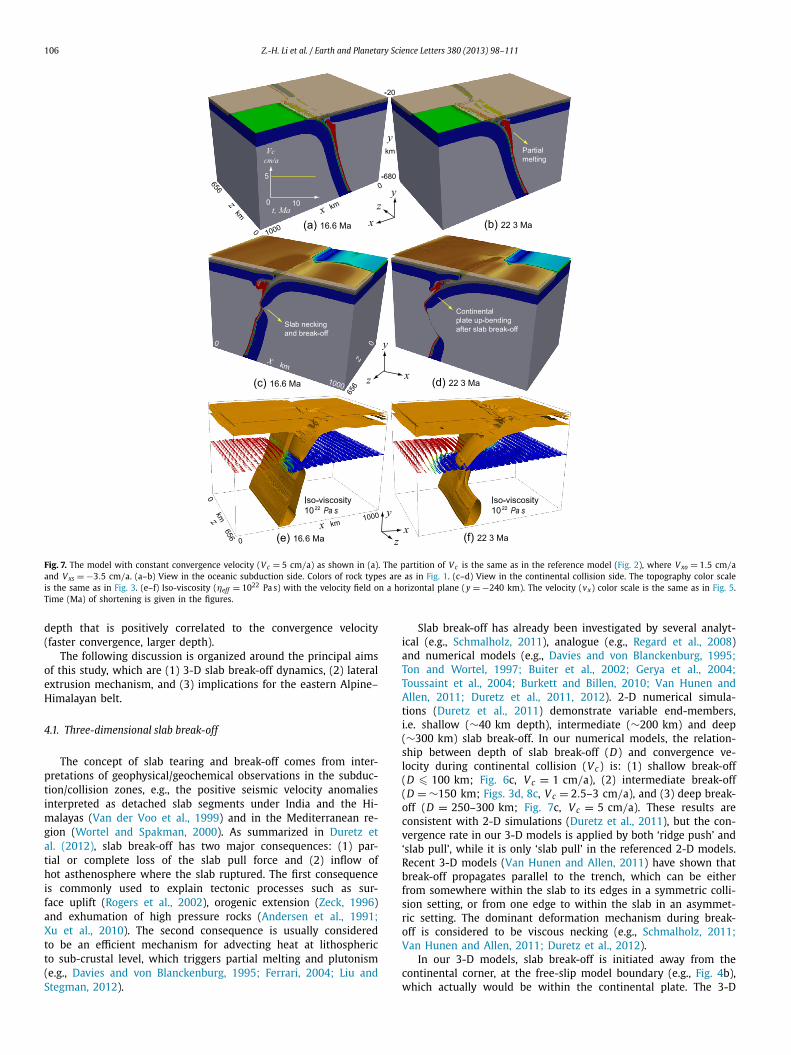
subduction to continental collision (Fig. 7a). This model representsfast collision.
In Model-III, the position of the oceanic trench is rather stable(Figs. 7a, b). Consequently the mantle flux through the slab win-dow is slower than in Models-I and -II (Figs. 7e, 5f and 6f). Thisproduces coupling between the subducting oceanic plate and theoverriding continental plate (Figs. 7a, b). The incoming continentalplate subducts deeper than in Models-I and -II with slab tearingat about 250–300 km depth (Fig. 7c). After slab separation, thesubducted part of the plate carrying continent up-bends as in thereference Model-I (Figs. 7d, 3f). In this fast convergent regime, thetopography of the overriding continent is high over a wide area(Fig. 7d), in marked contrast to the localized high topography nearthe collision zone in the slow collision regime of Model-II (Fig. 6d).
3.4. Model-IV: slow oceanic subduction
Like Model-III, Model-IV was conducted with a constant butslower (3 cm/a) convergence velocity throughout the whole modelevolution (Fig. 8a). This model was designed to investigate the in-fluence of slow oceanic subduction.
The model yielded similar results as those from referenceModel-I: (1) continuous subduction of the oceanic side with slowtrench retreat; (2) slab torn apart on the continental collisionside, at a depth of about 150 km, which leads to exhumationof continental crust; and (3) lateral material flow both in the
deep asthenospheric mantle and in the shallower crust of theoverriding plate. The main difference is that the subducted con-tinental plate does not up-bend after break-off (Fig. 8d). Instead,the overriding plate tends to bend down and subduct also (so-called two-sided or ablative subduction; e.g., Faccenda et al., 2008;Li et al., 2011). This drag-down of the overriding plate is attributedto strong coupling between the subducting and overriding mantlelithospheres (Faccenda et al., 2008; Li et al., 2011).
4. Discussion
The subduction/collision of 3-D continental corners differsmarkedly from the general 2-D continental collision. In 2-D mod-els, the material is confined in a vertical x–y plane, without along-strike deformation (e.g., Li et al., 2011). In the current 3-D models,lateral extrusion occurs in the overriding crust from continentalcollision to the oceanic subduction side. The deeper mantle flow,after slab break-off, has also a large component in the along-strikez-direction. In addition, the 3-D numerical models provide signifi-cant insights on the combined oceanic subduction and continentalcollision. On the oceanic subduction side, the plate continues sub-ducting and retreating with the trench retreat rate depending onthe prescribed boundary convergence velocity (faster convergence,slower retreat). On the continental collision side, slab tearing andbreak-off occurs when the continental plate has subducted to a
106 Z.-H. Li et al. / Earth and Planetary Science Letters 380 (2013) 98–111
Fig. 7. The model with constant convergence velocity (Vc = 5 cm/a) as shown in (a). The partition of V c is the same as in the reference model (Fig. 2), where V xo = 1.5 cm/aand V xs = −3.5 cm/a. (a–b) View in the oceanic subduction side. Colors of rock types are as in Fig. 1. (c–d) View in the continental collision side. The topography color scaleis the same as in Fig. 3. (e–f) Iso-viscosity (ηeff = 1022 Pa s) with the velocity field on a horizontal plane (y = −240 km). The velocity (vx) color scale is the same as in Fig. 5.Time (Ma) of shortening is given in the figures.
depth that is positively correlated to the convergence velocity(faster convergence, larger depth).
The following discussion is organized around the principal aimsof this study, which are (1) 3-D slab break-off dynamics, (2) lateralextrusion mechanism, and (3) implications for the eastern Alpine–Himalayan belt.
4.1. Three-dimensional slab break-off
The concept of slab tearing and break-off comes from inter-pretations of geophysical/geochemical observations in the subduc-tion/collision zones, e.g., the positive seismic velocity anomaliesinterpreted as detached slab segments under India and the Hi-malayas (Van der Voo et al., 1999) and in the Mediterranean re-gion (Wortel and Spakman, 2000). As summarized in Duretz etal. (2012), slab break-off has two major consequences: (1) par-tial or complete loss of the slab pull force and (2) inflow ofhot asthenosphere where the slab ruptured. The first consequenceis commonly used to explain tectonic processes such as sur-face uplift (Rogers et al., 2002), orogenic extension (Zeck, 1996)and exhumation of high pressure rocks (Andersen et al., 1991;Xu et al., 2010). The second consequence is usually consideredto be an efficient mechanism for advecting heat at lithosphericto sub-crustal level, which triggers partial melting and plutonism(e.g., Davies and von Blanckenburg, 1995; Ferrari, 2004; Liu andStegman, 2012).
Slab break-off has already been investigated by several analyt-ical (e.g., Schmalholz, 2011), analogue (e.g., Regard et al., 2008)and numerical models (e.g., Davies and von Blanckenburg, 1995;Ton and Wortel, 1997; Buiter et al., 2002; Gerya et al., 2004;Toussaint et al., 2004; Burkett and Billen, 2010; Van Hunen andAllen, 2011; Duretz et al., 2011, 2012). 2-D numerical simula-tions (Duretz et al., 2011) demonstrate variable end-members,i.e. shallow (∼40 km depth), intermediate (∼200 km) and deep(∼300 km) slab break-off. In our numerical models, the relation-ship between depth of slab break-off (D) and convergence ve-locity during continental collision (V c) is: (1) shallow break-off(D � 100 km; Fig. 6c, V c = 1 cm/a), (2) intermediate break-off(D = ∼150 km; Figs. 3d, 8c, V c = 2.5–3 cm/a), and (3) deep break-off (D = 250–300 km; Fig. 7c, V c = 5 cm/a). These results areconsistent with 2-D simulations (Duretz et al., 2011), but the con-vergence rate in our 3-D models is applied by both ‘ridge push’ and‘slab pull’, while it is only ‘slab pull’ in the referenced 2-D models.Recent 3-D models (Van Hunen and Allen, 2011) have shown thatbreak-off propagates parallel to the trench, which can be eitherfrom somewhere within the slab to its edges in a symmetric colli-sion setting, or from one edge to within the slab in an asymmet-ric setting. The dominant deformation mechanism during break-off is considered to be viscous necking (e.g., Schmalholz, 2011;Van Hunen and Allen, 2011; Duretz et al., 2012).
In our 3-D models, slab break-off is initiated away from thecontinental corner, at the free-slip model boundary (e.g., Fig. 4b),which actually would be within the continental plate. The 3-D

Z.-H. Li et al. / Earth and Planetary Science Letters 380 (2013) 98–111 107
Fig. 8. The model with constant convergence velocity (Vc = 3 cm/a) as shown in (a), where V xo = 1 cm/a and V xs = −2 cm/a. (a–b) View in the oceanic subduction side.Colors of rock types are as in Fig. 1. (c–d) View in the continental collision side. The topography color scale is the same as in Fig. 3. (e–f) Iso-viscosity (ηeff = 1022 Pa s) withthe velocity field on a horizontal plane (y = −240 km). The velocity (vx) color scale is the same as in Fig. 5. Time (Ma) of shortening is given in the figures.
style of slab break-off agrees with the results of Van Hunen andAllen (2011), but the trench-parallel tear propagation is limitedby the cornered ocean-continent boundary. There, the tear doesnot propagate into the oceanic slab. Instead, it turns along the lat-eral continent boundary. In this system, the integrated slab pull istransmitted into the retreating oceanic subduction domain.
Our 3-D numerical simulations indicate that slab break-off playsfundamental roles in the dynamics of continental (corner) colli-sion: (1) up-bending of the subducted continental plate after lossof slab pull along the former ocean-continent boundary (Figs. 3f,7d), which does not appear in Model-IV (Fig. 8d) because ofthe tendency of two-sided subduction under coupled, high stressregime; (2) topography uplift in the collision zone (Fig. 3); and (3)asthenospheric mantle flow through the tear window (Fig. 5).
4.2. Lateral extrusion mechanism
Lateral extrusion was obtained in all models (Figs. 2, 6, 7 and8), which suggests that escape tectonics is a common feature to allcolliding continental corners. Comparing the models, lateral extru-sion appears to depend on three factors:
(1) Continental collision and topography build-up; there is no lat-eral extrusion before onset of continental collision (Figs. 2a,2b, 3a, 3b). Collision produces the necessary topography andgravitational potential, which can be regarded as a ‘source’ formaterial extrusion (e.g., Royden et al., 2008).
(2) Positive correlation with the trench retreat rate; faster trenchretreat results in faster lateral extrusion (Fig. 6b). Conversely,slower trench retreat leads to slower extrusion (Fig. 7b). Theintermediate trench retreat rate produces intermediate lateralmaterial extrusion (Figs. 2f, 8b). Trench retreat causes exten-sion in the upper plate, which provides a ‘sink’ region to re-ceive the extruded materials.
(3) Slab break-off and mantle flow through the slab window (e.g.,Fig. 5), which together facilitate trench retreat, hence lateralextrusion. Lateral extrusion expresses the link between deepmantle dynamics and crustal processes.
It is worth noting that surface processes, i.e. erosion and sedi-mentation, may influence the lateral extrusion to a certain degree.However their rates and scales are too small to change the gen-eral structure and dynamics of the continental collision (e.g., Li andGerya, 2009). For the sake of simplicity, they were both neglectedin the present models.
4.3. Implications for the eastern Alpine–Himalayan belt
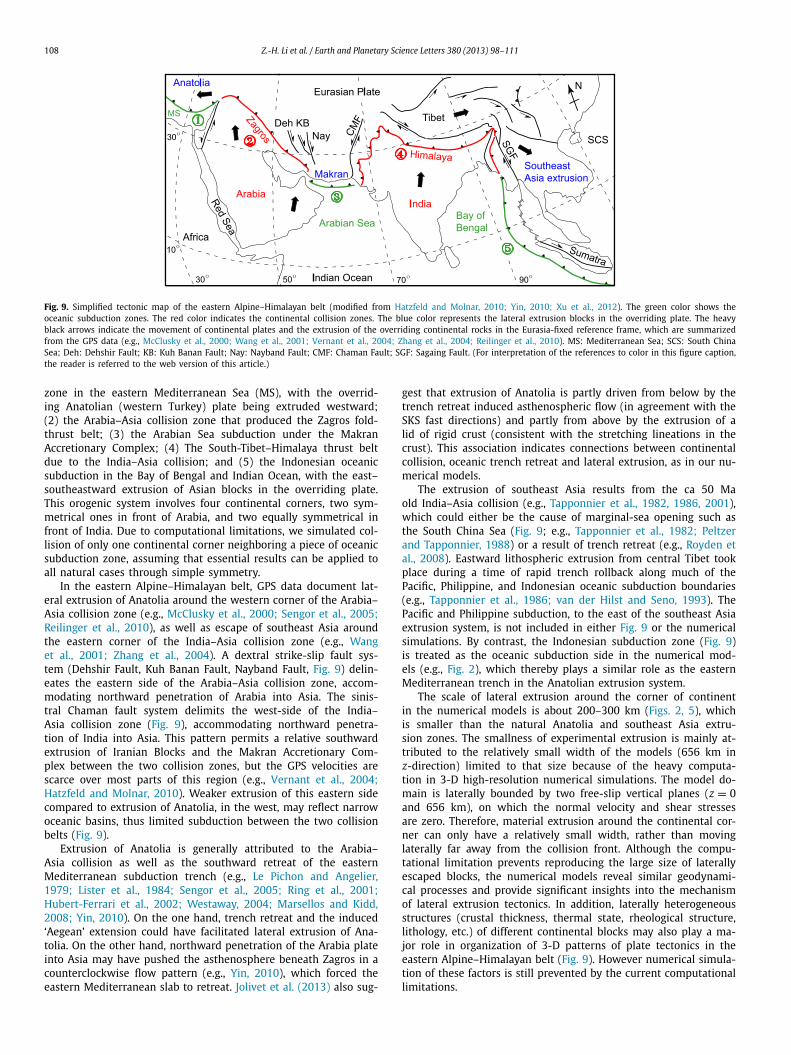
The Alpine–Himalayan belt is one of the youngest and bestdocumented continental convergent zones, which formed after clo-sure of the Tethys Ocean. The eastern part of this convergent belt(Fig. 9) is composed of two continental collision zones alternat-ing with three oceanic subduction zones (e.g., Vernant et al., 2004;Hatzfeld and Molnar, 2010; Yin, 2010): (1) the oceanic subduction
108 Z.-H. Li et al. / Earth and Planetary Science Letters 380 (2013) 98–111
Fig. 9. Simplified tectonic map of the eastern Alpine–Himalayan belt (modified from Hatzfeld and Molnar, 2010; Yin, 2010; Xu et al., 2012). The green color shows theoceanic subduction zones. The red color indicates the continental collision zones. The blue color represents the lateral extrusion blocks in the overriding plate. The heavyblack arrows indicate the movement of continental plates and the extrusion of the overriding continental rocks in the Eurasia-fixed reference frame, which are summarizedfrom the GPS data (e.g., McClusky et al., 2000; Wang et al., 2001; Vernant et al., 2004; Zhang et al., 2004; Reilinger et al., 2010). MS: Mediterranean Sea; SCS: South ChinaSea; Deh: Dehshir Fault; KB: Kuh Banan Fault; Nay: Nayband Fault; CMF: Chaman Fault; SGF: Sagaing Fault. (For interpretation of the references to color in this figure caption,the reader is referred to the web version of this article.)
zone in the eastern Mediterranean Sea (MS), with the overrid-ing Anatolian (western Turkey) plate being extruded westward;(2) the Arabia–Asia collision zone that produced the Zagros fold-thrust belt; (3) the Arabian Sea subduction under the MakranAccretionary Complex; (4) The South-Tibet–Himalaya thrust beltdue to the India–Asia collision; and (5) the Indonesian oceanicsubduction in the Bay of Bengal and Indian Ocean, with the east–southeastward extrusion of Asian blocks in the overriding plate.This orogenic system involves four continental corners, two sym-metrical ones in front of Arabia, and two equally symmetrical infront of India. Due to computational limitations, we simulated col-lision of only one continental corner neighboring a piece of oceanicsubduction zone, assuming that essential results can be applied toall natural cases through simple symmetry.
In the eastern Alpine–Himalayan belt, GPS data document lat-eral extrusion of Anatolia around the western corner of the Arabia–Asia collision zone (e.g., McClusky et al., 2000; Sengor et al., 2005;Reilinger et al., 2010), as well as escape of southeast Asia aroundthe eastern corner of the India–Asia collision zone (e.g., Wanget al., 2001; Zhang et al., 2004). A dextral strike-slip fault sys-tem (Dehshir Fault, Kuh Banan Fault, Nayband Fault, Fig. 9) delin-eates the eastern side of the Arabia–Asia collision zone, accom-modating northward penetration of Arabia into Asia. The sinis-tral Chaman fault system delimits the west-side of the India–Asia collision zone (Fig. 9), accommodating northward penetra-tion of India into Asia. This pattern permits a relative southwardextrusion of Iranian Blocks and the Makran Accretionary Com-plex between the two collision zones, but the GPS velocities arescarce over most parts of this region (e.g., Vernant et al., 2004;Hatzfeld and Molnar, 2010). Weaker extrusion of this eastern sidecompared to extrusion of Anatolia, in the west, may reflect narrowoceanic basins, thus limited subduction between the two collisionbelts (Fig. 9).
Extrusion of Anatolia is generally attributed to the Arabia–Asia collision as well as the southward retreat of the easternMediterranean subduction trench (e.g., Le Pichon and Angelier,1979; Lister et al., 1984; Sengor et al., 2005; Ring et al., 2001;Hubert-Ferrari et al., 2002; Westaway, 2004; Marsellos and Kidd,2008; Yin, 2010). On the one hand, trench retreat and the induced‘Aegean’ extension could have facilitated lateral extrusion of Ana-tolia. On the other hand, northward penetration of the Arabia plateinto Asia may have pushed the asthenosphere beneath Zagros in acounterclockwise flow pattern (e.g., Yin, 2010), which forced theeastern Mediterranean slab to retreat. Jolivet et al. (2013) also sug-
gest that extrusion of Anatolia is partly driven from below by thetrench retreat induced asthenospheric flow (in agreement with theSKS fast directions) and partly from above by the extrusion of alid of rigid crust (consistent with the stretching lineations in thecrust). This association indicates connections between continentalcollision, oceanic trench retreat and lateral extrusion, as in our nu-merical models.
The extrusion of southeast Asia results from the ca 50 Maold India–Asia collision (e.g., Tapponnier et al., 1982, 1986, 2001),which could either be the cause of marginal-sea opening such asthe South China Sea (Fig. 9; e.g., Tapponnier et al., 1982; Peltzerand Tapponnier, 1988) or a result of trench retreat (e.g., Royden etal., 2008). Eastward lithospheric extrusion from central Tibet tookplace during a time of rapid trench rollback along much of thePacific, Philippine, and Indonesian oceanic subduction boundaries(e.g., Tapponnier et al., 1986; van der Hilst and Seno, 1993). ThePacific and Philippine subduction, to the east of the southeast Asiaextrusion system, is not included in either Fig. 9 or the numericalsimulations. By contrast, the Indonesian subduction zone (Fig. 9)is treated as the oceanic subduction side in the numerical mod-els (e.g., Fig. 2), which thereby plays a similar role as the easternMediterranean trench in the Anatolian extrusion system.
The scale of lateral extrusion around the corner of continentin the numerical models is about 200–300 km (Figs. 2, 5), whichis smaller than the natural Anatolia and southeast Asia extru-sion zones. The smallness of experimental extrusion is mainly at-tributed to the relatively small width of the models (656 km inz-direction) limited to that size because of the heavy computa-tion in 3-D high-resolution numerical simulations. The model do-main is laterally bounded by two free-slip vertical planes (z = 0and 656 km), on which the normal velocity and shear stressesare zero. Therefore, material extrusion around the continental cor-ner can only have a relatively small width, rather than movinglaterally far away from the collision front. Although the compu-tational limitation prevents reproducing the large size of laterallyescaped blocks, the numerical models reveal similar geodynami-cal processes and provide significant insights into the mechanismof lateral extrusion tectonics. In addition, laterally heterogeneousstructures (crustal thickness, thermal state, rheological structure,lithology, etc.) of different continental blocks may also play a ma-jor role in organization of 3-D patterns of plate tectonics in theeastern Alpine–Himalayan belt (Fig. 9). However numerical simula-tion of these factors is still prevented by the current computationallimitations.
Z.-H. Li et al. / Earth and Planetary Science Letters 380 (2013) 98–111 109
5. Conclusions
3-D numerical models of continental collision limited by a cor-ner boundary with adjacent oceanic lithosphere simulated differ-ent, yet linked and coeval tectonic styles. The oceanic plate keepssubducting with trench retreat, without break-off. On the conti-nental side, slab tearing and break-off occurs at a depth (�100 kmto ∼300 km) related to the convergence velocity (faster conver-gence, larger depth). The slab tear window is first initiated awayfrom the continental corner, then propagates along-strike to theedge of the continental plate, and finally, at a shallower depth,along the lateral continental/oceanic transition zone. The structuresand dynamics of slab break-off are consistent with and further de-velop the previous 2-D and 3-D modes (e.g., Duretz et al., 2011;Van Hunen and Allen, 2011). Numerical experiments also simu-late lateral extrusion tectonics and establish that it should be ageneral phenomenon during collision of continental corners. Lat-eral extrusion is driven both from above by the topography andgravitational potentials and from below by the trench retreat andasthenospheric mantle return flow.
Acknowledgements
This work was supported by the Start-up Research Fund fromInstitute of Geology of CAGS (J1219) and the fund from NSFC(40921001), China Geological Survey projects (1212011121275,1212011120161), and Sinoprobe project to ZHL. TG is supportedby ETH Research Grants ETH-0807-3, ETH-0609-2 and TopoEuropeprogram. G. Zhu, D. May and T. Duretz are thanked for the dis-cussion of 3-D visualization. We also thank M. Liu for fruitful dis-cussion of the geological applications. Thorough and constructivereviews by C. Beaumont and two anonymous reviewers are muchappreciated.
Appendix A. Supplementary material
Supplementary material related to this article can be found on-line at http://dx.doi.org/10.1016/j.epsl.2013.08.034.
References
Andersen, T.B., Jamtveit, B., Dewey, J.F., 1991. Subduction and eduction of continen-tal crust: major mechanisms during continent–continent collision and orogenicextensional collapse, a model based on the south Norwegian Caledonides. TerraNova 3 (3), 303–310.
Beaumont, C., Jamieson, R.A., Nguyen, M.H., Lee, B., 2001. Himalayan tectonics ex-plained by extrusion of a low-viscosity crustal channel coupled to focused sur-face denudation. Nature 414, 738–742.
Beaumont, C., Jamieson, R.A., Butler, J.P., Warren, C.J., 2009. Crustal structure: A keyconstraint on the mechanism of ultra-high-pressure rock exhumation. EarthPlanet. Sci. Lett. 287, 116–129.
Boutelier, D., Chemenda, A.I., Jorand, C., 2004. Continental subduction and exhuma-tion of high-pressure rocks: insights from thermo-mechanical laboratory mod-eling. Earth Planet. Sci. Lett. 222, 209–216.
Buiter, S.J.H., Govers, R., Wortel, M.J.R., 2002. Two-dimensional simulation of surfacedeformation caused by slab detachment. Tectonophysics 354, 192–210.
Buiter, S.J.H., Babeyko, A., Ellis, S., Gerya, T.V., Kaus, B.J.P., Kellner, A., Schreurs, G.,Yamada, Y., 2006. The numerical sandbox: Comparison of model results for ashortening and an extension experiment. In: Buiter, S.J.H., Schreurs, G. (Eds.),Analogue and Numerical Modelling of Crustal-Scale Processes. In: Geol. Soc.London, Spec. Publ., vol. 253, pp. 29–64.
Burg, J.P., Davy, P., Nievergelt, P., Oberli, F., Seward, D., Diao, Z., Meier, M., 1997.Exhumation during crustal folding in the Namche Barwa syntaxis. Terra Nova 9,117–123.
Burg, J.P., Podladchikov, Y., 1999. Lithospheric scale folding: numerical modellingand application to the Himalayan syntaxes. Int. J. Earth Sci. 88, 190–200.
Burg, J.P., Podladchikov, Y., 2000. From buckling to asymmetric folding of the conti-nental lithosphere: numerical modelling and application to the Himalayan syn-taxes. In: Geol. Soc. London, Spec. Publ., vol. 170, pp. 219–236.
Burg, J.-P., Gerya, T.V., 2005. The role of viscous heating in Barrovian metamorphismof collisional orogens: thermomechanical models and application to the Lepon-tine Dome in the Central Alps. J. Metamorph. Geol. 23, 75–95.
Burg, J.P., Schmalholz, S.M., 2008. Viscous heating allows thrusting to overcomecrustal-scale buckling: Numerical investigation with application to the Hi-malayan syntaxes. Earth Planet. Sci. Lett. 274, 189–203.
Burkett, E.R., Billen, M.I., 2010. Three-dimensionality of slab detachment due toridge–trench collision: Laterally simultaneous boudinage versus tear propaga-tion. Geochem. Geophys. Geosyst. 11, Q11012.
Burov, E., Jolivet, L., Le Pourhiet, L., Poliakov, A., 2001. A thermomechanical model ofexhumation of high pressure (HP) and ultra-high pressure (UHP) metamorphicrocks in Alpine-type collision belts. Tectonophysics 342, 113–136.
Burov, E., Francois, T., Yamato, P., Wolf, S., in press. Mechanisms of conti-nental subduction and exhumation of HP and UHP rocks. Gondwana Res.,http://dx.doi.org/10.1016/j.gr.2012.09.010.
Chemenda, A.I., Mattauer, M., Malavieille, J., Bokun, A., 1995. A mechanism for syn-collisional rock exhumation and associated normal faulting: Results from physi-cal modeling. Earth Planet. Sci. Lett. 132, 225–232.
Chemenda, A.I., Mattauer, M., Bokun, A., 1996. Continental subduction and a mech-anism for exhumation of high-pressure metamorphic rocks: new modelling andfield data from Oman. Earth Planet. Sci. Lett. 143, 178–182.
Chemenda, A.I., Burg, J.-P., Mattauer, M., 2000. Evolutionary model of the Himalaya–Tibet system: geopoem based on new modelling, geological and geophysicaldata. Earth Planet. Sci. Lett. 174, 397–409.
Chen, L., Gerya, T.V., Zhang, Z.J., Aitken, A., Li, Z.H., Liang, X.F., 2013. Formationmechanism of steep convergent intracontinental margins: Insights from numer-ical modeling. Geophys. Res. Lett. 40, 2000–2005.
Clauser, C., Huenges, E., 1995. Thermal conductivity of rocks and minerals. In:Ahrens, T.J. (Ed.), Rock Physics and Phase Relations. In: Reference Shelf, vol. 3.American Geophysical Union, Washington, D.C., pp. 105–126.
Connolly, J.A.D., Petrini, K., 2002. An automated strategy for calculation of phasediagram sections and retrieval of rock properties as a function of physical con-ditions. J. Metamorph. Geol. 20, 697–708.
Connolly, J.A.D., 2005. Computation of phase equilibria by linear programming:A tool for geodynamic modeling and an application to subduction zone decar-bonation. Earth Planet. Sci. Lett. 236, 524–541.
Crameri, F., Schmeling, H., Golabek, G.J., Duretz, T., Orendt, R., Buiter, S.J.H., May,D.A., Kaus, B.J.P., Gerya, T.V., Tackley, P.J., 2012. A comparison of numerical sur-face topography calculations in geodynamic modelling: an evaluation of the‘sticky air’ method. Geophys. J. Int. 189, 38–54.
Davies, H.J., von Blanckenburg, F., 1995. Slab break-off: a model of lithosphere de-tachment and its test in the magmatism and deformation of collisional orogens.Earth Planet. Sci. Lett. 129, 85–102.
Duretz, T., Gerya, T.V., May, D.A., 2011. Numerical modelling of spontaneous slabbreak-off and subsequent topographic response. Tectonophysics 502, 244–252.
Duretz, T., Schmalholz, S.M., Gerya, T.V., 2012. Dynamics of slab detachment.Geochem. Geophys. Geosyst. 13, Q03020.
Faccenda, M., Gerya, T.V., Chakraborty, S., 2008. Styles of post-subduction collisionalorogeny: Influence of convergence velocity, crustal rheology and radiogenic heatproduction. Lithos 103, 257–287.
Ferrari, L., 2004. Slab detachment control on mafic volcanic pulse and mantle het-erogeneity in central Mexico. Geology 32, 77–80.
Funiciello, F., Moroni, M., Piromallo, C., Faccenna, C., Cenedese, A., Bui, H.A., 2006.Mapping mantle flow during retreating subduction: Laboratory models analyzedby feature tracking. J. Geophys. Res. 111, B03402.
Gerya, T.V., Yuen, D.A., 2003. Characteristics-based marker-in-cell method with con-servative finite-differences schemes for modeling geological flows with stronglyvariable transport properties. Phys. Earth Planet. Inter. 140, 293–318.
Gerya, T.V., Yuen, D.A., Maresch, W., 2004. Thermomechanical modelling of slab de-tachment. Earth Planet. Sci. Lett. 226, 101–116.
Gerya, T.V., Connolly, J.A.D., Yuen, D.A., Gorczyk, W., Capel, A.M., 2006. Seismic im-plications of mantle wedge plumes. Phys. Earth Planet. Inter. 156, 59–74.
Gerya, T.V., Yuen, D.A., 2007. Robust characteristics method for modelling multi-phase visco-elasto-plastic thermo-mechanical problems. Phys. Earth Planet. In-ter. 163, 83–105.
Gerya, T.V., Perchuk, L.L., Burg, J.-P., 2008a. Transient hot channels: Perpetrating andregurgitating ultrahigh-pressure, high-temperature crust-mantle associations incollision belts. Lithos 103, 236–256.
Gerya, T.V., Connolly, J.A.D., Yuen, D.A., 2008b. Why is terrestrial subduction one-sided? Geology 36, 43–46.
Gerya, T.V., 2010. Introduction to Numerical Geodynamic Modelling. Cambridge Uni-versity Press.
Gerya, T.V., Meilick, F.I., 2011. Geodynamic regimes of subduction under an activemargin: effects of rheological weakening by fluids and melts. J. Metamorph.Geol. 29, 7–31.
Gorczyk, W., Gerya, T.V., Connolly, J.A.D., Yuen, D.A., 2007a. Growth and mixing dy-namics of mantle wedge plumes. Geology 35, 587–590.
Gorczyk, W., Willner, A.P., Gerya, T.V., Connolly, J.A.D., Burg, J.-P., 2007b. Physicalcontrols of magmatic productivity at Pacific-type convergent margins: Numeri-cal modelling. Phys. Earth Planet. Inter. 163, 209–232.
Guillot, S., Maheo, G., de Sigoyer, D., Hattori, K.H., Pecher, A., 2008. Tethyan and In-dian subduction viewed from the Himalayan high- to ultrahigh-pressure meta-morphic rocks. Tectonophysics 451, 225–241.
110 Z.-H. Li et al. / Earth and Planetary Science Letters 380 (2013) 98–111
Hatzfeld, D., Molnar, P., 2010. Comparisons of the kinematics and deep structuresof the Zagros and Himalaya and of the Iranian and Tibetan plateaus and geody-namic implications. Rev. Geophys. 48, 2009RG000304.
Hubert-Ferrari, A., Armijo, R., King, G., Meyer, B., Barka, A., 2002. Morphology, dis-placement, and slip rates along the North Anatolian Fault, Turkey. J. Geophys.Res. 107 (B10), 2235.
Jolivet, L., Faccenna, C., Huet, B., et al., 2013. Aegean tectonics: Strain lo-calisation, slab tearing and trench retreat. Tectonophysics 597–598, 1,http://dx.doi.org/10.1016/j.tecto.2012.06.011.
Katz, R.F., Spiegelman, M., Langmuir, C.H., 2003. A new parameterisation of hydrousmantle melting. Geochem. Geophys. Geosyst. 4, 1073.
Le Pichon, X., Angelier, J., 1979. Hellenic arc and trench system – key to the neotec-tonic evolution of the eastern Mediterranean area. Tectonophysics 60, 1–42.
Li, Z., Gerya, T., 2009. Polyphase formation and exhumation of HP-UHP rocks in con-tinental subduction zone: Numerical modelling and application to the Sulu UHPterrane in eastern China. J. Geophys. Res. 114, B09406.
Li, Z.H., Gerya, T.V., Burg, J.P., 2010. Influence of tectonic overpressure on P-T pathsof HP-UHP rocks in continental collision zones: thermomechanical modeling. J.Metamorph. Geol. 28, 227–247.
Li, Z.H., Xu, Z.Q., Gerya, T.V., 2011. Flat versus steep subduction: contrasting modesfor the formation and exhumation of high- to ultrahigh-pressure rocks in conti-nental collision zones. Earth Planet. Sci. Lett. 301, 65–77.
Li, Z.H., Xu, Z.Q., Gerya, T.V., 2012. Numerical geodynamic modeling of continentalconvergent margins. In: Dar, I.A. (Ed.), Earth Sciences. Pub. InTech, pp. 273–296.
Li, Z.-H., Ribe, N.M., 2012. Dynamics of free subduction from 3-D boundary-elementmodeling. J. Geophys. Res. 117, B06408.
Liang, X.F., Sandvol, E., Chen, Y.J., Hearn, T., Ni, J., Klemperer, S., Shen, Y., Tilmann, F.,2012. A complex Tibetan upper mantle: A fragmented Indian slab and no south-verging subduction of Eurasian lithosphere. Earth Planet. Sci. Lett. 333–334,101–111.
Lister, G.S., Banga, G., Feenastra, A., 1984. Metamorphic core complexes ofCordilleran type in the Cyclades, Aegean Sea, Greece. Geology 12, 221–225.
Liu, M., Cui, X.J., Liu, F.T., 2004. Cenozoic rifting and volcanism in eastern China:a mantle dynamic link to the Indo–Asian collision? Tectonophysics 393, 29–42.
Liu, L., Stegman, D., 2012. Origin of Columbia River flood basalt controlled by prop-agating rupture of the Farallon slab. Nature 482, 386–389.
Marsellos, A.E., Kidd, W.S.F., 2008. Extension and exhumation of the Hellenic forearcridge in Kythera. J. Geol. 116, 640–651.
McClusky, S., Balassanian, S., Barka, A., et al., 2000. Global positioning system con-straints on plate kinematics and dynamics in the eastern Mediterranean andCaucasus. J. Geophys. Res. 105, 5695–5719.
Nikolaeva, K., Gerya, T.V., Connolly, J.A.D., 2008. Numerical modelling of crustalgrowth in intraoceanic volcanic arcs. Phys. Earth Planet. Inter. 171, 336–356.
Oreshin, S., Kiselev, S., Vinnik, L., Prakasamb, K.S., Rai, S.S., Makeyeva, L., Savvin, Y.,2008. Crust and mantle beneath western Himalaya, Ladakh and western Tibetfrom integrated seismic data. Earth Planet. Sci. Lett. 271, 75–87.
Owens, T.J., Zandt, G., 1997. Implication of crustal property variations for models ofTibetan plateau evolution. Nature 387, 37–43.
Peacock, S.M., 1990. Fluid processes in subduction zones. Science 248, 329–337.Peltzer, G., Tapponnier, P., 1988. Formation and evolution of strike-slip faults, rifts,
and basins during the India–Asia collision: an experimental approach. J. Geo-phys. Res. 93, 15,085–15,117.
Piromallo, C., Becker, T.W., Funiciello, F., Faccenna, C., 2006. Three-dimensional in-stantaneous mantle flow induced by subduction. Geophys. Res. Lett. 33, L08304.
Pope, D., Willett, C., 1998. Thermal–mechanical model for crustal thickening in thecentral Andes driven by ablative subduction. Geology 26 (6), 511–514.
Ranalli, G., 1995. Rheology of the Earth, Deformation and Flow Processes in Geo-physics and Geodynamics, second ed. Chapman & Hall.
Regard, V., Faccenna, C., Bellier, O., Martinod, J., 2008. Laboratory experiments of slabbreak-off and slab dip reversal: insight into the Alpine Oligocene reorganization.Terra Nova 20 (4), 267–273.
Reilinger, R., McClusky, S., Paradissis, D., Ergintav, S., Vernant, P., 2010. Geodetic con-straints on the tectonic evolution of the Aegean region and strain accumulationalong the Hellenic subduction zone. Tectonophysics 488, 22–30.
Ring, U., Brachert, T., Fassoulas, C., 2001. Middle Miocene graben development inCrete and its possible relation to large-scale detachment faults in the southernAegean. Terra Nova 13, 297–304.
Rogers, R.D., Karason, H., van der Hilst, R.D., 2002. Epeirogenic uplift above a de-tached slab in northern Central America. Geology 30 (11), 1031–1034.
Royden, R.H., Burchfiel, B.C., van der Hilst, R.D., 2008. The geological evolution ofthe Tibetan Plateau. Science 321, 1054–1058.
Ruh, J.B., Gerya, T., Burg, J.-P., 2013. High-resolution 3D numerical modeling of thrustwedges: Influence of decollement strength on transfer zones. Geochem. Geo-phys. Geosyst. 14 (4), 1131–1155, http://dx.doi.org/10.1002/ggge.20085.
Sengor, A.M.C., Tuysuz, O., Imren, C., Sakinc, M., Eyidogan, H., Gorur, N., Le Pichon,X., Rangin, C., 2005. The north Anatolian fault: a new look. Annu. Rev. EarthPlanet. Sci. 33, 37–112.
Schmeling, H., Babeyko, A.Y., Ennsa, A., et al., 2008. A benchmark comparison ofspontaneous subduction models – Towards a free surface. Phys. Earth Planet.Inter. 171, 198–223.
Schmalholz, S.M., 2011. A simple analytical solution for slab detachment. EarthPlanet. Sci. Lett. 304, 45–54.
Schellart, W.P., 2008. Kinematics and flow patterns in deep mantle and upper man-tle subduction models: Influence of the mantle depth and slab to mantle vis-cosity ratio. Geochem. Geophys. Geosyst. 9, Q03014.
Schellart, W.P., Stegman, D.R., Farrington, R.J., Moresi, L., 2011. Influence of lateralslab edge distance on plate velocity, trench velocity, and subduction partition-ing. J. Geophys. Res. 116, B10408.
Sobolev, S.V., Babeyko, A.Y., 2005. What drives orogeny in the Andes? Geology 33,617–620.
Stöckhert, B., Gerya, T.V., 2005. Pre-collisional high pressure metamorphism andnappe tectonics at active continental margins: a numerical simulation. TerraNova 17, 102–110.
Tao, W., O’Connell, R., 1992. Ablative subduction: a two-sided alternative to the con-ventional subduction model. J. Geophys. Res. 97 (B6), 8877–8904.
Tapponnier, P., Peltzer, G., Le Dain, A., Armijo, R., 1982. Propagating extrusion tecton-ics in Asia: New insights from simple experiments with plasticine. Geology 10,611–616.
Tapponnier, P., Peltzer, G., Armijo, R., 1986. On the mechanics of the collision be-tween India and Asia. In: Geol. Soc. London, Spec. Publ., vol. 19, pp. 115–157.
Tapponnier, P., Xu, Z., Roger, F., Meyer, B., Arnaud, N., Wittlinger, G., Yang, J., 2001.Oblique stepwise rise and growth of the Tibet Plateau. Science 294, 1671–1677.
Tilmann, F., Ni, J., INDEPTH III, 2003. Seismic imaging of the downwelling Indianlithosphere beneath central Tibet. Science 300, 1424–1427.
Ton, S.W.A., Wortel, M., 1997. Slab detachment in continental collision zones: ananalysis of controlling parameters. Geophys. Res. Lett. 24 (16), 2095–2098.
Toussaint, G., Burov, E., Jolivet, L., 2004. Continental plate collision: unstable vs. sta-ble slab dynamics. Geology 32, 33–36.
Turcotte, D.L., Schubert, G., 2002. Geodynamics, second ed. Cambridge UniversityPress.
Van der Hilst, R., Seno, T., 1993. Effects of relative plate motion on the deep struc-ture and penetration depth of slabs below the Izu-Bonin and Mariana islandarcs. Earth Planet. Sci. Lett. 120, 395–407.
Van der Voo, R., Spakman, W., Bijwaard, H., 1999. Tethyan subducted slabs underIndia. Earth Planet. Sci. Lett. 171, 7–20.
Van Hunen, J., Allen, M., 2011. Continental collision and slab break-off: A compar-ison of 3-D numerical models with observations. Earth Planet. Sci. Lett. 302,27–37.
Vernant, P., Nilforousshan, F., Hatzfeld, D., Abbassi, M., Vigny, C., Masson, F.,Nankali, H., Martinod, J., Ashtiani, A., Bayer, R., Tavakoli, F., Chery, J., 2004.Present-day crustal deformation and plate kinematics in the Middle East con-strained by GPS measurements in Iran and northern Oman. Geophys. J. Int. 157,381–398.
Wang, Q., Zhang, P., Freymueller, J., Bilham, R., Larson, K., Lai, X., You, X., Niu, Z.,Wu, J., Li, Y., Liu, J., Yang, Z., Chen, Q., 2001. Present-day crustal deformationin China constrained by global positioning system measurements. Science 294,574–577.
Warren, C.J., Beaumont, C., Jamieson, R.A., 2008. Modelling tectonic styles andultra-high pressure (UHP) rock exhumation during the transition from oceanicsubduction to continental collision. Earth Planet. Sci. Lett. 267, 129–145.
Westaway, R., 2004. Kinematic consistency between the Dead Sea Fault Zoneand the Neogene and Quaternary left-lateral faulting in SE Turkey. Tectono-physics 391, 203–237.
Wortel, M.J.R., Spakman, W., 2000. Subduction and slab detachment in theMediterranean–Carpathian region. Science 290, 1910–1917.
Xu, W.-C., Zhang, H.-F., Parrish, R., Harris, N., Guo, L., Yuan, H.-L., 2010. Timingof granulite-facies metamorphism in the eastern Himalayan syntaxis and itstectonic implications. Geology 485, 231–244.
Xu, Z., Ji, S., Cai, Z., Zeng, L., Geng, Q., Cao, H., 2012. Kinematics and dynamics ofthe Namche Barwa Syntaxis, eastern Himalaya: Constraints from deformation,fabrics and geochronology. Gondwana Res. 21, 19–36.
Yamato, P., Agard, P., Burov, E., Le Pourhiet, L., Jolivet, L., Tiberi, C., 2007. Burial andexhumation in a subduction wedge: Mutual constraints from thermomechani-cal modeling and natural P-T-t data (Schistes Lustres, western Alps). J. Geophys.Res. 112, B07410.
Yamato, P., Burov, E., Agard, P., Le Pourhiet, L., Jolivet, L., 2008. HP-UHP exhuma-tion during slow continental subduction: Self-consistent thermodynamicallyand thermomechanically coupled model with application to the Western Alps.Earth Planet. Sci. Lett. 271, 63–74.
Yin, A., 2006. Cenozoic tectonic evolution of the Himalayan orogen as constrainedby along-strike variation of structural geometry, exhumation history, andforeland sedimentation. Earth-Sci. Rev. 76, 1–131.
Yin, A., 2010. Cenozoic tectonic evolution of Asia: A preliminary synthesis. Tectono-physics 488, 293–325.
Zandt, G., Humphreys, E., 2008. Toroidal mantle flow through the western U.S. slabwindow. Geology 36, 295–298.
Zeck, H.P., 1996. Betic-Rif orogeny: Subduction of Mesozoic Tethys litho-sphere under eastward drifting Iberia, slab detachment shortly before22 Ma, and subsequent uplift and extensional tectonics. Tectonophysics 254,1–16.

Z.-H. Li et al. / Earth and Planetary Science Letters 380 (2013) 98–111 111
Zeitler, P.K., Meltzer, A.S., Koons, P.O., Craw, D., Hallet, B., Chamberlain, C.P., Kidd,W., Park, S.K., Seeber, L., Bishop, M., Shroder, J., 2001. Erosion, Himalayan geo-dynamics, and the geomorphology of metamorphism. GSA Today 11 (1), 4–9.
Zhang, P., Shen, Z., Wang, M., Gan, W., Burgmann, R., Molnar, P., Wang, Q.,Niu, Z., Sun, J., Wu, J., Hanrong, S., Xinzhao, Y., 2004. Continuous deforma-
tion of the Tibetan Plateau from global positioning system data. Geology 32,809–812.
Zhu, G., Gerya, T.V., Yuen, D.A., Honda, S., Yoshida, T., Connolly, J.A.D., 2009. 3-Ddynamics of hydrous thermal–chemical plumes in oceanic subduction zones.Geochem. Geophys. Geosyst. 10, Q11006.


![Numerical approach to the Stokes problem with high contrasts in viscosityjupiter.ethz.ch/~tgerya/reprints/2014_AMC_Lobanov.pdf · 2017. 4. 10. · et al. [9]. In simulation of two](https://static.fdocuments.us/doc/165x107/6119a92c0e4d8570ed5a31e9/numerical-approach-to-the-stokes-problem-with-high-contrasts-in-tgeryareprints2014amclobanovpdf.jpg)


![Inherent gravitational instability of thickened ...jupiter.ethz.ch/~tgerya/reprints/2001_EPSL_granulites.pdf · b selective thickening of the continental crust in orogenic belts [5];](https://static.fdocuments.us/doc/165x107/5f11cf7fe4418d0d5e0a413d/inherent-gravitational-instability-of-thickened-tgeryareprints2001epslgranulitespdf.jpg)
![Modeling the seismic cycle in subduction zones: …jupiter.ethz.ch/~tgerya/reprints/2014_GRL_Ylona.pdfGeophysicalResearchLetters 10.1002/2013GL058886 wedgetheory[WangandHu,2006].Theyalsorevealthatoff-megathrusteventshaveadistinctimpactonthemegathrustseismiccycle.](https://static.fdocuments.us/doc/165x107/5fc0947f6e99545a517434bc/modeling-the-seismic-cycle-in-subduction-zones-tgeryareprints2014grlylonapdf.jpg)