P T–fluid evolution in the Mahalapye Complex, Limpopo high...
22
P–T–fluid evolution in the Mahalapye Complex, Limpopo high-grade terrane, eastern Botswana K. HISADA, 1 L. L. PERCHUK, 1,2 T. V. GERYA, 1 D. D. VAN REENEN 3 AND B. K. PAYA 4 1 Institute of Experimental Mineralogy, Russian Academy of Sciences, Chernogolovka, Moscow District, 142432 Russia ([email protected]) 2 Department of Petrology, Geological Faculty, Moscow State University, Moscow, 119899, Russia ([email protected]) 3 Department of Geology, Rand Afrikaans University, PO Box 524, Auckland Park 2006, Johannesburg, South Africa 4 Geological Survey of Botswana, Private Bag 14, Lobatse, Botswana ABSTRACT Metapelites, migmatites and granites from the c. 2 Ga Mahalapye Complex have been studied for determining the P–T–fluid influence on mineral assemblages and local equilibrium compositions in the rocks from the extreme southwestern part of the Central Zone of the Limpopo high-grade terrane in Botswana. It was found that fluid infiltration played a leading role in the formation of the rocks. This conclusion is based on both well-developed textures inferred to record metasomatic reactions, such as Bt Þ And + Qtz + (K 2 O) and Bt ± Qtz Þ Sil + Kfs + Ms ± Pl, and zonation of Ms | Bt + Qtz | And + Qtz and Grt | Crd | Pl | Kfs + Qtz reflecting a perfect mobility (Korzhinskii terminology) of some chemical components. The conclusion is also supported by the results of a fluid inclusion study. CO 2 and H 2 O(a fl H2 O ¼ 0.6) are the major components of the fluid. The fluid has been trapped synchronously along the retrograde P–T path. The P–T path was derived using mineral thermo- barometry and a combination of mineral thermometry and fluid inclusion density data. The Mahalapye Complex experienced low-pressure granulite facies metamorphism with a retrograde evolution from 770 °C and 5.5 kbar to 560 °C and 2 kbar, presumably at c. 2 Ga. Key words: fluid inclusions; fluid infiltration; granulite-facies Limpopo high-grade terrane; metasoma- tism; migmatization. INTRODUCTION The Limpopo high-grade terrane (HGT) is located in between the Zimbabwe and Kaapvaal Cratons (e.g. van Reenen et al., 1987, 1990; Roering et al., 1992; van Reenen & Smit, 1996; Schaller et al., 1999). The Central Zone of this high-grade terrane experienced high-grade metamorphism and deformation at c. 2.6 Ga (e.g. Barton & van Reenen, 1992; also see Holzer et al., 1998; Kro¨ner et al., 1998), and at c. 2 Ga (e.g. Barton et al., 1994; Kamber et al., 1995; Jaeckel et al., 1997; Holzer et al., 1998, 1999; Kro¨ner et al., 1998; Schaller et al., 1999; Boshoff et al., 2004; van Reenen et al., 2004). This zone is separated from the Northern Marginal Zone and the Southern Marginal Zone (e.g. Watkeys, 1983; McCourt & Vearncombe, 1987; Fig. 1) by two major Palaeopro- terozoic inward-dipping strike-slip mylonitic zones, the Palala and Triangle Shear Zones, whereas the marginal zones are bounded by major, Late Archean inward-dipping ductile shear zones with reverse sense of motion, the Hout River Shear Zone in the south and the North Limpopo Thrust Zone (e.g. McCourt & Vearncombe, 1987; van Reenen et al., 1992; Mkweli et al., 1995; Schaller et al., 1999; Kreissig et al., 2001; Fig. 1). There have been several fluid inclusion studies in the Limpopo HGT. Dense CO 2 -rich and/or high- saline aqueous fluid inclusions inferred to have been trapped during high-grade metamorphism were reported from the Southern Marginal Zone, and interpreted as local fluids or rehydration fluids of granulites (van Reenen & Hollister, 1988; van Reenen et al., 1994; van den Berg & Huizenga, 2001). In contrast, low-saline aqueous fluid inclusions related to charnockitization were reported from the Northern Marginal Zone (Tojo et al., 1994). Low-saline aque- ous fluid inclusions have been recognized as fluids rehydrating K 2 O-poor granulites from the Central Zone (Hisada et al., 1994; Hisada & Miyano, 1996). Klemd et al. (2003) described CO 2 -, CO 2 –H 2 O- and H 2 O-rich inclusions in metapelites and marbles of a klippe in the Venetia area. Because the fluid inclu- sions from all three granulite zones may be related to chronologically different metamorphic events, we are unable to make any conclusion on the behaviour of a fluid during the exhumation and emplacement of the Limpopo HGT. The Mahalapye Complex, also named the Mahala- pye Plutonic Block (e.g. Hisada et al., 2000), of the Central Zone in Botswana comprises c. 2 Ga migma- tites and granites (e.g. Key et al., 1983; Holzer et al., J. metamorphic Geol., 2005, 23, 313–334 doi:10.1111/j.1525-1314.2005.00579.x Ó 2005 Blackwell Publishing Ltd 313
Transcript of P T–fluid evolution in the Mahalapye Complex, Limpopo high...

P–T–fluid evolution in the Mahalapye Complex, Limpopohigh-grade terrane, eastern Botswana
K. HISADA,1 L. L . PERCHUK,1 ,2 T . V. GERYA,1 D. D. VAN REENEN3 AND B. K. PAYA4
1Institute of Experimental Mineralogy, Russian Academy of Sciences, Chernogolovka, Moscow District, 142432 Russia([email protected])2Department of Petrology, Geological Faculty, Moscow State University, Moscow, 119899, Russia ([email protected])3Department of Geology, Rand Afrikaans University, PO Box 524, Auckland Park 2006, Johannesburg, South Africa4Geological Survey of Botswana, Private Bag 14, Lobatse, Botswana
ABSTRACT Metapelites, migmatites and granites from the c. 2 Ga Mahalapye Complex have been studied fordetermining the P–T–fluid influence on mineral assemblages and local equilibrium compositions in therocks from the extreme southwestern part of the Central Zone of the Limpopo high-grade terrane inBotswana. It was found that fluid infiltration played a leading role in the formation of the rocks. Thisconclusion is based on both well-developed textures inferred to record metasomatic reactions, such asBt � And + Qtz + (K2O) and Bt ± Qtz � Sil + Kfs + Ms ± Pl, and zonation of Ms | Bt + Qtz |And + Qtz and Grt | Crd | Pl | Kfs + Qtz reflecting a perfect mobility (Korzhinskii terminology) ofsome chemical components. The conclusion is also supported by the results of a fluid inclusion study.CO2 and H2O (aflH2O
¼ 0.6) are the major components of the fluid. The fluid has been trappedsynchronously along the retrograde P–T path. The P–T path was derived using mineral thermo-barometry and a combination of mineral thermometry and fluid inclusion density data. The MahalapyeComplex experienced low-pressure granulite facies metamorphism with a retrograde evolution from770 �C and 5.5 kbar to 560 �C and 2 kbar, presumably at c. 2 Ga.
Key words: fluid inclusions; fluid infiltration; granulite-facies Limpopo high-grade terrane; metasoma-tism; migmatization.
INTRODUCTION
The Limpopo high-grade terrane (HGT) is located inbetween the Zimbabwe and Kaapvaal Cratons (e.g.van Reenen et al., 1987, 1990; Roering et al., 1992;van Reenen & Smit, 1996; Schaller et al., 1999). TheCentral Zone of this high-grade terrane experiencedhigh-grade metamorphism and deformation atc. 2.6 Ga (e.g. Barton & van Reenen, 1992; also seeHolzer et al., 1998; Kroner et al., 1998), and atc. 2 Ga (e.g. Barton et al., 1994; Kamber et al., 1995;Jaeckel et al., 1997; Holzer et al., 1998, 1999; Kroneret al., 1998; Schaller et al., 1999; Boshoff et al., 2004;van Reenen et al., 2004). This zone is separated fromthe Northern Marginal Zone and the SouthernMarginal Zone (e.g. Watkeys, 1983; McCourt &Vearncombe, 1987; Fig. 1) by two major Palaeopro-terozoic inward-dipping strike-slip mylonitic zones,the Palala and Triangle Shear Zones, whereas themarginal zones are bounded by major, Late Archeaninward-dipping ductile shear zones with reverse senseof motion, the Hout River Shear Zone in the southand the North Limpopo Thrust Zone (e.g. McCourt& Vearncombe, 1987; van Reenen et al., 1992;Mkweli et al., 1995; Schaller et al., 1999; Kreissiget al., 2001; Fig. 1).
There have been several fluid inclusion studies inthe Limpopo HGT. Dense CO2-rich and/or high-saline aqueous fluid inclusions inferred to have beentrapped during high-grade metamorphism werereported from the Southern Marginal Zone, andinterpreted as local fluids or rehydration fluids ofgranulites (van Reenen & Hollister, 1988; van Reenenet al., 1994; van den Berg & Huizenga, 2001). Incontrast, low-saline aqueous fluid inclusions related tocharnockitization were reported from the NorthernMarginal Zone (Tojo et al., 1994). Low-saline aque-ous fluid inclusions have been recognized as fluidsrehydrating K2O-poor granulites from the CentralZone (Hisada et al., 1994; Hisada & Miyano, 1996).Klemd et al. (2003) described CO2-, CO2–H2O- andH2O-rich inclusions in metapelites and marbles of aklippe in the Venetia area. Because the fluid inclu-sions from all three granulite zones may be related tochronologically different metamorphic events, we areunable to make any conclusion on the behaviour of afluid during the exhumation and emplacement of theLimpopo HGT.
The Mahalapye Complex, also named the Mahala-pye Plutonic Block (e.g. Hisada et al., 2000), of theCentral Zone in Botswana comprises c. 2 Ga migma-tites and granites (e.g. Key et al., 1983; Holzer et al.,
J. metamorphic Geol., 2005, 23, 313–334 doi:10.1111/j.1525-1314.2005.00579.x
� 2005 Blackwell Publishing Ltd 31 3

1999; Hisada et al., 2000; Chavagnac et al., 2001;Figs 1 & 2); these rocks contain abundant fluid inclu-sions. The aim of this paper is to investigate theP–T–fluid evolution in the course of the secondmetamorphism and exhumation of the Central Zone.
Symbols
Mineral symbols follow Kretz (1983). Other symbolsare as follows: Akfs – alkali feldspar; Als – Al2SiO5-minerals; Cla – clathrate; Fib – fibrolite; Fl – fluid; L –
aqueous or carbonic liquid; M – melt; Opa – opaqueminerals; V – vapour. Molar fractions and activity:XMg ¼ Mg/(Mg + Fe); X0
Mg ¼ Mg/(Mg + Fe +Mn); XMn ¼ Mn/(Mg + Fe + Mn); XAb ¼ Na/(Na + Ca + K); XAn ¼ Ca/(Na + Ca + K); XOr ¼K/(Na + Ca + K); Xfl
CO2¼ CO2/(CO2 + H2O);
XflH2O
¼ H2O/(CO2 + H2O); aflH2O¼ water activity of
fluid.
PETROGRAPHY AND MINERAL CHEMISTRY
Granites and migmatites (e.g. B5-5 in Fig. 2) are themajor rock types in the studied area. In places theycontain blocks of ortho- and paragneisses such asmetapelite and amphibolite (Fig. 3a,b). Samples (B5-5A1 & B5-5A2) were collected from a metapelitic block10 · 20 m in size, which differs from the surroundingmigmatite by the presence of a well-developed foli-ation. Migmatite (e.g. samples B5-5Z, B5-5G-N1 &B5-5Y) has a stromatic structure (Fig. 3d–f) and ischaracterized by the presence of feldspar megacrysts.The migmatites contain a few garnet-free amphiboliteblocks (Hbl + Opx + Pl + Qtz), rims of which areoverprinted by reaction zones c. 2 cm wide (Fig. 3b).Porphyritic granite (samples B5-5J, B5-5S & B5-5AC)contains some blocks of massive medium-grainedgranite (sample B5-5H). Undeformed aplite veins (e.g.sample B5-5S) cross cut both the granite and themigmatite (Fig. 3a). We studied the metapelite, graniteand migmatite only; mineral assemblages are shown inTable 1.Mineral chemistry was studied using both the
Cameca electron microprobe analyser and the JEOLscanning electron microscope (JSM-5600) at the Rand
Fig. 2. Simplified geological map of the Mahalapye Complex in the Central Zone of the Limpopo high-grade terrane in Botswana,showing the locality of the studied outcrop (B5-5) (after Skinner, 1978; Key, 1979; Ermanovics, 1980; Key et al., 1983).
Fig. 1. Geological map of the Limpopo high-grade terrane,modified mainly from Key et al. (1983), Rollinson & Blenkinsop(1995) and Aldiss (1991). The box shows the study area (seeFig. 2). B, Botswana; CZ, Central Zone; KC, Kaapvaal Craton;MC, Mahalapye Complex; NMZ, Northern Marginal Zone; SA,South Africa; SMZ, Southern Marginal Zone; S.Z., Shear Zone;Z, Zimbabwe; ZC, Zimbabwe Craton.
3 14 K . H ISADA E T A L .
� 2005 Blackwell Publishing Ltd

MT
AMReactionzone
(b)
3 cm
(d)
Pl layer
leucosome
melanosome
Pl layer
Qtz-poor
portion(B
5-5A1)
Kfs leucosome
3 cm
stromatic portion(Kfs-bearing)
(e)
wideleucosome
AV
MT
GR
GR
MPAC
J
GY A
HS
Z(a)
Grt+Crd-richband (Kfs-free)
(c)
(f)
about 2 cm
Qtz-rich
portion(B
5-5A2)
Pl layer
stromatic portion(Kfs-free)
Crd+Qtz-rich band
Leucosom
eB
5-5Y
stromatic portion
20 cm
Kfs+Qtz-richleucosome
Pl layerGrt+Crd+Sil-rich band
MigmatiteB5-5Z
Migmatite B5-5G-N1
Fig. 3. (a) Occurrences and localities of the samples: locality B5-5, Mahalapye Migmatite unit of the Mahalapye Complex, easternBotswana. AV, aplite vein; GR, granite; MP, metapelite; MT, migmatite (see text for explanation). Localities of samples: A, B5-5A1 and B5-5A2; AC, B5-5AC; G, B5-5G-N1; H, B5-5H; J, B5-5J; S, B5-5S; Y, B5-5Y; Z, B5-5Z. (b) An amphibolite block (AM)in the migmatite. A reaction zone rims the amphibolite. (c–f) The rock faces of the samples: (c) a schematic drawing of samplesB5-5A1 and B5-5A2; (d) a photograph of sample B5-5Z; (e) a photograph of sample B5-5G-N1; and, (f) schematic occurrence ofsample B5-5Y in the outcrop.
P–T–FLUID EVOLUT ION IN THE L IMPOPO HGT 31 5
� 2005 Blackwell Publishing Ltd

Afrikaans University, and using a CamScan scanningelectron microscope, MV2300 (TS 5130MM) at theInstitute of Experimental Mineralogy of the RussianAcademy of Sciences (Chernogolovka, Moscow Dis-trict). The Cameca and the CamScan microprobes areequipped with energy-dispersive Link and INCA sys-tems, respectively. The JEOL microprobe is equippedwith an energy-dispersive system. Data obtained withthe JEOL are not consistent with those from the Linkand INCA systems, and were used after adjustment tothe systems. Consistency of the results obtained withall three microprobes was tested by using the same thinsections. Representative analyses of minerals are givenin Table 2.
Metapelite
Metapelite consists of quartz-poor and -rich portions(see scheme in Fig. 3c). Mineral compositions andtextures are shown in Table 1 and Fig. 4(a–c) (samplesB5-5A1 & B5-5A2). K-feldspar leucosomes are presentin the quartz-poor portion, whereas the Kfs + Qtz-rich leucosomes (with a small amount of plagioclase)are developed in the quartz-rich portion and in betweenthe quartz-poor and -rich portions (Fig. 3c). TheKfs + Qtz-rich leucosome is, in places, deformed to-gether with the host rocks. The quartz-poor portion isrepresented by the Grt + Crd + Sil-rich assemblagewithout matrix quartz (Table 1), whereas the quartz-rich portion has compositional banding composed ofboth the Grt + Crd-rich (K-feldspar-free) and theCrd + Qtz-rich assemblages (Fig. 3c). Modes of bio-tite, plagioclase and quartz in the Grt + Crd-rich bandare relatively small (c. 2–10 modal % for each phase).
In both portions, garnet cores (<2 mm in size) areusually riddled with quartz and/or feldspar inclusions(Fig. 4a,b), whereas the rims are inclusion-poor but, inplaces, contain sillimanite and/or cordierite. The cor-dierite inclusions are not primary because the cordieritereplaces the sillimanite inclusions in garnet. Garnet inthe quartz-poor portion usually has an elongatedshape, whereas rounded garnet is common in thequartz-rich portion. Note that garnet in both portionsis not significantly replaced by cordierite (Fig. 4a,b).Chemical zoning of the garnet is similar in both por-tions: XMg ¼ 0.13–0.11 in cores and 0.11–0.06 in rims(Fig. 5a). Grossular (2–3 mol.%) and spessartine (3–5mol.%) components are almost constant from core torim (Fig. 5a). Cordierite in the quartz-rich portion hasunzoned cores with XMg ¼ 0.46–0.48 and rims withXMg ¼ 0.47–0.55, whereas larger biotite (about 2 mmlong) grains have a limited range of XMg (0.29–0.31) incomparison with other biotite grains (XMg ¼ 0.27–0.36). Cordierite cores in the quartz-poor portion haveslightly low XMg (0.42–0.45).Sillimanite-rich micro-shear zones are developed in
the quartz-poor portion (Fig. 4a), but orientated thinsections reveal that the sillimanite defines a very weaklineation only. The quartz-rich portion (sampleB5-5A2) is characterized by the presence of both silli-manite and andalusite (this is the first description ofandalusite in the rocks from the Limpopo HGT). Sil-limanite occurs within cordierite and garnet (e.g.Fig. 4b) or at grain boundaries between cordieritegrains only, whereas andalusite forms part of thezonation Ms | Bt + Qtz | And + Qtz (I, II and III inFig. 4c). Note that relics of biotite were observed inzone III (Fig. 4c).
Table 1. Constituent minerals of represen-tative rocks in the study area (locality B5-5).
Sample No.
Metapelite
B5-5A1
Qtz-poor portion Grt + Bt + Crd + Kfs + Pl + Sil ± Spl ± Ilm ± Zrn (Qtz in Grt)
B5-5A2
Qtz-rich portion
Grt + Crd-rich bands Grt + Bt + Crd + Pl + Qtz ± And ± Ilm (Sil in Grt/Crd, Spl in Crd)
Crd + Qtz-rich bands Crd + Pl + Qtz ± Grt ± Bt ± And ± Kfs ± Ms*1 ± Ilm (Sil in Grt/Crd,
Spl in Crd, Rt in Bt)
Migmatite
B5-5Z
Melanosomes Grt + Bt + Crd + Sil ± And ± Fib ± Pl ± Qtz ± Ms*1 ± Spl ± Ilm ± Zrn
Leucosomes Kfs + Qtz ± Grt ± Bt ± And ± Pl ± Ms*2,3 ± Ilm ± Zrn ± Mnz (Rt in Bt)
B5-5G-N1
Stromatic portions Grt + Bt + Crd + Kfs#1 + Pl + Qtz ± Ms*2 ± Py ± Ilm ± Zrn ± Mnz
(Sil in Pl/Crd)
Wide leucosome Pl + Qtz + pinite ± Grt ± Bt ± Kfs ± Ms*1,2 ± Opa ± Zrn ± Mnz
B5-5Y
Leucosome Qtz + Kfs ± Grt ± pinite ± Bt ± Pl ± Ms*1,2 ± Opa ± Zrn ± Mnz
Granite
B5-5J Kfs + Pl + Qtz ± Grt ± Ms*2
B5-5S (granite part) Kfs + Pl + Qtz + Grt + Bt ± Ms*2 ± Zrn
B5-5AC Kfs + Qtz + Bt ± And ± Pl ± Ms*1,2 ± Opa ± Zrn
B5-5H Kfs + Pl + Qtz ± Grt ± Bt ± Ms*2
Aplite vein
B5-5S (aplite part) Kfs + Pl + Qtz ± Grt ± Bt ± Sil ± Ms*1,2 (Spl in Grt)
�±�: minor abundance; *1replacing biotite; *2replacing feldspar; *3replacing andalusite; #1absent from some portions.
Cordierite, biotite and ilmenite are partly replaced by pinite, chlorite and rutile + chlorite, respectively.
Pyrite is replaced by iron-rich minerals (probably limonite), whereas spinel usually shows exsolution lamellae (probably
magnetite) and is partly replaced by a Al2O3-rich mineral (not identified).
3 16 K . H ISADA E T A L .
� 2005 Blackwell Publishing Ltd

Table 2. Representative electron microprobe analyses (wt%) of minerals from the samples.
Mineral: Garnet Cordierite
Rock type.: Metapelite Migmatite Granite Aplite vein Metapelite
Sample No.: B5-5A1 B5-5A2 B5-5G-N1 B5-5Z B5-5S B5-5A1
Spot: E25† E75† 1089 199 801 806 516 580 31-12� 1163 13-4� E38† E74†
Core Rim Core Rim Core Rim Core Core Rim Core Core Core Rim
Kfs-bearing Kfs-free
SiO2 36.86 36.87 37.86 37.46 38.08 37.49 37.74 37.47 36.59 38.19 35.86 48.43 48.53
TiO2 0.00 0.00 0.04 0.00 0.00 0.16 0.02 0.00 0.07 0.00 0.00 0.00 0.00
Al2O3 20.77 20.62 21.21 21.39 21.69 21.54 21.38 21.51 21.12 21.49 20.63 32.65 33.14
Cr2O3 0.00 0.00 0.01 0.12 0.00 0.02 0.00 0.06 0.00 0.00 0.00 0.00 0.00
FeO* 36.85 38.01 37.32 37.68 34.27 35.23 34.63 36.24 34.32 36.45 32.33 12.75 11.87
MnO 1.31 1.82 1.25 1.27 2.69 2.60 3.21 1.81 5.09 1.60 10.23 0.39 0.20
NiO
MgO 2.80 1.77 3.12 2.22 4.12 2.97 3.24 2.86 1.86 3.21 0.48 5.28 6.07
CaO 0.81 0.71 0.74 0.74 0.83 0.63 0.77 0.76 0.80 0.78 0.32 0.00 0.00
Na2O 0.10 0.10 0.10 0.08 0.09 0.04 0.05 0.17 0.09 0.13 0.00 0.10 0.20
K2O 0.00 0.00 0.03 0.01 0.00 0.00 0.00 0.00 0.00 0.00 0.11 0.00 0.00
ZnO 0.40 0.00 0.39 0.00
ZrO2
V2O3 0.10 0.10 0.00 0.00
Cl 0.07 0.05
F 0.00 0.00
Total 100.00 100.00 101.68 100.97 101.77 100.68 101.04 100.88 100.01 101.85 100.01 99.99 100.01
No. of O 12 12 12 12 12 12 12 12 12 12 12 18 18
Numbers of ions
Si 2.99 3.01 3.01 3.00 3.00 3.00 3.01 3.00 2.98 3.02 2.97 5.02 4.99
Ti 0.00 0.00 0.00 0.00 0.00 0.01 0.00 0.00 0.00 0.00 0.00 0.00 0.00
Al 1.99 1.98 1.98 2.02 2.01 2.03 2.01 2.03 2.03 2.00 2.01 3.98 4.02
Cr 0.00 0.00 0.00 0.01 0.00 0.00 0.00 0.00 0.00 0.00 0.00 0.00 0.00
Fe2+ 2.50 2.59 2.48 2.53 2.25 2.35 2.31 2.42 2.34 2.41 2.24 1.10 1.02
Mn 0.09 0.13 0.08 0.09 0.18 0.18 0.22 0.12 0.35 0.11 0.72 0.03 0.02
Ni
Mg 0.34 0.22 0.37 0.27 0.48 0.35 0.38 0.34 0.23 0.38 0.06 0.82 0.93
Ca 0.07 0.06 0.06 0.06 0.07 0.05 0.07 0.07 0.07 0.07 0.03 0.00 0.00
Na 0.02 0.02 0.02 0.01 0.01 0.01 0.01 0.03 0.01 0.02 0.00 0.02 0.04
K 0.00 0.00 0.00 0.00 0.00 0.00 0.00 0.00 0.00 0.00 0.01 0.00 0.00
Zn 0.02 0.00 0.03 0.00
Zr
V 0.01 0.01 0.00 0.00
Cl 0.01 0.01
F 0.00 0.00
Total ()Cl, F) 8.03 8.02 8.00 7.99 8.00 7.98 8.01 8.01 8.01 8.01 8.04 11.00 11.02
Mole fractions
XMg 0.12 0.08 0.13 0.10 0.18 0.13 0.14 0.12 0.09 0.14 0.03 0.42 0.48
X0Mg 0.12 0.07 0.13 0.09 0.17 0.12 0.13 0.12 0.08 0.13 0.02
Mineral: Cordierite Biotite Feldspar
Rock type: Metapelite Migmatite Metapelite Migmatite Granite Aplite vein
Sample No.: B5-5A2 B5-5G-N1 B5-5A2 B5-5G-N1 B5-5Z B5-5S
Spot: 1064 193 821 541 928 820 808 538 614 31-13� 1147 1135 12-2� 12-11�Core Rim Core Core Core Isolated Near Grt Core Isolated Near Grt Isolated Assemblage Sil + Kfs + Ms ± Pl
Kfs-bearing Kfs-free Kfs-bearing Kfs-free relic
SiO2 48.80 48.78 48.78 48.87 34.72 34.62 35.65 35.40 33.50 36.18 35.24 33.46 64.78 66.95
TiO2 0.01 0.00 0.00 0.00 3.70 4.89 2.02 2.80 4.05 3.83 3.77 0.69 0.07 0.05
Al2O3 32.98 33.04 33.21 33.00 18.31 18.00 19.15 18.95 18.37 19.40 19.02 20.32 18.48 20.00
Cr2O3 0.00 0.00 0.06 0.12 0.18 0.14 0.00 0.16 0.13 0.00 0.00 0.03 0.00 0.00
FeO* 12.16 11.65 10.31 10.03 24.15 22.27 18.28 21.24 24.82 24.84 23.04 28.80 0.00 0.06
MnO 0.01 0.15 0.15 0.24 0.08 0.13 0.00 0.09 0.14 0.04 0.30 0.33 0.02 0.06
NiO 0.26 0.03 0.02 0.19 0.00 0.00 0.00 0.05 0.00 0.00 0.00
MgO 5.81 6.14 6.79 7.06 5.79 6.93 10.10 8.11 5.29 5.79 6.65 2.67 0.00 0.00
CaO 0.00 0.04 0.00 0.00 0.00 0.00 0.00 0.00 0.00 0.00 0.00 0.00 0.05 0.94
Na2O 0.11 0.06 0.07 0.10 0.15 0.18 0.13 0.21 0.12 0.29 0.20 0.13 0.78 11.51
K2O 0.05 0.00 0.09 0.02 9.00 9.41 9.49 9.22 9.08 9.35 9.48 9.35 15.78 0.12
ZnO 0.33 0.00 0.00 0.07 0.34 0.00 0.28 0.00 0.26 0.19 0.43
ZrO2 0.00 0.00 0.00 0.00 0.00 0.00 0.12 0.00 0.00 0.00
Cl 0.02 0.05 0.01 0.01 0.47 0.16 0.12 0.18 0.27 0.27 0.36 0.87 0.04 0.03
F 0.00 0.00 0.29
Total 100.54 99.94 99.49 99.71 96.89 96.73 95.34 96.41 96.03 99.99 98.25 97.08 100.00 100.01
P–T–FLUID EVOLUT ION IN THE L IMPOPO HGT 31 7
� 2005 Blackwell Publishing Ltd

Plagioclase is not abundant within the Kfs + Qtz-rich leucosome, but plagioclase layers rim these leu-cosomes (Fig. 3c). The plagioclase layer also occurs inmigmatite B5-5Z (Figs 3d & 4f,g). Similar plagioclaselayers were observed along edges of the K-feldsparleucosome in the quartz-poor portion (Fig. 3c).
Migmatite
Three samples of migmatite have been studied in detail(Table 1). Migmatite B5-5Z shows millimetre-scalestromatic structure consisting of Kfs + Qtz-richleucosomes and melanosomes (up to 2 cm; Fig. 3d).Migmatite B5-5G-N1 consists of millimetre-scalestromatic portions with a 4–5-cm-wide leucosome thatis rich in plagioclase and quartz (Table 1; Fig. 3e).Boundaries between leucosomes and melanosomeswithin the stromatic portion (sample B5-5G-N1) arenot sharply defined under the microscope. A quartz-dominated leucosome (sample B5-5Y) forms part of afolded structure in the migmatite (Fig. 3f).
Andalusite in migmatite B5-5Z shows intergrowthswith quartz that replace biotite (similar to Fig. 4c), andin places contains relics of K-feldspar and some biotite(Fig. 4d). In addition, And + Sil, And + Sil + Fiband Fib + Sil associations were observed (e.g.Fig. 4e,f). In the leucosome, secondary muscovitereplaces andalusite. Similar to the metapelite, theplagioclase layer (cores: XAb ¼ 0.74–0.76; rims:XAb ¼ 0.76–0.81) was formed as a zone in between the
melanosome and the leucosome, or in between mel-anosomes (Figs 3d & 4f,g). Garnet in the melanosomeis strongly replaced by cordierite (XMg ¼ 0.46–0.48),which forms part of the zonation Grt | Crd | Pl |Kfs + Qtz (Fig. 4g). In both the leucosome and themelanosome garnet has X0
Mg ¼ 0.12–0.10 in cores andX0
Mg ¼ 0.11–0.06 in rims, whereas X0Mg of biotite ran-
ges from 0.26 to 0.37. Grossular component in garnetis almost constant (2–3 mol.%) from core to rim,whereas spessartine component varies from 5–7 mol.%in central portions up to 14 mol.% in rims. K-feldsparin the leucosome is microperthitic (XOr ¼ around 0.81)but partly replaced by secondary orthoclase (XOr ¼ upto 0.95) and albite segregations.Migmatite B5-5G-N1 is poor in sillimanite and
contains no andalusite (Table 1). Sillimanite onlyoccurs as inclusions in plagioclase and cordierite.K-feldspar (XOr ¼ 0.80–0.82) is unevenly distributedand is absent from some portions (Fig. 3e). Opticallyzoned garnet with a pinkish core sharply bounded by apale-pink rim was observed in a 300 lm-thick section(Fig. 4h). Trails of solid–gaseous inclusions in thegarnet core terminate at the boundary with the pale-pink rim (Fig. 4h), although the garnet shows no dis-tinct chemical change at the colour boundary (Fig. 5b).Garnet compositions depend on variations of bulkcompositions. Garnet from the K-feldspar-bearingportion shows X0
Mg ¼ 0.17–0.15 in cores and 0.16–0.06in rims, whereas garnet from the K-feldspar-free por-tion has X0
Mg ¼ 0.14–0.13 in cores and 0.13–0.08 in
Table 2. (Cont’d).
Mineral: Cordierite Biotite Feldspar
Rock type: Metapelite Migmatite Metapelite Migmatite Granite Aplite vein
Sample No.: B5-5A2 B5-5G-N1 B5-5A2 B5-5G-N1 B5-5Z B5-5S
Spot: 1064 193 821 541 928 820 808 538 614 31-13� 1147 1135 12-2� 12-11�Core Rim Core Core Core Isolated Near Grt Core Isolated Near Grt Isolated Assemblage Sil + Kfs + Ms ± Pl
No. of O 18 18 18 18 22 22 22 22 22 22 22 22 8 8
Numbers of ions
Si 5.01 5.01 5.01 5.01 5.36 5.30 5.41 5.38 5.24 5.37 5.33 5.31 2.99 2.95
Ti 0.00 0.00 0.00 0.00 0.43 0.56 0.23 0.32 0.48 0.43 0.43 0.08 0.00 0.00
Al 3.99 4.00 4.02 3.99 3.33 3.24 3.42 3.39 3.39 3.40 3.39 3.80 1.01 1.04
Cr 0.00 0.00 0.00 0.01 0.02 0.02 0.00 0.02 0.02 0.00 0.00 0.00 0.00 0.00
Fe2+ 1.04 1.00 0.88 0.86 3.12 2.85 2.32 2.70 3.25 3.09 2.91 3.82 0.00 0.00
Mn 0.00 0.01 0.01 0.02 0.01 0.02 0.00 0.01 0.02 0.01 0.04 0.04 0.00 0.00
Ni 0.02 0.00 0.00 0.02 0.00 0.00 0.00 0.01 0.00 0.00 0.00
Mg 0.89 0.94 1.04 1.08 1.33 1.58 2.28 1.84 1.23 1.28 1.50 0.63 0.00 0.00
Ca 0.00 0.00 0.00 0.00 0.00 0.00 0.00 0.00 0.00 0.00 0.00 0.00 0.00 0.04
Na 0.02 0.01 0.01 0.02 0.04 0.05 0.04 0.06 0.04 0.08 0.06 0.04 0.07 0.98
K 0.01 0.00 0.01 0.00 1.77 1.84 1.84 1.79 1.81 1.77 1.83 1.89 0.93 0.01
Zn 0.03 0.00 0.00 0.01 0.04 0.00 0.03 0.00 0.03 0.02 0.05
Zr 0.00 0.00 0.00 0.00 0.00 0.00 0.01 0.00 0.00 0.00
Cl 0.00 0.01 0.00 0.00 0.12 0.04 0.03 0.05 0.07 0.07 0.09 0.23 0.00 0.00
F 0.00 0.00 0.04
Total ()Cl, F) 11.01 10.97 10.98 11.02 15.45 15.46 15.58 15.52 15.51 15.43 15.51 15.66 5.00 5.02
Mole fractions
XMg 0.46 0.48 0.54 0.56 0.30 0.36 0.50 0.41 0.28 0.29 0.34 0.14
XAb 0.07 0.95
XAn 0.00 0.04
XOr 0.93 0.01
FeO* – total Fe as FeO; Total – summation of all oxides, Cl and F; Total (–Cl,F) – total of ions without Cl and F.
†Data obtained with the JEOL (100 wt% normalized, adjusted to the Link and INCA systems).
�100 wt% normalized data obtained using the CamScan. Other data were obtained with the Cameca.
3 18 K . H ISADA E T A L .
� 2005 Blackwell Publishing Ltd

500 µm
GrtSil
Qtz
Crd
Qtz
(b)
1 mm
Grt
Sil
Sil
Crd(a)
Ilm+Spl
IlmQtz, Kfs, Pl
50 µm
Bt
And
(c)
Qtz
Qtz
Bt
Ms
Bt
100 µm
And
Qtz
Ms
(d)
Bt
Qtz
Kfs
Sil
I
II
III
And
Qtz
(e)Sil
500 µm
Crd
Bt
(f)
KfsPl layer
Pl layer
400 µm
Sil+Fib
Fig. 4. Photomicrographs (a, b, e–h) and back-scattered electron images (c, d, i and j) of the samples. The back-scattered electronimages in (c) and (d) were processed for enhancing the contrast. (a) The Qtz-poor portion of the metapelite (sample B5-5A1; plane-polarized light). (b) Coexisting garnet and cordierite (with sillimanite inclusions) in the Grt + Crd-rich band of the Qtz-rich portion,metapelite sample B5-5A2 (plane polarized light). (c) And + Qtz + Ms replacing biotite in the Qtz-rich portion of the metapelite,sample B5-5A2. A zonation is recognized: I – Ms zone; II – Bt + Qtz zone; III – And + Qtz zone. (d) Andalusite replacing K-feldsparin a leucosome of the migmatite, sample B5-5Z. (e) And + Sil association in a melanosome of the migmatite, sample B5-5Z (crossedpolarized light). (f) Sil + Fib association in a melanosome of the migmatite, sample B5-5Z. Plagioclase layers are developed along themelanosome (plane-polarized light). (g) Zonation Grt | Crd | Pl | Kfs + Qtz between a leucosome and a melanosome in sample B5-5Z(plane polarized light). (h) Garnet (300-lm thick) in the migmatite showing an optically zoned structure (sample B5-5G-N1). Acompositional profile (Fig. 5b) was taken along the line. The pinkish core contains solid–gaseous (S2) and solid inclusions (planepolarized light). (i) Assemblage Bt + Crd + Qtz + Pl replacing garnet in the migmatite (sample B5-5G-N1). Cordierite in theassemblage is altered. (j) Assemblage Sil + Kfs + Ms ± Pl replacing biotite in the aplite vein (sample B5-5S).
P–T–FLUID EVOLUT ION IN THE L IMPOPO HGT 31 9
� 2005 Blackwell Publishing Ltd

rims (Table 2). The grossular component (2–3 mol.%)of garnet in both portions is almost constant from coreto rim, and the spessartine component is zoned (cores:
5–8 mol.%; rims: 5–11 mol.%; e.g. Fig. 5b). X0Mg of
cordierite and biotite also depends on the bulk com-position: 0.52–0.55 (cordierite) and 0.34–0.50 (biotite)
0
5
10
15
20
0.0 0.5 1.0 1.5Distance (mm)
Prp
Grs
Sps
(a)
Qtz
CrdMol
epe
r cen
t
Metapelite (B5-5A2)Grt
0
5
10
15
20
0.0 0.5 1.0 1.5 2.0Distance (mm)
Prp
Grs
Sps
(b)
Pinkish core
Mol
epe
r cen
t
Migmatite (B5-5G-N1)Grt
Fig. 5. Chemical profiles of (a) garnet in the Qtz-rich portion of the metapelite, sample B5-5A2 and (b) the optically zoned garnet inthe migmatite (sample B5-5G-N1). �Crd� and �Qtz� on the sides of profile (a) indicate that the garnet grain touches cordierite and quartz,respectively. Analyses in (b) were performed along the line in Fig. 4h.
100 µm
Ms
Bt
Qtz
(j)
Grt
300 µm
(h)
500 µm
(g)
CrdPl
laye
r
Kfs
Qtz
Bt
Spl
Grt
200 µm
(i)
Bt
Grt
Qtz
Qtz
Pl
Crd
Pl
S2 inc.
Bt
Als
Kfs
Pl
Sil
Fig. 4. (Cont’d).
3 20 K . H ISADA E T A L .
� 2005 Blackwell Publishing Ltd

in the K-feldspar-bearing portion; and, 0.54–0.59(cordierite) and 0.35–0.43 (biotite) in the K-feldspar-free portion. Garnet in the K-feldspar-bearing portionis replaced by the assemblage Bt + Crd + Qtz + Pl,where quartz forms symplectites with biotite and cor-dierite (Fig. 4i). X0
Mg of the relict garnet is low (cores:0.11–0.09; rims: 0.10–0.07), whereas X0
Mg of the symp-lectitic biotite varies from 0.34–0.36 (portions touchingcordierite) up to 0.41 (portions touching garnet).
Granite
Garnet in granite B5-5S has XMg ¼ 0.14–0.12 in coresand 0.11–0.09 in rims with grossular (2 mol.%) andspessartine (3–5 mol.%) components. Inclusions ofbiotite in quartz (isolated biotite) show XMg ¼ 0.34–0.36. Extremely rare andalusite occurs in K-feldspar-rich granite B5-5AC (Table 1).
The aplite vein is medium to fine-grained (Table 1)with no chilled margins developed at the direct contactwith the granite (sample B5-5S). The assemblageSil + Kfs + Ms ± Pl replaces biotite and containsrelics of biotite (Fig. 4j; Table 2), whereas some biotitegrains are replaced mainly by muscovite. K-feldsparand plagioclase in the assemblage are orthoclase-rich(XOr ¼ 0.93–0.96) and albite-rich (XAb ¼ 0.91–0.95)respectively (Table 2). Garnet in the aplite is rich in Feand Mn and very poor in Mg and Ca (Table 2).
FLUID INCLUSION STUDY
Fluid inclusion studies have the potential to provideuseful information on both the composition of ametamorphic/magmatic fluid and the P–T conditionsof rock-forming processes. Seven samples were selectedfrom most of the rock types in locality B5-5 for thefluid inclusion study, as follows: (1) the quartz-poorand (2) the quartz-rich portions of metapelite (samplesB5-5A1 & B5-5A2 respectively); (3) the wide, (4) theKfs + Qtz-rich and (5) the quartz-dominated leuco-somes in migmatite (samples B5-5G-N1, B5-5Z &B5-5Y respectively); (6) the granite (sample B5-5J);and, (7) the aplite vein (sample B5-5S). The sampleswere prepared as doubly polished chips (300–500 lmin thickness) at T < 50 �C. Freezing and heatingexperiments were conducted using a Linkam heating/freezing system (THMSG 600, TP93 & LNP) at boththe Department of Geology, Rand Afrikaans Uni-versity and the Institute of Experimental Mineralogy.At a temperature interval of )60 to 300 �C, error ofmeasurement using the THMSG 600 stage is ±0.2 to±2 �C (Pajunen & Poutiainen, 1999).
General aspect of fluid inclusions
The classification of the fluid inclusions is based onRoedder (1984), Touret (2001) and Van den Kerkhof& Hein (2001); nomenclature follows van den Berg &Huizenga (2001). Four different types of inclusions are
distinguished; these are CO2-rich, solid–gaseous,aqueous and CO2–H2O inclusions.
CO2-rich inclusions containing no visible H2O phaseare most abundant in quartz and/or andalusite from allsamples and are mono- or biphasic at room tempera-ture. The fluid inclusions in quartz may be classifiedinto four types:C1: primary/early inclusions that occur in clusters(Fig. 6a), or as isolated cavities (Fig. 6b,c).C2: pseudosecondary inclusions in healed micro-cracksin cores of quartz grains.C3: secondary inclusions in irregular/complex healedmicro-cracks that usually terminate at grain boundar-ies (Fig. 6b,c).C4: secondary inclusions in regular, narrow, healedmicro-cracks that in places cross cut grain boundaries.
Quartz grains that host fluid inclusions usuallycontact with other minerals such as feldspar or cordi-erite. The majority of these minerals is usually altered,making it difficult to establish whether the micro-cracks cut both phases. C4 trails clearly cross cutcontacting quartz and andalusite (Fig. 6f). CO2-richinclusions (cluster type in C1 & C3) usually show<20-lm-diameter irregular shapes, whereas <10-lminclusions with a regular shape are dominant in C1(isolated type), C2 and C4. Very low-density CO2-richinclusions were observed in most of the samples. CO2-rich inclusions in the quartz-poor portion of metapelite(sample B5-5A1) are usually of very low density withnegative crystal shapes. A plane of small inclusions(arrow in Fig. 6a) and decrepitation clusters were ob-served only in large inclusions; hook-like morphologywas also observed (arrow in Fig. 6d).
However, CO2-rich inclusions in andalusite (sampleB5-5Z) usually occur as primary inclusions (C1) withtubular to rectangular shapes (<20 lm in length;Fig. 6e), or as secondary inclusions (C4) with <10 lmregular shapes in regular healed micro-cracks thatcross cut grain boundaries (Fig. 6f). Rectangularinclusions show a double-cell structure that is separ-ated by a very thin wall (Fig. 6e). Fonarev et al. (1998)described similar inclusions from garnet and suggestedthat they formed because of necking down after havingbeen trapped.
Solid–gaseous inclusions occur as isolated cavities(S1) or in intragranular trials (S2) in garnet from thestromatic portion of migmatite B5-5G-N1 (e.g. Figs 4h& 6g) and metapelite B5-5A1 (rarely B5-5A2). Ingarnet, the solid–gaseous inclusions occur mostly in itscores. S1 and S2 inclusions may be restricted to thepinkish cores on the basis of the occurrence shown inFigs 4(h) and 6(g). S1 inclusions in places show neg-ative crystal shapes (<20 lm), whereas S2 inclusionsare regular to irregular in shape (usually <20 lm).Solid phases are not isotropic and usually accompanya gaseous phase with various solid/gas ratios. Solidphases in the inclusions (sample B5-5G-N1) werechemically identified as zircon, quartz, biotite andchlorite (e.g. Fig. 6h).
P–T–FLUID EVOLUT ION IN THE L IMPOPO HGT 32 1
� 2005 Blackwell Publishing Ltd

20 µm
2
1
(c)(c)Qtz
3
4
20 µm
+28.7
*
*+29.2
+29.1
+30.2
+29.5
+3.0
+4.7 +13.2
+19.7
+9.2 +8.9CO
2–H
2OCO
2–H
2O
*
1
2
3
4
: (isolated):
C1C3others
*
(a)
Qtz
20 µm
+0.9+8.7
+8.1
+3.3+3.7
+4.3
+13.6+8.9+19.8
+8.8
+12.5
+8.3+11.5
+16.1
+4.8
C1 (cluster type)
+1.9
(b)
1
2
3
Qtz
4
20 µm
+6.7
–4.6
+8.0
+20.1
+6.2
+19.9
+20.2
+16.4
+12.4
+16.7
+13.3
+1.1
+11.0
+17.8
+20.1
**
*
*
**
1
2
3
*
: (isolated):
C1C3others
*
4
+15.1
100 µm
50 µm
Fig. 6. Photomicrographs, free-hand drawings and a secondary electron image of fluid inclusions from the study area. Homogeni-zation temperature data (ThCAR,�C) are also given in (a–f), whereas TmCAR (�C) data are shown in (g). (a) C1 (cluster type) inclusionsin quartz from the granite (sample B5-5J). A plane of small inclusions was observed (arrow). (b) Isolated (C1) and C3 inclusions inquartz from the migmatite (sample B5-5G-N1). (c) Isolated (C1) and C3 inclusions in quartz from the aplite vein (sample B5-5S). Theinclusion trail includes CO2–H2O inclusions with low ThCAR (+9 �C). Re-equilibration is possible because of the intersection of thepre-existing E–W trail by N–S trails (e.g. trail in upper right). For clarity, some inclusions are not shown. (d) C3 inclusions in quartzfrom the Kfs + Qtz-rich leucosome in the metapelite (sample B5-5A2), showing hook-like morphology (arrow). (e) Rectangularprimary CO2-rich inclusions in andalusite from the migmatite, sample B5-5Z. The inclusions usually show double cell structures withthin walls. (f) A C4 inclusion trail that crosscuts the grain boundary between andalusite and quartz (sample B5-5Z). (g) Solid–gaseousinclusions (S1) in the pinkish core of garnet from the stromatic portion, migmatite B5-5G-N1. (h) Zircon of a solid–gaseous inclusion(S1) in garnet from the stromatic portion, migmatite B5-5G-N1. (i) Isolated aqueous (A1) inclusion (TmIce ¼ )12.2 �C, ThAQ ¼294 �C) in quartz from the wide leucosome of the migmatite (sample B5-5G-N1). Photographs (a–c, f, g and i) and free-hand drawingswere taken at room temperature, whereas photographs (d) and (e) were taken at )5 �C and +4 �C respectively.
3 22 K . H ISADA E T A L .
� 2005 Blackwell Publishing Ltd

Aqueous inclusions are minor and occur in quartz. Asmall number of aqueous inclusions occur in the mi-gmatites (samples B5-5G-N1 & B5-5Z) and in igneousrocks (samples B5-5J & B5-5S). Quartz in metapelitesample B5-5A2 and in the quartz-dominated leucosome(sample B5-5Y) contains relatively abundant aqueousinclusions. In most cases, these inclusions are mono- orbiphasic at room temperature and occur in healed mi-cro-cracks with sizes that vary from <5 to 10 lm.Some inclusion trails consist mainly of aqueous inclu-sions with usually isotropic (probably halite) daughterminerals. An isolated aqueous inclusion (A1) was ob-served in the wide leucosome of the migmatite (sampleB5-5G-N1; Fig. 6i).
CO2–H2O inclusions are recognized as a rare typeand occur in quartz. Three types were observed atroom temperature:M1: CO2(L)–CO2(V)–H2O(L) (three phase).M2: CO2(L)–H2O(L) (two phase).M3: CO2(V)–H2O(L) (two phase).
M1 and M2 inclusions occur in healed micro-cracksor clusters with various CO2/H2O ratios (natural type),or at intersections of CO2-rich and aqueous inclusiontrails (mechanical type). These types of inclusions werealso observed in CO2-rich inclusion trails of C3 inclu-sions, which are interpreted as a natural type. M3inclusions usually occur with low-salinity aqueousinclusions.
And
Primary(e)
+23.5+23.5
+23.5 +23.6
VL
Wall
(i)
10 µm
Qtz
mineral
50 µm
QtzAnd
ThCAR = +28 to +30 °C
(f)
-56.7
-56.8
Grt
Grt
Zrn
Qtz
(h)
(g)
(d)
5 µm
20 µmmineral
mineral
gaseousCO2
-56.7
10 µm
10 µm
isolated aqueous inc.
+7.4
+7.1
+1.7
+3.3
+10.5
+14.0
+10.9
+11.3
+5.9
+6.0
-3.1
gaseousCO2
20 µm
Fig. 6. (Cont’d).
P–T–FLUID EVOLUT ION IN THE L IMPOPO HGT 32 3
� 2005 Blackwell Publishing Ltd

Results of measurements
In order to distinguish aqueous inclusions (practicallyXfl
H2O> 0.99; Diamond, 2001) from M3 inclusions,
almost all aqueous inclusions were heated to 12–16 �Chigher than the clathrate (CO2-hydrate) melting tem-perature (<+10 �C), after final melting of ice wasobserved. As the CO2-hydrate is usually invisible, thesudden movement of a bubble during heating wasinferred to reflect the melting of a CO2-hydrate. Thedata on CO2-rich inclusions are summarized in Table 3.
CO2-rich inclusions
Final melting temperature of CO2 (TmCAR) and tem-perature of homogenization of CO2 into a liquid phase(ThCAR) were measured for CO2-rich inclusions in theseven samples. The temperature of homogenizationinto a vapour phase is not discussed here because thevery low-density inclusions were usually difficult tomeasure. TmCAR ranges from )56.7 to )56.5 �C(rarely )57 �C), in accordance with the triple point forCO2 of )56.6 �C. Rarely TmCAR of around )64 �Cwas found in sample B5-5A1 (ThCAR ¼ )10 �C).
In Fig. 7(a), distribution of ThCAR is illustrated interms of �Group of Synchronous Inclusions (GSI)� (seeFonarev et al., 1998; Touret, 2001). All ThCAR data forCO2-rich inclusions in the quartz-poor portion ofmetapelite (sample B5-5A1) cluster around +30 �C.CO2-rich inclusions with ThCAR > +22 �C are con-centrated in the Crd + Qtz-rich band of metapelitesample B5-5A2, whereas the Kfs + Qtz-rich leuco-some in the same metapelite contains CO2-rich inclu-sions with a low ThCAR (Table 3; Fig. 6d). Paired cellsin the rectangular primary inclusions in andalusite(Fig. 6e) usually have similar ThCAR.
Solid–gaseous inclusions
The inclusions from the quartz-poor portion (metap-elite B5-5A1) and the stromatic portion (migmatiteB5-5G-N1) were measured. Although no phase changewas observed optically for most of the inclusions
during freezing experiments (i.e. very low-density gas),TmCAR ranging from )56.9 to )56.7 �C was obtainedfrom gaseous phases in some inclusions (e.g. Fig. 6g).The TmCAR suggests that the gaseous phase consists ofalmost pure CO2. No homogenization temperature hasbeen measured for the inclusions because of very lowdensities.
Aqueous inclusions
Although solid phases (i.e. ice or hydrohalite) wereidentified during freezing experiments on the basis oftheir contrasting refractive indices against the liquidphase, the determination was commonly difficultbecause of optical problems related to small inclusionsize. In low-salinity inclusions, initial melting temper-atures were generally observed at temperature higherthan the H2O–NaCl eutectic ()21.2 �C), whereas high-salinity inclusions have initial melting temperatureslower than the H2O–NaCl eutectic point, or in placeseven the H2O–NaCl–CaCl2 eutectic point ()52 �C).Three types of aqueous inclusions were recognized in
terms of final melting temperature of ice (TmIce): A2,low-salinity inclusions (TmIce varies from 0 to )14 �C);A3, high-salinity inclusions (TmIce ranges from )18 to)38 �C); and, A4, daughter mineral-bearing high-salinity inclusions.The temperature of homogenization of H2O into a
liquid phase (ThAQ) for the aqueous inclusions wasmeasured at temperatures below around 300 �C. Thedata vary from +70 to >300 �C for A2 inclusions,and from room temperature to >300 �C for A3inclusions. ThAQ for the A1 inclusion (TmIce ¼)12.2 �C) is 294 �C (sample B5-5G-N1).
CO2–H2O inclusions
Two final melting temperatures (TmCAR & TmCla)were measured for M1 and M2 inclusions. TmCAR
ranges from )56.7 to )56.5 �C, whereas TmCla isusually around +6 to +8 �C. These inclusions usuallyshow high ThCAR ranging from +18 to +30 �C, butsome natural-type CO2–H2O inclusions have low
Table 3. Summary of ThCAR (�C) for CO2-rich inclusions in various rock types from thestudied outcrop (locality B5-5).
Rock type Metapelite Migmatite Granite Aplite vein
Portion Qtz-rich
portion Leucosome Leucosome Leucosome Leucosome
Sample No. B5-5A2 B5-5G-N1 B5-5Z B5-5Z B5-5Y B5-5J B5-5S
Host mineral Qtz Qtz Qtz And Qtz Qtz Qtz
C1
Isolated 22–29 )5 to 11 2 – – – 3–26
Clusters 9–29#1 13–26 6–28 – – 1–27 4–23
Primary – – – 20–30 – – –
C2
Pseudosecondary – 20–27 – – 6–26 – 22–29
C3
Secondary )3 to 24#1 12–20 1–30 – 1–29 – 14–30
C4
Secondary 27–31 26–31 28–30 27–31 27–30 25–30 –
#1Data from a Kfs + Qtz-rich leucosome in the metapelite.
–: absent.
3 24 K . H ISADA E T A L .
� 2005 Blackwell Publishing Ltd

C1 & C2 inclusions
C3 inclusions
C4 inclusions
Metapelite (B5-5A2)in Qtz
Migmatite (B5-5G-N1)in Qtz
Migmatite (B5-5Z)in Qtz
in And
Migmatite (B5-5Y)in Qtz
Aplite vein (B5-5S)in Qtz
Granite (B5-5J)in Qtz
–10 –5 0 5 10 15 20 25 30ThCAR(oC)(a)
(b)
sample 1
sample 2
sample 1
sample 2
sample n
Th
Fluid infiltration
Th
Fluid infiltration
sample n
unmodified inclusionsmodified inclusions
Case 1 (short fluid infiltration) Case 2 (continuous fluid infiltration)
Fluid infiltration
Fig. 7. (a) GSI diagram for CO2-rich inclusions from the samples. Each horizontal line represents a GSI. Each symbol on a GSI linecorresponds to a ThCAR. See Fonarev et al. (1998) and Touret (2001) for details of the GSI concept. (b) The model GSI diagramsshowing short fluid infiltration (case 1) and continuous fluid infiltration (case 2). The lowest Th preserves a trapping condition (opencircle), whereas other Th corresponds to fluid inclusions deformed in a plastic manner due to differential pressure during decom-pression–cooling (solid circle). The diagrams are only suitable for fluid inclusions from rocks that experienced a P–T path slightlysteeper than isochors such as decompression–cooling path. For further explanations see the text.
P–T–FLUID EVOLUT ION IN THE L IMPOPO HGT 32 5
� 2005 Blackwell Publishing Ltd

ThCAR ranging from+5 to +9 �C (e.g. Fig. 6c). In thecase of M3 inclusions, TmIce and TmCla are around )6to )3 �C and +7 to +9 �C, respectively. As heatingexperiment (for total homogenization) caused decrep-itation of some of M2 inclusions, further heatingexperiments were avoided.
The following important features of CO2-richinclusions are typical for the samples (Fig. 7a;Table 3):1 Except for a few inclusions, fluid compositions arealmost pure CO2 throughout the samples.2 Different generations of GSIs are present in a widerage of ThCAR (around )5 to +31 �C).3 The distributions of GSIs are almost identical in allthe samples.4 ThCAR of C4 inclusions is limited to the range +25to +31 �C.5 ThCAR from andalusite is restricted within a rangeof +20 to +31 �C.
P–T CONDITIONS
All P–T calculations were carried out using the �Geo-path� computer program (Gerya & Perchuk, 1990)based on an experimentally obtained dataset (e.g.Perchuk et al., 1985; Aranovich & Podlesskii, 1989;Perchuk, 1989, 1991). A Mn-correction for the Grt–Btthermometer is taken from Perchuk (1981).
The use of many internally inconsistent reactions forthermobarometry of metapelitic rocks leads to greaterrors in estimated P–T parameters (Zeh et al., 2004).Here, a small number of well-calibrated mineral ther-mometers and barometers has been used for theaccurate derivation and correct geodynamic interpret-ation of a P–T path (e.g. Perchuk et al., 1985, 1996).
P–T path derived from mineral thermobarometry
A retrograde P–T path, reflecting exhumation of theMahalapye metapelite was calculated based on chem-ical zoning of minerals measured from the assemblageGrt + Bt + Crd + Sil + Qtz. This assemblageallows the use of two thermometers (Grt–Bt and Grt–Crd) and one mineral barometer based on the simul-taneously operating net transfer reaction,
GrtþAlsþQtz ¼ Crd. ð1ÞThe Grt–Bt and Grt–Crd thermometers were calib-
rated simultaneously (Perchuk & Lavrent’eva, 1983)and therefore, they are internally consistent. If, at agiven pressure, the estimated temperatures obtainedwith the thermometers are similar, the Grt–Bt–Crdpair preserves locally equilibrated compositions.
The method for estimation of P–T paths has beendescribed in detail by Perchuk et al. (1989, 1996, 2000),Smit et al. (2001) and van Reenen et al. (2004). Thismethod allows calculation of P–T parameters of localequilibria for different stages of the formation ofmineral assemblages. Microprobe profiling allows both
the maximal (flat profile of the mineral cores) andminimal (chemical zoning in rims) P–T parameters tobe found (e.g. Fig. 5a,b), and also avoids the influenceof the latest exchange diffusion on thermobarometry.According to the method, sample B5-5A2 is the only
suitable rock for estimation of P–T parameters fromreaction (1) (also see Petrography and Mineral Chem-istry). The water activity of the fluid (aflH2O
) cannotbe estimated because of the absence of theGrt + Bt + Sil + Kfs + Qtz paragenesis in themetapelite. To start off, aflH2O
is assumed to be 0.6. Thisassumption will be evaluated on the basis of fluid-inclusion data. The aflH2O
is not an important factor fordetermination of pressure parameters because the wateractivity only weakly affects the equilibrium (1). Itsinfluence varies <1 kbar at aflH2O
¼ 0.1–0.7. The weakinfluence is also recognized in the results from theTHERMOCALC calculation (Holland & Powell, 1998;see Appendix). Peak P–T parameters were calculatedusing mineral compositions from cores of mineralscoexisting with sillimanite (that occurs as relics in cor-dierite or at grain boundaries between cordierite grains)and quartz. A peak temperature calculated using alarge biotite (749 �C) is consistent with that calculatedfrom the Grt–Crd pair (755 �C) coexisting with thebiotite (Table 4). Fig. 8 (grey arrow) demonstrates theP–T path derived using reaction (1).
Temperatures from the other rocks
The Grt–Bt–Crd thermometers were also applied toboth the Grt–Bt and Grt–Crd pairs from metapelitesample B5-5A1 (Table 4) and the migmatites(Table 5). Core–core and rim–rim mineral composi-tions were selected for temperature calculations. Forestimation of the peak temperature, isolated biotitegrains from the migmatites may be used instead ofbiotite cores because the biotite must have coexistedwith garnet presumably via a melt phase. The tem-peratures obtained from metapelite B5-5A1 and themigmatite samples at 4 kbar (770–540 �C) are similarto those from metapelite B5-5A2.
P–T path derived using fluid inclusion data
P–T parameters were independently estimated usingfluid inclusion data in the metapelite (B5-5A2) andmigmatite (B5-5G-N1) samples. There are twoconstraints: (1) the highest CO2 density is correlatedwith the highest temperature obtained from mineralthermometry; and, (2) the P–T path must intersect the1.30 [cm3 g)1] isochore at 590 �C corresponding tothe CO2-rich inclusions (ThCAR ¼ +20 �C) trapped atthe sillimanite–andalusite boundary curve (see Fig. 8).The P–T path (solid arrow in Fig. 8) is consistent withthat based on the mineral thermobarometry (greyarrow in Fig. 8). The deviation in pressure does notexceed 0.5 kbar at a given temperature. This impliesthat the assumption of water activity of the fluid
3 26 K . H ISADA E T A L .
� 2005 Blackwell Publishing Ltd

(aflH2O¼ 0.6) is appropriate. The aflH2O
corresponds to
XflH2O
of about 0.5 at the P–T conditions (Kerrick &
Jacobs, 1981). Note that the P–T parameters estimatedfrom the metapelite (open circles) is almost identical tothose from the migmatite (solid triangles).
The calculated P–T path accurately defines a post-peakmetamorphic history controlled by decompressionand cooling (Fig. 8). It traverses from peak conditions(770 �C, 5.5 kbar) to the approximate values of 560 �Cand 2 kbar (within the andalusite-stability field). TheP–T path is consistent with the pseudosection at
aflH2O¼ 0.6 obtained using THERMOCALC v3.1
(Appendix).
DISCUSSION
Interpretation of the textures observed
Reaction textures
Andalusite in Fig. 4c,d shows a typical metasomaticorigin (Korzhinskii, 1970), and it is inferred to haveformed from biotite or K-feldspar via the meta-somatic reactions, Bt � And + Qtz + (K2O) andKfs � And + (K2O). The zonation Ms | Bt + Qtz |And + Qtz (I, II and III in Fig. 4c) reflects the per-fect mobility of some components (Korzhinskii,1970). The And + Sil, And + Sil + Fib andFib + Sil associations (Fig. 4e,f) indicate that theandalusite appeared near the sillimanite–andalusiteboundary, suggesting that the andalusite has beenformed at the latest stage of the metamorphic evo-lution. Metasomatic Al2SiO5 minerals were reportedfrom Archean tonalitic gneisses affected by Palaeo-proterozoic tectono-metamorphic event (c. 1850 Ma)in eastern Finland by Pajunen & Poutiainen (1999),who interpreted the formation of Al2SiO5 minerals asthe result of fluid infiltration. On the contrary, theplagioclase layer (Figs 3c,d & 4f,g) indicates that Cafrom the decomposed garnet moved towards theKfs + Qtz-rich leucosome to form plagioclase.Therefore, the zonation of Grt | Crd | Pl | Kfs + Qtz(Fig. 4g) may indicate a metasomatic interaction ofa fluid with melt (represented by Kfs + Qtz-richleucosomes) and matrix minerals. The vermicularquartz in the symplectites from migmatite (Fig. 4i) isinferred to have resulted from a metasomatic reaction(cf. Pajunen & Poutiainen, 1999), whereas theassemblage Sil + Kfs + Ms ± Pl replacing biotite inthe aplite vein (Fig. 4j) is also interpreted to haveformed via the metasomatic reaction, Bt ± Qtz �Sil + Kfs + Ms ± Pl.
Consequently, the rocks from the study area arecharacterized by metasomatic reaction textures thatare interpreted to have formed in three stages: (1)during the migmatization (e.g. Fig. 4f,g); (2) during theretrograde stage in the Sillimanite-stability field(Fig. 4j); and, (3) during the retrograde stage in theandalusite-stability field (e.g. Fig. 4c–e).
Textural modification of fluid inclusions
Fluid inclusions may be deformed in a brittle orplastic manner due to differential pressure (i.e. inter-nal inclusion pressure ) external pressure) duringdecompression–cooling (e.g. Vityk & Bodnar, 1995;Goldstein, 2001; Touret, 2001). A plane of smallinclusions around a large inclusion (arrow in Fig. 6a)may have resulted from brittle deformation such asfracturing (Vityk & Bodnar, 1995), whereas the hook-
Table 4. Chemical compositions of coexisting minerals andP–T- or T-metamorphic parameters for metapelite samplesB5-5A1 and B5-5A2.
Grt Crd Bt T (�C)
P (kbar)
T (�C)
Spot XMg Spot XMg Spot XMg Grt–Crd Grt–Bt
B5-5A2 (cores)
82 0.114 70 0.464 700*
62 0.119 63 0.466 711*
313 0.126 278 0.472 726 4.4
269 0.123 278 0.472 717 4.3
116 0.121 144 0.467 715*
106 0.119 143 0.467 710*
208 0.118 244 0.464 712 4.2
212 0.119 244 0.464 715 4.2
951 0.130 973 0.466 747 4.6
577 0.125 581 0.470 723*
619 0.119 632 0.464 715 4.2
1089 0.130 1064 0.460 928 0.299 755 4.7 749
886 0.124 905 0.463 732 4.4
874 0.122 877 0.461 728 4.4
B5-5A2 (rims)
184 0.107 191 0.477 664*
150 0.104 148 0.482 650*
199 0.095 193 0.484 621*
178 0.106 126 0.477 661*
155 0.081 160 0.485 578*
593 0.083 602 0.490 580*
911 0.102 907 0.497 628*
568 0.085 584 0.297 640*
590 0.074 587 0.298 608*
B5-5A1 (cores) at 4 kbar
E2† 0.112 E18† 0.438 725
E7† 0.111 E17† 0.435 725
E8† 0.111 E31† 0.439 720
E28† 0.112 E40† 0.431 734
E29† 0.120 E40† 0.431 760
E23† 0.117 E37† 0.439 739
E24† 0.124 E37† 0.439 761
E25† 0.119 E38† 0.424 766
E26† 0.116 E39† 0.426 754
E27† 0.116 E40† 0.431 747
E69† 0.112 E80† 0.428 738
E70† 0.108 E72† 0.445 703
E71† 0.112 E73† 0.431 734
B5-5A1 (rims)
E75† 0.077 E74† 0.477 573
E77† 0.089 E76† 0.444 645
E12† 0.081 E14† 0.472 590
E3† 0.099 E15† 0.466 652
E4† 0.099 E16† 0.463 655
E19† 0.100 E35† 0.448 675
E20† 0.069 E36† 0.441 579
P-parameters were calculated assuming aflH2O¼ 0.6.
*Calculated at 4 kbar because of the absence of coexisting sillimanite.
†Data obtained with the JEOL (adjusted to the Link and INCA systems).
Other data were obtained using the Cameca.
The equations for the calculation are summarized in Smit et al. (2001, p. 253) and Perchuk
(1989, p. 277).
P–T–FLUID EVOLUT ION IN THE L IMPOPO HGT 32 7
� 2005 Blackwell Publishing Ltd

like morphology in C3 inclusions (Fig. 6d) suggestsplastic deformation (Vityk & Bodnar, 1995). Thesetextures are more commonly observed in fluid inclu-
sions that experienced a P–T path steeper thanisochores (Vityk & Bodnar, 1995). Although decre-pitation seems to have occurred only in large inclu-sions in the samples, subsidiary low-density inclusiontrails (e.g. N–S trails in Fig. 6c) in some C3 inclusionsmay reflect decrepitation at a late stage of the exhu-mation.
Fluid-present conditions during high-grade metamorphism
Clemens & Vielzeuf (1987) and Stevens & Clemens(1993) concluded that fluid-present conditions duringhigh-grade metamorphism are unlikely except for localexistence of fluids mainly for the following reasons: (1)as the porosity of high-grade rocks is very small(<0.03 wt% H2O equivalent), fluid-present meltingwould rapidly produce fluid-absent conditions becauseof the high solubility of H2O in melts (Clemens &Vielzeuf, 1987); and, (2) in anatectic rocks, CO2-richfluid forms unreactive volatile dregs, occurring as high-dihedral angle bubbles in the granulite-grade environ-ment (Stevens & Clemens, 1993). Thus, near themetamorphic peak in granulites, H2O is partitionedinto the melt phase and CO2 forms small remnantbubbles (G. Stevens, pers. comm.).However, the formation of CO2-remnant bubbles
contradicts the partition law when the fluid is a binarymixture of CO2 and H2O. In anatectic rocks with theCO2–H2O fluid, the following suggestions based onHolloway (1976) should be taken into account: (1) theCO2 solubility in granitic melts is relatively small, andconsequently the amount of CO2 in source regions willbe sufficient to saturate the granitic melt; (2) H2O isdistributed into both the melt and fluid phases becauseof the partition law, which indicates that CO2-remnantbubbles cannot be formed; and, (3) in the case of lowH2O content in the system, suggestion (2) above
Table 5. Chemical compositions of coexisting minerals andT-parameters (at 4 kbar) for the migmatite samples.
Grt Crd Bt T (�C) at 4 kbar
Spot XMg X0Mg XMn Spot XMg Spot X0
Mg Grt–Crd Grt–Bt
B5-5G-N1 (cores)
801 0.177 0.166 0.061 821 0.540 820 0.355 766 762
660 0.171 0.162 0.048 681 0.537 682 0.360 755 746
753 0.169 0.161 0.050 786 0.349 757
516 0.143 0.132 0.074 541 0.557 538 0.404 667 654
476 0.146 0.136 0.070 501 0.565 664
398 0.146 0.136 0.068 437 0.554 677
403 0.144 0.133 0.070 426 0.554 672
415 0.139 0.130 0.069 426 0.554 661
B5-5G-N1 (rims)
806 0.131 0.123 0.061 808 0.496 564
755 0.103 0.095 0.086 760 0.374 608
442 0.115 0.105 0.093 461 0.386 621
451 0.093 0.083 0.109 452 0.380 582
509 0.097 0.087 0.099 507 0.378 590
517 0.118 0.109 0.082 529 0.378 633
554 0.096 0.087 0.093 561 0.394 577
546 0.105 0.095 0.091 544 0.595 543
B5-5G-N1 (pairs in Fig. 4i)
43-22* 0.115 0.106 0.074 43-10* 0.370 632
544-1* 0.109 0.100 0.083 544-10* 0.375 617
B5-5Z (cores)
580 0.123 0.118 0.042 614 0.274 752
31-3* 0.112 0.104 0.067 31-16* 0.262 738
41-1* 0.123 0.116 0.051 41-10* 0.455 41-16* 0.277 737 746
B5-5Z (rims)
31-12* 0.088 0.077 0.120 31-13* 0.293 643
32-5* 0.117 0.106 0.090 32-7* 0.365 640
41-20* 0.091 0.084 0.084 41-18* 0.301 645
XMg for Grt–Crd pairs; X0Mg for Grt–Bt pairs.
*Data obtained with the CamScan.
Other data were obtained using the Cameca.
The following equation was used for Grt–Bt pairs: T (�C) ¼ (3947.1 + 12.6 P (kbar))/
(ln(KD) + 2.868) + 252.25(XMn – 0.035) – 273 (Perchuk, 1981, 1989), where KD ¼ (X0Mg /
(1–X0Mg))
Bt /(X0Mg/(1–X
0MgÞÞ
Grt.
1
2
3
4
5
6
500 600 700 800Temperature (°C)
Pre
ssur
e(k
bar)
Ky
And
Sil
)o
Fig. 8. P–T path (grey arrow) reflecting theretrograde metamorphic evolution ofmetapelite sample B5-5A2 from the studyarea, calculated using the mineral thermo-barometry. Open squares reflect P–Tparameters calculated for cores. The solidP–T path is based on fluid inclusion dataand the Grt–Bt–Crd thermometry from themetapelite (open circles, sample B5-5A2)and the migmatite (solid triangles, sampleB5-5G-N1). Dotted thin lines show CO2-isochores based on Gerya & Perchuk (1997).Sil–And, And–Sil and Sil–Ky boundarieswere obtained from Holland & Powell(1998). The specific volume of CO2, VCO2
[cm3 g)1] was obtained using the empiricalcorrelation between VCO2
and ThCAR afterTomilenko & Chupin (1983).
3 28 K . H ISADA E T A L .
� 2005 Blackwell Publishing Ltd

concerning anatectic rocks is also valid. This indicatesthat the melt is undersaturated with H2O, and that apervasive fluid is not always necessary (see figs 4 & 5 ofHolloway, 1976).
Furthermore, the amount of melt produced iscontrolled by Xfl
H2Oat constant pressure and tem-
perature (Clemens, 1984; Johannes & Holtz, 1996,p. 192), and then wholesale melting is unlikely interms of the P–T–fluid conditions obtained from thestudy area. Thus, the fluid phase intimately respondsto the melt phase, and the unreactive volatile dregsare never formed. Consequently, in the CO2–H2Ofluid system the fluid-present condition is providedthroughout the evolutionary history of the graniticmelt (Holloway, 1976). In this context, a CO2–H2Ofluid may move through melt-networks, promotingnet-transfer reactions.
Diagnostics using fluid inclusions
The following diagnostics may be used for evaluationof fluid-present conditions. (1) Primary CO2-bearinginclusions in migmatites or granitoids indicate fluid-present conditions (see above). (2) According toJohnson (1991), the coexistence of primary CO2-richinclusions and high- to moderate-salinity aqueousinclusions (>23 wt% NaCl) in high-grade rocks indi-cates fluid-present conditions, because immiscibility offluids occurs under high-temperatures (see also Touret& Huizenga, 1999; van den Berg & Huizenga, 2001).These inclusions are preferably hosted in high-gradeindex minerals such as garnet or quartz included ingarnet (see Touret & Huizenga, 1999). In addition, thevapour phase in saline aqueous inclusions (at roomtemperature) must be carbonic because the immiscibleaqueous phase still has a CO2 component at anytemperature conditions (see Johnson, 1991).
Determination of fluid infiltration
The above diagnostics do not answer the questionwhether fluid infiltration occurred or not. In order todetermine fluid infiltration, we may apply the fol-lowing self-evident statement: in the case of an ex-ternal fluid source its properties and compositionmust be similar in different rock types at a giventemperature and pressure.
The fluid inclusion data related to fluid infiltrationwere evaluated using the method developed byFonarev et al. (1998) (also see Touret, 2001). Themethod is based on a concept of GSI. A GSI cor-responds to a limited number of inclusions formed atthe same time in a single micro-crack or a group ofisolated/clustered inclusions. A GSI usually shows awide range of homogenization temperature (Th) (e.g.Fonarev et al., 1998). According to Fonarev et al.(1998) and Touret (2001), the range is caused by late-stage reequilibration because of the differential pres-sure. The decompression–cooling P–T path obtained
(Fig. 8) and the rare decrepitation textures (e.g.Fig. 6) suggest that the fluid inclusions studied weredeformed mainly in a plastic manner by internaloverpressure. On the basis of Vityk & Bodnar (1995),the lowest Th corresponds to the trapping condition ifthe rocks experienced a P–T path steeper than iso-chores (Fig. 7b). The results of statistical microther-mometry for the fluid inclusions deformed plastically(Vityk & Bodnar, 1998) are also close to this inter-pretation. The model GSI diagrams in Fig. 7(b) arebased on these experimental results.
If all samples have the same GSI (i.e. the same rangeof Th and composition), the GSIs indicate infiltrationof a metamorphic fluid at a specific P–T conditioncorresponding to the lowest Th (case 1 in Fig. 7b). Inthe case where fluid infiltration occurred throughoutthe metamorphic evolution, different generations ofGSIs are continuously observed in each rock (case 2 inFig. 7b). The GSI diagram obtained (Fig. 7a) is similarto the model GSI diagram for case 2 in Fig. 7b.Therefore, infiltration of CO2-bearing fluids occurredcontinuously from peak to retrograde metamorphism,and must have been an agent of retrograde metamor-phism.
Magmatic and post-magmatic events along a single P–T path
The P–T–fluid evolution of the Mahalapye rocks issummarized in Fig. 9, which suggests themigmatizationbefore the peak condition (circle B in Fig. 9). TheKfs + Qtz-rich leucosomes in the samples (e.g.Fig. 3c,d) were also formed before the peak condition.The timing of the formation is supported by C3 inclu-sions (i.e. secondary inclusions) with the lowest ThCAR
in the leucosome (Fig. 7a; Table 3). The aplite veinmusthave been emplaced at conditions of 710 �C and 4 kbar(circle C in Fig. 9), where the P–T path cross cuts thesolidus curve (at aflH2O
¼ 0.6) in the system K2O–Na2O–Al2O3–SiO2–H2O–CO2 (Johannes &Holtz, 1996). Datafrom Table 5 suggest the replacement of garnet by theassemblage Bt + Crd + Qtz + Pl (Fig. 4i) at 630–610 �C after the reaction,
Grt�KfsþH2O(in a fluid) ) Btþ CrdþQtzþ Pl
ð2Þ
At these parameters, the simultaneously operatingmetasomatic reaction produced the vermicular quartztexture (Fig. 4i). The textual evidence in Fig. 4(c–e)suggests that andalusite has been formed as a sub-solidus mineral (circle D in Fig. 9). The observation ofaqueous fluid inclusions and secondary muscovitereplacing andalusite strongly indicate an increase ofaflH2O
at 560 �C and 2 kbar (Fig. 9).Thus, all magmatic and postmagmatic events,
including migmatization during exhumation, occurredalong a single P–T path (Fig. 9). On the other hand,the optical zoning and the solid–gaseous inclusions ingarnet from the migmatite (Fig. 4h) may indicate an
P–T–FLUID EVOLUT ION IN THE L IMPOPO HGT 32 9
� 2005 Blackwell Publishing Ltd

earlier metamorphic event, because the garnet has beenpartly resorbed and then overgrown with newlyformed rims. Apart from the garnet, no other evidencefor the earlier metamorphic event is preserved. A1inclusion in quartz from the migmatite (Fig. 6i) mighthave been trapped during prograde metamorphism(i.e. heating). This suggestion follows from an isochorecalculated for the Al inclusion (Fig. 9), using theBULK and ISOC programs (Bakker, 2003) with anequation of state (Knight & Bodnar, 1989; Bodnar &Vityk, 1994) and an empirical equation for salinitycalculation (Potter et al., 1978).
Fluid infiltration and fluid compositions during exhumation
Chavagnac et al. (2001) assumed fluid-absent meltingfor the formation of the migmatites in the MahalapyeComplex, whereas on the basis of phase analysis His-ada et al. (2000) concluded that the migmatizationoccurred during fluid-present condition along a low-pressure retrograde P–T path. The present fluidinclusion study supports continuous fluid infiltration(Hisada et al., 2000). The continuous fluid infiltrationis also supported by the well-developed metasomaticreaction textures that formed throughout the evolu-tionary history (shaded zones 1 to 3 in Fig. 9).
As mentioned above, fluid immiscibility is possiblefor fluids with high- to moderate-salinity aqueous flu-
ids (>23 wt% NaCl) and intermediate mole fractionof CO2 (Xfl
CO2> 0.3). However, there is no evidence
that the A1 inclusion (16.2 wt% NaCl equivalent) isrelated to immiscible fluids, because the vapour phaseof the inclusions is not CO2. Therefore, immiscibleaqueous and CO2-rich fluids have not been involvedduring the metamorphism that affected the MahalapyeComplex.According to the volume–composition diagram of
the CO2–H2O mixture (Bakker & Diamond, 2000) ataflH2O
¼ 0.6 (XflH2O
¼ about 0.5), fluid inclusions musthave up to 30 vol.% H2O (20–30 vol.% H2O for denseinclusions) at their ThCAR. More than about 20 vol.%H2O is optically visible at room temperature when theinclusions are perfectly spherical (see Hollister, 1988).However, even in the case of irregular or tube shapedinclusions, the CO2-rich inclusions show no visibleH2O at room temperature, suggesting that the fluidinclusions contain <20 vol.% H2O (probably noH2O). The H2O-free fluid inclusions cannot be attrib-uted to preferential dissolution of H2O into melts (seeHolloway, 1976). Selective leakage of H2O from CO2–H2O inclusions is an alternative process of the for-mation of CO2-rich inclusions in migmatites (e.g.Hollister, 1988). In addition, volume adjustment musthave occurred with the selective leakage of H2O in theformation of the high-density inclusions (see Bakker &Jansen, 1991, p. 2228).
1
2
3
4
5
6
7
500 600 700 800Temperature (°C)
Pre
ssur
e(k
bar)
A1
2
3
Ky
And
Sil
1.0 0.6
BaklykraalTh AQ= 294
AlsH O2
MsQtz
Kfs
1.0.0.6
Ms
Kfs
H O2
M
Qtz
MAls
H O2
QtzD
Ab
C Mahalapye
BAb
Akfs
Fig. 9. Summary of the metamorphic and magmatic evolution of rocks from the studied area. The P–T path (bold arrow) andstability fields of Al2SiO5-minerals are taken from Fig. 8. The dashed bold arrow is inferred from a hydration texture in whichandalusite is being replaced by muscovite at aflH2O
¼ 0.6–1.0. The thin arrow shows the P–T path in the Baklykraal area west ofAlldays (van Reenen et al., 2004). The dashed thin arrow in the upper part of the diagram shows a possible heating path inferredfrom an isolated aqueous (A1) inclusion in the migmatite (see text). Open circles indicate: A, the beginning of melting; B, peakmetamorphic condition; C, final crystallization of melts in the aplite vein; D, the formation of the And + Sil association in themigmatite. Shaded zones (1 to 3) along the P–T path indicate P–T conditions at which the metasomatic reaction textures observedwere formed. The numbers of the zones correspond to those discussed at the first section of the �Discussion� in the text. Solidusand hydration reactions controlled by aflH2O
are taken from Johannes & Holtz (1996). The dashed thin line is an isochore for theisolated aqueous inclusion. For further explanations, see the text.
3 30 K . H ISADA E T A L .
� 2005 Blackwell Publishing Ltd

No graphite was observed in the samples (Table 1),suggesting that there is no evidence for internallybuffered fluids (e.g. Stevens, 1997). Apart fromthe internal buffering, the aflH2O
in the study area mayhave been high, about 0.92, at the beginning of infil-tration on the basis of low salinity of the A1 inclusion(16.2 wt% NaCl equivalent) and its isochore (Fig. 9).The activity calculation of the saline fluid was based onAranovich & Newton (1996). According to Perchuk(1977), fluid-present melting does not take place until ahigh aflH2O
-fluid starts to infiltrate the crust. Melting inthe study area thus may have occurred around 710 �Cand 5.5 kbar (circle A in Fig. 9), and fluid composi-tions must have changed from aqueous to the CO2-bearing fluid near peak conditions.
CONCLUSIONS
The integration of textures inferred to record metaso-matic reactions, mineral thermobarometry and fluidinclusion microthermometry of various rock typesfrom the Mahalapye Complex in the Central Zone ofthe Limpopo HGT in Botswana indicates that: (1) therocks experienced a low-pressure granulite faciesmetamorphism characterized by a decompression–cooling P–T path similar to that described for theBaklykraal cross-fold west of Alldays in the CentralZone in South Africa (van Reenen et al., 2004; seeFig. 9); and, (2) CO2–H2O fluids continuously infil-trated the Mahalapye Complex during the retrogrademetamorphic evolution.
ACKNOWLEDGEMENTS
We are indebted to J. M. Huizenga at Rand AfrikaansUniversity for his technical advice and helpful sugges-tions on the fluid inclusion study. Special thanks aredue to C. A. Smit (Rand Afrikaans University),T. Tsunogae (the University of Tsukuba), P. Holtta andM. Pajunen (Geological Survey of Finland) for theirfruitful discussions and/or help in the field. We thankJ. L. R. Touret and G. Stevens for their helpful reviewsof the earlier version of this paper and particularlyM. Brown for his helpful editorial handling. We alsothank E. Hisada for her help in the field and for samplepreparation. This work was partly supported by theRussian Fund of Basic Researches (grants 02-05-64025to LLP and 03-05-64633 to TVG), the Russian Feder-ation President Program for promotion of LeadingScientific Schools (project no. 1645.2003.5 to LLP) anda National Research Foundation (to DDVR).
REFERENCES
Aldiss, D. T., 1991. The Motloutse Complex and the ZimbabweCraton/Limpopo Belt transition in Botswana. PrecambrianResearch, 50, 89–109.
Aranovich, L. Ya. & Newton, R. C., 1996. H2O activity inconcentrated NaCl solutions at high pressures and tempera-
tures measured by the brucite–periclase equilibrium. Contri-butions to Mineralogy and Petrology, 125, 200–212.
Aranovich, L. Ya. & Podlesskii, K. K., 1989. Geothermobaro-metry of high-grade metapelites: simultaneously operatingreactions. In: Evolution of Metamorphic Belts. GeologicalSociety Special Publication 43, (eds Daly, J. S., Cliff, R. A. &Yardley, B. W. D.), pp. 45–61, Geological Society, London.
Bakker, R. J., 2003. Package FLUIDS 1. Computer programsfor analysis of fluid inclusion data and for modelling bulk fluidproperties. Chemical Geology, 194, 3–23.
Bakker R. J. & Diamond, L. W., 2000. Determination of thecomposition and molar volume of H2O–CO2 fluid inclusionsby microthermometry. Geochimica et Cosmochimica Acta, 64,1753–1764.
Bakker R. J. & Jansen, J. B. H., 1991. Experimental post-en-trapment water loss from synthetic CO2–H2O inclusions innatural quartz. Geochimica et Cosmochimica Acta, 55, 2215–2230.
Barton, J. M. & van Reenen, D. D., 1992. When was theLimpopo Orogeny? Precambrian Research, 55, 7–16.
Barton, J. M., Holzer, L., Kamber, B., Doig, R., Kramers, J. D.& Nyfeler, D., 1994. Discrete metamorphic events in theLimpopo belt, southern Africa: implications for the applica-tion of P–T paths in complex metamorphic terrains. Geology,22, 1035–1038.
van den Berg, R. & Huizenga, J. M., 2001. Fluids in granulites ofthe Southern Marginal Zone of the Limpopo Belt, SouthAfrica. Contributions to Mineralogy and Petrology, 141, 529–545.
Bodnar, R. J. & Vityk, M. O., 1994. Interpretation of micro-thermometric data for H2O–NaCl fluid inclusions. In: FluidInclusions in Minerals: Methods and Applications (eds de Vivo,B. & Frezzotti, M. L.), Short Course IMA, Fluids ResearchLaboratory, Department of Geological Sciences, VirginiaPolytechnic Institute and State University, Blacksburg, pp.117–130.
Boshoff, R., van Reenen, D. D., Smit, C.A., Armstrong, R. A.,Perchuk, L. L. & Kramers, J. D., 2004. New data linkingmajor fold types in the Central Zone of the LimpopoComplex to distinct tectono-metamorphic events. In:Geoscience Africa 2004 Abstracts (ed. Ashwal, L. D.), pp. 76–77. School of Geosciences, University of the Witwatersrand,Johannesburg.
Chavagnac, V., Kramers, J. D., Nagler, T. F. & Holzer, L., 2001.The behaviour of Nd and Pb isotopes during 2.0 Ga migma-tization in paragneisses of the Central Zone of the LimpopoBelt (South Africa and Botswana). Precambrian Research,112, 51–86.
Clemens, J. D., 1984. Water contents of silicic to intermediatemagmas. Lithos, 17, 273–287.
Clemens, J. D. & Vielzeuf, D., 1987. Constraints on melting andmagma production in the crust. Earth and Planetary ScienceLetters, 86, 287–306.
Diamond, L. W., 2001. Review of the systematics of CO2–H2Ofluid inclusions. Lithos 55, 69–99.
Ermanovics, I. F., 1980. The Geology of the Mokgware Hills Area(An Explanation of Quarter Degree Sheet 2226D). Bulletin 13.Geological Survey of Botswana, Lobatse.
Fonarev, V. I., Touret, J. L. R. & Kotelnikova, Z. A., 1998.Fluid inclusions in rocks from the Central Kola granulite area(Baltic Shield). European Journal of Mineralogy, 10, 1181–1200.
Gerya, T. V. & Perchuk, L. L., 1990. GEOPATH – a thermo-dynamic database for geothermobarometry and related cal-culations with the IBM PC computer. In: Metamorphic Stylesin Young and Ancient Orogenic Belts. Program and Abstract(eds Pattison, D. R., Ghent, E. D. & Gordon, T. M.), pp. 59–61. Calgary University Press, Calgary.
Gerya, T. V. & Perchuk L. L., 1997. Equations of state ofcompressed gasses for thermodynamic databases used in pet-rology. Petrology, 5, 366–380.
P–T–FLUID EVOLUT ION IN THE L IMPOPO HGT 33 1
� 2005 Blackwell Publishing Ltd

Goldstein, R. H., 2001. Fluid inclusions in sedimentary anddiagenetic systems. Lithos, 55, 159–193.
Hisada K. & Miyano, T., 1996. Petrology and micro-thermometry of aluminous rocks in the Botswanan LimpopoCentral Zone: evidence for isothermal decompression andisobaric cooling. Journal of Metamorphic Geology, 14, 183–197.
Hisada, K., Miyano, T. & van Reenen, D. D., 1994. Fluidinclusion study on gedrite formation in metapelites nearMaratele in the Limpopo Central Zone, eastern Botswana,Section B. Science Reports of the Institute of Geoscience,University of Tsukuba, 15, 1–7.
Hisada, K., Paya, B. K. & van Reenen, D. D., 2000. Partialmelting of pelitic rocks in the Mahalapye Plutonic Block,eastern Botswana: evidence for 2 Ga low-P–high-T migmati-zation in the Limpopo Granulite Complex. Petrology, 8,19–37.
Holland, T. J. B. & Powell, R., 1998. An internally consistentthermodynamic data set for phases of petrological interest.Journal of Metamorphic Geology, 16, 309–343.
Hollister, L. S., 1988. On the origin of CO2-rich fluid inclusionsin migmatites. Journal of Metamorphic Geology, 6, 467–474.
Holloway, J. R., 1976. Fluids in the evolution of granitic mag-mas: consequences of finite CO2 solubility. Geological Societyof America Bulletin, 87, 1513–1518.
Holzer, L., Frei, R., Barton, J. M., & Kramers, J. D., 1998.Unraveling the record of successive high grade events in theCentral Zone of the Limpopo Belt using Pb single phasedating of metamorphic minerals. Precambrian Research, 87,87–115.
Holzer, L., Barton J. M., Paya, B. K. & Kramers J. D., 1999.Tectonothermal history of the western part of the LimpopoBelt: tectonic models and new perspectives. Journal of AfricanEarth Sciences, 28, 383–402.
Jaeckel, P., Kroner, A., Kamo, S. L., Brandl, G. & Wendt, J., I.,1997. Late Archean to early Proterozoic granitoid magmatismand high-grade metamorphism in the central Limpopo belt,South Africa. Journal of the Geological Society of London, 154,25–44.
Johannes, W. & Holtz, F., 1996. Petrogenesis and ExperimentalPetrology of Granitic Rocks. Springer-Verlag, Berlin.
Johnson, E. L., 1991. Experimentally determined limits for H2O–CO2–NaCl immiscibility in granulites. Geology, 19, 925–928.
Kamber, B. S., Kramers, J. D., Napier, R., Cliff, R. A. &Rollinson, H. R., 1995. The Triangle Shearzone, Zimbabwe,revisited: new data document an important event at 2.0 Ga inthe Limpopo Belt. Precambrian Research, 70, 191–213.
Kerrick, D. M. & Jacobs, G. K., 1981. A modified Redlich-Kwong equation for H2O, CO2, and H2O–CO2 mixtures atelevated pressures and temperatures. American Journal ofScience, 281, 735–767.
Key, R. M., 1979. The Geology of the Country around Machan-eng and Chadibe (An Explanation of Quarter Degree Sheets2327A & 2327B). Bulletin 15. Geological Survey of Botswana,Lobatse.
Key, R. M., Ermanovics, I. F. & Skinner A. C., 1983. Theevolution of the southern margin of the Limpopo Mobile Beltin Botswana. In: The Limpopo Belt. Special Publication 8 (edsVan Biljon, W. J. & Legg, J. H.), pp. 169–174. GeologicalSociety of South Africa, Johannesburg.
Klemd, R., Martin, J., Schmidt, A. & Barton, J. M., 2003. P–Tpath constraints from calc-silicate metapelitic rocks east of theVenetia kimberlite pipes, Central Zone, Limpopo Belt, SouthAfrica: Have these rocks seen granulite-facies conditions?South African Journal of Geology, 106, 129–148.
Knight, C. L. & Bodnar, R. J., 1989. Synthetic fluid inclusions:IX. Critical PVTX properties of NaCl–H2O solutions. Geo-chimica et Cosmochimica Acta, 53, 3–8.
Korzhinskii, D. S., 1970. Theory of Metasomatic Zoning. Clar-endon Press, Oxford.
Kreissig, K., Holzer, L., Frei, R., et al. 2001. Geochronology ofthe Hout River Shear Zone and the metamorphism in the
Southern Marginal Zone of the Limpopo Belt, SouthernAfrica. Precambrian Research, 109, 145–173.
Kretz, R., 1983. Symbols for rock-forming minerals. AmericanMineralogist, 68, 277–279.
Kroner, A., Jaeckel, P., Hofmann, A., Nemchin, A. A. &Brandl, G., 1998. Field relationships and age of supracrustalBeit Bridge Complex and associated granitoid gneisses in theCentral Zone of the Limpopo Belt, South Africa. SouthAfrican Journal of Geology, 101, 201–213.
McCourt, S. & Vearncombe, J. R., 1987. Shear zones boundingthe central zone of the Limpopo Mobile Belt, southern Africa.Journal of Structural Geology, 9, 127–137.
Mkweli, S., Kamber, B. & Berger, M., 1995. Westward con-tinuation of the craton–Limpopo Belt tectonic break in Zim-babwe and new age constraints on the timing of the thrusting.Journal of the Geological Society of London, 152, 77–83.
Pajunen, M. & Poutiainen, M., 1999. Palaeoproterozoic pro-grade metasomatic-metamorphic overprint zones in Archeantonalitic gneisses, eastern Finland. Bulletin of the GeologicalSociety of Finland, 71, 73–132.
Perchuk, L. L., 1977. Thermodynamic control of metamorphicprocesses. In: Energetics of Geological Processes (eds Saxena,S. K. & Bhattacharji, S.), pp. 285–352. Springer-Verlag,New York.
Perchuk, L. L., 1981. Correction of the biotite–garnet ther-mometer in case of the Mn « Mg + Fe isomorphism ingarnet. Doklady USSR Academy of Sciences, 256, 441–442 (inRussian).
Perchuk, L. L., 1989. P–T–fluid regimes of metamorphism andrelated magmatism with specific reference to the granulite-facies Sharyzhalgay complex of Lake Baikal. In: Evolution ofMetamorphic Belts. Geological Society Special Publication 43(eds Daly, J. S., Cliff, R. A. & Yardley, B. W. D.), pp. 275–291. Geological Society, London.
Perchuk, L. L., 1991. Derivation of thermodynamically consis-tent set of geothermometers and geobarometers for meta-morphic and magmatic rocks. In: Progress in Metamorphicand Magmatic Petrology (ed. Perchuk, L. L.), pp. 93–111.Cambridge University Press, Cambridge.
Perchuk, L. L. & Lavrent’eva, I. V., 1983. Experimental inves-tigation of exchange equilibria in the system cordierite–gar-net–biotite. In: Kinetics and Equilibrium in Mineral Reactions.Advances in Physical Geochemistry 3 (ed. Saxena, S. K.), pp.199–239. Springer-Verlag, New York.
Perchuk, L. L., Aranovich, L. Y., Podlesskii, K. K., et al. 1985.Precambrian granulites of the Aldan shield, eastern Siberia,USSR. Journal of Metamorphic Geology, 3, 265–310.
Perchuk, L. L., Gerya, T. V. & Nozhkin, A. D., 1989. Petrologyand retrograde P–T path in granulites of the Kanskaya for-mation, Yenisey range, Eastern Siberia. Journal of Metamor-phic Geology, 7, 599–617.
Perchuk, L. L., Gerya, T. V., van Reenen, D. D., Safonov, O. G.& Smit, C. A., 1996. The Limpopo Metamorphic Belt, SouthAfrica: 2. Decompression and cooling regimes of granulites andadjacent rocks of the Kaapvaal Craton. Petrology, 4, 571–599.
Perchuk, L. L., Gerya, T. V., van Reenen, D. D. et al., 2000.Comparative petrology and metamorphic evolution of theLimpopo (South Africa) and Lapland (Fennoscandia) high-grade terrains. Mineralogy and Petrology, 69, 69–107.
Potter, II, R. W., Clynne, M. A. & Brown, D. L., 1978. Freezingpoint depression of aqueous sodium chloride solutions. Eco-nomic Geology, 73, 284–285.
van Reenen, D. D. & Hollister, L. S., 1988. Fluid inclusions inhydrated granulite facies rocks, Southern Marginal Zone ofthe Limpopo Belt, South Africa. Geochimica et CosmochimicaActa, 52, 1057–1064.
van Reenen, D. D. & Smit, C. A., 1996. The Limpopo Meta-morphic Belt, South Africa: 1. Geological setting andrelationship of the Granulite Complex with the Kaapvaal andZimbabwe Cratons. Petrology, 4, 562–570.
van Reenen, D. D., Barton, J. M., Roering, C., Smit, C. A. &Van Schalkwyk, J. F., 1987. Deep crustal response to con-
3 32 K . H ISADA E T A L .
� 2005 Blackwell Publishing Ltd

tinental collision: The Limpopo belt of southern Africa.Geology, 15, 11–14.
van Reenen, D. D., Roering, C., Brandl, G., Smit, C. A. &Barton, J. M., 1990. The granulite-facies rocks of the Limpopobelt, southern Africa. In: Granulites and Crustal Evolution (edsVielzeuf, D. & Vidal, Ph.), pp. 257–289. Kluwer AcademicPublishers, Dordrecht.
van Reenen, D. D., Roering C, Ashwal, L. D. & de Wit, M. J.,1992. Regional geological setting of the Limpopo Belt. Pre-cambrian Research, 55, 1–5.
van Reenen, D. D., Pretorius, A. I. & Roering, C., 1994.Characterization of fluids associated with gold mineralizationand with regional high-temperature retrogression of granulitesin the Limpopo belt, South Africa. Geochimica et Cosmochi-mica Acta, 58, 1147–1159.
van Reenen, D. D., Perchuk, L. L., Smit, C. A. et al., 2004.Structural and P–T evolution of a major cross fold in theCentral Zone of the Limpopo high-grade terrain, SouthAfrica. Journal of Petrology, 45, 1413–1439.
Roedder, E., 1984. Fluid Inclusions. Reviews in Mineralogy, 12.Mineralogical Society of America, Washington D.C.
Roering, C., van Reenen, D. D., de Wit, M. J., Smit, C. A.,de Beer, J. H. & van Schalkwyk, J. F., 1992. Structuralgeological and metamorphic significance of the KaapvaalCraton–Limpopo Belt contact. Precambrian Research, 55,69–80.
Rollinson, H. & Blenkinsop, T., 1995. The magmatic, meta-morphic and tectonic evolution of the Northern MarginalZone of the Limpopo Belt in Zimbabwe. Journal of the Geo-logical Society of London, 152, 65–75.
Schaller, M., Steiner, O., Studer, I., Holzer, L., Herwegh, M. &Kramers, J. D., 1999. Exhumation of Limpopo Central Zonegranulites and dextral continent-scale transcurrent movementat 2.0 Ga along the Palala Shear Zone, Northern Province,South Africa. Precambrian Research, 96, 263–288.
Skinner, A. C., 1978. The Geology of the Mahalapye Area(An Explanation of Quarter Degree Sheet 2326B). Bulletin 9.Geological Survey of Botswana, Lobatse.
Smit, C. A., van Reenen, D. D., Gerya, T. V. & Perchuk, L. L.,2001. P–T conditions of decompression of the Limpopo high-grade terrane: record from shear zones. Journal of Metamor-phic Geology, 19, 249–268.
Stevens, G., 1997. Melting, carbonic fluids and water recycling inthe deep crust: an example from the Limpopo Belt, SouthAfrica. Journal of Metamorphic Geology, 15, 141–154.
Stevens, G. & Clemens, J. D., 1993. Fluid-absent melting and theroles of fluids in the lithosphere: a slanted summary? ChemicalGeology, 108, 1–17.
Tojo, S., Miyano, T. & Tsunogae, T., 1994. H2O-rich fluid in-clusions in quartz from charnockite near the Manjirenji-damin the Limpopo Northern Marginal Zone, Zimbabwe. AnnualReport of the Institute of Geoscience, the University of Tsukuba,20, 77–81.
Tomilenko, A. A. & Chupin, V. P., 1983. Thermometry, Baro-metry and Fluid Chemistry of Metamorphic Complexes. NaukaPress, Novosibirsk (in Russian).
Touret, J. L. R., 2001. Fluids in metamorphic rocks. Lithos, 55,1–25.
Touret, J. L. R. & Huizenga, J. M., 1999. Precambrian intraplatemagmatism: high temperature, low pressure crustal granulites.Journal of African Earth Sciences, 28, 367–382.
Van den Kerkhof, A. M. & Hein, U. F., 2001. Fluid inclusionpetrography. Lithos, 55, 27–47.
Vityk M. O. & Bodnar R. J., 1995. Textural evolution of syn-thetic fluid inclusions in quartz during reequilibration, withapplications to tectonic reconstruction. Contributions toMineralogy and Petrology, 121, 309–323.
Vityk, M. O. & Bodnar, R. J., 1998. Statistical micro-thermometry of synthetic fluid inclusions in quartz duringdecompression reequilibration. Contributions to Mineralogyand Petrology, 132, 149–162.
Watkeys, M. K., 1983. Brief explanatory notes on the provi-sional geological map of the Limpopo Belt and environs. In:The Limpopo Belt. Special Publication 8 (eds Van Biljon, W. J.& Legg, J. H.), pp. 5–8. Geological Society of South Africa,Johannesburg.
Zeh, A., Klemd, R., Buhlmann, S. & Barton, J. M., 2004. Pro-and retrograde P–T evolution of granulites of the Beit BridgeComplex (Limpopo Belt, South Africa): constraints fromquantitative phase diagrams and geotectonic implications.Journal of Metamorphic Geology, 22, 79–95.
Received 19 December 2004; revision accepted 9 April 2005.
P–T–FLUID EVOLUT ION IN THE L IMPOPO HGT 33 3
� 2005 Blackwell Publishing Ltd
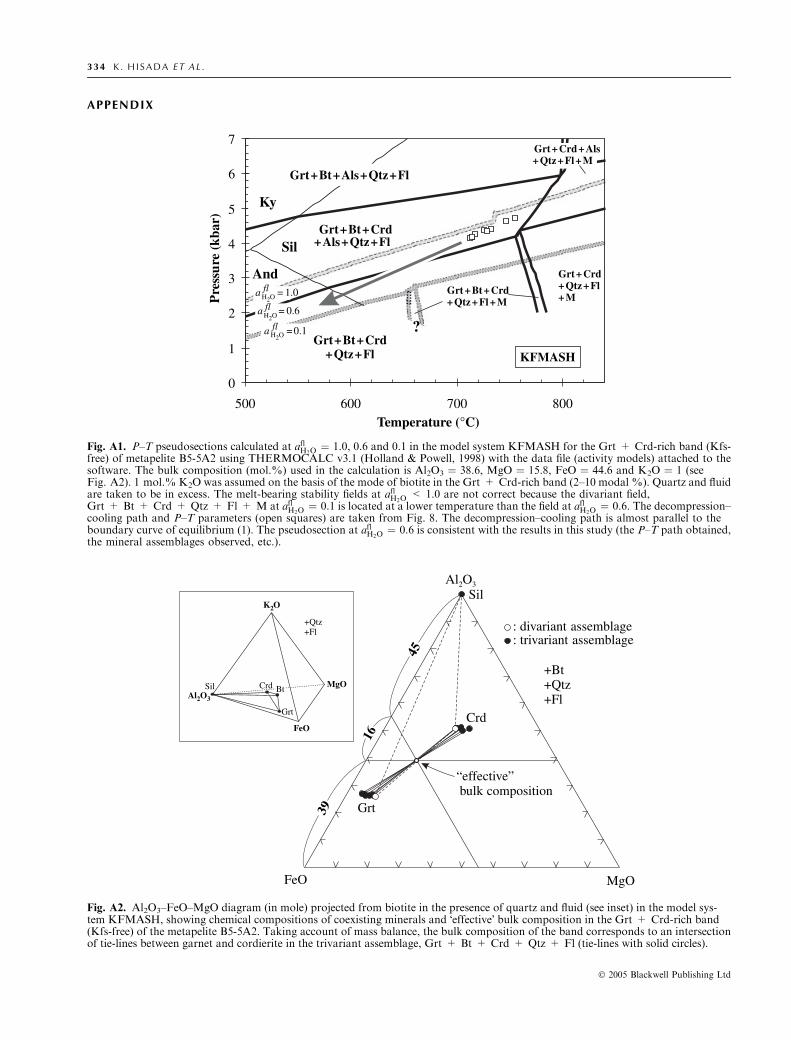
APPENDIX
Grt
Al O2 3
FeO MgO
Sil
Crd
“effective”bulk composition
: divariant assemblage: trivariant assemblage
+Bt+Qtz+Fl
MgOAl2O3
K O2
Grt
CrdSil
+Qtz+Fl
FeO
Bt
39
16
45
Fig. A2. Al2O3–FeO–MgO diagram (in mole) projected from biotite in the presence of quartz and fluid (see inset) in the model sys-tem KFMASH, showing chemical compositions of coexisting minerals and �effective� bulk composition in the Grt + Crd-rich band(Kfs-free) of the metapelite B5-5A2. Taking account of mass balance, the bulk composition of the band corresponds to an intersectionof tie-lines between garnet and cordierite in the trivariant assemblage, Grt + Bt + Crd + Qtz + Fl (tie-lines with solid circles).
0
1
2
3
4
5
6
7
500 600 700 800Temperature (°C)
Pre
ssu
re(k
bar)
Ky
And
SilGrt + Bt + Crd
+ Als + Qtz + Fl
Grt + Bt + Als + Qtz + Fl
Grt + Crd+ Qtz + Fl+ M
Grt + Bt + Crd+ Qtz + Fl KFMASH
Grt + Crd + Als+ Qtz + Fl + M
?
Grt + Bt + Crd+ Qtz + Fl + M
flH O2
a = 1.0
a = 0.6H O2
fl
a = 0.1H O2
fl
Fig. A1. P–T pseudosections calculated at aflH2O¼ 1.0, 0.6 and 0.1 in the model system KFMASH for the Grt + Crd-rich band (Kfs-
free) of metapelite B5-5A2 using THERMOCALC v3.1 (Holland & Powell, 1998) with the data file (activity models) attached to thesoftware. The bulk composition (mol.%) used in the calculation is Al2O3 ¼ 38.6, MgO ¼ 15.8, FeO ¼ 44.6 and K2O ¼ 1 (seeFig. A2). 1 mol.% K2O was assumed on the basis of the mode of biotite in the Grt + Crd-rich band (2–10 modal %). Quartz and fluidare taken to be in excess. The melt-bearing stability fields at aflH2O
< 1.0 are not correct because the divariant field,Grt + Bt + Crd + Qtz + Fl + M at aflH2O
¼ 0.1 is located at a lower temperature than the field at aflH2O¼ 0.6. The decompression–
cooling path and P–T parameters (open squares) are taken from Fig. 8. The decompression–cooling path is almost parallel to theboundary curve of equilibrium (1). The pseudosection at aflH2O
¼ 0.6 is consistent with the results in this study (the P–T path obtained,the mineral assemblages observed, etc.).
� 2005 Blackwell Publishing Ltd
3 34 K . H ISADA E T A L .