
College Performance Indicators 2011-12
50
College Performance Indicators 2011-12 March 2013 Further information: Des Parr, Tel: 0131 313 6548, email: [email protected] Scottish Funding Council Apex 2 97 Haymarket Terrace Edinburgh EH12 5HD PHOTO REDACTED DUE TO THIRD PARTY RIGHTS OR OTHER LEGAL ISSUES
Transcript of College Performance Indicators 2011-12

College Performance Indicators 2011-12 March 2013
Further information: Des Parr, Tel: 0131 313 6548, email: [email protected] Scottish Funding Council Apex 2 97 Haymarket Terrace Edinburgh EH12 5HD
PHOTO REDACTED DUE TO THIRD PARTY RIGHTS OR OTHER LEGAL ISSUES

College Performance Indicators 2011-12 Contents (click to view) 1 Executive Summary ............................................................................................ 4
2 Introduction ........................................................................................................ 5
3 A description of our performance indicator charts ........................................ 6
Chart 1: Grants issued by the SFC for teaching and student support 2011-12 ......................................................................................................................... 7
Chart 2: Average scores for qualification achieved at school for all school leavers, those leaving to study at HE level and those enrolled on a full- time FE or HE programme at this college..................................................... 8
Charts 3 & 4: Enrolments and hours of learning by qualification aim of course 2011-12 ................................................................................................. 11
Chart 5: Outcomes for Further Education student enrolments on recognised qualifications, 2009-10 to 2011-12 ............................................ 15
Chart 6: Students completing their FE course with partial success – proportion achieving banded rates (excluding students on courses lasting less than 160 hours) ........................................................................................ 16
Chart 7: Outcomes for Higher Education student enrolments on recognised qualifications 2009-10 to 2011-12 ............................................. 17
Chart 8: Students completing their HE course with partial success – proportion achieving banded rates (excluding students on courses lasting less than 160 hours) ........................................................................................ 19
Chart 9: Enrolments by age group for courses lasting 160 hours or more, 2011-12 ............................................................................................................. 20
Chart 10: Enrolments by level and gender on courses lasting 160 hours or more, 2011-12 .................................................................................................. 21
Chart 11: Enrolments by subject groupings on FE courses lasting for 160 hours or more, 2011-12 .................................................................................. 22
Chart 12: Enrolments by subject groupings on HE courses lasting for 160 hours or more, 2011-12 .................................................................................. 23
Chart 13: Enrolments by key student groups for courses lasting 160 hours or more, 2011-12 ............................................................................................. 25
Chart 14: Performance against activity levels, 2010-11 and 2011-12 ........ 27
Chart 15: Full-time equivalent staff, 2010-11 .............................................. 27
Chart 16: Percentage of full-time permanent teaching staff with a teaching qualification ...................................................................................................... 28

4 An overview of performance indicators for Scotland’s colleges ................ 29
A comparison of success rates for FE student enrolments leading to a recognised qualification for academic years, 2010-11 and 2011-12. ......... 30
A comparison of success rates for HE student enrolments leading to a recognised qualification for academic years 2010-11 and 2011-12. .......... 31
A comparison of success rates by subject groups for academic years 2010-11 and 2011-12 ................................................................................................ 32
A comparison of success rates by age of student for academic years 2010-11 and 2011-12 ................................................................................................ 33
Annex A: Calculations ......................................................................................... 34
Examples .......................................................................................................... 34
Annex B: Enrolments by qualification aim ...................................................... 38
Annex C: Enrolments by mode of attendance ................................................ 39
Annex D: Enrolments by age ............................................................................. 40
Annex E: HMIE Mapping to superclassII ....................................................... 41
Annex F: Data selection ...................................................................................... 48
Annex G: Tariff Score ......................................................................................... 49

4
1 Executive Summary
This is the eleventh annual publication of Performance Indicators (PIs) for Scotland’s colleges and covers the 2011-12 academic year (AY). The main results for the college sector as a whole are: • in 2011-12, 75 per cent of 52,090 full-time further education (FE)
students enrolled on recognised qualifications completed their studies irrespective of the result and 64 per cent successfully completed;
• the remaining 25 per cent of students are accounted for by nine per cent of students withdrawing before the funding qualifying date (colleges are not funded for these students) and a further 16 per cent between this point and the end of the course;
• for full-time higher education (HE) students in 2011-12, 82 per cent of a total of 31,743 students completed their studies irrespective of the result and 69 per cent successfully completed;
• the remaining 18 per cent of students are accounted for by six per cent of students withdrawing before the funding qualifying date and a further 12 per cent between this point and the end of the course;
• in terms of staff qualifications 93 per cent had a formal teaching qualification in 2010-11 which is up by about 3.5 per cent from 2009-10.
Additional information regarding student enrolments is available on the Scottish Funding Council (SFC) Infact database. Full copies of Education subject and college reviews, and overviews of provision are available from this website: http://www.educationscotland.gov.uk/inspectionandreview/index.asp It is our aim to strive for continuing improvement and enhanced usability of this document. We welcome feedback from readers on matters of content and presentation. Please pass any comments to: Des Parr Statistics Officer Tel: 0131 313 6548 Email: [email protected]

5
2 Introduction
The SFC has published PIs on college teaching activity for the past ten years. The purposes of the indicators have been to inform stakeholders about the performance of the sector, and to help colleges evaluate their own performance both across time and against other similar colleges thereby supporting a wider quality improvement agenda. The Scottish Government stated that ‘good, robust and relevant performance indicators at college level are essential measurement tools for the promotion and sharing of good practice amongst colleges and that the SFC should ‘review the range of PIs considered necessary, and then put in place appropriate mechanisms to establish, measure and publish these.’ Students have a wide variety of personal motivations for studying at college and study across an extensive range of programmes from literacy and numeracy to engineering and agriculture with awards ranging from courses not providing a recognised qualification to higher national certificates and diplomas or degrees in partnerships with Universities. Comparisons of the PIs of individual colleges should take account of the contexts in which different colleges operate and allow for the expected differences in pass rates across years and colleges as a result of random variability. When such comparisons are made, care must be taken to compare colleges with similar provision and students. Our method of presentation and breakdown of PIs by subject groups, duration of study, age groups and gender gives readers a comprehensive view of college provision and performance, enabling a more informed comparison across years or similar provision delivered by other colleges. It is recommended that the reader considers all charts presented for an individual college to gain a rounded impression of college performance and of factors that may lead to changes over time or across colleges. Our PIs provide a quantitative measure of success rates for each college but the SFC also has a contract with Education Scotland (previously HMIE) to perform external quality reviews of college performance. HMIE reports are available online at: http://www.educationscotland.gov.uk/inspectionandreview/index.asp A combination of our PIs and these reports will of course give a fuller and more balanced overview of college delivery and outcomes.

6
3 A description of our performance indicator charts
The following section provides a description of the 16 charts contained within our PI document for each of Scotland’s 42 colleges and for the Scottish college sector overall 1 Grants issued by the SFC and SAAS for teaching and student support, 2011-12
2 Enrolments by qualification aim of course, 2011-12
3 Hours of learning by qualification aim of course, 2011-12
4 Outcomes for FE student enrolments on recognised qualifications, 2009-10 to 2011-12
5 Students completing their FE course with partial success – proportion achieving banded rates
6 Outcomes for HE student enrolments on recognised qualifications, 2009-10 to 2011-12
7 Students completing their HE course with partial success – proportion achieving banded rates
8 Enrolments by age group for courses lasting 160 hours or more, 2011-12
9 Enrolments by level and gender on courses lasting for 160 hours or more, 2011-12
10 Enrolments by HMIE subject grouping on FE courses lasting for 160 hours or more, 2011-12
11 Enrolments by HMIE subject grouping on HE courses lasting for 160 hours or more, 2011-12
12 Enrolments by key student groups on courses lasting for 160 hours or more, 2011-12
13 Performance against activity targets, 2010-11 and 2011-12
14 Full-time equivalent staff, 2010-11
15 Percentage of full-time permanent teaching staff with a teaching qualification, 2009-10 and 2010-11
All examples relate to the actual sector values for 2011-12, except for the Staffing charts and Tariff Score chart which use 2010-11 data.

7
The charts are shown in the order in which they are presented in the publication and cover topics such as funding issued to colleges, student achievement and qualifications held by staff. A full list of the charts contained within the publication is shown below. It is recommended that readers study this section and the example calculations at the end of the document before considering the individual college charts included in the accompanying Excel workbook. Chart 1: Grants issued by the SFC for teaching and student support 2011-12
This bar-chart illustrates the grants allocated to the college sector to fund individual colleges and to support students studying at these colleges.
The legend across the bottom of the chart describes the breakdown of funds that make up the overall funding package to the college to fund teaching activity and provide student support to qualifying students. Each of these funds is described in more detail below: • Teaching grants: these funds contribute towards the costs of delivering the programmes of study including academic, administrative,
technical and support staff; and facilities, accommodation, equipment and materials. More detail on these grants can be found within our circular outlining college funding for 2011-12 (circular SFC/09/2011)
• Fees paid by SFC: Scottish students are eligible to have their course fees paid by the SFC if they are enrolled on a full-time FE programme. These payments are made direct to the college and not to the student. Part-time students will also qualify for their fees to be paid by the SFC if the student receives certain types of benefit or meets one of the priority groups outlined in our fee waiver policy document (circular SFC/11/2011)

8
• Estimated fees paid by SAAS: Scottish students are eligible to have their course fees paid by SAAS if they are enrolled on a full-time HE programme. Students from other areas may also qualify to have their fees paid if they meet the conditions specified in the SAAS guidance (http://www.saas.gov.uk/student_support/index.htm). The SFC has estimated these fees for each college based on our records of full-time HE students studying at Scotland’s colleges.
• Discretionary and Childcare funds available: Childcare funds allow colleges to provide help towards the childcare costs of eligible students. Discretionary funds can be used to provide financial support to students at the discretion of their college. The total funds include grants from the SFC for the AY and funds carried forward from the previous year. Student support guidelines are outlined within circular SFC/11/2011.
• Bursary funds available: The SFC provides colleges with funds to provide support to students studying at their college who are from families with low income or require help with living, accommodation, study or travel costs. Student support guidelines are outlined within circular SFC/11/2011.
• Education Maintenance Allowance (EMA): Provides financial support for 16-19 year olds from low-income households who are attending non-advanced full-time education.
Average scores for qualification achieved at school for all school leavers, those leaving to study at HE level and those enrolled on a full-time FE or HE programme at this college
The bar chart below compares the average points score for qualifications achieved at school for full-time further and higher education college students in 2010-11 with the average points score for all school leavers in 2009-10 and those leaving school to study at HE level at a college or university in 2009-10.

9
The average points score for full-time FE and HE college students in 2010-11 have been derived by linking the college records for these students aged 17 to 20 with the student attainment records held by the Scottish government for all school pupils. For example an FE college student aged 20 may have left school in 2006-07 and therefore the college record would have been matched to the achievement record at school in 2006-07. Average points are derived by allocating points for each school qualification by level. Annex G provides details of points awarded for each qualification. By means of a summary an advanced higher at ‘A grade is worth 120 points while a standard grade at level 7 would be 3 points. In general, those learners choosing to go to college have achieved at a lower level at school than the average school leaver. This could be seen as an indicator of the additional challenges faced by colleges in relation to retaining and delivering successful outcomes for this group of learners.

10
It should be noted that the tariff score for those leaving school to study HE at university or College would be higher if it was for those school students leaving school to study HE at university alone. The chart clearly shows that full-time students studying HE at college do not achieve the average points score for those studying HE at university or college as shown above. Please note that the publication does not include a tariff score chart for each individual institution.

11
Charts 2 & 3: Enrolments and hours of learning by qualification aim of course 2011-12
The two charts below provide an outline of college activity split by ‘recognised’ and ‘non-recognised’ programmes and an aggregation of activity levels by bands of hours of learning1 required to complete the course year. A recognised qualification will lead to a national award such as National Certificates, Scottish Vocational Qualifications (SVQs), Higher National Diplomas (HND) or Higher National Certificates (HNC). Non-recognised programmes may include activity designed to meet the needs of a local employer or students with learning difficulties. They may also be leisure programmes or other programmes designed to meet the needs of the individual but not leading to a recognised/national award. We have not included this activity in our performance indicators charts as it is less likely to be assessed and because these courses are often short in duration and less relevant to performance measurement. These non-recognised programmes can often be a student’s first step back into learning and can lead to further study towards a recognised qualification soon after. Our 2011-12 PI report is based on a different coverage from that of the Baseline Report and is not comparable. The PI report shows there were 77,154,840 hours of learning across 263,257 student enrolments. Students often enrol on more than one programme in a single AY. Students who do not meet the required funding date are excluded and students who are non-fundable are included as are students who have not yet completed their course. Although 25 per cent of student enrolments (66,347) are on courses that do not lead to a recognised qualification only 6 per cent of the total learning hours are attributable to these students. The number of enrolments on non-recognised qualifications has fallen by 40 per cent since 2010-11 and the number of hours of learning has fallen by 1,259,703 which equates to 22 per cent. Around 95 per cent of college funding is based on hours of learning rather than student numbers and, therefore, the vast majority of funding is directed towards recognised qualifications. The duration of a programme can range from as little as an hour in length to a full-time programme consisting of 640 hours or more. This large disparity in duration can have a significant impact on the retention rates of programmes. To overcome this issue we have created seven discrete groups of activity ranging from programmes where the duration is less than 10 hours to full-time programmes of 640 hours or more.
1 Colleges’ activity is measured using the student unit of measurement (SUM) where one SUM = 40 hours of learning

12
By categorising activity in this way the reader should be able to better understand differences in provision across colleges and therefore make more informed comparisons of activity which can be determined to share similar characteristics.

13
Of all enrolments on courses leading to Non-Recognised Qualifications (NRQs), just over 57 per cent are on courses lasting less than 40 hours, with 22 per cent on courses of less than 10 hours. Just one per cent of these student enrolments are classified as full-time. By comparing the chart on hours of learning with the chart on enrolment numbers, we can work out average hours of learning for each of the hours of learning bands. The average enrolment on a non-recognised qualification accounts for 67 hours of learning whilst the average for recognised qualifications is 369. This means that courses leading to recognised qualifications, on average, last around five times as long as those leading to a non-recognised qualification. Annexes B, C & D provide a breakdown of learning hours by qualification of study, mode of study and age groups to provide a better understanding of the type of provision included within our bands of hours of learning. Charts 4 to 12 exclude courses that do not lead to a recognised qualification. Scotland’s colleges provide the SFC with details of the courses that they deliver and the students who enrol on these courses. This data includes details of the student’s results at the end of the AY or withdrawal date if the student does not make it to the end of the course. These individual outcomes are described in more detail below: • Early withdrawal indicates that the student has withdrawn from the programme before 25 per cent of the course has
elapsed. The SFC does not provide activity funding for students who leave before the 25 per cent date (also known as the funding qualifying date). These students may have left to take up a place at another college or higher education institution, to start a job or perhaps because they found they were unable to continue their studies for financial reasons or because they found the course unsuitable. Colleges often have waiting lists for their courses as they can be oversubscribed. However, it is often too late to replace students with someone from the waiting list at the time of withdrawal.
• Further withdrawal indicates that the student attended after the funding qualifying date but withdrew from their studies before the programme ended. The SFC pays the same price for students in this category as they do for a student who completes their programme.

14
• Completed partial success: indicates that the student completed the programme but did not gain the qualification. This could mean that the student has passed all units except one, or did not pass any units at all. It is generally accepted, however, that the student will have gained some benefit from completing their studies. There will also be instances where a student enrols at college to gain the qualifications to proceed to university. For example, they may enrol to study four Highers but then receive a conditional offer from a university based on passing just two Highers. In that scenario the student may decide to withdraw from two of the Highers to concentrate on passing the two required for entry to their university course.
• Completed successful: indicates that the student has completed the course year. If this is a one year course (which is true of most courses) the student will have gained the qualification they were aiming for. If the student was on a course of more than one year and was not in the final year they will have progressed to the next year of study and achieved at least 70 per cent of the units studied in the current year.
These four categories are used within charts 4 to 12 which describe performance across courses of various duration in terms of hours of learning required to complete the course year plus age groups, level and gender, subject groups and other groups of interest such as minority ethnic groups or disability. Each of these charts contains two percentage figures; the first describes the percentage of students who successfully completed the course year and the second is the percentage that completed the course year irrespective of their result. Both these values have been calculated as a percentage of all enrolments. Where the number of enrolments is less than 50, the bar that describes the activity levels will be shown but the success and completion rates will not. This avoids spurious statistical accuracy in the published pass rates and reduces the risk of incorrect conclusions being drawn from pass rates based on small numbers. Examples of these calculations can be found at Annex A.

15
Chart 5: Outcomes for Further Education student enrolments on recognised qualifications, 2009-10 to 2011-12

16
The FE recognised qualifications chart above provides an overview of success rates on FE recognised programmes from 2009-10 to 2011-12. The figures are presented to allow the reader to make comparisons over time and to reduce the risk of basing an assessment of performance on a snapshot of a single year when performance may vary over time. For 2011-12 we can see that 64 per cent of students on full-time programmes completed successfully whilst a total of 75 per cent completed irrespective of their final result. This means that 11 per cent completed with partial success. This leaves 25 per cent of students who withdrew before the programme ended with the withdrawal bars suggesting about nine per cent withdrew prior to the 25 per cent date and the remaining 16 per cent before the programme ended. Chart 6: Students completing their FE course with partial success – proportion achieving banded rates (excluding students on courses lasting less than 160 hours)
The chart above provides more detailed information for the 10,631 students enrolled on FE programmes in 2011-12 who completed with partial success (as shown in the previous chart). It excludes students with fewer than 160 hours of study. It shows that half of these students gained at least 50 per cent of the units they enrolled on (3,136 + 2,247 = 5,383) while around 21 per cent (2,247) of these students gained at least 75 per cent of the units on their programme. At the other end of the scale 1,525 or 14 per cent of the students failed to gain any of the units for which they enrolled.

17
Chart 7: Outcomes for Higher Education student enrolments on recognised qualifications
In terms of recognised programmes of HE, the chart below once again provides an overview of success rates for academic sessions 2009-10 to 2011-12. As with the FE chart, the figures are presented for three years to allow the reader to make comparisons over time and to reduce the risk of basing an assessment of performance on a snapshot of a single year when performance may vary over time. The pass rates for HE programmes tend to be higher than FE programmes over the course year and this is reflected below with 69 per cent of students on full-time programmes completing successfully and a total of 82 per cent completing irrespective of their final result. These figures are comparable with the values of 64 per cent and 75 per cent for FE programmes but it should be noted that full-time HE programmes are more likely to be longer than a year in duration. For example, a full-time HND is likely to last for two years and therefore it is likely that the pass rate from day one to achieving the qualification will be lower than shown as there are likely to be further withdrawals or failures in the subsequent years.

18

19
Chart 8: Students completing their HE course with partial success – proportion achieving banded rates (excluding students on courses lasting less than 160 hours) The chart below provides more detailed information for the 5,034 students enrolled on HE programmes in 2011-12 who completed with partial success (as shown in the previous chart). It excludes students with fewer than 160 hours of study. It shows that half of these students gained at least 50 per cent of the units they enrolled on (1,397 + 1,147 = 2,544) while around 23 per cent (1,147) of these students gained at least 75 per cent of the units on their programme. At the other end of the scale 393 or eight per cent of the students failed to gain any of the units for which they enrolled.
This chart shows that students who complete their programme are likely to achieve some measurable level of success even if they do not achieve the award they enrolled for. The following five charts provide information on the age, gender, level, and subject groupings for programmes lasting for 160 hours or more. We have chosen to concentrate on courses that last for at least 160 hours as we believe that these are more comparable across the sector and across years. A student studying for a ‘Higher’ would be expected to engage in 160 hours of learning.

20
Chart 9: Enrolments by age group for courses lasting 160 hours or more, 2011-12
Our figures show that students in the younger age groups are less likely to complete successfully than those in the older age groups. In reality the comparison is far more complex than first meets the eye. Younger students are more likely to enrol on full-time programmes which have a lower pass rate in comparison to part-time programmes. They may also be more likely to enrol on subjects that have lower pass rates or to withdraw from college because they have managed to get a place at university a month or so after their college course began. These charts allow for a more informed comparison of college activity but the reader should nevertheless take account of the specific environment in which each college operates and consider the relationship between the charts presented to gain a more rounded view of college performance. Viewing a single indicator in isolation leaves the reader open to drawing incorrect conclusions.

21
Chart 10: Enrolments by level and gender on courses lasting 160 hours or more, 2011-12
Once again, the reader should be careful not to draw incorrect conclusions from a single chart. The chart below seems to suggest that male students are more likely to successfully complete their FE programmes than female students. Again it is important to consider the fuller picture and to understand the relationships between the various charts presented. Subjects and modes of study are associated with different pass rates and the ‘mix’ of these may differ across genders and individual colleges. Figure 7 (baseline) shows females are more likely to study part-time.
The chart shows that more than two thirds of enrolments are for students studying FE level programmes in 2011-12 and females outnumber males. The success rates are different across these groups and provide a more rounded picture of college performance when considered alongside the other charts presented for each college.

22
It should be easier to compare college results that show similar splits of FE and HE and male and female provision, especially if other indicators such as subjects, age groups and bands of hours of learning show a similar profile to the college of interest. Chart 11: Enrolments by subject groupings on FE courses lasting for 160 hours or more, 2011-12
The subject groupings are based on the subject classification for the course aggregated into areas considered similar by Education Scotland. A subject mapping can be found at Annex E. There are two charts, one for FE level programmes and one for HE level programmes. Colleges offer a very wide ranging portfolio of courses and subject areas of study to potential students.

23
The chart above for FE programmes clearly shows that some subjects have lower success rates than others. Science, for example, shows a 52 per cent success rate whilst engineering stands at 75 per cent. This may be explained by many of the engineering students studying on day release from their jobs which can make them more motivated whilst those in the science group are more likely to be studying full-time which in itself has a lower pass rate. Programmes of Highers are also more likely to fall into the science group and we are aware that these pass rates can be influenced by changing priorities amongst students, for example, initially enrolling for four Highers but only completing two as this is sufficient to gain entry to their chosen university. Chart 12: Enrolments by subject groupings on HE courses lasting for 160 hours or more, 2011-12
Similar issues exist for HE programmes with some subjects being more likely to be made up of students studying on day release from their employer, in which case the student has extra motivation to do well. Similarly, some of these courses will have a greater mix of full-time programmes or students from younger age groups. Once again, to get the best out of these charts the reader should consider the relationships between the charts and knowledge of the context in which the college operates. In itself the chart can provide useful information on volumes and success rates but, by considering the other information provided for the college and for other similar colleges, it is possible to gain a more rounded view of how the college is performing and how it may be expected to perform.

24

25
Chart 13: Enrolments by key student groups for courses lasting 160 hours or more, 2011-12
The chart below has been designed to highlight groups of interest to various stakeholders and to go some way towards identifying factors that may affect the success rates for an individual college. For example, a college with a high number of students on day release from their employer or supported by their employer in some other way is likely to have a high pass rate for these students and this may be enough to affect overall pass rates. Similarly, students who receive student support are more likely to be successful than those who do not and this may also have an effect on pass rates. On the other hand students from deprived areas are likely to do less well than other groups and therefore a college with a high number of enrolments from these areas may achieve lower pass rates. It should be noted that the chart also shows the volume of students who withdraw from their studies for positive reasons such as to study at a university or to commence employment.

26

27
Chart 14: Performance against activity levels, 2010-11 and 2011-12
Colleges receive funding from the SFC to deliver a target number of hours of learning. These hours of learning are weighted by the cost of teaching in different subject areas. For example, engineering courses tend to require specialist equipment and therefore have a higher weight than business courses that are more likely to be classroom based. Colleges must deliver within 95 per cent of their target or their teaching grant can be reduced. Note the targets are those as published in the main grant letter and include additional targets associated with European Social Fund (ESF) and Partnership Action for Continuing Employment (PACE) projects. The activity delivered is also all inclusive encompassing the ESF and PACE figures. The overall effect is that the sector is shown as exceeding their target by 1.8 per cent. Even when taking into account the additional targets, if those had been excluded, the sector would still have exceeded the target by 4.1 per cent. All colleges met their targets or fell within the leeway for 2011-12.
Chart 15: Full-time equivalent staff, 2010-11
The bar-chart in this figure illustrates the percentage of full-time equivalent staff in FE colleges in 2010-11. Just over 70 per cent of all staff in Scotland’s colleges are permanent full-time teaching staff. More details on staffing in Scotland’s colleges are available at: www.sfc.ac.uk/statistics/facts_figures/0910/staffing0910.aspx

28
Chart 16: Percentage of full-time permanent teaching staff with a teaching qualification
This bar-chart measures the percentage of full-time teaching staff with a teaching qualification recognised by the General Teaching Council.

29
4 An overview of performance indicators for Scotland’s colleges
The college sector has undergone considerable change in recent years. Between 2005-06 and 2011-12 there has been around a steady increase in full-time students especially at HE level. Colleges are delivering fewer programmes to those studying on a part-time basis, particularly courses of a duration of less than 40 hours where activity has decreased significantly in 2011-12 as they did in the previous year. This is in accord with the SFC policy of reducing student numbers on leisure programmes and short courses lasting for less than 10 hours. This change in policy for short courses is described in paragraph 49 of circular SFC/14/2010 our main grant letter for AY 2010-11. SFC asked colleges to replace these very short programmes with more substantial programmes of study and to prioritise additional places for those aged 16 to 24 who were not in employment, education or training. The increase in full-time students may have had an impact on overall success rates as full-time students are less likely to complete their programmes. These programmes require commitment over a longer period of time and pass rates can be lower as students are required to achieve more units/credits than those enrolled on short part-time courses. Further information from the SFC on Scotland’s colleges is available from the sources below. Student numbers may differ across these publications as the reports are prepared for different purposes. For example, our PI report excludes students who begin courses in January and finish in December of the same year, as results will not be available for these students until the course ends. However, activity related to these students will be included in another SFC publication; The Baseline report. The Infact database on college courses and students is available on the SFC website: www.sfc.ac.uk/statistics/further_education_statistics/infact_database/infact_database.aspx

30
A comparison of success rates for full-time FE student enrolments leading to a recognised qualification for academic years, 2010-11 and 2011-12.
The next two graphs plot data relating to successful achievement rates in each of the colleges. Activity below full-time is excluded to improve comparability across the colleges. Results for full-time FE provision are shown for AYs 2010-11 and 2011-12 in the chart below.
The chart plots success rates for each college in 2010-11 and 2011-12. The position of each point shows the value for 2010-11 on the horizontal axis (reading across from left to right) and for 2011-12 on the vertical axis (reading bottom to top). To illustrate how the chart should be read we have added a dummy value using a red diamond that shows a college achieving 75 per cent in 2010-11 and 65 per cent in 2011-12. If a college attains the same success rates for 2010-11 and 2011-12, then their result will lie on the black line. If their result in 2011-12 has improved from the position in 2010-11, then the college value will be shown above the line and below if the success rate has fallen between 2010-11 and 2011-12. We have shown the data points in dark green if the success rate is lower in 2011-12 than it was in 2010-11 and in light green if the success rate improved over the two years.

31
The sector pass rate stood at 61.7 per cent in 2010-11 and increased to 63.6 per cent for 2011-12. In total, 29 of the 40 colleges show an increase in their achievement rate in 2011-12. Most college results are above the black line indicating better performance over the two years. A comparison of success rates for full-time HE student enrolments leading to a recognised qualification for academic years 2010-11 and 2011-12.
The chart below provides the same information for full-time HE provision. Again we have shown the data points in dark green if the success rate is lower in 2011-12 than it was in 2010-11 and in light green if the success rate improved over the two years.
The success rate increased in 25 of the 32 colleges while the sector pass rate increased from 66.7 per cent to 69.1 per cent. Some college results are distant from the black line indicating a different performance over the two years. It should also be noted that there are more full-time HE students in 2011-12 and pass rates are lower for these students than those studying part-time.
32
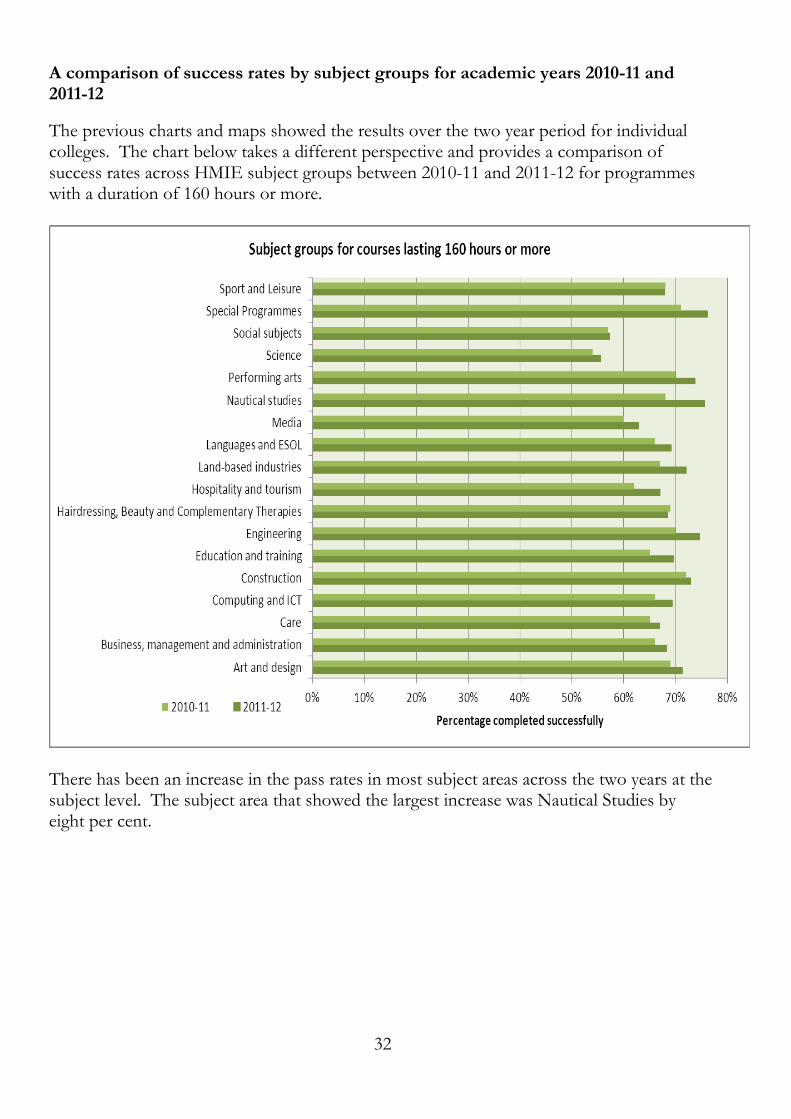
A comparison of success rates by subject groups for academic years 2010-11 and 2011-12
The previous charts and maps showed the results over the two year period for individual colleges. The chart below takes a different perspective and provides a comparison of success rates across HMIE subject groups between 2010-11 and 2011-12 for programmes with a duration of 160 hours or more.
There has been an increase in the pass rates in most subject areas across the two years at the subject level. The subject area that showed the largest increase was Nautical Studies by eight per cent.

33
A comparison of success rates by age of student for academic years 2010-11 & 2011-12
The chart below compares 2011-12 with 2010-11 in terms of the percentage of students successfully achieving their qualification aim for programmes with a duration of 160 hours or more by age group. Individual college charts and sector values show differences in success rates across the age bands hence it was considered appropriate to present this breakdown as changes in the age distributions may affect overall pass rates. The choice of age bands reflects the SFC’s prioritisation of activity for those aged 16 to 24 and it is useful to have more detailed information within this age range. The figure shows an increase in success rates over the two years in all age bands.
Younger students are more likely to be enrolled on full-time programmes which generally have lower success rates than shorter programmes. Subject choices also differ across the age groups and these factors will impact on the success rates for the individual age groups and across colleges. The reader should consider contextual factors such as differences in hours of study or subject mix when comparing success rates in order to improve the appropriateness of comparisons. Factors such as levels of deprivation should also be considered when comparing success rates. We intend to develop our analysis over time and are happy to receive feedback on the type of analysis our readers would like to see to help us to improve future reports.

34
Annex A: Calculations
Examples
The PIs included within this publication are intended to provide an overview of the student journey from day one to the end of the programme. This example refers to a full-time computing course but the same calculations would be applied for full-time, part-time or day release courses. 100 people have enrolled on the course which runs from September 2011 to July 2012 over 36 teaching weeks. Holidays do not count as teaching weeks. Two students drop out in the first week, one because they were offered a job and the other because they felt the course was not as they had hoped. Another three students drop out in week 3, 2 because they had applied for student support only to find that the means testing had shown they were ineligible and therefore unable to fund their living expenses. The other withdrew because they were offered a place at University starting in October. Two more students dropped out in week 4 both because they found the course too difficult. All other students continued their studies until week 8 when a further three students withdrew. Two of these students simply stopped attending and the other was fortunate enough to start work with a local IT company. Our funding qualifying date is reached in week 9 when a quarter of the required days of attendance pass. By this point the 10 students discussed above have withdrawn from their studies. One of our main indicators is the number of students who withdraw prior to the funding qualifying date. The Early withdrawal indicator would therefore be derived by working out the percentage of withdrawals prior to the funding qualifying date of all enrolments. We know that 100 students started on the course and that 10 withdrew before the funding qualifying date therefore 10 per cent withdrew prior to the funding qualifying date. Early withdrawal = 10 / 100 =10%

35
SFC does not pay the college any teaching grant for these 10 students. Although withdrawals are seen as a negative indicator our example above shows that two students actually left to commence employment and another to take up a place at University. Most people, probably including the students in question, would not see these as negative outcomes and the reader should be aware that students withdraw for various reasons. No one drops out in week 9 or 10 but this still leaves 26 weeks to go until the end of the course. The first student to drop out after the funding qualifying date withdraws in week 11 but they don’t tell the college why they have chosen to stop their studies. Another one student drops out in week 13 and a further three in week 14. One of these students has left to start a new job another for personal reasons and the remaining two as the course has become too difficult. The Christmas holidays begin in week 15 and unfortunately five students simply don’t return after the holiday period. Exams begin in February which is week 18 and another three students withdraw before the second semester begins. There are no more withdrawals until the Easter holidays when one more student decides to stop attending as they were behind with their studies. One final student withdraws in week 32 for personal reasons. In total that’s 15 additional students who have withdrawn between the funding qualifying date and the end of the programme. One of these was to start a job. Another of our main indicators is the number of students who withdraw between the funding qualifying date and the end of the programme. The Further withdrawal indicator would therefore be derived by working out the percentage of withdrawals between the funding qualifying date and the end of the programme. We know that 100 students started on the course and that 15 withdrew between the funding qualifying date and the end of the course therefore 15 per cent withdrew after the funding qualifying date.

36
Further withdrawal = 15 / 100 =15% We now of course know that 10 students withdraw before the funding qualifying date and that 15 withdraw between the funding qualifying date and the end of the course. This means that 75 of the 100 students (75 per cent) completed their course. Our PIs however are designed to differentiate between those who complete and achieve the qualification they were aiming for and those who complete but with a lesser level of success. Our further education statistics (FES) guidance notes for 2011-12 can be found at: http://www.sfc.ac.uk/guidance/SubmittingStatisticalInformation/FE_statistical_data/Data2011-12/fes_1112.aspx Code List I on page 24 provides a list of student outcomes that are used to define the result for each student. Our PIs include the following outcomes for those completing their programmes of study. 07 Completed programme/course, student assessed but not
successful. 08 Completed programme/course, student assessed and successful. 14 Completed programme student not assessed as programme is not
designed to be assessed. 17 Student has progressed to next year but did not gain
70 per cent of the credits undertaken. 18 Student has progressed to next year and has achieved 70 per cent of
the credits undertaken. 20 Student has achieved 70 per cent of the credits undertaken but has
chosen not to progress onto the next year. 22 Student completed first year of an HND but has chosen to leave with
an HNC. If a student has their result coded as 07 or 17 above they are considered to have completed with partial success. These students may have passed all but one unit or no units but they are still likely to have gained some benefit from completing their studies. In our computing example 20 students have been coded as either codes 07 or 17 and therefore are considered to have completed with partial success.

37
Completed: Partial success = 20 / 100 =20 We have already established that our early withdrawal rate was 10 per cent our further withdrawal rate 15 per cent and now our completed: Partial Success rate 20 per cent. This would of course mean that 55 of the initial 100 enrolments gained the qualification they aimed for: Completed: Successful = 55 / 100 = 55 These four groups are the building blocks of our PIs. The SFC believes that these four indicators are best viewed as a whole and therefore these data are presented as separate parts of a bar-chart. An example is shown below:
The 55 per cent refers to those completing successfully and the second percentage provides the cumulative total of those completing. Therefore of the 75 per cent of students completing the programme 55 per cent completed successfully and 20 per cent completed with partial success.

38
Annex B: Enrolments by qualification aim
Qualification Under 10hrs
10 to 40 hrs
40 to 80 hrs
80 to 160 hrs
160 to 320 hrs
320 hrs to FT
Full Time Total
Masters (taught) 5 5 Postgraduate diploma 8 16 24 First degree (honours) 64 64 First degree (ordinary) 2 30 52 22 433 539 Graduateship of professional body 84 29 113 Membership of professional body 50 68 29 73 8 228 Associateship of professional body 27 48 80 155 SVQ or NVQ: Level 5 2 4 1 7 Diploma (HNC/D level for diploma and degree holders) 6 1 83 37 132 259 HND or equivalent 75 168 315 461 18,847 19,866 HNC or equivalent 79 399 3,965 687 13,491 18,621 SVQ or NVQ: Level 4 27 50 91 141 182 491 Advanced Certificate (bridge to HNC/D) 4 100 166 8 278 Advanced Certificate not specified elsewhere 25 143 345 530 148 3 1,194 Advanced Diploma not specified elsewhere 3 61 156 258 158 121 757 Advanced Certificate (comprising HN units only) 1 192 243 177 127 16 756 HN units only but not leading to certificate 8 1,275 1,062 875 344 65 3,629 SVQ: Level 3 11 280 742 644 1,531 3,571 2,312 9,091 NVQ: Level 3 67 20 138 194 233 652 GSVQ/GNVQ: Level 3 21 14 16 22 19 102 194 SVQ: Level 2 9 503 492 1,717 1,674 3,615 8,010 NVQ: Level 2 14 17 68 108 43 565 815 GSVQ/GNVQ: Level 2 1 42 9 249 301 SVQ: Level 1 25 110 625 121 868 1,749 NVQ: Level 1 34 2 147 183 GSVQ/GNVQ: Level 1 15 15 Advanced Higher (group award) 16 18 106 13 153 Higher (group award) 50 94 177 1,289 113 2,413 4,136 Intermediate 2 (group award) 56 45 162 607 330 2,891 4,091 Intermediate 1 (group award) 34 356 1,602 727 97 365 3,181 Access (group award) 24 12 12 217 265 Highest level of study (unit) Advanced Higher 166 5 53 16 45 167 452 Highest level of study (unit) Higher 139 1,036 960 3,391 1,280 9,820 16,626 Highest level of study (unit) Intermediate 2 291 2,104 1,029 2,299 1,816 6,983 14,522 Highest level of study (unit) Intermediate 1 4 761 1,614 3,261 1,676 1,419 2,382 11,117 Highest level of study (unit) Access 11 277 1,621 1,032 1,217 1,182 1,260 6,600 Other Non Advanced Certificate or equivalent 6,344 5,686 4,934 9,212 3,573 1,607 7,596 38,952 Other Non-Advanced Diploma or equivalent 15 50 65 43 1,129 1,302 Certificate of Sixth Year Studies (CSYS) 14 14 Other SCE/GCE/GCSE examinations only 14 43 443 147 647 National Units alone (formerly National Certificate modules), not leading to any qualification listed above 4 403 3,196 2,901 1,549 1,269 7,706 17,028 Any other recognised qualification 3,070 4,962 3,167 3,215 2,338 612 1,729 19,093 Programme not leading to recognised qualification (including most non?vocational programme) 19,890 24,249 10,237 13,446 5,166 1,675 779 75,442
Total 29,349 37,498 31,858 41,109 35,403 19,516 86,884 281,617

39
Annex C: Enrolments by mode of attendance
Mode Under
10hrs10 to 40
hrs40 to 80
hrs80 to 160
hrs160 to
320 hrs320 hrs to FT
Full Time Total
Short full time 373 1,565 583 729 1,525 2,536 7,311 Block release 227 277 134 1,234 2,904 4,776 Part time (day release) 10,268 5,572 2,949 4,844 7,332 2,795 33,760 Other part-time day programme 12,611 16,533 10,453 15,914 13,371 5,551 74,433 Evenings only and weekends 1,442 10,009 7,930 3,914 5,548 745 29,588 Assessment of work based learning 120 80 1,113 975 1,753 1,045 5,086 Distance learning 675 1,859 1,438 768 186 4,926 Locally based learning 26 357 110 353 75 921 College based private study 219 153 22 14 6 414 Other open learning or directed private study systems 122 850 2,622 8,772 1,243 81 13,690 Flexible learning 4,413 1,740 3,552 4,247 1,924 691 16,567 Full-Time 2 1 32 86,884 86,919 Part-Time, but previously met old full-time criteria 2 8 9 306 2,901 3,226
Total 29,349 37,498 31,858 41,109 35,403 19,516 86,884 281,617

40
Annex D: Enrolments by age
Age Under
10hrs10 to 40
hrs40 to 80
hrs80 to 160
hrs160 to
320 hrs320 hrs to FT
Full Time Total
under16 7,757 3,414 3,259 8,462 3,767 735 678 28,072 16-19 year old 4,629 5,668 5,904 6,491 11,181 7,875 47,096 88,844 20-24 Year old 2,701 3,817 4,049 4,636 5,602 3,677 20,376 44,858 25-39 years old 5,828 8,204 8,185 9,893 8,462 4,453 14,697 59,722 40 and over 8,434 16,395 10,461 11,627 6,391 2,776 4,037 60,121
Total 29,349 37,498 31,858 41,109 35,403 19,516 86,884 281,617

41
Annex E: HMIE Mapping to superclassII
HMI Subject Classification
Superclass II
Art and design
Arts and Crafts
JA Art Studies/Fine Arts
JB Art Techniques/Practice
JC Design (non-industrial)
JD Museum/Gallery/Conservation Skills
JE Collecting/Antiques
JF Crafts: Leisure/General
JG Decorative Leisure Crafts
JH Decorative Metal Crafts/Jewellery
JK Fashion/Textiles/Clothing (craft)
JL Fabric Crafts/Soft Furnishings
JR Glass/Ceramics/Stone Crafts
Authorship/Photography/Publishing/Media
KE Photography
KH Print and Publishing
Construction and Property (Built Environment)
TJ Interior Design/Fitting/Decoration
Manufacturing/Production Work
WL Paper Manufacture
Business, management and administration
Business/Management/Office Studies
AA Business/Finance (general)
AB Management (general)
AC Public Administration
AD International Business Studies/Briefings
AE Enterprises
AF Management Skills
AG Management Planning and Control Systems
AJ Human Resources Management
AK Financial Management/Accounting
AL Financial Services
AY Office Skills
AZ Typing/Shorthand/Secretarial Skills
Sales, Marketing and Distribution
BA Marketing/PR
BB Export/Import/European Sales
BC Retailing/Wholesaling/Distributive Trades
BD Retailing/Distribution: Specific Types

42
BE Sales Work
BF Physical Distribution
Information Technology and Information
CY Information Systems/Management
CZ Libraries/Librarianship
Politics/Economics/Law/Social Sciences
EB Economics
EC Law
Family Care/Personal Development/Personal Care and Appearance
HE Personal Finance/Consumerism/Rights
Services to Industry
VB Production/Operations Management
VC Purchasing/Procurement and Sourcing
VD Quality and Reliability Management
Care
Family Care/Personal Development/Personal Care and Appearance
HF Parenting/Carers
HH Crisis/Illness/Self Help
Health Care/Medicine/Health and Safety
PA Health Care Management/Health Studies
PH Nursing
PJ Semi-Medical/Physical/Psycho/Therapies
PK Psychology
PL Occupational Health and Safety
PM Social Care/Social Work Skills
PN Family/Community Work/Youth Advice Work
PP Crisis Support/Counselling
PQ Child Care Services
Computing and ICT
Information Technology and Information
CA Computer Technology
CB IT: Computer Science/Programming/Systems
CC IT: Computer Use
CD Using Software and Operating Systems
CE Text/Graphics/Multimedia Presentation Software
CH Software for Specific Applications/Industries
CX Information Work/Information Use
Construction
Arts and Crafts
JP Wood Cane and Furniture Crafts
Environmental Protection/Energy/Cleansing/Security
QB Energy Economics/Management/Conservation

43
QD Environmental Health/Safety
Science and Mathematics
RG Land and Sea Surveying/Cartography
Construction and Property (Built Environment)
TA Built Environment (general)
TC Property: Surveying/Planning/Development
TD Building Design/Architecture
TE Construction (general)
TF Construction Management
TG Building/Construction Operations
TH Building Services
TK Construction Site Work
TL Civil Engineering
TM Structural Engineering
Manufacturing/Production Work
WK Woodworking/Furniture Manufacture
Education and training
Education/Training/Teaching
GA Education Theory/Learning Issues
GB Teaching/Training
GC Teaching/Training: Specific Subjects
GD Education/School Organisation
GE Training/Vocational Qualifications
GF Careers/Education Guidance Work
Family Care/Personal Development/Personal Care and Appearance
HC Career Change/Access
Engineering
Environmental Protection/Energy/Cleansing/Security
QH Security
QJ Fire Prevention/Fire Fighting
Services to Industry
VE Industrial Control/Monitoring
VF Industrial Design/Research and Development
VG Engineering Services
Manufacturing/Production Work
WA Manufacturing (general)
WB Manufacturing/Assembly
WC Instrument Making/Repair
WD Testing Measurement and Inspection
WE Chemical Products
VF Glass/Ceramics/Concretes Manufacture
WG Polymer Processing
WH Textiles/Fabrics (industrial)

44
Engineering
XA Engineering/Technology (general)
XD Metals Working/Finishing
XE Welding/Joining
XF Tools/Machining
XH Mechanical Engineering
XJ Electrical Engineering
XK Power/Energy Engineering
XL Electronic Engineering
XM Telecommunications
XN Electrical/Electronic Servicing
XP Aerospace/Defence Engineering
XR Road Vehicle Engineering
XS Vehicle Maintenance/Repair
XT Rail Vehicle Engineering
Oil/Mining/Plastics/Chemicals
YA Mining/Quarrying/Extraction
YB Oil and Gas Operations
YC Chemicals/Materials Engineering
YD Metallurgy/Metals Production
YE Polymer Science/Technology
Transport Services
ZA Transport (general)
ZD Freight Handling
ZG Rail Transport
ZH Driving Road Safety
ZJ Road Transport Operation
ZL Motor Trade Operations
Hairdressing, beauty and complementary therapies
Family Care/Personal Development/Personal Care and Appearance
HK Therapeutic Personal Care
HL Hair/Personal Care Services
Health Care/Medicine/Health and Safety
PC Complementary Medicine
Hospitality and tourism
Catering/Food/Leisure Services/Tourism
NA Hotel/Catering (general)
NB Food/Drink Services
NC Catering Services
ND Hospitality Services
NE Baking/Dairy/Food and Drink Processing
NF Cookery
NG Home Economics

45
NH Food Science/Technology
NK Tourism/Travel
Environmental Protection/Energy/Cleansing/Security
QE Cleansing
Manufacturing/Production Work
WM Food/Drink/Tobacco (industrial)
Transport Services
ZE Aviation
Land-based industries
Environmental Protection/Energy/Cleansing/Security
QA Environmental Protection/Conservation
QC Pollution/Pollution Control
QG Funerary Services
Agriculture Horticulture and Animal Care
SA Agriculture/Horticulture (general)
SB Agricultural Sciences
SC Crop Protection/Fertilisers/By-products
SD Crop Production
SE Gardening/Floristry/Plant Sales
SF Amenity Horticulture/Sports grounds
SG Forestry/Timber Production
SH Animal Husbandry
SJ Fish Production/Fisheries
SK Agricultural Engineering/Farm Machinery
SL Agricultural/Horticultural Maintenance
SM Rural/Agricultural Business Organisation
SN Veterinary Services
SP Pets/Domestic Animal Care
Manufacturing/Production Work
WJ Leather Footwear and Fur
Languages and ESOL
Area Studies/Cultural Studies/Languages/Literature
FJ Linguistic Studies
FK Languages
Media
Area Studies/Cultural Studies/Languages/Literature
FC Literature
Authorship/Photography/Publishing/Media
KA Communication/Media (general)
KB Communication Skills
KC Writing (authorship)
KD Journalism

46
KF Film/ Video Production
KG Audio and Visual Media
Nautical studies
Engineering
XQ
Ship and Boat Building/Marine/Offshore Engineering
Transport Services
ZF Marine Transport
Performing arts
Performing Arts
LA Performing Arts (general)
LB Dance
LC Theatre and Dramatic Arts
LD Variety Circus and Modelling
LE Theatre Production
LF Music History/Theory
LG Music of Specific Kinds/Cultures
LH Music Performance
LJ Musical Instrument Technology
Science
Health Care/Medicine/Health and Safety
PB Medical Sciences
PD Paramedical Services/Supplementary Medicine
PE Medical Technology/Pharmacology
PF Dental Services
PG Opthalmic Services
Science and Mathematics
RA Science and Technology (general)
RB Mathematics
RC Physics
RD Chemistry
RE Astronomy
RF Earth Sciences
RH Life Sciences
Social subjects
Humanities (History/Archaeology/Religious Studies/Philosophy)
DA Humanities/General Studies/Combined Studies
DB History
DC Archaeology
DD Religious Studies
DE Philosophy
Politics/Economics/Law/Social Sciences
EA Government/Politics
ED Social Sciences General/Combined
EE Social Studies

47
Area Studies/Cultural Studies/Languages/Literature
FB Culture/Gender/Folklore
FL Cultural/Area/Social/Diaspora Studies
Sport and leisure
Family Care/Personal Development/Personal Care and Appearance
HJ Personal Health/Fitness/Appearance
Sports Games and Recreation
MA Sports Studies/Combined Sports
MB Air Sports
MC Water Sports
MD Athletics Gymnastics and Combat Sports
ME Wheeled Sports
MF Winter Sports
MG Ball and Related Games
MH Country/Animal Sports
MJ Indoor Games
Catering/Food/Leisure Services/Tourism
NL Leisure/Sports Facilities Work
NM Country Leisure Facilities Work
NN Arts/Culture/Heritage Administration
Special Programmes
Family Care/Personal Development/Personal Care and Appearance
HB Self-Development
HD Continuing Education (basic skills)
HG Disabled People: Skills/Facilities

48
Annex F: Data selection
Data relate only to courses that are fundable by the SFC and that finish within the academic session.
1. Courses than span academic sessions are excluded as the student will not complete their programme until academic session 2011-12 and no result is available in session 2010-11.
Source of finance of course equals (5, 9) and course end date <=’31JUL2011’d
2. Remove student records where the student enrolled but did not
attend, student has deceased or programmes where the student mode of attendance is flexible over more than a year and there is no result available in this academic session.
Exclude student outcomes (01, 16 and 21)
3. Remove transferred students who transfer courses before the
required funding date and students who meet the funding date but no funding is claimed.
Exclude if student outcome is 5 and student end date is before the 25 per cent required date or student end date is after required date but no funding has been claimed.
4. Non-recognised programmes are also removed as most of this data is
not assessed or comparable across the sector.
Exclude Qualification aim ‘PB’
5. PIs by age, gender, level and HMIE subject area also excluded courses where the duration of the course is less than 160 hours. Exclude enrolments where the student SUMs <4
6. Exclude students who achieve the 25 per cent cut-off date for funding, but have no SUMs.

49
Annex G: Tariff Score
Unified Points Score Scale The Unified Points Score Scale is an extended version of the Universities and Colleges Admissions Service (UCAS) Scottish Tariff points system. A full list of courses, awards and corresponding tariff points is listed below. The tariff score of a pupil is calculated by simply adding together all the tariff points accumulated from all the different course levels and awards he/she attains. The relativities between types of certification are taken from the principle that the value of an A award at one level is as close as possible to, but lower than, the value of a C award at the next level above. For example, a pupil getting five Standard Grades would collect between 40 and 190 points, based on lowest to highest possible results. Five Standard Grades with the highest result along with three Highers and one Advanced Higher at A, would amount to 526 points. Course Level Award Tariff
Points
Advanced Higher A 120 CSYS A 120 Advanced Higher B 100 CSYS B 100 Advanced Higher C 80 CSYS C 80 Advanced Higher D 72 Higher A 72 Higher B 60 Higher C 48 Higher D 42 Intermediate 2 A 42 Standard Grade 1 38 Intermediate 2 B 35 Intermediate 2 C 28 Standard Grade 2 28 Intermediate 2 D 24 Intermediate 1 A 24 Standard Grade 3 22 Intermediate 1 B 20 Advanced Higher Unit 20 Intermediate 1 C 16 Standard Grade 4 16

50
Higher Unit 12 Intermediate 1 D 12 Standard Grade 5 11 Standard Grade 6 8 Access 3 Cluster 8 Intermediate 2 Unit 7 Unallocated Unit (NC Module) 6 Unallocated Unit (Short Course) 6 Intermediate 1 Unit 4 Standard Grade 7 3 Access 3 Unit 2 Access 2 Unit 1 Baccalaureate Interdisciplinary project 1 60 Baccalaureate Interdisciplinary project 2 50 Baccalaureate Interdisciplinary project 3 40


