Collecting Parcel Data from Assessors - IAAO Home Pageiaao.org/uploads/FE_April_Parcel_Data.pdf ·...
9
Fair & Equitable • April 2013 3 A ssessors and assessment offices collect and maintain data about the value, location, and other characteris- tics of land parcels, primarily for taxation purposes. Tax or real estate parcel data refer to a combination of both spatial and nonspatial attribute files, which are often the best representation of land ownership in a local jurisdiction. As with many locally maintained data sets, the content, struc- ture, currency, and coverage of parcel data sets vary signifi- cantly across jurisdictions, creating a challenge to develop a standardized national data set, even for core attributes. This article describes recent exploratory research by the U.S. Department of Housing and Urban Development (HUD) to develop a standardized database of parcel in- formation collected directly from the most authoritative sources—local counties. In all domains, the increasing reuse of data collected for one purpose to serve other uses poses challenges and responsibilities for both producers and users. As such, this study set out to better understand the costs, limitations, barriers, and alternative vehicles for developing and maintaining a national parcel data set to better meet HUD’s mission as well as exploring possibilities for innovative public–private partnerships that would meet the public domain and data needs of other governmental entities and the public. At the same time, lessons learned from this phase of the project may provide IAAO with some interesting insights from a data consumer’s perspective as it explores updates to its data standards. Project Background There are many uses and applications for current, reliable information on land ownership. HUD is one of many fed- eral agencies (e.g., Bureau of Land Management, Federal Emergency Management Agency, and the U.S. Census Bu- reau, to name a few) that benefit from detailed, reliable, and updated data on land ownership and property transac- tions to make informed decisions and to address emerging issues. State-level activities often cited as benefiting from these data include road and right-of-way management, emergency response, property value equalization, natural resource management, and state lands management. Many cross-county activities also benefit from this information, such as localized weather event response, regional plan- ning, and economic development. Real-time information about a community’s housing stock can help gauge the level of neighborhood distress, identify the underlying causes of the distress, and support the development of appropriate policy responses. Parcel- level information, that is, geographically referenced infor- mation about the ownership, rights, and interests of land parcels, can also be used to evaluate existing programs designed to stabilize communities suffering from foreclo- sures, lack of affordable housing, or natural disasters. By aggregating and maintaining a national land parcel data set, HUD could accomplish many goals, such as readily describing neighborhood changes due to HUD funding, developing measures of sustainability, or accelerating and better targeting the federal response to natural disasters. In this study the term parcel data refers to a spatial rep- resentation of land ownership, often represented as a tax parcel in local government data sets, along with a defined set of attributes about the parcels. This study acknowledges Collecting Parcel Data from Assessors Jon Sperling , Ph.D., and Nancy von Meyer, Ph.D. The statements made or opinions expressed by authors in Fair & Equitable do not necessarily represent a policy position of the International Association of Assessing Officers. This article is based on a research project conducted by Abt Associates Inc. and Fairview Industries for the U.S. Department of Housing and Urban Development (HUD), Office of Policy Development and Research (PD&R). The full report on this research project can be found at http://www.huduser.org/Publications/pdf/feasibility_nat_db.pdf.
Transcript of Collecting Parcel Data from Assessors - IAAO Home Pageiaao.org/uploads/FE_April_Parcel_Data.pdf ·...

Fair & Equitable • April 2013 3
Assessors and assessment offices collect and maintain data about the value, location, and other characteris-tics of land parcels, primarily for taxation purposes.
Tax or real estate parcel data refer to a combination of both spatial and nonspatial attribute files, which are often the best representation of land ownership in a local jurisdiction. As with many locally maintained data sets, the content, struc-ture, currency, and coverage of parcel data sets vary signifi-cantly across jurisdictions, creating a challenge to develop a standardized national data set, even for core attributes.
This article describes recent exploratory research by the U.S. Department of Housing and Urban Development (HUD) to develop a standardized database of parcel in-formation collected directly from the most authoritative sources—local counties. In all domains, the increasing reuse of data collected for one purpose to serve other uses poses challenges and responsibilities for both producers and users. As such, this study set out to better understand the costs, limitations, barriers, and alternative vehicles for developing and maintaining a national parcel data set to better meet HUD’s mission as well as exploring possibilities for innovative public–private partnerships that would meet the public domain and data needs of other governmental entities and the public. At the same time, lessons learned from this phase of the project may provide IAAO with some interesting insights from a data consumer’s perspective as it explores updates to its data standards.
Project BackgroundThere are many uses and applications for current, reliable information on land ownership. HUD is one of many fed-
eral agencies (e.g., Bureau of Land Management, Federal Emergency Management Agency, and the U.S. Census Bu-reau, to name a few) that benefit from detailed, reliable, and updated data on land ownership and property transac-tions to make informed decisions and to address emerging issues. State-level activities often cited as benefiting from these data include road and right-of-way management, emergency response, property value equalization, natural resource management, and state lands management. Many cross-county activities also benefit from this information, such as localized weather event response, regional plan-ning, and economic development.
Real-time information about a community’s housing stock can help gauge the level of neighborhood distress, identify the underlying causes of the distress, and support the development of appropriate policy responses. Parcel-level information, that is, geographically referenced infor-mation about the ownership, rights, and interests of land parcels, can also be used to evaluate existing programs designed to stabilize communities suffering from foreclo-sures, lack of affordable housing, or natural disasters. By aggregating and maintaining a national land parcel data set, HUD could accomplish many goals, such as readily describing neighborhood changes due to HUD funding, developing measures of sustainability, or accelerating and better targeting the federal response to natural disasters.
In this study the term parcel data refers to a spatial rep-resentation of land ownership, often represented as a tax parcel in local government data sets, along with a defined set of attributes about the parcels. This study acknowledges
Collecting Parcel Data from AssessorsJon Sperling , Ph.D., and Nancy von Meyer, Ph.D.
The statements made or opinions expressed by authors in Fair & Equitable do not necessarily represent a policy position of the International Association of Assessing Officers. This article is based on a research project conducted by Abt Associates Inc. and Fairview Industries for the U.S. Department of Housing and Urban Development (HUD), Office of Policy Development and Research (PD&R). The full report on this research project can be found at http://www.huduser.org/Publications/pdf/feasibility_nat_db.pdf.
4 Fair & Equitable • April 2013
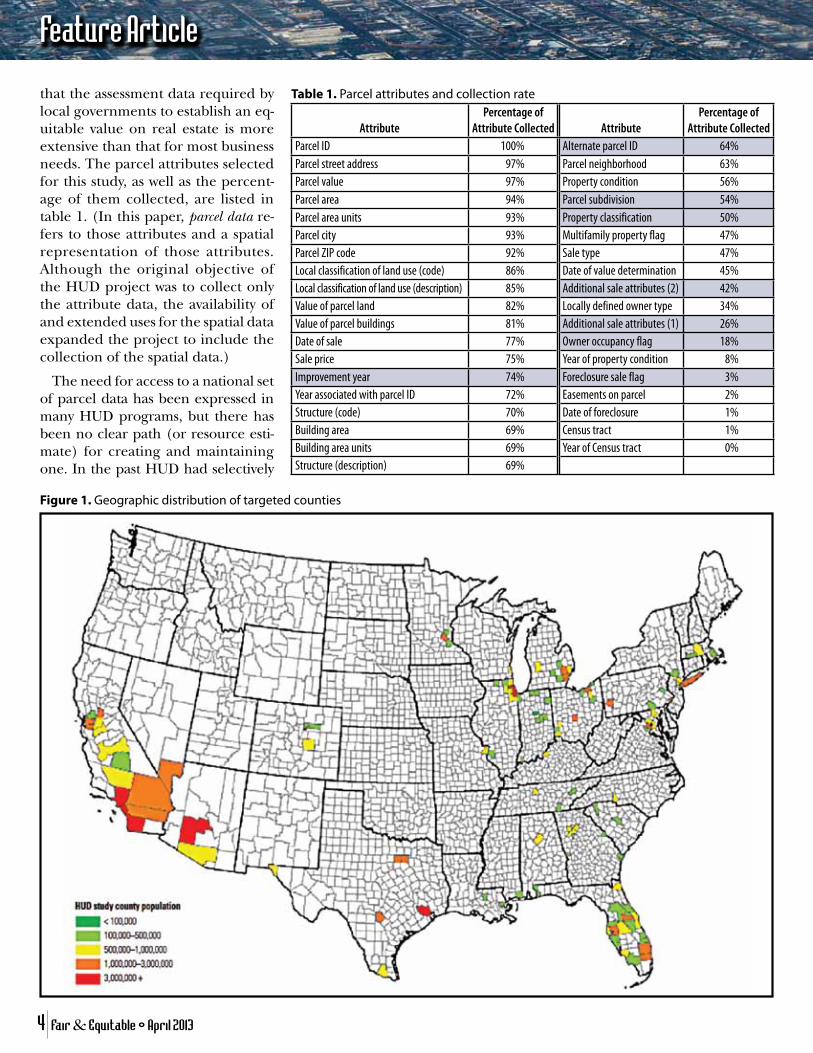
that the assessment data required by local governments to establish an eq-uitable value on real estate is more extensive than that for most business needs. The parcel attributes selected for this study, as well as the percent-age of them collected, are listed in table 1. (In this paper, parcel data re-fers to those attributes and a spatial representation of those attributes. Although the original objective of the HUD project was to collect only the attribute data, the availability of and extended uses for the spatial data expanded the project to include the collection of the spatial data.)
The need for access to a national set of parcel data has been expressed in many HUD programs, but there has been no clear path (or resource esti-mate) for creating and maintaining one. In the past HUD had selectively
Feature Article
Table 1. Parcel attributes and collection rate
AttributePercentage of
Attribute Collected AttributePercentage of
Attribute CollectedParcel ID 100% Alternate parcel ID 64%Parcel street address 97% Parcel neighborhood 63%Parcel value 97% Property condition 56%Parcel area 94% Parcel subdivision 54%Parcel area units 93% Property classification 50%Parcel city 93% Multifamily property flag 47%Parcel ZIP code 92% Sale type 47%Local classification of land use (code) 86% Date of value determination 45%Local classification of land use (description) 85% Additional sale attributes (2) 42%Value of parcel land 82% Locally defined owner type 34%Value of parcel buildings 81% Additional sale attributes (1) 26%Date of sale 77% Owner occupancy flag 18%Sale price 75% Year of property condition 8%Improvement year 74% Foreclosure sale flag 3%Year associated with parcel ID 72% Easements on parcel 2%Structure (code) 70% Date of foreclosure 1%Building area 69% Census tract 1%Building area units 69% Year of Census tract 0%Structure (description) 69%
Figure 1. Geographic distribution of targeted counties

Fair & Equitable • April 2013 5
acquired or purchased assessment files and, in some cases, parcel data sets but had not completed a systematic data collection process across many jurisdic-tions to ascertain what resources would be required to develop and sustain a national parcel data set.
Locally collected and maintained parcel data are acknowledged as the most authoritative source. However, assembling and standardizing parcel-level data from individual states and counties is more complicated than simply contacting each state or county and arranging for a data transfer. Some of the challenges include (1) an understanding of data availability and completeness, (2) the willingness of local governments to provide data, and (3) the varying content, format, and structure of data among counties.
Some counties simply do not have data available in electronic format or may be in the process of constructing databases and parcel maps. For those counties that have at least some data in electronic format, identifying which of-fice holds the data, gathering informa-tion about the data’s collection (e.g., currency, basis of values), and deter-mining the robustness of the desired attributes require time and resources.
Despite the challenges, the HUD research study sought to quantify the resources and estimated levels of ef-fort for an ongoing collection and standardization of parcel data from a selected set of counties that received funding under the Neighborhood Stabilization Program (NSP). NSP is based on the Community Devel-opment Block Grant (CDBG) and designed to help stabilize communi-ties suffering from high numbers of foreclosures and abandoned prop-erties. More information about this program is available on the HUD Web site (www.hud.gov). The study also extrapolated national estimates based on the experience with these counties and other data collection
efforts. Results of the national parcel feasibility component of this report will be presented at the IAAO Annual Conference in August 2013.
Targeted CountiesThe table at the end of this article lists the 127 targeted “counties” (Bal-timore City and New York City were classified as counties for this project), and figure 1 displays their geographic distribution. This effort set out to bet-ter understand the resources required to identify the appropriate data sourc-es in each community, assemble the data and metadata, and standardize the data in a common format. Key parcel attributes included property address, assessed value, land use, sale price, and sales history.
Table 2 compares the relative popula-tion sizes of the 127 targeted counties with all 3,221 U.S. counties or county equivalents, including the District of Columbia and Puerto Rico. Given the nature of the project, the selected counties tended to have relatively large populations: the median population of the targeted counties is approximately 621,000, compared to the national me-dian of about 26,000. The U.S. median values count each of the five New York City boroughs as a separate county.
Project DesignThe plan for the data collection ef-fort included five core activities to be performed in each county:
• Contacts. Local government asses-sor contacts were acquired for the
127 counties. Introductory letters from HUD were sent to each county in August 2011, with a brief explanation of the purpose of the data request. Calls were made to confirm the primary contact information and begin the process of soliciting data and conducting interviews to support the feasibility analysis. Web sites were also reviewed to determine whether requisite data were pub-licly available for download.
• Data Collection Requirements. Where needed, discussions were initiated to sign memoranda of under-standing (MOUs) with the coun-ties, principally on agreements regarding use limitations of their data. A budget was allocated to pay for fees from the counties charging for data purchase. When counties had fees, they were asked whether the fees could be waived given the federal request. HUD also developed a standard MOU to address data-sharing concerns. In instances in which a county required its own MOU, the team provided summaries to HUD of the key concerns in relation to HUD’s terms for approval.
• Data Collection. Depending on their internal processes and re-sources, counties that agreed to share data delivered their data sets through various electronic channels (download, internal or external ftp, CD) and provided
Table 2. Comparison of population sizes of targeted counties with all U.S. counties
Population RangeNumber of
Target CountiesPercentage of
TotalNumber of
U.S. CountiesPercentage of
Total<30,000 0 0% 1,747 54%30,001–100,000 2 2% 891 28%100,001–300,000 19 15% 371 12%300,001–500,000 31 24% 84 3%500,001–1,000,000 44 35% 89 3%1,000,001–3,000,000 25 20% 33 1%>3,000,001 6 5% 6 < 1%Total 127 100% 3,221 100%
6 Fair & Equitable • April 2013
Feature Article
any existing data documentation. Subject matter experts developed lookup tables to correspond each county data set with the HUD-selected attributes to expedite later standardization.
• Interviews. During the data col-lection process, interviews were conducted with appropriate personnel to get an indication of future data collection on a more sustainable basis. For example, does the assessor an-ticipate changes in the public records policy or the launch of a new Web service? Informal notes were taken on progress being made, the number of contacts needed, barriers to acquisition, and the date of acquisition. The interviews, informal notes, and acquisition and processing re-sults were documented and used to populate a set of resource measures to evaluate the cost of acquisition and future costs for follow-up acquisitions. This in-formation was later used to help predict the resources needed to acquire data from non-project counties.
• Standardization. Each county’s data set was converted to a stan-dardized file format based on the national cadastral standard with attributes added to meet HUD program needs. SAS software was used to convert the data into a standard file format.
ContactsThe directors of assessment offices
in all 127 counties were sent letters and then called to acquire a primary contact for the acquisition of parcel data. Although there may be a num-ber of reasons for the difficulties in contacting some of the counties, the number of calls provides a measure of the readiness and willingness of a local governments to provide data. Table 3 illustrates the number of calls that
were made after the initial letters were sent. Data from 25 counties were pub-licly available, so no contact for data collection was needed. The majority of counties provided a contact within two to three calls, while a substantial number required as many as six or more calls. Note that for a multiyear collection effort this is a one-time cost, because in future collections the correct contact will be known. We ac-knowledge that turnover and changes occur in assessment offices, but having prior contact with the correct office and position reduces the time to iden-tify the replacement or new contact in future collection efforts.
Table 3. Number of calls to county contacts*
Number of Calls To Identify Primary Contact Number of Counties
1 172 453 164 45 76+ 13
*N = 102 counties. Does not include counties for which data were publicly available for collection.
Data Collection RequirementsThe collection effort resulted in the acquisition of data from 109 of the originally requested 127 counties. Table 4 summarizes the response rate. Data from 80 of the 109 counties were either publicly available or read-ily provided to us. Twenty-one coun-ties required purchase fees less than $2,000, including counties that re-duced standard fees for the study. For five counties, either they approved the HUD MOU terms or HUD approved their terms. Finally, three counties had both fee and MOU requirements that were successfully transacted.
For various reasons data from 18 of the 127 selected counties were not collected. Three counties had no electronically standardized data within the county, and the collec-
tion and maintenance of the data in two counties remain in the hands of municipalities and townships. These constraints exist in Massachusetts and, to a lesser extent, in Michigan, Illi-nois, and New Jersey. All parcel data in Massachusetts were collected and maintained at the municipal or town-ship level at the time of collection. In one case (Worcester), the parcel data were collected and acquired from the primary municipality in the county directly. Several counties in Michigan and Illinois faced similar conditions but had GIS data at the county level.
Fees in three counties were exces-sive (from $34,000 to $1,000,000). The basis for these charges was not determined; however, many of these fees are established by county ordi-nance. A brief review of a few of the ordinances indicated that cost of original data automation, software
Table 4. Data collection response rate and requirements
CategoryNumber of
CountiesPercentage of Counties
Responded Readilya
Additional Negotiation (no fees or MOU)Fees OnlyMOU Only (HUD or County)b
Fees and MOUAcquired (Original 127)
4931
2153
109
39%24%
17%4%2%
88%Fees Rejected by HUDMOU Rejected by HUDData not AvailableNonresponsive Countiesb
Not Acquired (Original 127)
3159
18
2%1%4%7%
14%Additional Counties Acquiredc
278 NA
a Includes publicly accessible downloads and non-accessible downloads that were readily provided to the researchers.b Two counties signed MOU but did not provide data during the extended collection time frame. These are listed as nonresponsive.c The additional counties include many counties with smaller populations because these were included in the statewide collections. These collections were important factor in extrapolating to the national estimates.

Fair & Equitable • April 2013 7
purchase and maintenance, and data maintenance are often factored into the higher fee schedules. One county required a data-sharing agreement whose terms exceeded those allowed by the HUD-approved template. Two other counties formalized MOUs with HUD but did not deliver data. Finally, seven either did not respond to any of the attempts to discuss data collection or were not able to coordinate data collection for a variety of reasons.
Freedom of information (FOI) requests were not pursued in this study. These processes typically take a longer time than the project had to complete, and one intent of the study was to determine how much data were readily available and could be shared either publicly or with government-to-government data sharing. The po-tential resources needed to complete an FOI request and the potential ad-verse relationship between HUD and the county that could develop from an FOI process also factored into the decision to not pursue this route for data collection.
Data CollectionAs stated earlier, parcel data are actu-ally a compilation of multiple data sets. For the purpose of this study, we were interested in the following data set types:
• Parcel Attribute Data. Data on the physical characteristics of parcels, ownership, and assessed values are commonly held by counties, and their collection typically is the charge of county assessors. Often, assessors refer to this as CAMA (computer-assisted mass apprais-al) data; the software has been in use since the 1970s to maintain assessment data in government agencies. The implementation of this software is significantly tailored to each jurisdiction’s individual attribute terminology, definitions, and data needs.
• Sales Data. Recent sales (including the names of involved parties and the price and date of the sale) are also commonly documented by counties. Counties in some states do not collect sales data, because they are considered to be private; these are referred to as nondisclo-sure states. Nondisclosure states (i.e., those that do not require collection of sales data) currently include Idaho, Indiana, Kansas, Mississippi, Missouri, Montana, New Mexico, North Dakota, South Dakota, Texas, Utah, and Wyoming. The prohibition ap-plies only to sales data, not to par-cel attributes or geography. The majority of jurisdictions, however, do collect this information in some way, though not necessarily through the assessment office.
• Parcel Geographic Data. The ge-ometry and location of parcels are critical identifiers both of the parcel and of other key parcel attributes (such as area). These data are commonly kept in geo-graphic information system (GIS) software, which is becoming an essential technology and can be found in almost all communities. As a rule of thumb, the minimal population of a community that can support this technology is estimated at 20,000 to 30,000.
• Historical Records. States usually mandate at least a three-year re-tention of tax records because of tax foreclosure time frames, though the trend is to keep re-cords longer.
Despite the high response rate, there were significant variations in the comprehensiveness of the collected data. HUD had originally requested a set of attributes based on the initial expectation that they could be col-lected. These attributes were then defined by categories that ranged
from highly likely to unattainable based on prior data collection experiences. Figure 2 shows the original expecta-tions for the availability of desired attributes. Two factors appeared to affect the likelihood of any single at-tribute being available: its importance in the assessment process and whether it had been requested previously and frequently by other consumers.
The actual collection rate of the attributes is shown in table 1. The shaded attributes were not in the original attribute list and were added through the collection process. For example, the attributes for the year an improvement was added, subdivision name, and property classification were not included in the initial list but were added once it became apparent these data were in many of the data sets and would be helpful for HUD analysis.
With only a few exceptions, the ac-tual availability of most of the desired attributes met expectations. The full report details the attribute collection and the expectations versus the actual result. Typically fields that related to assessment values and indicators of the parcel location were expected to be present and were present. In gen-eral, fields related to specific legal or financial conditions of property owners (such as liens, easements, and foreclosures) were not expected to be a part of or relevant to the assessment process, and this expectation proved correct. This information is often kept by different agencies, such as a sheriff’s office or local courthouse. Al-though this limitation was expected, it should be considered in the event that these attributes are desired in future data collection efforts.
Counties were often prepared to de-liver standard prepackaged data sets that often did not include all the attributes HUD needed (though they almost in-variably contained the most likely and likely attributes described earlier). For

8 Fair & Equitable • April 2013
this reason, negotiating and receiving the most appropriate and timely data sets from counties depended on the study team’s resources, the individual county’s resources, and the ability to effectively communicate which data sets contained which attributes.
InterviewsInterviews with structured responses were conducted to help determine the long-term sustainability of data collec-tion, expected long-term benefits, and potential impediments. While data were collected from 109 of the 127 tar-geted counties, the number of counties responding to the feasibility questions was much lower. Many counties simply provided data publicly (e.g., online), and staff was not available to respond to requests for interviews. Staff in other counties did not respond to either all or a portion of the feasibility questions. Counties that did not provide data were not interviewed.
One important lesson learned from the interviews was the importance of
the timing of the data request, that is, understanding the work cycle of the local assessment offices. Although schedules vary slightly from state to state, there are typically four peak pe-riods for local assessment staff: (1) the acquisition of the snapshot that will be used to create the certified roll; (2) the preliminary reports to the state (if re-quired) based on the certification; (3) notification of proposed tax rates to property owners and associated hear-ings and appeals from the assessment values; and (4) the production of the certified roll itself. Most counties ap-proach their major deadlines at the beginning of the year (January), the beginning of summer (June and July) and, most significantly, in the fall (Sep-tember through November) for notifi-cation and roll certification. The data collection for this project coincided with this final most intense assessment work cycle. The response rate may have been higher if data collection was un-dertaken at a different time.
This finding also speaks to the ca-pacity in many assessment offices. At peak times staff members are fully oc-cupied with assessment certified rolls, meaning there is no extra capacity in those time frames to accommodate an added task.
Data StandardizationAs IAAO updates its standards on as-sessment data and as more and more counties publish their data for public view and provide data downloads, the data standardization processes used in this project provide some interesting insight. While the full report details several data standardization issues, the more significant findings of interest to IAAO are discussed below.
The single greatest hurdle was the number of attributes with definitions that varied across the targeted counties and the extent of those variations. For this study, these limitations mean that any future analysis with the collected data can only be county-specific. Even if resources could be expended to acquire the full data documentation from each county and to perform additional analysis comparing the definitions, the counties will generally continue to apply their own definitions and data collection processes. In some cases the study also found variances from county to county in states that had statewide guidelines and standards for data collection and processing. This situation likely reflects localized conditions and situations as well as variations in software packages.
Because of the local variations, com-bining locally maintained data into a single data set (aggregation) poses many challenges for cross-county and cross-state standardization. The values within a county’s data set that match a prescribed list of attributes can be identified; those values can be referred to as that county’s attribute; and an attempt can be made to format the local content into a common and
Figure 2. Attribute collection expectations
Feature Article

Fair & Equitable • April 2013 9
consistent structure and appearance. However, any analysis or reporting that compares values across county boundaries would be exploratory at best and erroneous at worst.
Data standardization is always a dou-ble-edged sword. The data requester needs sufficient knowledge of the parcel data and the assessment needs that drive the parcel data collection to apply the data appropriately to a non-assessment problem. Parcel data producers, on the other hand, need to be aware of potential expanded uses of their data so that publication data sets could be generated to meet needs such as response to natural di-sasters and economic variations and the many other uses of parcel data.
One underlying challenge in the collection and standardization of local data is the differences in terminology and the need for the data requester to understand the nuances and varia-tions in the local terminology. Typi-cally the data requester is looking for a representation of land ownership with some essential attributes that describe the use, value, and other characteristics of the parcel. The lo-cal assessment office has to deal with many variations in how property is transferred (through estates, foreclo-sure, direct sale, family sale, and so on), many types of owners (trusts, es-tates, corporations, nonprofit entities, government agencies, individuals), and many types of sales and valuation considerations (locally assessment caps, homestead and veteran tax credits, and the like). That the local assessment office must accommodate these variations and that national stan-dardization must include a generaliza-tion of property characteristics create a disconnect in the communication.
On the data user side, the lessons learned from the standardization pro-cess included the following:
• Verify the type of roll (workingroll or certified roll) needed for the data request.
• Determine whether the mostcurrent data (a working roll product) or an annual report (a certified roll product) is needed for the project. Sometimes the an-nual report may be exactly what is needed even if it may not have the most current information.
• When data are received, checkfor repeated or duplicate parcel numbers, multiple or duplicate sales, and consistency of coded values and code descriptions in the raw data. With additional questions, duplication might be explained readily, beyond possible difference in rolls or other reasons that may appear to be common knowledge to the county assessor in question.
On the data producer side, there are some considerations that would help reduce confusion and make it easier for data requesters to use and apply the data more correctly and more uniformly:
• Verifythatallcodesinthecodedvalue fields have an associated explanation or code description. While past experience with these data may have led some counties to assume that this was common knowledge, variation in many of these codes between counties would suggest that there is much room for early clarification.
• Checkthattherecordcountsinall files match, particularly across rolls and GIS data and between parcel data and sales and address tables. Larger discrepancies be-tween counts could signify clear differences in the data in various data sets. Checking this ahead of time could reduce confusion by the customer.
• Verify that the format of datefields and date field structure is consistent in all records. In some cases transforming the na-tive database date field to a text field makes the date information easier for the data consumers.
• Checkcommentandnotefieldsfor content that might be missing from requested data fields. Often, counties may maintain additional comment or note fields in which the necessary attribute is either elaborated on or, in some cases, maintained. Over time, reducing the content in unstructured com-ment and note fields strengthens the overall data set and increases its usability by data consumers.
Perhaps most importantly, the stan-dardization efforts in this study con-firmed the fact that, regardless of the quantity of data collected, the data cannot be standardized in a way that allows for comparison and analysis across jurisdictional boundaries un-less there is a way to either normalize or ascertain the following:
• Thesamedefinitionforeachat-tribute holds across counties and is applied consistently during each county’s respective data collection.
• The data collection and entryprocesses are the same or at least consistent across counties.
• Thedataineachcountyareinter-nally valid (or that the process to confirm this is similar to that of other counties).
• Thedataarecollected(orcerti-fied) within the same time frame.
• Thedataaredocumentedinthesame manner, using the same definitions and nomenclature to ensure the common meaning.
ConclusionsThe results of this project identified authoritative sources and collected data and relevant documentation

10 Fair & Equitable • April 2013
from 109 of the originally targeted 127 counties, for an 86 percent response rate, at varying levels of comprehen-siveness.
If subsequent collection is done in these counties, the percentage of successfully collected data should in-crease, and the overall process for data collection and aggregation should im-prove. Despite the overall challenges in this initial collection, counties were for the most part willing and able to provide data to HUD. Several factors that contributed to this overall will-ingness were observed in this study, as follows:
• Resources. Although all organiza-tions are challenged for resourc-es, in general the larger the popu-lation being served, the greater the resources that are available. The 127 counties in this project are for the most part larger com-munities, so it is assumed that, relatively, these counties have the resources needed to support data sharing. These communities also tend to have more mature systems with GIS technology as well as the staffing resources necessary to coordinate with HUD agents.
• Culture of Sharing. The difference in the willingness to share data can be set by policy—as is the case in Florida, with its strong public records law, or in Maryland, with its access-for-fee policy. States without a specified policy have much greater variability among the counties. On the whole, as demonstrated by the acquisition of parcel data from 86 percent of the counties, local governments are willing to share data and, in most cases, with little or no fees (84 percent in our study). These observations are for government-to-government sharing and may not reflect the fees for other forms of sharing.
• Infrastructure for Sharing Data. For many organizations, data-sharing requests constitute an additional workload for staff who are al-ready busy. This situation is more pronounced with requests for elements that are not normally requested. Timing requests for in-formation during periods of low activity improves the likelihood of a more positive response from the source organization. Some organizations are prepared for these data requests, and proce-dures have been established to reduce the impact on the office workload regardless of the timing of the request.
• Mutual Benefit. Benefits to the county of sharing parcel data are typically indirect. Clearly articulating real benefits of data sharing to the data producer im-proves the responsiveness to data requests. As indicated by the re-sults of this project, counties are
more willing to share their data if they can justify the workload and are informed of the purpose and use of the data.
Moving forward, IAAO and national parcel data users should work togeth-er to clearly define and explain the mutual benefits. The data producers, most often the assessment office, and the data consumers need to have a full understanding of the mutual ben-efits to help identify and commit the resources necessary to make national parcel data a reality.
AcknowledgmentWe thank Abt Associates (http://www.abtassociates.com/), the lead firm on this project, and Carlos Martin, Abt Project Director. Smart Data Strate-gies conducted interviews and gath-ered data for this project. The opin-ions expressed in this article are those of the authors and do not necessarily reflect those of the U.S. Department of Housing and Urban Development.
Feature Article
Jon Sperling is a Senior Policy Analyst in the Of-fice of Policy, De-velopment and Research for the U.S. Department of Housing and Urban Development. Previously, Dr. Sperling led several geospa-tial data-sharing efforts at the U.S. Census Bureau, where he engaged with local, state, tribal, and federal government GIS and planning staff to build and digitally enhance the nation’s TIGER/Master Address File databases and on bureau-wide efforts to conceive, develop, and implement customer-driven, cross-program, cross-agency, integrated data access and dissemination capabilities. His current work and research interests include Web-based data access and
integration, geocoding and data quality, and the use of parcel data for urban and regional applications.
Nancy von Mey-er is vice presi-dent of Fairview I n d u s t r i e s i n Pendleton, South Carolina. Dr. von Meyer is a nation-ally recognized leader in land records and use of cadastral information for decision support. She has been at Fairview Industries since 1983 and has more than 25 years of GIS system design and implementation experience. Her efforts have been applied in the areas of wildland fire management, local land use planning and man-agement, energy, and economic analysis.

Fair & Equitable • April 2013 11
State County
Final Data Collection Status
(Reason)Fee Purchase Requirement
MOU Requirement (MOU Source)
Alabama Jefferson No data collected(high fee)
— —
Arizona MaricopaPima
CollectedCollected
——
——
California AlamedaContra CostaFresnoKernLos AngelesOrange
RiversideSacramentoSan BernardinoSan DiegoSan JoaquinSolanoStanislausTulare
CollectedCollectedCollectedCollectedCollectedNo data collected(high fee)CollectedCollectedCollectedCollectedCollectedCollectedCollectedCollected
$20———
$1,293—
——
$256$125—
$170——
——————
————————
Colorado AdamsDenverEl Paso
CollectedCollectedNo data collected(high requirements)
———
———
Florida BrevardBrowardCollierDuvalEscambiaHillsboroughLakeLeeManateeMarionMiami DadeOrange
CollectedCollectedCollectedCollectedCollectedCollectedCollectedCollectedCollectedCollectedCollectedCollected
————————————
————————————
OsceolaPalm BeachPascoPinellasPolkSarasotaSeminoleSt. LucieVolusia
CollectedCollectedCollectedCollectedCollectedCollectedCollectedCollectedCollected
—————————
—————————
Georgia Augusta-RichmondChathamClaytonCobbDeKalb
FultonGwinnettMuskogee
CollectedCollectedCollectedCollectedNo data collected(high requirements)CollectedCollectedNo data collected(nonresponsive)
$100$1,000$1,100
——
$25——
—————
——
Illinois Cook
DuPageKaneLakeMcHenrySt. ClairWillWinnebago
No data collected(nonresponsive)CollectedCollectedCollectedCollectedCollectedCollectedCollected
—
——$52
————
County
HUDCounty
——
County——
Indiana AllenDelawareElkhartHamiltonHowardLakeMadisonSt. JosephVanderburgh
CollectedCollectedCollectedCollectedCollectedCollectedCollectedCollectedCollected
—————————
—————————
Kentucky Louisville/Jefferson Collected $652 HUD
State County
Final Data Collection Status
(Reason)Fee Purchase Requirement
MOU Requirement (MOU Source)
Louisiana East Baton Rouge
Orleans
No data collected(unavailable)Collected
—
—
—
—Massachusetts Hampden
Plymouth
Worcester
No data collected(unavailable)No data collected(unavailable)City of Worcester data collected only
—
—
$150
—
—
—
Maryland Baltimore CityBaltimore CountyMontgomeryPrince Georges
CollectedCollectedCollectedCollected
—$350$350$350
————
Michigan GeneseeInghamKentMacomb
Oakland
WashtenawWayne
CollectedCollectedCollectedNo data collected(unavailable)No data collected(nonresponsive)CollectedNo data collected(nonresponsive)
—$100——
—
——
——
County—
—
——
Minnesota AnokaDakotaHennepin
CollectedCollectedCollected
———
——
CountyMissouri St. Louis Collected $15 —Mississippi Jackson Collected — —North Carolina Mecklenburg Collected — —New Jersey Bergen
Essex
HudsonPassaicUnion
CollectedNo data collected(unavailable)CollectedCollectedCollected
——
———
——
———
Nevada Clark Collected $200 —New York Nassau
New YorkOrangeSuffolk
No data collected(nonresponsive)CollectedCollectedNo data collected(nonresponsive)
—
———
—
———
Ohio ButlerCuyahogaFranklinHamiltonLakeLorainMontgomeryStarkSummit
CollectedCollectedCollectedCollectedCollectedCollectedCollectedCollectedCollected
—————————
—————————
Pennsylvania AlleghenyLehighPhiladelphiaYork
CollectedCollectedCollectedCollected
$104$1,000
$100$1,194
———
CountySouth Carolina Greenville
RichlandCollectedNo data collected(nonresponsive)
$500—
County—
Tennessee Davidson
HamiltonKnox
Shelby
No data collected(nonresponsive)CollectedNo data collected(high fee)Collected
—
——
—
—
——
—Texas Bexar
DallasEl PasoHarrisHidalgoTarrant
CollectedCollectedCollectedCollectedCollectedCollected
—————$62
——————
Virginia FairfaxPrince William
CollectedCollected
——
——
Wisconsin Milwaukee Collected — —
Table. Counties targeted for data collection in HUD study of parcel data (N = 127)