COFISA Biotechnology Foresight: 2 Western Cape Workshop Report
33
1 COFISA Biotechnology Foresight: 2 nd Western Cape Workshop Report 6 April 2009
Transcript of COFISA Biotechnology Foresight: 2 Western Cape Workshop Report

1
COFISA Biotechnology Foresight: 2nd Western Cape Workshop Report
6 April 2009

2
Table of Contents Table of Contents ............................................................................................................. 2 1 Introduction .............................................................................................................. 3 2 Background............................................................................................................... 3
2.1 Brief overview of COFISA............................................................................... 3 2.2 Process to date .................................................................................................. 4
3 Technology Road-Mapping...................................................................................... 5 3.1 Background....................................................................................................... 5 3.2 Stages of the TRM process............................................................................... 8
4 Outputs of the W Cape Workshop.......................................................................... 10 4.1 Prioritisation of Biotechnology Opportunities ............................................... 10 4.2 Group 1: Waste, Environmental and Marine Management........................... 12
4.2.1 Building the TRM................................................................................... 12 4.2.2 Opportunities for SMMEs ...................................................................... 21 4.2.3 Action Plans............................................................................................ 23
4.3 Group 2: Alternative Energy from Plants...................................................... 25 4.3.1 Building the TRM................................................................................... 25 4.3.2 Opportunities for SMMEs ...................................................................... 29 4.3.3 Action Plans............................................................................................ 29
Annex 1: Details of Participants..................................................................................... 31 Annex 2: Workshop Programme.................................................................................... 32

3
1 Introduction Biotechnology is one of the “grand challenge” areas that has been identified in the ten-year innovation plan published by the Department of Science and Technology (DST), and supported by Cabinet. Following on from previous successful provincial Foresight exercises in 2008, and in support of DST’s biotechnology “grand challenge”, the Cooperation Framework on Innovation Systems between Finland and South Africa (COFISA) decided to hold a biotechnology Foresight exercise for the Western Cape (and also in COFISA’s two other target provinces, the Eastern Cape and Gauteng) during late 2008 and early 2009. The objectives of this exercise were: ▪ To anticipate emerging areas of opportunity related to biotechnology, with a
particular focus on the W Cape; ▪ To support existing and encourage new biotechnology SMMEs in the W Cape.
The Foresight exercise included two two-day residential workshops. The first of these took place on 21st & 22nd October 2008 at the Devon Valley Hotel in Stellenbosch, while the second workshop took place on 25th & 26th February 2009 at the Laguna Beach Hotel, Milnerton. The details of the second workshop are covered in this report. See Annex 2 for the programme followed by the workshop.
2 Background
2.1 Brief overview of COFISA The introductory session began with Mrs Nirvashnee Seetal, the COFISA National Coordinator, providing an overview of the aims and objectives of the COFISA programme. COFISA is a programme that has been developed jointly by the Governments of South Africa, through DST, and Finland, through the Embassy of Finland in Pretoria. Its objective is to contribute to the enhanced effectiveness of the national, and particularly the provincial, systems of innovation contributing to economic growth and poverty alleviation. COFISA’s three pilot provinces are Gauteng, Eastern Cape and Western Cape. Why is Foresight Important to COFISA? ▪ Foresight is a good tool in helping to create commitment, enhance collaboration and
build common ground; ▪ Foresight promotes creative, proactive policies and strategies that respond in time,
learn in time and are able to adapt and evolve; ▪ The long time horizon used in the Foresight process neutralises contentious issues
thus facilitating cooperation between diverse actors as well as consensus building; and
▪ There are insufficient Foresight capabilities at national and provincial level. Through the Foresight processes, COFISA thus aims to achieve the following: ▪ Grow the understanding and awareness of Foresight; ▪ Facilitate the establishment of networks; ▪ Transfer knowledge and skills; ▪ Facilitate the initiation of relevant projects related to the Foresight exercises that may
be collaboratively implemented or driven by specific role-players e.g. SMMEs; and ▪ Feed into strategic processes at the national and provincial government levels.

4
2.2 Process to date Invitations to the first workshop Although numbers were limited, a wide range of participants was invited to the first workshop. They were identified through relevant organisations, and through peer nomination. First workshop proceedings1 The first workshop included the following main items: ▪ A slide presentation by Dr Sibongile Gumbi, based on the previously circulated
“Biotechnology Trends Analysis” document; ▪ Participants were then asked to join one of three working groups based on the
following sub-components of biotechnology: ▪ Food and Agriculture; ▪ Animal & Human Health; and ▪ Industrial Biotechnology, Environment and Natural Resources.
Each working group then used the rest of the first morning to add relevant knowledge within their component to the Biotechnology Trends Analysis, particularly related to current or emerging biotechnology activities in the W Cape.
▪ Then followed a slide presentation by Bob Day of three proto-scenarios for the W
Cape. This was based on a document that had been previously circulated: “Three Scenarios for the W Cape - 2030”;
▪ Participants used the remaining 1½ days to participate in Foresight activities
intended to convert these proto-scenarios into full Biotechnology Scenarios that were specific to the W Cape.
▪ Participants were first asked to join one of three different groups, this time each
based on one of the proto-scenarios. Each group then produced two levels of biotechnology Futures Wheels for their proto-scenario.
▪ Finally, based on the most important issues identified in their Futures Wheels, the
groups each wrote fairly detailed biotechnology proto-scenario fragments. Post first workshop Modifications were made to the Biotechnology Trends Analysis document, based on the inputs received during the workshop, and the revised document was distributed electronically amongst workshop participants for further feedback. A final COFISA Biotechnology Trends Analysis document will be produced for general distribution once this feedback has been received and relevant material added to the document. The biotechnology proto-scenario fragments were worked into the original proto-scenarios to produce preliminary drafts of three W Cape Biotechnology Scenarios. These draft scenarios were circulated electronically amongst the workshop participants
▪ 1 A full report of the 1st workshop is available online at www.cofisa.org.za

5
and feedback was solicited. The inputs are being incorporated into each draft scenario to produce three W Cape Biotechnology Scenarios. The second workshop The second workshop built on the outputs of the first workshop. Most of the participants from the first workshop were invited to the second workshop. However, given the strong emphasis on technology road-mapping in the second workshop, additional participants from the W Cape that had research and technology expertise were invited, and particularly those with expertise in the biotechnology opportunity areas identified during the first workshop. The full list of participants in the second workshop is provided in Annex 1. During the second workshop two technology roadmaps were produced, opportunities for SMMEs were identified, and action plans were drawn up. This process and its background are set out in more detail in the next section.
3 Technology Road-Mapping
3.1 Background This section provides a brief overview of the main aspects of Technology Road-Maps (TRMs). For more in depth material on several aspects of TRM, the following references are recommended: ▪ “Technology Roadmapping: a Strategy for Success”: Industry Canada, 2000. Available
online at: http://strategis.ic.gc.ca/trm
▪ “Technology Roadmapping: a Guide for Government Employees”: Industry Canada, 2002. Available online at: http://strategis.ic.gc.ca/trm
▪ “Scenario-based Roadmapping – a Conceptual View”: F Lizaso & G Reger, EU-US Seminar: New Technology Foresight, Forecasting & Assessment Methods; Seville 13-14 May, 2004. Available online at: http://forera.jrc.ec.europa.eu/fta/fta2004.html
▪ “Technology roadmapping in review: A tool for making sustainable new product development decisions”: I J Petrick & A E Echols, Technological Forecasting & Social Change, 71, 81–100, 2004. Available online at: http://www.sciencedirect.com
What is Technology Road-Mapping? TRM, which dates from the late 1980s, brings stakeholders together in a far-reaching planning process, opening the door to collaborative R&D: ▪ It can play a key role in enhancing innovation. ▪ It does not predict future breakthroughs in science. ▪ Rather, it does forecast and articulate the elements required to address future
technological needs. ▪ It describes a given future, based on the shared vision of the people developing it,
and provides a technology-oriented framework for making that future happen. ▪ It offers only a high level strategy for developing the technologies. A more detailed
plan is then needed to specify the actual projects and activities required. TRM can help organisations at any level (government, corporate, industry/discipline, cross-industry/national or international) to collaboratively identify future needs, to then map them into process/product/service technology alternatives, and then to develop

6
plans to ensure that the required technologies, skills and resources will be available when needed. TRM facilitates better decision making by identifying science and technology (S&T) areas of high potential or strategic value, and also technology gaps, when these are not clear. It can aid in deciding: ▪ which technology alternative to pursue; ▪ how and when a technology will be available; ▪ when it will be necessary to coordinate the development or acquisition of multiple
technologies.
Multi-layer TRMs are the most common (see Figure 1 above): ▪ The top layer refers to the purpose that is driving the roadmap (‘know-why’). ▪ The bottom two layers relate to the resources, the science and technology (i.e. the
“know-how”) that will be deployed to address the objectives. ▪ The middle layer provides a bridging/delivery mechanism between the purpose and
the resources layers (‘know-what’). It ordinarily focuses on product development, but services, capabilities, risks or opportunities are also appropriate for the middle layer, to understand how technology can be delivered to provide benefits to stakeholders.
What types of technology are important for this process? Disruptive Technology (DT): ▪ This is significantly superior and different from current technologies (also termed
“revolutionary” by some). A DT both changes the market and how a problem is solved. The technology’s new capabilities alter customers’ expectations and requirements. E.g.: telephone, motor car, Internet.

7
▪ Alternative definition: A DT falls short of satisfying one or more current customer requirements, BUT it has such a rapid trajectory of improvement that it will soon overcome this drawback. In most cases, the DT eventually replaces the existing technology. E.g.: flash memory.
Emerging Technology (ET): ▪ A new technology in early development and with promising broad application, but its
uses and benefits are not yet fully understood. ▪ Investments in ETs tend to be undertaken to obtain good early positioning in a
technology that could quickly gain dominance, rather than for short-term return on investment.
▪ The development of an ET is too premature for the creation of specific products. Instead, ET development creates core capabilities for the sponsors.
▪ Examples of ETs are lasers and nanotechnology. Types of TRM There are several types of TRM, each of which share several common elements but also differ significantly. The types of roadmaps most commonly in use today are: ▪ Product TRMs: used by companies to identify the technical processes for
development of a specific product or service; ▪ Corporate TRMs: developed internally by a single company/university/laboratory as
part of their technology planning; ▪ Industry TRMs: used to assess and extrapolate the direction of needs within an area
of technology, and then identify R&D strategies to meet those needs; ▪ Emerging TRMs: specifying the timeline and expected performance for a
technology currently in early development, and not driven by specific product requirements.
Following general guidelines, it is recommended that a company, industry, organisation, or government should create its own type of roadmap by adapting (one or more of) the above types to meet their particular needs or challenges. What type of TRM best suits the needs of the COFISA biotechnology Foresight process? The Product TRM and Corporate TRM models focus typically on incremental technologies, which has proven a useful approach for the majority of applications in the developed world. However, given our focus on 2030 for a very broad technology area with comparatively little established capacity and capability, particularly in the private sector, we need to identify and emphasise all possibilities for: ▪ Emerging Technologies, and ▪ Disruptive Technologies. The Industry TRM and Emerging TRM models are therefore more suited to our purpose. Rather than trying to choose between these two, a combined model was used: “Emerging Industry TRM”, as depicted in the following diagram.

8
2010 2020 2030
Solution/Market
Purpose“Know Why”
S1
M1S2
Bridging“Know What”
Delivery, Capability,System, Service
Br1Br2
Br3
Br4
Br5
Resources“Know How”
Timing“Know When”
Technology,Skills
R&D Activities,STI
T1T2
T3
T4
T5
RD1 RD2
RD3
RD4 RD5
RD6
2010 2020 2030
Solution/Market
Purpose“Know Why”
S1
M1S2
Bridging“Know What”
Delivery, Capability,System, Service
Br1Br2
Br3
Br4
Br5
Resources“Know How”
Timing“Know When”
Technology,Skills
R&D Activities,STI
T1T2
T3
T4
T5
RD1 RD2
RD3
RD4 RD5
RD6
3.2 Stages of the TRM process The primary aims of the second provincial biotechnology Foresight workshop were to create biotechnology roadmaps for several areas of particular promise in the W Cape, and then to use those roadmaps to identify related opportunities for SMMEs, and to develop preliminary action plans. The details of the programme used in the workshop are provided in Annex 2. The first main activity of the workshop participants was to prioritise biotechnology areas of particular long term promise for the W Cape. This was achieved in a plenary session, based on the ten biotechnology opportunities that emerged from the biotechnology 2030 proto-scenario material created during the 1st workshop and the post workshop electronic interactions. The participants selected their two top priority opportunities from the full list (see section 4.1). The participants were then divided into two working groups, each tasked with developing a TRM for one of the top priority opportunities during the remainder of the workshop. Developing the TRMs: As described in section 3.1, TRMs are fairly complex tools, and hence their development needs hard work and careful management. The following five processes were carried out by each working group in the construction of their TRM:
▪ Futures Wheel: The working group’s chosen biotechnology opportunity was used as the basis for a 2030 Futures Wheel, where each participant was encouraged to “dump” their ideas, no matter how “off the wall” (see sections 4.2.1 and 4.3.1).
▪ Categorisation and prioritisation: Next, the working group members were asked to categorise each “bubble” in their 2030 Futures Wheel by inserting them into a Categorisation and Prioritisation Table under the four main headers that matched the TRM rows, i.e.: Purpose, Bridging, Technology, and R&D (see the relevant Categorisation and Prioritisation Table in sections 4.2.1 and 4.3.1). Then they were asked to use their judgement to prioritise these issues and select a subset that would form the basis for the TRM. The first draft of the TRM could now be started, where each issue from the subset was inserted as a node in the matching row of the TRM, but at the 2030 time marker. Each node was marked with a simple identifier label (e.g. T1, B3), with a matching full description captured in supplementary text.

9
▪ Identifying nodes: The next phase of the development of the TRM was for each group to work backwards in time (from 2030) along each TRM row, identifying the missing nodes needed to ensure that each of the 2030 nodes could be realised. Some of these new nodes might be in the same row, but (several) others were likely to be in one of the other three rows. Since TRMs are tools intended to handle uncertainty and complexity, it was particularly important at this stage to include a node wherever complexity/uncertainty was high. In other words, do not avoid difficult issues, but rather confront them!
▪ Identifying links: When the first attempt at filling in the nodes for all four rows was complete (although this was an iterative process, so that new nodes and links could be added at any stage), each group next worked backwards from 2030 along each TRM row, identifying all important links between each node and any of the other nodes, whether in this or other rows. Each link was marked with a simple identifier label (e.g. P1 – B6), with a matching full description listed in supplementary text.
▪ Criteria and attributes: Finally, additional criteria and attributes related to each and any of the nodes and links in the TRM were then added under the appropriate lists in the supplementary text. This additional information is most valuable and important for the nodes and links with the highest levels of uncertainty or complexity.
Although the above five steps have been presented as a linear processes, in reality they are best performed as iterative cycles, where the group improves on its earlier material with each iteration. Hence, before they are comfortable with the output, groups normally produce more than one draft of a TRM. The following diagram shows a typical example of an early draft of a W Cape TRM.

10
In effect, TRMs are dynamic tools – they are always a work in progress, rather than a finished product. The final versions of the TRMs produced by the two groups from the W Cape can be seen in sections 4.2.1 and 4.3.1. Developing the other outputs: Once each group had developed their TRM for their chosen biotechnology opportunity, they used it to perform three further tasks: ▪ Identifying opportunities for SMMEs: The group revisited each node and link (and
even attribute) across the 20 year time span of their TRM to identify areas where either current SMMEs could be encouraged to play a significant role, or new SMMEs would need to be established to fulfil or enhance the aims of the TRM (see sections 4.2.2 and 4.3.2).
▪ Action plans to “kick-start” their TRM: The group next focused on the first 2½ years of the TRM, and identified the essential actions that were needed to kick-start the TRM. In particular, all funding issues were considered, but then the group was encouraged to move on to other essential activities based on the assumption that the funding had indeed been secured (see sections 4.2.3 and 4.3.3).
▪ Action plans to “kick-start” the related SMMEs: Finally, the group investigated the early actions needed to implement all aspects of the TRM in the first 2½ years, as well as a complementary action plan to identify as many opportunities as possible for new and established SMMEs (see sections 4.2.3 and 4.3.3).
In practice, there were small variations in the processes followed by each group, with corresponding small variations in their outputs.
4 Outputs of the W Cape Workshop Based on the processes described in section 3.2 above, the workshop resulted in the following outputs.
4.1 Prioritisation of Biotechnology Opportunities In a plenary session, the participants voted to choose their top two priorities from the ten biotechnology opportunities that emerged from the biotechnology proto-scenario material created during the 1st workshop and the post workshop electronic interactions. These are shown in the following slide, with the opportunities that were chosen as priorities highlighted in red and green:
• Biomaterials "cluster" (emphasis on bionics)• GM – many aspects (from indigenous sources to bio-re fineries)• Advanced food biotechnology (natural, organic)• Health tourism (including Athletics Health Hub & He althy
Population)• Bio-ICTs (including bio-informatics, and "MoBiol")• Revolutionary learning + biotechnology = “unique aw areness”• Marine equity, environmentalism and economy• Waste management, Recycling, and Bio-remediation (U rban,
Rural & Marine)• Advanced water management (environmentally clean)
• Transparent, open bio-ethics zone

11
Thus the W Cape participants chose to focus on the following two priorities: ▪ Waste, Environmental and Marine Management; ▪ GM, organic, indigenous and food biotechnology. Two break-away working groups were established via a process where each participant chose which of the above priority opportunity areas most closely matched their expertise and interest. Each of these working groups was then tasked for the remainder of the workshop with developing and building a TRM for their chosen biotechnology opportunity area, and putting together the associated action plans. The outputs from the two working groups are presented in the sections below. In the case of the second group, which started with a focus on GM, organic, indigenous and food biotechnology, in the course of their work they narrowed their focus to: ▪ Alternative Energy from Plants. For convenience, this latter title is used when referring to their outputs below.

12
4.2 Group 1: Waste, Environmental and Marine Management
4.2.1 Building the TRM Futures wheel for Waste, Environmental and Marine Management The Futures Wheel for Waste, Environmental and Marine Management is partitioned into two for reasons of space. It is in essence one FW.

13

14
Final TRM for Waste, Environmental and Marine Management
TRM Key Purpose layer P1 No Waste by Design
▪ 100% degradable ▪ 0% waste packaging ▪ No waste by design ▪ Cheap to produce ▪ Bioprocessable packaging ▪ Packaging designed to nourish the soil – act as a fertiliser when disposed of
P2 Clean Air ▪ Clean air inside buildings ▪ Industrial pollution prevented

15
▪ Bugs that clean air inside air-con systems ▪ More industrially focussed
P3 Clean Water ▪ Good supply of fresh water – potable ▪ Adequate infrastructure for waste management ▪ Zero contamination of clean water
P4 Marine Economy ▪ Clean seas ▪ Fish stocks restocked ▪ Extensive mariculture ▪ Preventing future pollution and exploitation
P5 Waste Economy ▪ Integrated waste economy ▪ Import waste – waste beneficiation is the ultimate value ▪ Public knowledge disclosed so we know what’s in the waste ▪ Take responsibility for our waste
P6 Residential Waste Management ▪ Privatised ▪ Revenue driven ▪ Treated at source ▪ Can be done inside every home to lesson the load on municipal waste
treatment systems ▪ Alleviate municipal waste management issues e.g. landfill sites
Bridging layer B1 Government Incentives to Recover Packaging
▪ Recycling initiatives ▪ Taxation of non-renewable packaging ▪ Special tax on retailers to cover the costs of recycling
B2 Savvy Society ▪ Public awareness campaigns ▪ Public understanding around all issues of waste ▪ Public understanding of sustainable living ▪ Public understanding of biotechnology
B3 Logistics ▪ Development of trains, trucks, boats etc. for algae transportation ▪ Transport goods and people
B4 Industry Awareness ▪ Monitoring and industry standards ▪ E-databases and knowledge sharing
B5 Waste Import Infrastructure ▪ All players communicate with each other and collaborate in an economic
fashion ▪ Transport of large amounts of waste via rail and sea
B6 Bio-plastics Policy and Government Intervention ▪ Policies to encourage bio-plastics use to address issues around bio-plastics, to
regulate profits from bio-plastics, safety and ethics issues B7 Polluter Pays Policies
▪ Government forces industry to clean-up and ensure that future-wastes of their products are managed
▪ Government coordinates whole life-cycle process analysis

16
▪ The regulatory process also evolves ▪ Provide an achievable target but move the goal post as they get there ▪ Improving industry-academia relationships and collaboration to respond to
policy and regulations B8 Shipping Regulations and Incentives
▪ International pressure on shipping standards for sustainable deep sea harvesting (fish stocks, pollution, etc)
▪ Strong government push for alternative technology ▪ Incentives to process waste at source
Technology / Skills layer T1 Bioreactor-Related Technology to Increase Productivity of Super Algae
▪ Develop better gas-liquid transfer ▪ Better application in the market – what is the look and feel of the reactor ▪ Non-plastic
T2 Mariculture ▪ Restocking of the seas in close collaboration with national parks, spawn
farms etc. ▪ International collaboration – country quota systems, any company can only
catch what it puts back (“fish credits”) ▪ Must be viable for those doing the restocking
T3 Aquaculture ▪ Similar to T2 ▪ Produces the end product ▪ Filters and waste management must be easier to integrate ▪ Scaling up to feed everyone – increase productivity etc.
T4 Education/Savvy Society ▪ Knowledge entities ▪ Knowledge bases ▪ Different school systems – short training, informal education ▪ Availability of non-jargon-based knowledge – universally accessible ▪ Consumer-centric focus (combating consumerism)
T5 Large Scale Desalination ▪ Infrastructure for delivery to off-site areas (e.g. access in the Karoo) ▪ Not just for waste management, also for agriculture
T6 Sophisticated ICT for Industry Awareness ▪ Establishing databases for knowledge sharing ▪ Capturing the existing data and levels of analysis ▪ Codifying knowledge
T7 Rain on Demand Development ▪ Technology that allows us to create rain sustainably
T8 1st Generation Bioplastics ▪ Innovations in plastics – bio and other ▪ Plastic-related bioreactors ▪ Algae and plants ▪ Polymers sensitive to specific wavelengths of light – break down under
certain wavelengths – easily degradable T9 Technology for Cleaner Air (Cleaner Production)
▪ Air-con systems inoculated with air-cleaning bugs ▪ Biofilms, biowalls and biofilters ▪ Catalytic converters, biofilms in exhaust pipes

17
T10 Technology to Process Waste at Source (on-board ships) ▪ Bioreactors to break down waste whilst at sea e.g. production of fuel that
feeds back into ship T11 Technology Suite
▪ Gives us an edge in Global Waste Management ▪ Culmination of a whole range of technologies as a result of various focussed
technology developments Research and development layer RD1 Producer Super Algae
▪ Modifying the algae ▪ Bioprospecting – finding new algae ▪ Smart, functionalised plastics
RD2 Processing ▪ Also modifying and bioprospecting ▪ Processing waste and harsh biologics ▪ Harvesting energy for breaking down hazardous substances ▪ Algal remediation
RD3 Plastics (including packaging) ▪ Packaging that is biodegradable ▪ Aids in soil fertilisation ▪ Simple bioreactor processes to break down plastics that aren’t completely
biodegradable ▪ Plants and bugs ▪ Smart, functionalised plastics
RD4 Unconventional Substrate Utilisation ▪ “Unconventional” – currently not mainstreamed and also non-optimal from
the bug point of view ▪ Growing micro-organisms on substrates that are not optimal for growth ▪ For both bioremediation and bio-production
RD5 Pure Research Collaboration ▪ Towards a common industrial goal ▪ Pure research is necessary for all of the above to happen ▪ New concepts that stimulate improvements in existing technology, processes
etc. RD6 Current Biodegradable Plastics
▪ 1st generation bioplastics ▪ Plastics from bio-oil
Link attributes P3 to P6 Continual development of technologies to improve clean water and
domestic waste management Phase out P3 and phase in P6
▪ Mindset change as society becomes more savvy B1 to P1 Providing incentives for the public and industry to reduce their waste.
▪ Money back on recycled goods ▪ Talk to trade unions ▪ Getting unemployed people to collect trash and sell the components
back to industry ▪ Tax incentives

18
▪ All plastics must be returnable – cash back ▪ Run anti-consumerism propaganda
B1 to P5 Government incentives to reduce non-beneficial wastes B2 to P1 To reduce waste the public must know how and why. Get buy-in.
▪ Bring in social scientists ▪ Look at past case studies on public education on HIV, hygiene,
biotechnology etc – what worked, what didn’t ▪ International benchmarks
B2 toP3 Establishing responsibility for people to contribute to cleaning their
water ▪ Public education drive on sanitation ▪ Public incentives to save water ▪ Subsidise UV units to allow household-level cleaning of water
B2 to P4 Explaining to people what options are available in terms of what they
can do to fix the problem e.g. not buying free range and supporting mariculture.
B2 to P5 For public buy-in to the waste economy they have to understand what
waste is beneficial ▪ To build ownership in the waste economy
B3 to P5 Mobilise waste collection and waste transport to processing plants B4 to P4 Synergistic links between unrelated industries and marine industries B4 to P5 Industry waste-awareness i.e. what materials are available for
beneficiation B5 to P5 Infrastructure, paperwork, policies, databases, networking structures etc.
that are necessary for the integrated waste economy to operate B6 to P1 Needs to be high-level facilitation of the transition to zero-waste
packaging ▪ Government regulation to force responsible manufacturing across the
board B7 to T9 Government incentives pushing R&D and industry collaboration to
develop new technologies, drive more research in the area and address industry requirements
B8 to P4 Government regulation on deep sea fishing as well as support for more
sustainable technologies and processes, e.g. mariculture T1 to P6 Technologies for residential water management
▪ Miniaturisation of domestics waste water management T1 to B2 Public understanding of good reactor management

19
▪ Includes cultural and social issues that need to be addressed e.g. there need to be surveys as to why people won’t want to use these technologies at home. These concerns must be addressed.
T1 to B4 Tell industry what’s possible in terms of the technology and industry to
articulate their needs T1 to T10 Algae specific reactor development for waste treatment at source with
specific focus on deep sea mariculture T2 to P4 Restocking the oceans
▪ Large scale collaboration with nature reserves ▪ Fish credits to the processing factories and restocking plants
(industrial ecology) T3 to B2 Public awareness of options available to treat waste water in-house T4 to B2 Using public awareness campaigns to educate people about the
technology underlying alternative technology production ▪ Changing consumer culture
T6 to B4 Industry knowledge of mariculture systems and waste streams
▪ Monitor and standards for waste ▪ Increase the pool of available resources for industrial processes
T8 to P1 Improvements in bio-plastics development
▪ Industry survey on what problems they have with plastics e.g. are they brittle, are they too expensive to produce, do they recycle badly?
▪ Collaboration between universities and industry to provide the applied research
o Undergraduate projects funded by government that are managed by industry
▪ Better and novel blends of plastics ▪ Packaging efficiency must be addressed ▪ Miniaturising products to reduce packaging ▪ Packaging with multiple purposes to minimise throwaways
T8 to B6 Communication and legalisation of bioplastics production
▪ Consumer buy-in/understanding – bioplastics T8 to RD4 Targeting unconventional substrates to make plastics
▪ Scoping what plastics exist and their problems ▪ Reverse engineering plastics to find a suitable substrate (preferably a
waste product) T9 to P2 Achievement of clean air T10 to P4 Deep sea mariculture
▪ Sustainable deep sea fishing ▪ Technologies highly refined for processing
20
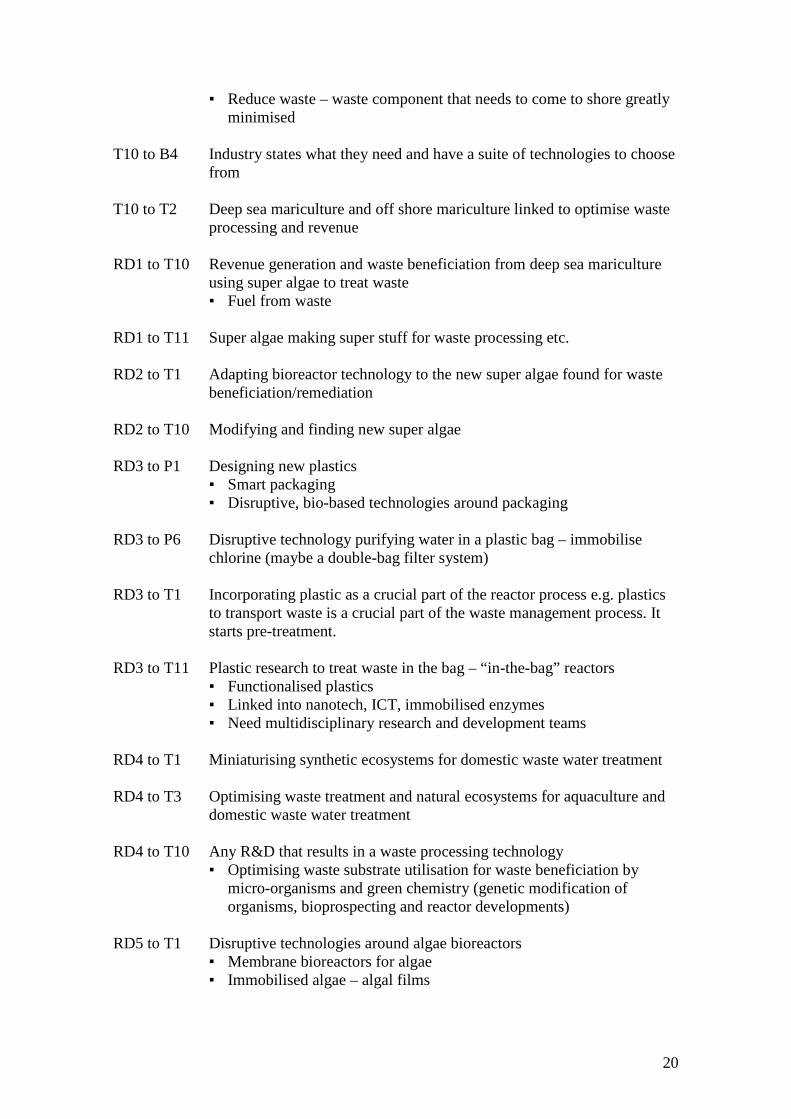
▪ Reduce waste – waste component that needs to come to shore greatly minimised
T10 to B4 Industry states what they need and have a suite of technologies to choose
from T10 to T2 Deep sea mariculture and off shore mariculture linked to optimise waste
processing and revenue RD1 to T10 Revenue generation and waste beneficiation from deep sea mariculture
using super algae to treat waste ▪ Fuel from waste
RD1 to T11 Super algae making super stuff for waste processing etc. RD2 to T1 Adapting bioreactor technology to the new super algae found for waste
beneficiation/remediation RD2 to T10 Modifying and finding new super algae RD3 to P1 Designing new plastics
▪ Smart packaging ▪ Disruptive, bio-based technologies around packaging
RD3 to P6 Disruptive technology purifying water in a plastic bag – immobilise
chlorine (maybe a double-bag filter system) RD3 to T1 Incorporating plastic as a crucial part of the reactor process e.g. plastics
to transport waste is a crucial part of the waste management process. It starts pre-treatment.
RD3 to T11 Plastic research to treat waste in the bag – “in-the-bag” reactors
▪ Functionalised plastics ▪ Linked into nanotech, ICT, immobilised enzymes ▪ Need multidisciplinary research and development teams
RD4 to T1 Miniaturising synthetic ecosystems for domestic waste water treatment RD4 to T3 Optimising waste treatment and natural ecosystems for aquaculture and
domestic waste water treatment RD4 to T10 Any R&D that results in a waste processing technology
▪ Optimising waste substrate utilisation for waste beneficiation by micro-organisms and green chemistry (genetic modification of organisms, bioprospecting and reactor developments)
RD5 to T1 Disruptive technologies around algae bioreactors
▪ Membrane bioreactors for algae ▪ Immobilised algae – algal films

21
RD5 to T10 Pure research for disruptive technologies on waste beneficiation e.g. reactor units on ships that minimise dumping back into the ocean (miniaturisation of fish waste bioreactors, miniaturisation of technology for home-waste recycling, ecology in a box)
RD6 to T8 Improvement in plastics production from R&D to implementation / production level ▪ Commercialisation of plastics research ▪ Scoping the patent landscape ▪ Improved productivity through engineering projects (engineering
students) Disruptive technologies ▪ Plastics from cow milk ▪ Functionalised plastics – “bugs” integrated into containers etc. to clean them of
“toxins” to allow reuse
4.2.2 Opportunities for SMMEs Bear in mind ▪ What can SMMEs do to facilitate zero waste? ▪ How can they fill gaps? ▪ What organisations don’t exist today but should exist to make certain things happen? ▪ Specify the kind of SMME, what they would do and how long? ▪ Look across the whole timeframe especially for the first 5 to 10 years. ▪ Link it to a node. ▪ SMMEs can assist significantly as bridging mechanisms. ▪ Don’t only think of the SMMEs that build things but also those that facilitate etc. Opportunities for SMMEs ▪ Standardised database establishment and knowledge management service provider ▪ Subscription based ▪ Integrated data system – collate different types of data from various sources ▪ Gathering data ▪ Process data ▪ Data management
▪ Public awareness on biotechnology ▪ SMME that engages at community level ▪ Run community education programmes
▪ Shipping engineering (boat building) ▪ Installations of on-boat bioreactors ▪ Industry-level R&D (tailoring solutions based on industry needs)
▪ Green architects/designers of homes that take cognisance of energy efficiency, waste management etc.
▪ Existing plastic producers – expansion of current product base ▪ Waste collectors (down to community level) ▪ Small-scale waste beneficiators

22
▪ Training – community level (skills transfer) up to technical level (human capital development) and skills-based learning
▪ Reactor development, installation and maintenance and training (industry level and household level)
▪ Production of the algae (farming) ▪ SMME support services – marketing, legal, financial, etc ▪ Packaging services ▪ Transport and distribution services ▪ Machinery and equipment ▪ Standards and quality assurance ▪ Development of monitoring systems e.g. biosensors, marine remote sensing,
specialised data loggers ▪ Technical/strategic/engineering consultants ▪ Rewards management company – waste credits/fish credits ▪ Landfill beneficiation (waste that can be recycled, reused etc. – extraction from
landfill sites) ▪ Franchisors ▪ Home-based bioreactors/in-house waste treatment etc. ▪ Plastics fertilised soil
▪ ICT infrastructure for waste measurement – analyse, determine amount of waste and give credits based on the amount (can link to central server that feeds into the e-database)
▪ Progressive waste management credit performance management system – household level, district level, city level, provincial level (each level competes, can build in incentives for biggest savers)
▪ Plastics SMMEs ▪ Collection of plastics ▪ Manage plastics credits ▪ Recyclers ▪ Breakdown of plastics using appropriate wavelength technology ▪ KIBS – tight network to focus on the technology development and reduce barriers
to entry ▪ Reactor development to reduce production costs ▪ Public awareness to increase demand for new plastics ▪ Training - biotechnology into the plastics industry
Organisations that need to exist ▪ Lobbyists – government to put in place incentives, regulations ▪ Cape Water – treat water in a biotech-intensive manner and outsource to SMMEs ▪ Intermediary mechanisms to get triple helix collaboration established e.g. Science
and Technology Parks and Science Centres and Technology Transfer offices ▪ Contract researchers – ICT people with biotechnology knowledge ▪ Central data repository

23
4.2.3 Action Plans Assumptions: ▪ We do get the funding that is needed (from more than one source) ▪ First 2 to 2½ years Action Resources Funding
Source Timeframe
1 Construct the knowledge bank and relevant ICT infrastructure
Knowledge management companies
IDC, government, interested industry players, WESGRO
0-6 months
2 Consultative and Planning Workshops between Industry and Academia – Algae technology platforms and technologies
CBT and other BRICS, Industry, Convergence Centre
CBT and other BRICS, DST, Energy agencies, manufacturing industry (plastics), nutraceuticals industry
0-24 months
3 Influence government policy on waste (plastics, etc), water, marine, biotechnology, nature conservation and community interaction
NGOs, BRICS, BIOSA, industry, trade unions
UNICEF, WHO 0-24 months
4 Public awareness and education drives
PUB, SAASTA, DST, BRICS, biotechnologists in the field, newspapers, Bio2Biz, industry
PUB, DST, industry partners
0-24months
5 Marketing drive New Scientist, Popular Mechanics, link in to IBSA, BioSA, industry
Government and industry and WESGRO
0-24 months
6 Western Cape – start dialogue and build network of relevant people related to waste management
CBT, Municipality, Convergence Centre
BRICS, provincial government, industry
0-8 months
7 Small scale community projects related to development of fish ponds, mariculture etc. for proof of concept ▪ Identify community needs ▪ Skills and knowledge
transfer ▪ Construction ▪ Implementation and Exit
Strategy ▪ Refinement ▪ Feedback ▪ Monitoring
DEAT, National Parks Board, NGOs, DWAF, universities
Government and industry (I&J, etc.), IDT, IDC, UNDP, sustainable fisheries organisations, AGRA
▪ 0-6 months ▪ 3-9 months,
ongoing ▪ 3-12 months ▪ 6-24 months ▪ 12-24 months ▪ 24-36 months ▪ ongoing
8 Industry engagement on areas requiring biotechnology solutions e.g. packaging, recycling, functional plastics, reactor development or production innovation, etc.
University, industry e.g. Pick n Pay and Woolworths, BRICS, Convergence Centre, government
Industry, government
0-6 months

24
Action Resources Funding Source
Timeframe
9 Generation of new products collaboratively ▪ incremental improvements ▪ undergrad projects ▪ post grad projects ▪ proof of concept
University, industry e.g. Pick n Pay and Woolworths, BRICS, Convergence Centre, government
Industry, government, BRICS, Innovation Fund
3-24 months
10 Commercialise new IP BRIC, DTI, Technology Transfer Offices, Convergence Centre, Incubator, DST
Innovation Fund
Ongoing
11 Roll-out of projects (pilot or full scale)
Industry and universities
Industry, VCs, The Innovation Fund
36 months onward
12 Targeted networking events ▪ Opportunities for SMMEs ▪ University-Industry
Collaboration ▪ Etc.
All interested and affected parties, BioSA
BRICS, BioSA, industry, government
ongoing
TIA when established will assist in addressing matters of network building and funding.

25
4.3 Group 2: Alternative Energy from Plants
4.3.1 Building the TRM Futures wheel for Alternative Energy from Plants

26
Categorisation and Prioritisation Table for Alternative Energy from Plants
PURPOSE BRIDGING TECHNOLOGY R&D Enhanced foods ▪ Food in a pill ▪ Tailored nutrition pill ▪ GM enhanced flavours/aromas ▪ Increased shelf life Environmentally optimised crops ▪ Speed up the life cycle of plants ▪ GM and organic agric ▪ Drought resistant and disease tolerant crops ▪ Enhanced photosynthesis and nutrient
absorption ▪ Plant based plastics ▪ Lesser space plants Economic and environmental advantages ▪ Produce vaccines etc. using plants to
develop – plant based factories ▪ Use of plants for waste removal ▪ Replace animal products with plant
products – e.g. meat tasting plants ▪ Plants that can produce solar power ▪ Trees that grow into defined shapes Waste management and bioremediation ▪ Use plant to clean up waste areas and clean
up toxic environments, e.g. dumps ▪ Biofuels from waste food products Conservation of biodiversity ▪ Non-invasive GM plants including natural
plant repellent, herbicides biopesticides Plants that grow in water/the sea - plant fields in the sea and desalination Alternative energies from plants which can then be used to generate electricity
Soil probiotics Mood enhancing plants and antidepressants
Activator compound or supplement Plant based pharma factories (pharmaceutically enhanced foods) Toxic waste absorber Genetic enhancement – Enhanced photosynthesis and nutrient absorption ▪ Changing the toxicity of
plants Chamera lab Plant based factories Plant based plastics that are biodegradable – biomaterials. Desalinators Alternate energy sources Alternative energies Document genomes
Chamera lab Bioprospecting of plants ▪ Plant based
therapies

27
Final TRM for Alternative Energy from Plants
TRM Key Purpose layer The purposes identified are broad and therefore, there will be other resulting sub-purposes. The priority areas identified are: ▪ Enhanced foods and optimised crops ▪ R&D – should be a combination of conventional and sophisticated technology.
▪ Plants that grow in water – aquatic crop farming P1 Alternative energies from plants – whether GM or non-GM. This means
harnessing the energy from existing plants and directing it for energy production/generation. Solar panels from plant energy.
P2 Desalination

28
Bridging layer B1 National initiative (but not a CoC, platform or new centre), getting a consortium
of stakeholders from the private and public sectors, to which consortium members can apply for funding. Stage gate funding is a limiting factor.
B2 Living labs, funding, human resource capacity B3 Demand for the product – currently, the interest is a result of energy problems B4 Marketing and public awareness B5 Industrial energy production which is then reduced to household provision.
Plants would need to be in regions that have plenty of light and space B6 Regulatory and IP protection issues B7 Seawater is channelled through a grove of plants. The plants extract the salt and
other impurities and release condensed water that is pure B8 Localised/individual electricity generation and possible supply B9 Cross-functional teams (physics, biology, engineering, botany etc.) Technology layer T1 Developing and optimising energy producing plants
▪ Identify plants that produce high energy T2 Mass plant production
▪ Look at hydroponic plant production ▪ Could have wind and solar combination technology ▪ Plants grown in smaller spaces which release a greater quantity of the energy
source which is released in a gaseous form ▪ Adapting the plant to extreme growth conditions
T3 Plant that continually grows and through physical pressure, generates energy ▪ Using plants to store and produce energy – the plant stores and continually
produces energy much like how humans eat and store food which is consumed later (2020)
▪ A bio-sensor that acts as a transducer to convert energy in plants into usable energy e.g. electricity
T5 Pilot plant T6 Infrastructure and equipment e.g. monitoring and plant diagnostics – these are
all new technologies that are needed to grow, monitor, harvest and harness the energy
T7 Household application T8 Industrial application R&D layer RD1 Identify plants that produce high energy, plants that can grow in alternative
conditions RD2 Energy conversion efficiency, engineering to harness the energy RD3 ICT – database mining RD5 Trait identification e.g. Plant that continually grows and through physical
pressure generates energy RD6 Massively parallel screening process RD7 Validation of process
29
4.3.2 Opportunities for SMMEs ▪ Professional services – legal, accounting, HR, marketing, ICT, ‘bricks and mortar’
facilities, advertising, consultant ▪ Technical services for testing, analysis, monitoring etc. ▪ Small-scale plant breeders for test and full production ▪ Laboratory and business supplies, producers and sellers of diagnostic equipment and
kits ▪ Production and selling of bio-sensors ▪ Bio-informatics: tools, platform, IP relating to stored information ▪ Seed companies for mass propagation ▪ Own/contracted manufacturing and testing facilities ▪ Companies with novel distribution technology ▪ Artisans e.g. electricians, fitters, maintenance ▪ EGC – Electric Gardening Company ▪ Skills development and training companies e.g. apprentice type or technical schools ▪ Services that are ready to support the new technology ▪ Energy brokers ▪ Create a platform that can provide a service to industry, other academic groups and
researchers ▪ Capacity to link up and interface with other forms of electricity generation ▪ Waste collectors that transport to biofuel facilities ▪ Sell energy or technology to other provinces ▪ Business incubator focused in this sector ▪ Future innovators and the attraction of new businesses Advantages ▪ Plants are green, less negative effect on the environment, plants can be regenerated
=> self repair, responsible environmental conservation ▪ Technology would be available sooner ▪ Bionics would be the next stage ▪ Strive for cheaper energy production Why the Western Cape? ▪ Has a lot of sunshine ▪ Low population density ▪ Good skills base ▪ Huge biodiversity to source from ▪ Good local skills in the energy sector ▪ ICGB is in the province
4.3.3 Action Plans TRM Action Plan ▪ Need a champion ▪ Identify information databases of research that has been done previously ▪ Establish a small group that conducts desk-top research ▪ Draft project proposal for DST and DME ▪ Assemble a research team

30
▪ Stakeholder engagement ▪ Establish a multi-disciplinary collaborative group and issue a call for proposals ▪ Develop funding plan and raise funding ▪ Manage IP throughout the process ▪ Scale-up screening of plants ▪ Trait engineering and harnessing energy ▪ Establish project management SMME Action Plan ▪ Map out the research stakeholders ▪ Plant breeders who will assist with establishing test facilities ▪ Expert consultants to conduct a feasibility study ▪ Access professional services e.g. marketing, legal, accounting Identify SMMEs that are critical in the research process in areas that the public sector is not able.

31
Annex 1: Details of Participants
Name Organisation Contact No Email address
Malcom Collins MRC/UCT Research Unit for Exercise Science and Sports Medicine (ESSM)
082 377 7833 [email protected]
Ella Ng Jata Industrial Food Engineer +230 729 6186 [email protected]
Vicky Longshaw Von Seidels 021 526 2801 [email protected]
Fernando Martinez Softlech 082 520 4424 [email protected]
Timothy Newman Cape Biotech Trust 083 874 0977 [email protected]
Mel Ng Knowledge Crucible [email protected]
Viresh Ramburan Stellenbosch University 084 408 6067 [email protected]
Louisa Segooa Dept. of Science & Tech 012 843 6855 [email protected]
Daniel Theron Cape Biotech Trust 083 294 8144 [email protected]
Fred Van der post Cape Biotech Trust [email protected]
Bernelle Verster Marah Mas Industrial Biotech, UCT, BERU
083 545 4993 [email protected]
COFISA
Bob Day Non-Zero-Sum 082 458 9119 [email protected]
Sibongile Gumbi Smart Innovation 083 630 7097 [email protected]
David Lefutso Kayamandi Informatics 082 863 7866 [email protected]
Nirvashnee Seetal COFISA 079 511 7565 [email protected]
Thembinkosi Semwayo Knowledge Crucible 076 103 1399 [email protected]

32
Annex 2: Workshop Programme
A Biotechnology Foresight exercise for the Western Cape
Second Workshop Agenda
Held on Wednesday & Thursday, 25 & 26 February 2009 at the Laguna Beach Hotel, Milnerton.
Day 1
09h00 Welcome & self-introductions 09h30 In plenary
▪ Brief overview of COFISA ▪ Review of Biotechnology Foresight Process to date ▪ Explanation of process to be followed (Agenda) ▪ Introduction to Technology Road-Mapping (TRM)
10h45 Tea
11h00 In plenary ▪ Review and characterisation of biotechnology opportunities identified in
1st workshop (for 2030!) ▪ Selection of TRM working groups (based on expertise and chosen
opportunities) 12h00 In working groups
▪ Create Futures Wheel (FW) for chosen Opportunity
13h00 Lunch
14h00 In working groups ▪ Re-categorise FW outputs as nodes under four TRM headers (table) ▪ Prioritise (based on solutions-pull, not technology push), & populate
TRM at 2030 ▪ Work back along TRM rows adding missing nodes
15h30 Tea
15h45 In working groups ▪ Work back along TRM rows adding links between nodes
19h00 Networking supper

33
Day 2
09h00 Welcome & Review of Process
09h10 In working groups ▪ Identify criteria/attributes of all nodes and links of TRM ▪ Summarise TRM for report-back
10h00 In plenary ▪ Groups report back on TRMs ▪ Presentation and discussion: “SMME opportunities, promotion, etc
related to TRMs”
11h00 Tea
11h15 In working groups ▪ Identify opportunities for SMMEs for each node, link, criterion and
attribute of TRM
13h00 Lunch
14h00 In working groups ▪ Develop action plans to “kick-start” SMME & TRM opportunities
15h15 Tea
15h45 In plenary ▪ Report back on SMME opportunities and wrap up discussion.
16h00 Thank you and close